Miocene Subsidence and Surface Uplift of Southernmost Tibet Induced by Indian Subduction Dynamics
←
→
Page content transcription
If your browser does not render page correctly, please read the page content below
Miocene Subsidence and Surface Uplift of Southernmost
       Tibet Induced by Indian Subduction Dynamics
       T. Shen, Gang Wang, A. Replumaz, L. Husson, A. Webb, M. Bernet, P.
                            Leloup, P. Zhang, G. Mahéo, K. Zhang

     To cite this version:
    T. Shen, Gang Wang, A. Replumaz, L. Husson, A. Webb, et al.. Miocene Subsidence and Surface Uplift
    of Southernmost Tibet Induced by Indian Subduction Dynamics. Geochemistry, Geophysics, Geosys-
    tems, AGU and the Geochemical Society, 2020, 21 (10), �10.1029/2020GC009078�. �hal-02999040�

                                 HAL Id: hal-02999040
                https://hal.archives-ouvertes.fr/hal-02999040
                                     Submitted on 7 Jan 2022

    HAL is a multi-disciplinary open access            L’archive ouverte pluridisciplinaire HAL, est
archive for the deposit and dissemination of sci- destinée au dépôt et à la diffusion de documents
entific research documents, whether they are pub- scientifiques de niveau recherche, publiés ou non,
lished or not. The documents may come from émanant des établissements d’enseignement et de
teaching and research institutions in France or recherche français ou étrangers, des laboratoires
abroad, or from public or private research centers. publics ou privés.
                                              Copyright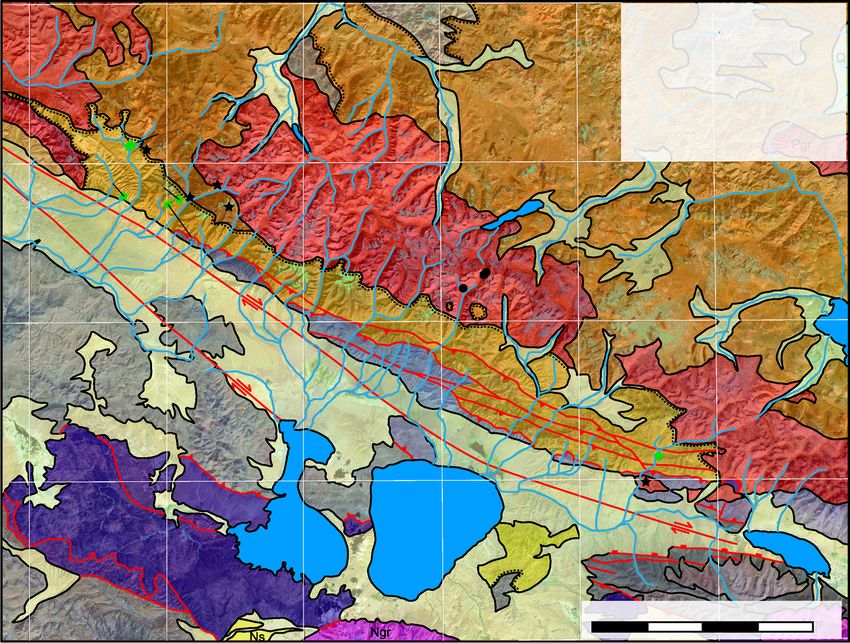
RESEARCH ARTICLE                          Miocene Subsidence and Surface Uplift of Southernmost
10.1029/2020GC009078
                                          Tibet Induced by Indian Subduction Dynamics
Key Points:
• Gangdese batholith experienced
                                          T. Shen1 , G. Wang1 , A. Replumaz2 , L. Husson2                       , A. A. G. Webb3        , M. Bernet2,
  reheating between ~28 and 20 Ma,        P. H. Leloup4 , P. Zhang1, G. Mahéo4, and K. Zhang5
  followed by rapid cooling between
                                          1
  20–17 Ma at a rate of ~50 °C/Myr         School of Earth Sciences, Center for Global Tectonics, and State Key Laboratory of Geological Processes and Mineral
• The northward migration of the          Resources, China University of Geosciences, Wuhan, China, 2Institut des Sciences de la Terre, Université Grenoble Alpes,
  Indian continent created a wave of      CNRS, Grenoble, France, 3Division of Earth and Planetary Science and Laboratory for Space Research, University of Hong
  dynamic topography that caused the
  successive subsidence and uplift
                                          Kong, Hong Kong, 4Laboratoire de Géologie de Lyon, CNRS UMR 5570, Université de Lyon 1, Villeurbanne, France,
                                          5
• The Kailas basin is a unique             School of Earth Sciences and State Key Laboratory of Biogeology and Environmental Geology, China University of
  occurrence of a perched basin that      Geosciences, Wuhan, China
  owes its existence to dynamic
  deflection within a mountain belt
                                          Abstract The Indus‐Yarlung suture of southernmost Tibet marks the initial collisional zone, the ongoing
Supporting Information:                   India‐Asia collision, and yet more than ~30 million years after the onset of collision, a thick detrital
• Supporting Information S1
• Supporting Information S2               sedimentary unit was deposited just north of the suture: the Kailas Formation. The mechanism permitting
• Text S1                                 subsidence of the deep intracontinental Kailas basin in a compressional tectonic regime remains uncertain.
• Table S1                                We present new apatite (16–11 Ma) and zircon (24–19 Ma) fission track (AFT and ZFT) ages from the
                                          Gangdese batholith just north of the Kailas basin. ZFT analysis of modern‐river sand from the northern
                                          Gangdese magmatic arc indicates an exhumation at 27.3 ± 1.3 Ma. Thermal modeling indicates that the
Correspondence to:
T. Shen,                                  batholith experienced reheating between 28 and 20 Ma, coeval with deposition in the Kailas basin (between
shenty@cug.edu.cn                         26 and 21 Ma), followed by overall rapid cooling between 20 and 17 Ma. We interpret this thermal history as a
                                          phase of regional Oligocene‐Miocene sedimentary burial followed by exhumation. By modeling mantle
Citation:                                 dynamics in the geodynamic framework of the India‐Asia collision, we show that transient dynamic
Shen, T., Wang, G., Replumaz, A.,         topography over the relative southward folding of the Indian slab is consistent with burial and exhumation of
Husson, L., Webb, A. A. G., Bernet, M.,   the Gangdese magmatic arc during Oligocene‐Miocene time. The northward migration of the Indian
et al. (2020). Miocene subsidence and
surface uplift of southernmost Tibet      continent relative to its own stati onary slab created a wave of dynamic topography that caused subsidence in
induced by Indian subduction              the overriding plate north of the Himalaya, followed by a phase of surface uplift since ~27 Ma of the northern
dynamics. Geochemistry, Geophysics,       Gangdese magmatic arc. During latest Oligocene‐early Miocene time, the dynamic deflection center was
Geosystems, 21, e2020GC009078.
https://doi.org/10.1029/2020GC009078      in the Kailas area, and it progressively relocated southward to its present position at the Ganges basin.

Received 6 APR 2020
Accepted 10 SEP 2020
Accepted article online 22 SEP 2020
                                          1. Introduction
                                          The continent‐continent collision between the Indian and Eurasian plates, following the northward move-
                                          ment of the Indian plate since the early Cenozoic, formed the Tibetan Plateau (DeCelles et al., 2014;
                                          Dewey, 1988; Hu et al., 2016; Najman et al., 2010). The orogenic deformation front has migrated both north-
                                          ward and southward from the initial collision zone at the Yarlung‐Tsangpo suture zone (Kapp &
                                          DeCelles, 2019; Replumaz & Tapponnier, 2003; Tapponnier et al., 2001; Yin, 2010). In the center of this large
                                          Cenozoic continental collision zone, thick conglomerate layers were deposited during the Oligocene to
                                          Miocene and are exposed along strike to the north of the Indus‐Yarlung suture zone with an east‐west exten-
                                          sion of more than 1,000 km but with a north‐south width of less than 10 km (Heim & Gansser, 1939; Yin
                                          et al., 1999). These rocks have been referred to as the Kailas Formation, named after the most famous holy
                                          mountain in Tibet, Mt. Kailas (Cheng & Xu, 1986), which is located in western Tibet and is composed of sub-
                                          horizontal conglomerates (e.g., DeCelles et al., 2011; Lacassin et al., 2004). The sediments of the current
                                          6,566‐m‐high peak have been buried to a depth of ~4–7 km during the early Miocene and have experienced
                                          significant exhumation at 17 Ma (Carrapa et al., 2014). In other places, the Kailas Formation experienced
                                          variable rates of accumulation, burial, exhumation, and deformation (Leary et al., 2016; Sanchez et al., 2013;
                                          Yin et al., 1999). Therefore, it could provide critical information for understanding the processes of
                                          India‐Asian continental collision during the Cenozoic. However, the tectonic context of the conglomerates
©2020. American Geophysical Union.        is still debated, with points of view including a foreland basin related to the southward thrusting Gangdese
All Rights Reserved.                      Thrust (GT) (Yin et al., 1999), a flexural basin associated with the termination or renewal of India‐Asia

SHEN ET AL.                                                                                                                                               1 of 21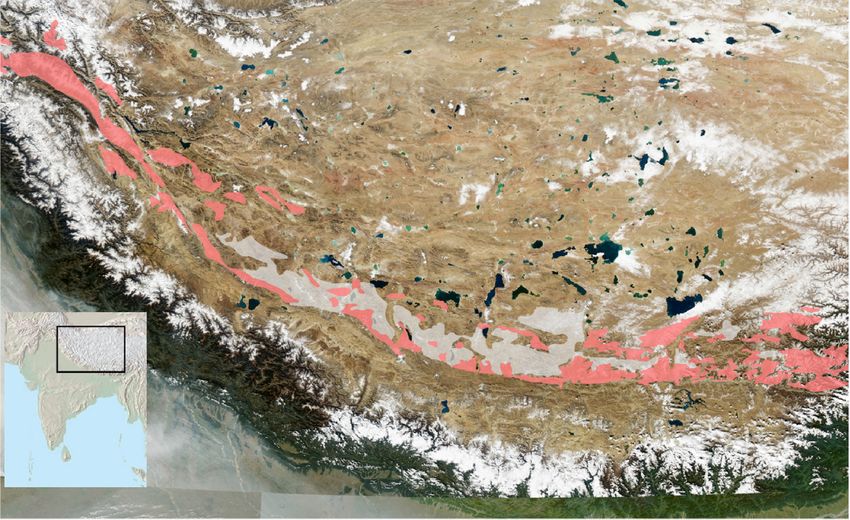
Geochemistry, Geophysics, Geosystems                                                  10.1029/2020GC009078

                 collision (Aitchison et al., 2007; Wang et al., 2015), and an extensional basin due to Indian slab rollback
                 (DeCelles et al., 2011; Leary, DeCelles, et al., 2016). The successive burial and exhumation processes in
                 the early Miocene have highlighted significant uncertainty regarding the surface geological evolution and
                 mantle dynamics in the collision zone since the Oligocene (e.g., DeCelles et al., 2011; Husson et al., 2014;
                 Leary, DeCelles, et al., 2016; Replumaz et al., 2010; Webb et al., 2017), which has renewed interest in the
                 study of the geodynamics and mechanisms of the collision.
                 Disturbances in the subduction zone alter mantle flow, which in turn vertically deflects the surface of
                 the Earth, thereby providing a simple mechanism to explain the formation of deep intracontinental
                 basins (Husson et al., 2014; Webb et al., 2017). This process is commonly referred to as dynamic topography:
                 viscously flowing mantle imposes vertical stresses underneath the lithosphere, and these stresses are
                 counterbalanced by a dynamic deflection of the surface of the Earth (Husson et al., 2012). In regions
                 where the structure of the mantle quickly evolves (typically subduction zones), transient dynamic topo-
                 graphy is expected to respond efficiently and to be detectable in the geological record. Several theoretical
                 (e.g., Gurnis & Zhong, 1991; Husson et al., 2012) and case studies (e.g., Husson, 2006) point to kilometer‐scale
                 dynamic deflections in the topography above subduction zones. Such deflections are commonly transient,
                 and the fast‐changing Indian subduction dynamics are no exception. The northward motion of the Indian
                 plate relative to its own slab (e.g., Replumaz et al., 2010; van der Voo et al., 1999) has been shown to be accom-
                 panied by a migration of the deflection above the mass anomaly in the mantle (Husson et al., 2014). At the
                 surface, this process manifests as a southward migrating wave of subsidence followed by a southward
                 migrating wave of uplift, already studied from the Himalaya toward the Ganges basin. These short‐lived
                 episodes explain both the Miocene surface uplift of the Himalaya and subsidence in the Ganges basin
                 (Husson et al., 2014; Webb et al., 2017), as well as the formation of sedimentary basins on the NW Indian plate
                 (Najman et al., 2018). This model offers a simple, single mechanism that explains a range of first‐order obser-
                 vations. Thus, this interpretation represents an alternative to a more complex combination of processes invol-
                 ving removal of the mantle lithosphere (Harrison et al., 1992; Molnar et al., 1993), elastic flexure of the
                 lithosphere (Lyon‐Caen & Molnar, 1983), and extension triggered by slab rollback (DeCelles et al., 2011;
                 Leary, DeCelles, et al., 2016).
                 In this paper, we further test the dynamic topography model by exploring whether the predicted southward
                 migrating waves of subsidence and uplift are recorded to the north of the Himalaya range and in southern
                 Tibet. We revisit the spatial extent of the burial and exhumation experienced by the Kailas Formation and
                 underlying rocks by reporting new in situ zircon fission track (ZFT) and apatite fission track (AFT) data
                 and thermal modeling for the Gangdese batholith immediately to the north of the main preserved body of
                 Kailas Formation rocks in the Mt. Kailas region in western Tibet. We focus on the succession of subsidence
                 and exhumation and use numerical simulations to show that transient dynamic topography in response to
                 mantle loading and unloading successfully reconciles structural, sedimentological, and thermochronologi-
                 cal data in southern Tibet.

                 2. Geological Settings
                 2.1. Regional Geology
                 The Indus‐Yarlung suture zone represents the site of the India‐Asia continent‐continent collision that began
                 at circa 60 Ma (e.g., DeCelles et al., 2014; Hu et al., 2016; Najman et al., 2010) and separates the Lhasa terrane
                 to the north and the Tethyan Himalaya to the south (Yin & Harrison, 2000). Late Jurassic and early
                 Cretaceous volcano‐sedimentary rocks are widely distributed to the north of the suture zone in the Lhasa ter-
                 rane and are related to the northward subduction of the Neo‐Tethys oceanic lithosphere (Zhu et al., 2011).
                 The Gangdese magmatic arc is located along the southern margin of the Lhasa terrane (Figure 1) and is
                 related to the end of oceanic subduction and removal of the slab at the onset of collision (e.g., Mahéo
                 et al., 2002, 2009). This arc consists of the Linzizong volcanic rocks (with crystallization ages between ~65
                 and 45 Ma), the coeval Gangdese batholith (with crystallization ages between ~60 and 40 Ma) (Harrison
                 et al., 2000; Mo et al., 2008, and references therein), and calc‐alkaline and potassic‐ultrapotassic volcanic rocks
                 that formed in an Oligocene‐Miocene stage (Chung et al., 2005). Some studies interpreted the last group of
                 rocks as the products of a second slab breakoff, of the Indian lithosphere slab (e.g., Mahéo et al., 2002, 2009).
                 Given the ages of the magmatic and volcanic rocks—K‐Ar age of lamprophyres from the Karakorum range,

SHEN ET AL.                                                                                                                 2 of 21
Geochemistry, Geophysics, Geosystems 10.1029/2020GC009078
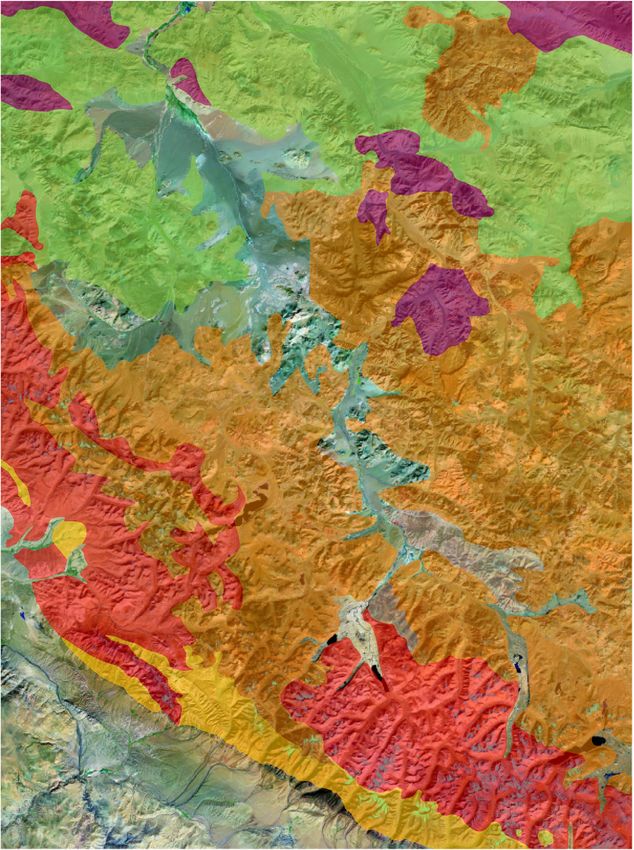
Figure 1. Schematic structural framework of southern Tibet and the Himalaya. Age data of magmatism are from the
Tibetan Magmatism Database (https://www.jaychapman.org/tibet‐magmatism‐database.html) by Chapman and
Kapp (2017), with contours from Goussin et al. (2020). Thermochronological data are cited from (1) Kirstein et al. (2006);
(2) Carrapa et al. (2014); (3) Tremblay et al. (2015); (4) Li, Kohn, et al. (2015); (5) Li, Tian, et al. (2015); (6) Shen
et al. (2016). The yellow box indicates the location of Figure 2, and the green box indicates the location of Figure 5.
JRS = Jinsha suture; BNS = Banggong‐Nujiang suture; IYS = Indus‐Yarlung suture; GCT = Great Counter Thrust;
KF = Kunlun Fault; KKF = Karakorum Fault; STF = South Tibetan Fault; MCT = Main Central Thrust; MBT = Main
Boundary Thrust; MFT = Main Front Thrust; GM = Gurla Mandhata.
NE Pakistan (Rex et al., 1988); U‐Pb and 40Ar/39Ar ages of adakitic volcanic rocks in western Tibet (Gourbet
et al., 2017; Kapp et al., 2003; Miller et al., 1999; Williams et al., 2004); and the U‐Pb age of an adakite in eastern
Tibet (Zhang et al., 2014; Figure 1)—breakoff is thought to have initiated at ~25 Ma at the western and eastern
ends of the slab (e.g., Husson et al., 2014; Replumaz et al., 2010; Webb et al., 2017).
The exhumation history of the Gangdese batholith has been highly debated over the past 20 years. In the
eastern part of the batholith, near the city of Lhasa, 40Ar/39Ar thermochronological analyses have shown
that the Gangdese batholith locally experienced two cooling stages, at 30–25 and 20–15 Ma (Harrison
et al., 2000; Yin et al., 1999). They have been interpreted as due to upper crustal thickening, in between
the southward thrusting along the GT (30–25 Ma) and northward thrusting along the Great Counter
Thrust (GCT) (20–15 Ma), two major thrust faults described south of the Kailas Formation (Burg et al., 1987;
Heim & Gansser, 1939; Kapp et al., 2007; Ratschbacher et al., 1994; Yin et al., 1994, 1999). The north dipping
GT is mainly exposed along the eastern part of the Indus‐Yarlung suture zone (between the Zedong and
Xigaze) and was active during the Oligocene (Yin et al., 1994, 1999). The south dipping GCT was active dur-
ing 19–16 Ma (Harrison et al., 2000; Laskowski et al., 2017; Yin et al., 1999) and juxtaposed rocks associated
with the Tethyan Himalaya, Gangdese forearc basin, and accretionary wedge atop the Gangdese magmatic
arc and Kailas Formation (Murphy & Yin, 2003; Yin et al., 1999). Low‐temperature thermochronological
analyses (fission track and [U‐Th]/He) detected the second stage of cooling, which has been explained via
a diverse range of interpretations, such as movement along the GT (Copeland et al., 1995), surface uplift
(Carrapa et al., 2014; Tremblay et al., 2015), and north dipping duplex development beneath the Gangdese
magmatic arc (Laskowski et al., 2018).
In western Tibet, the dextral Karakorum strike‐slip fault has been shown to be a transpressive flower struc-
ture, producing thrusting in the south of the Kailas basin. The fault is connected to arc‐perpendicular normal
faults, such as the Xiao Gurla and Gurla Mandhata faults that have formed since ~15 to 9 Ma (e.g., Carrapa
SHEN ET AL. 3 of 21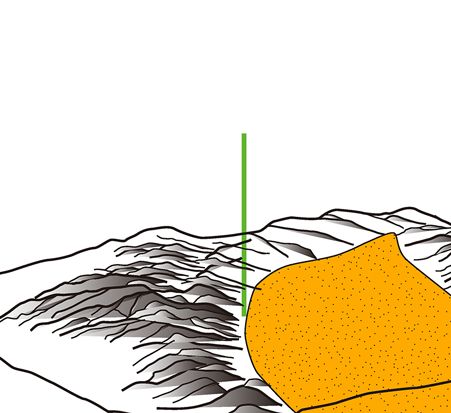
Geochemistry, Geophysics, Geosystems                                                 10.1029/2020GC009078

                 et al., 2014; Chevalier et al., 2005; Lacassin et al., 2004; Murphy & Yin, 2003; Pullen et al., 2011; Shen
                 et al., 2016; Valli et al., 2007) (Figure 1). Along the southern front of the Himalaya, sole thrusts are propagat-
                 ing toward the foreland, forming an orogenic wedge, and include duplex systems associated with the Main
                 Central Thrust (MCT, active during the early Miocene), the Main Boundary Thrust (MBT, active during the
                 late Miocene), and the Main Frontal Thrust (MFT, active during the Quaternary) (e.g., Coutand et al., 2014;
                 Kohn et al., 2001; Figure 1).

                 2.2. Oligocene‐Miocene Sedimentary Rocks Deposition Along the Gangdese Magmatic Arc
                 Deposition of the Kailas Formation to the south of the magmatic arc occurred earlier in the west
                 (near the Kailas peak) between 26 and 21 Ma, between 25 and 22 Ma near Xigaze, and later eastward
                 (near Zedong‐Lhasa), between 23 and 18 Ma (Ai et al., 2019; DeCelles et al., 2011, 2018; Leary, DeCelles,
                 et al., 2016). Detailed sedimentary analysis suggests that the formation in the Mt. Kailas area consists of a
                 lower coarse‐grained proximal conglomerate, a more distal fluvial sandstone member, a lacustrine shale
                 and sandstone member, and an upper redbed clastic member (DeCelles et al., 2011). Most of the sediments
                 were derived from the Gangdese magmatic arc to the north, with the exception of the uppermost redbed
                 member (DeCelles et al., 2011; Leary, DeCelles, et al., 2016). Previous study suggested that the Kailas basin
                 was never more than 20 km wide (DeCelles et al., 2011). However, several isolated outcrops of the formation
                 are observed overlying the Gangdese batholith to the north of the present‐day northern basin boundary
                 (Figure 2), indicating that the Kailas Formation extended farther north than previously thought
                 (Shen et al., 2019). The layers near the Mt. Kailas area are nearly horizontal, and the thickness of exposed stra-
                 tigraphy is over 1,500 m (Ai et al., 2019; DeCelles et al., 2011; Shen et al., 2019). AFT and zircon (U‐Th)/He
                 ages from the Kailas Formation at the depth of ~1,000 m in the stratigraphic column near the Kailas peak are
                 younger than the depositional age and require between 4 and 7 km of burial followed by rapid cooling and
                 exhumation starting at 17 ± 1 Ma with a cooling rate of ~50°C/Myr (Carrapa et al., 2014). The movement
                 along the GCT deformed the southernmost fringe of the Kailas Formation (Yin et al., 1999). However, the
                 subhorizontal stratigraphy of Mt. Kailas in the northern part of the basin also implies that crustal shortening
                 and deformation have not affected the whole basin (e.g., DeCelles et al., 2011; Lacassin et al., 2004). Further
                 east in the Xigaze area, the Kailas Formation is ~1,000 m thick (Leary, DeCelles, et al., 2016), and a thermo-
                 chronologic study also suggests burial between 4 and 7 km after the deposition according to a granite sample
                 beneath ~900 m thick Kailas Formation (Ge et al., 2018).
                 South of the Indus‐Yarlung suture zone, in the central part of southern Tibet, deposition continued to the early
                 Miocene with the Liuqu Formation exposed near Xigaze (Leary, DeCelles, et al., 2016; Li, Tian, et al., 2015)
                 (Figure 1). Leary, Orme, et al. (2016) suggested the Liuqu Formation represented a wedge‐top basin of the
                 northward thrusting of the GCT during or immediately after Indian slab breakoff, as contractional deforma-
                 tion resumed in the suture zone. However, clumped isotope thermometry of the Liuqu Formation revealed
                 that it was buried between 2.9 and 3.3 km (Ning et al., 2019), followed by rapid exhumation between 12 and
                 10 Ma (Li, Tian, et al., 2015), indicating similar subsidence and uplift processes as for the Kailas Formation.
                 Oligocene‐Miocene deposition to the north of the Gangdese magmatic arc has been little discussed so far. The
                 Rigongla Formation (Figure 1), with alluvial fan, fluvial‐channel, and lacustrine facies, outcrops discontinu-
                 ously at several locations within the central Lhasa terrane between Shiquanhe and Xigaze (Bai et al., 2018;
                 Currie et al., 2016; Gourbet et al., 2017; Kapp et al., 2003; Wang et al., 2014; Wu, 1979; Zhang, Ducea,
                 et al., 2014; Zhao et al., 2011; Zhu et al., 2006). The Rigongla Formation consists overall of an over 500‐m‐
                 thick fining‐upward sequence of conglomerates, sandstones, and mudstones derived from the surrounding
                 Cretaceous volcanic rocks (interbedded dacite to andesite) (Currie et al., 2016). Dacites in the lower
                 Rigongla Formation yielded a K‐Ar age of 31.4 Ma (Wang et al., 2014; Zhao et al., 2011), providing a maxi-
                 mum age of deposition for the unit. Vitrinite reflectance values indicate that the rocks were buried to max-
                 imum temperatures of 95–125°C (Currie et al., 2016), corresponding to a depth between 3 and 4 km with
                 an estimated thermal gradient of 30°C/km.

                 2.3. Controversies Associated With the Formation of the Kailas Basin
                 Several models have been proposed for the tectonic context of the Kailas basin deposition based on geologi-
                 cal observations, all with major shortcomings or inconsistencies. Yin et al. (1999) suggest that the Kailas
                 Formation was deposited in a foreland basin system related to the uplift and erosion of the Gangdese

SHEN ET AL.                                                                                                                4 of 21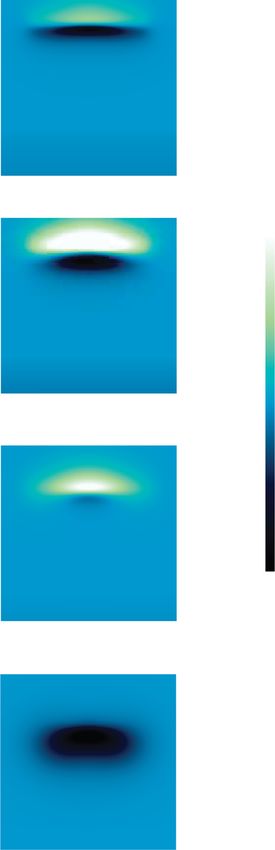
Geochemistry, Geophysics, Geosystems                                               10.1029/2020GC009078

                 Figure 2. Detailed geological map of the Mt. Kailas area, showing the sample locations and previous
                 thermochronological data in study area: Gray, Yin et al. (1999); violet, DeCelles et al. (2011); yellow, Pullen
                 et al. (2011); and cyan, Carrapa et al. (2014). Cross sections with sample locations are shown below the map.

                 magmatic arc to the north of the basin. The basin was uplifted by the top‐to‐the‐south GT below the
                 batholith, which is blind in the Kailas region but emergent to the east in the Zedong region, possibly
                 active between ~31 and 24 Ma (Harrison et al., 2000; Yin et al., 1999). Both the absence of the GT in the
                 Mt. Kailas region and the proposed timing for the onset of the fault (5 Ma earlier than the deposition of
                 the Kailas Formation) argue against this model. Wang et al. (2015) proposed another compressional
                 model, which interpreted the basin as a flexural foredeep basin loaded, to the south in this case, by the
                 top‐to‐the‐north GCT, which bounded the basin to the south. However, the onset of the GCT (19–16 Ma)
                 after the main deposition phase of the Kailas Formation (26–21 Ma), as well as the northern provenance
                 of the sediments, challenge this interpretation (DeCelles et al., 2011; Laskowski et al., 2017).
                 Finally, based on sedimentary and thermochronology studies, it has been suggested that the Kailas
                 Formation was deposited in an extensional context during relative southward rollback of the Indian slab
                 below southern Tibet prior to Miocene slab breakoff (Carrapa et al., 2014; DeCelles et al., 2011; Laskowski

SHEN ET AL.                                                                                                              5 of 21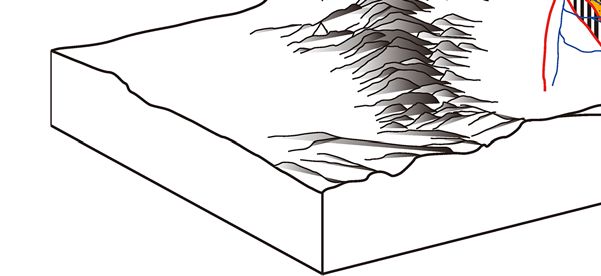
Geochemistry, Geophysics, Geosystems                                                       10.1029/2020GC009078

                                                                        et al., 2017; Leary, DeCelles, et al., 2016; Webb et al., 2017). In this model,
                                                                        the northern edge of the Indian slab reached the northern Lhasa
                                                                        terrane between 30 and ~26 Myr ago (DeCelles et al., 2011; Kapp &
                                                                        DeCelles, 2019). The subsequent, long‐range slab rollback is interpreted
                                                                        to be represented by a coeval southward migration of volcanism across
                                                                        the Lhasa terrane. During sediment deposition, the Kailas basin would
                                                                        have been bounded to the south by a normal fault and was later disrupted
                                                                        by thrusting on the GCT. The Kailas basin was then subsequently
                                                                        exhumed in response to renewed Indian plate underthrusting following
                                                                        slab detachment. However, at the scale of the Tibetan plateau, there are
                                                                        only three volcanic belts (Chung et al., 2005), which have been interpreted
                                                                        as related to subduction events. The main belt is the Gangdese magmatic
                                                                        arc following the Indus‐Yarlung suture, related to the northward subduc-
                                                                        tion of the Indian plate. Another belt is following the Jinsha suture, related
                                                                        to the southward subduction of the Asian lithosphere in an early phase of
                                                                        collision (e.g., Goussin et al., 2020; Horton et al., 2002; Spurlin et al., 2005).
                                                                        Finally, one belt follows the Kunlun suture, related to ongoing southward
                                                                        Asian lithosphere subduction since ~15 Ma (Figure 1). In between the
                                                                        Indus‐Yarlung and the Jinsha sutures, volcanism is sparse in the
                                                                        Qiangtang and the Lhasa terranes, where its spatial pattern does not
                                                                        appear consistent with a continuous southward migration wave associate
                                                                        to a slab rollback (Figure 1). Furthermore, this scenario relies on unsup-
                                                                        ported geodynamic and structural inferences and unlikely mechanical
                                                                        behavior. Structurally, the extensional setting is only indirectly inferred
                                                                        from the large‐scale architecture of the basin, which is interpreted as
                                                                        growth strata. No clear evidence of normal faulting is reported (Leary,
                                                                        DeCelles, et al., 2016). The mechanical impact of slab rollback within a
                                                                        sustained collisional setting, as advocated in this model, may be misinter-
                                                                        preted. While the slab continued to roll back during the deposition of the
                                                                        Kailas Formation, the still‐converging Indian and Eurasian plates sus-
                                                                        tained compression in the Himalaya and potentially caused extension in
                                                                        the mantle wedge above the slab. Only compression—not extension—is
Figure 3. U‐Pb concordia diagrams of Samples 13T02 (top) and 14T05      expected between the colliding lithospheres (Pitard et al., 2018;
(bottom) using the program Isoplot (Ludwig, 2012). The data reduction   Replumaz et al., 2016). Therefore, both the absence of unambiguous exten-
procedures are described in Liu et al. (2008, 2010) with GJ‐1 zircon
                                                                        sional structures and a problematic geodynamic framework weaken this
standards (Jackson et al., 2004).
                                                                        interpretation.

                                     3. Thermochronology
                                     3.1. Samples and Dating Results
                                     We collected six bedrock samples from the Gangdese batholith along two transects, one 20 km and another
                                     ~80 km east of Mt. Kailas (Figure 2), for AFT, ZFT, and zircon U‐Pb dating. Detailed analytical procedures
                                     for zircon U‐Pb, ZFT, and AFT dating are presented in the Text S1 in the supporting information. The zircon
                                     U‐Pb ages are 41.0 ± 1.1 Ma (13 T02) and 50.8 ± 1.6 Ma (14 T05) (see Table S1 for details), with Pb/U con-
                                     cordia diagrams created using Isoplot (v. 3.75) (Ludwig, 2012) shown in Figure 3. ZFT analysis yielded cool-
                                     ing ages between 19.6 ± 2.0 and 24.1 ± 3.3 Ma (±2σ) (Table 1), and AFT analysis yielded cooling ages
                                     between 16.3 ± 1.9 and 11.5 ± 2.1 Ma (±2σ) (Table 3). Detailed fission track data are provided in
                                     Supporting Information S1. These ages do not show significant correlation with sample elevation
                                     (Figure 4a). For samples 13T01 and 13T02, 135 and 77 apatite confined track lengths are measured
                                     (Table 3), providing mean AFT c axis projected length of 13.89 ± 1.32 and 13.74 ± 1.38 μm (with 1 standard
                                     deviation), respectively. The samples 14T01 and 14T05 each yielded less than 50 measured track lengths,
                                     with mean values of 14.22 ± 1.09 and 14.59 ± 1.14 μm.
                                     One modern river sand sample was collected to the north of the Gangdese magmatic arc, approximately
                                     90 km east of Shiquanhe (Figure 5), and subjected to ZFT analysis. The river originated from the Mt.

SHEN ET AL.                                                                                                                                       6 of 21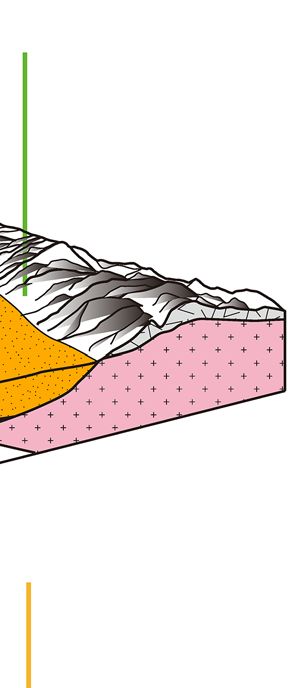
Geochemistry, Geophysics, Geosystems                                                                10.1029/2020GC009078

Table 1
Thermal History Input Table for the QTQt Modeling
1. Thermochronologic Data
Samples and data used in modeling

Sample                                                                                 AFT ages                       AFT lengths                  ZFT ages

13 T01                                                                                      X                             X                               X
13 T02                                                                                      X                             X                               X
13 T04                                                                                      X                                                             X

Data treatment
The AFT lengths are measured from cf tracks and using c‐axis projected lengths (Ketcham et al., 2007), with initial track length of 16.3 μm. The term for the
kinetic parameter is Dpar (Donelick et al., 1999; Ketcham et al., 1999).
The AFT ages and lengths are combined in one data set for an individual sample, while the ZFT ages were regarded as another data input file for the same sample,
with the same GPS information but different annealing parameters.
These data were modeled as an age‐elevation profile.

2. Additional geologic information

Assumption                                                                   Explanation and data source

At a surface temperature of 0 ± 10°C by 0 Ma                                 Based on the annual mean surface temperature of the Tibetan Plateau for the years
                                                                             from 1961 to 2000 (Yang et al., 2010)
At a near‐surface level during 32–26 Ma, assuming a temperature of 200       The Gangdese batholith was exposed at the surface before deposition of the Kailas
  ± 200°C                                                                    Formation (Carrapa et al., 2014; DeCelles et al., 2011). Available 40Ar/39Ar ages of
                                                                             K‐feldspar for the Gangdese batholith in the Mt. Kailas area, close to our profile
                                                                             (~15 km to the west), suggest that the rocks experienced cooling after 32 Ma
                                                                             (Yin et al., 1999).
Modeling begins at temperatures of 750–850°C at 41.0 ± 1.1 Ma                According to the U‐Pb dating of sample 13 T02 in this study

3. System‐ and model‐specific parameters

AFT annealing model: Ketcham et al. (2007)
ZFT annealing model: Yamada et al. (2007) long term
Modeling Code: QTQt version 5.5.0 for PC user
Inversion scheme: Bayesian transdimensional Markov chain Monte Carlo (MCMC)
Ranges for general prior:
  Time (Myr): oldest observed age ± oldest observed age (i.e., 24.1 ± 24.1 Ma here)
  Temperature (°C): 200 ± 200
  Maximum ∂T/∂t (°C/Myr): 1000
MCMC parameters:
  Burn‐in: 50,000 iterations; post‐burn‐in: 200,000 iterations.

Table 2
Bedrock ZFT Results From the Gangdese Batholith
                     Elevation                                                                                                                Pooled           U ± 2σ
                                                                                                                           2
No.        GPS          (m)      Lithology        ρs         Ns         ρi           Ni         ρd        Nd     N      P(χ )   Dispersion   age (Ma)          (ppm)
                                                        6                       6                    5
13T01    81.58389      5,447     Granite      8.11 × 10     1,581   6.35 × 10       1,239   2.54 × 10    3,161   20     80.4%       1.2%     20.3 ± 1.7       1,253 ± 78
         31.08029
                                                        6                       6                    5
13T02    81.58159      5,317     Granite      6.10 × 10      992    4.94 × 10        804    2.54 × 10    3,161   20     65.7%       1.0%     19.6 ± 2.0        974 ± 73
         31.07923
                                                        6                       6                    5
13T04    81.53824      5,044     Granite      3.54 × 10      647    2.60 × 10        475    2.54 × 10    3,161   19     97.6%       0.3%     21.7 ± 2.7        513 ± 49
         31.04565
                                                        6                       6                    5
14T01    82.05073      5,493     Diorite      5.43 × 10     1,324   3.79 × 10        926    2.54 × 10    3,161   20     98.4%       0.2%     22.7 ± 2.1        748 ± 53
         30.83476
                                                        6                       6                    5
14T03    82.02802      5,291     Diorite      2.78 × 10      550    1.83 × 10        362    2.54 × 10    3,161   18     88.6%       0.6%     24.1 ± 3.3        361 ± 39
         30.83046
                                                        6                       6                    5
14T05    82.00145      5,104     Diorite      5.50 × 10     1,197   4.08 × 10        887    2.54 × 10    3,162   20     98.1%       0.4%     21.5 ± 2.0        805 ± 58
         30.82388
Note. All the samples were counted with a zeta calibration factor (Hurford & Green, 1982) ξ = 125.66 ± 1.86 for glass dosimeter IRMM541. N = total number of
                                                                                                                2    2
grains counted; binomial peak‐ages are given ±2SE. The percentage of grains in a specific peak is also given. P(χ ), χ probability that the single grain ages repre-
sent one population.

SHEN ET AL.                                                                                                                                                       7 of 21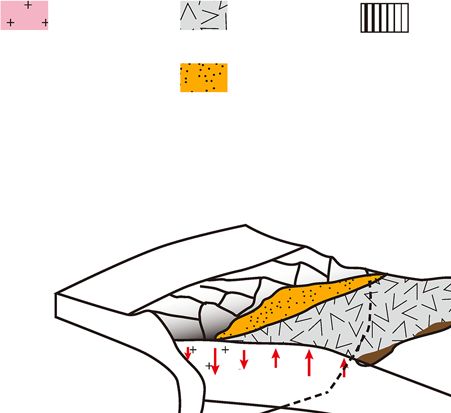
Geochemistry, Geophysics, Geosystems                                                          10.1029/2020GC009078

Table 3
Bedrock AFT Results From the Gangdese Batholith
                                                                                                   Pooled age    U ± 2σ
                                                                                2
No.         ρs        Ns        ρi         Ni         ρd         Nd     N    P(χ )    Dispersion     (Ma)        (ppm)       n     MTL (μm)       MTLc (μm)
                 5                   6                     6
13T01   3.50 × 10    403   2.83 × 10      3,256   1.07 × 10     3,394   20    98.0%     0.2%       16.3 ± 1.9    40 ± 2     135   12.70 ± 1.83   13.89 ± 1.32
                 5                  6                       5
13T02   2.31 × 10    275   2.24 × 10      2,664   1.07 × 10     3,405   20    91.9%     0.3%       13.7 ± 1.8    31 ± 2      77   12.60 ± 1.87   13.74 ± 1.38
                 4                  6                       6
13T04   9.77 × 10     84   1.08 × 10        926   1.07 × 10     3,417   20    99.0%     0.1%       12.0 ± 2.8    15 ± 1
                 5                  6                       6
14T01   1.31 × 10    162   1.18 × 10      1,451   1.08 × 10     3,428   24    75.7%     1.6%       14.9 ± 2.5    16 ± 1      41   13.13 ± 1.57   14.22 ± 1.09
                 5                  6                       6
14T03   1.46 × 10     72   1.51 × 10        745   1.08 × 10     3,440   21   100.0%     0.1%       12.9 ± 3.2    21 ± 2
                 5                  6                       6
14T05   1.43 × 10    141   1.67 × 10      1,648   1.08 × 10     3,451   30    99.9%     0.1%       11.5 ± 2.1    23 ± 1      37   13.76 ± 1.54   14.59 ± 1.14
Note. All the samples were counted with a zeta calibration factor ξ = 247.47 ± 6.05 for glass dosimeter IRMM540R. N = total number of grains counted; binomial
                                                                                            2   2
peak‐ages are given ±2SE. The percentage of grains in a specific peak is also given. P(χ ), χ probability that the single grain ages represent one population.
n = number of horizontal confined track length measured; MTL = mean track length (with ± 1 Std. Dev., standard deviation). MTLc = mean track length of
c axis projected. All apatite samples for track length measurements were irradiated by a collimated beam of heavy ions released from a 252Cf source at the
University of Melbourne (Australia) (Donelick & Miller, 1991).

                                         Kailas area to the south, running mostly northward through the Linzizong volcanic rocks and belonging to
                                         the Indus drainage system. The Linzizong volcanic rocks cover most of the drainage area; therefore, the
                                         sediment sample could be used to reveal the long‐term exhumation history of the Linzizong volcanic
                                         rocks in the northern part of the Gangdese magmatic arc. Central and peak ages of the sample are
                                         determined and plotted with the RadialPlotter by Vermeesch (2009) and presented in Table 4 and
                                         Figure 5. The detrital ZFT grains ages range from 15.0 to 96.0 Ma, and three peak ages of 27.3 ± 1.3,
                                         40.5 ± 2.3 and 70.0 ± 8.1 Ma are obtained.

                                         3.2. Thermochronological Modeling
                                         Fission track data, including AFT ages, AFT lengths, and ZFT ages, are modeled using the QTQt software
                                         (v. 5.5.0) (Gallagher, 2012) to extract thermal history models. We only performed modeling for samples from
                                         the western transect (Sample 13T series) because samples from the other transect provided insufficient AFT
                                         length data for modeling. The two zircon U‐Pb ages from the Gangdese batholith of 41.0 ± 1.1 Ma (13 T02) and
                                         50.8 ± 1.6 Ma (14 T05), interpreted as the age of the batholith intrusion and crystallization, have been intro-
                                         duced into the model as a thermal constraint of 750 ± 100°C (Harrison et al., 2007; Valley et al., 2006) between
                                         50 and 40 Ma. The fact that the Kailas Formation was deposited unconformably on the granite means that the
                                         top of the batholith was at the surface before deposition started, that is, at ~26 Ma at the location of the Kailas
                                         basin (DeCelles et al., 2011). This condition has been introduced as a second thermal constraint with a low
                                         temperature (0–400°C) between 32 and 26 Ma to take into account the shallow depth range of the samples
                                         before Kailas Formation deposition (Table 1 and Figure 4b) and the present‐day surface temperature of
                                         0 ± 10°C (mean annual surface temperature from 1961 to 2000 on the Tibetan Plateau; Yang et al., 2010).
                                         After discarding the initial 50,000 burn‐in iterations, 200,000 iterations of the model are run. For fission
                                         track annealing kinetics, the multikinetic annealing model of Ketcham et al. (2007) was chosen for AFT
                                         data, and the kinetics of Yamada et al. (2007) are chosen for ZFT data. Compositionally dependent initial
                                         track lengths are calculated based on a Dpar value for each apatite grain, calibrated against the Durango apa-
                                         tite standard. Detailed QTQt modeling parameters are shown in Table 1, and all the data used for QTQt mod-
                                         eling are shown in Supporting Information S2. The Eocene postmagmatic cooling is constrained by the two
                                         thermal constraints imposed on the model, resulting in rapid cooling between ~40 and ~28 Ma, compatible
                                         with the published K‐feldspar 40Ar/39Ar age of 31.33 ± 0.26 Ma (Figure 4a) from the nearby granite Sample
                                         95‐6‐11 (Figure 2) (Yin et al., 1999). For the fission track data, the best fit inversion model obtained
                                         with QTQt shows a three‐stage thermal history (Figure 4b): (1) heating from ~200°C (60–350°C with 95%
                                         confidence interval) to ~380°C (320–420°C with 95% confidence interval) between ~28–26 and ~20 Ma
                                         (16–\40°C/Myr), (2) rapid cooling from ~380°C (320–420°C with 95% confidence interval) to ~100°C
                                         (30–120°C with 95% confidence interval) between 21–20 and 17 Ma with a minimum cooling rate of
                                         ~50°C/Myr, and (3) relatively slow cooling since ~6 Ma after an ~10 Myr residence time in the AFT partial
                                         annealing zone. The model‐predicted ages and track length are plotted in Figure 4c, and the individual sam-
                                         ple predictions by QTQt are provided in Supporting Information S2.

SHEN ET AL.                                                                                                                                            8 of 21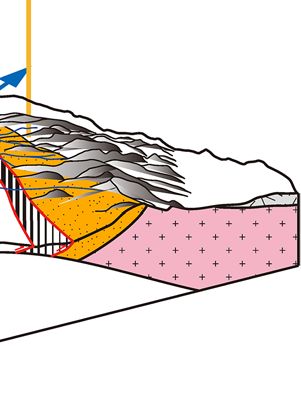
Geochemistry, Geophysics, Geosystems                                                            10.1029/2020GC009078

            (a)                                                               4. Dynamic Topography Modeling
                                                                              We modeled changes in dynamic topography to decipher the link between
                                                                              first‐order geomorphic changes and deep slab movements. We model the
                                                                              viscous flow beneath the Indian‐Eurasian convergence zone following the
                                                                              Stokeslets approximation (Harper, 1984; Morgan, 1965), which has pro-
                                                                              ven successful in global (e.g., Ricard et al., 1993) and more regional
                                                                              (Guillaume et al., 2009) models. The density field is discretized into point
                                                                              masses, and each point mass i induces an elementary flow for which the
                                                                              stream function is known (e.g., Batchelor, 1967), which can be written
                                                                              as follows:

                                                                                                                Δρυi g
            (b)                                                                                          Ψi ¼          r ij sin2 θij ;
                                                                                                                 8πη

                                                                              where Δρυi is the mass anomaly associated with each point mass, g is the
                                                                              acceleration of gravity, η is the viscosity, rij is the distance from the point
                                                                              mass i to a point j at the surface, and θij is the angle between the vector ij
                                                                              and g. The normal stress is computed following the image technique, as
                                                                              in Morgan (1965):

                                                                                                                      3Δρυi gz3i
                                                                                                             F ij ¼              ;
                                                                                                                        πr 5ij

                                                                              where zi is the depth of the point mass. For a stress‐free surface, the nor-
                                                                              mal stress is compensated by an opposite surface load. That surface load
                                                                              is a deflection of the surface (dynamic topography):
             (c)
                                                                                                                         F ij
                                                                                                            hij ¼              ;
                                                                                                                      ðρm − ρÞg

                                                                              where ρm is the density of the mantle and ρ is the density of water in
                                                                              immersed domains, air in subaerial domains (as in the Himalaya for
                                                                              instance), or sediments in sedimentary plains (such as the Indo‐Gangetic
                                                                              plain). The total deflection Hij is the sum of all individual deflections,
                                                                              and the dynamic topography at a given location is given by the following:

                                                                                                                     3Δρυi gz3i
                                                                                                           H ij ¼                  :
                                                                                                                    πr 5ij ðρm − ρÞ

                                                                              Here, we take advantage of this semianalytical formalism to explore the
                                                                              dynamic topography (as in Husson, 2006) above a flowing mantle around
Figure 4. (a) Age‐elevation plots for dated samples and selected
          40   39                                                             reconstructed idealized slab geometries.
previous Ar/ Ar datum (Yin et al., 1999). Samples with red labels are
used for QTQt modeling. (b) QTQt model results taking Samples 13T01,     We computed models of dynamic topography from our reconstructed geo-
13T02, and 13T04 as a profile. The red line corresponds to the path of themetries at intervals of 5 Myr, and only updating the slab geometry
hottest (lowest elevation) sample (with the 95% credible interval range in
                                                                         between 30 and 25 Ma in order to account for shortening and slab reloca-
magenta); the blue line corresponds to the coolest (highest elevation)
                                                                         tion beneath the Himalaya. Slab geometries at each time are recon-
sample (with the 95% credible interval range in cyan); intermediate samples
are shown in gray. (c) The predicted data by the QTQt modeling           structed as described in Husson et al. (2014) and Webb et al. (2017),
compared with observed data. The red box is the general prior            based on geophysical observations for present day, and geological argu-
time‐temperature box, which was set to a temperature of 200 ± 200°C      ments for past reconstructions in the past complemented by lessons from
(Ketcham et al., 2007), and the black boxes are geological constraints
                                                                         numerical and analog models. In practice, slab geometries are simplified
on the modeling (see the text and Table 1 for details).
                                                                         as downdipping surfaces. Slabs are linear at the surface and distorted at
                                        depth. That distortion is defined by a laterally variable dip along the trench. Over time, the slab overall
                                        rotates from a north dipping to a south dipping slab over 25 Myr period. In addition, the slab gradually
                                        detaches from the edges toward the center over the same period. Last, the slab is offset with respect to the

SHEN ET AL.                                                                                                                                          9 of 21
Geochemistry, Geophysics, Geosystems 10.1029/2020GC009078
Figure 5. Drainage network related to the modern river sand sample (red star). Main lithologic units of the northern
Gangdese magmatic arc are shown in the figure. Inset figure illustrates the RadialPlotter plot of the ZFT data from the
modern river sand.
trench, by an amount that decreases over time, to account for relative rollback. Detailed geometries are
accessible in Husson et al. (2014).
Slabs at each time step are discretized into individual Stokeslets (or point masses). The negative buoyancy of
the slab at any time is computed assuming that an unstretched section of slab has a thickness of 110 km and a
Table 4
Detrital Zircon Fission Track Data From Sample T44‐1
Age
5 −2 6 −2 6 −2
Sample GPS ρd × 10 cm ρs × 10 cm ρi × 10 cm U range P1 age P2 age P3 age Central age
−1 2
no. location N (Nd) (Ns) (Ni) (ug·g ) P(χ ) Dispersion (Ma) (Ma ± 1σ) (Ma ± 1σ) (Ma ± 1σ) (Ma ± 1σ)
T44‐1 81.08881 100 3.837 (2686) 4.17 (3,689) 3.02 (2,669) 313 0 28% 15.0–96.0 27.3 ± 1.3 40.5 ± 2.3 70 ± 8.1 36.0 ± 1.2
32.39525 (39.9 ± 9.3%) (50.7 ± 8.6%) (9 ± 13%)
SHEN ET AL. 10 of 21Geochemistry, Geophysics, Geosystems 10.1029/2020GC009078
density contrast with the mantle of 60 kg m−3. The total buoyancy of the slab in the upper mantle is assumed
to be uniform per unit trench length at each time step. Because the lithosphere stretches as it gets closer to
the edges, its thickness decreases. Thus, the absolute buoyancy of the individual point masses decreases, and
we adjust the values accordingly. In these models, we only consider the density anomaly of the slab; hence,
the net density anomaly is positive. This implicitly corresponds to the assumptions that opposing buoyancy
anomalies (to restore a neutral net buoyancy) are either uniformly distributed in the mantle or too remotely
located to produce any effect in the area. In both cases, there is no impact on the model predictions.
Summing up individual flows of each Stokeslet yields the entire flow, from which the vertical stress beneath
the surface can be computed.
The vertical stress is compensated by a long‐wavelength (100 s of km) deflection, either filled with air, sedi-
ments, or water. This is critical because the magnitude of the deflection scales with the density contrast
between the mantle and the filling material, namely, sediments in the Indo‐Ganges plain and Kailas basin
(corresponding to a density contrast of 500 kg m−3) and air in the Himalayan belt (corresponding to a density
contrast of 3,200 kg m−3). Note that the deflection has a very low aspect ratio (amplitude over wavelength),
which implies that its geometry remains insensitive to the elasticity of the lithosphere, regardless of its com-
pensation. We therefore predict air‐compensated deflections δza and sediment‐compensated deflections δzs
(and their temporal variations, i.e., uplift and subsidence; Figure 6). Because air‐compensated topographic
change by default assumes no erosion, we also computed the values of surface uplift with an amount of
equivalent erosion in order for the elevation to remain constant throughout while maintaining isostasy.
This scenario represents the maximum bound for bulk exhumation of the Gangdese batholith and Kailas
basin caused by dynamic surface uplift.
As the slab remains stationary underneath the northward drifting Indian plate, our model predicts a wave of
dynamic subsidence migrating from the Lhasa terrane to the south (from ~30 to 26 Ma; Figure 6) toward its
current southern location, where it now explains the deflection of the foreland basin (see also Husson
et al., 2014). If compensated by sediments, as we hypothesize for the Kailas basin, the predicted deflection
amounts to about 4 to 7 km (note that it would be only ~1 km in the absence of sedimentary infill, that is,
if the stresses were compensated by air instead of sediments). As the slab migrates southward relative to
the Himalaya, the mantle load and dynamic deflection relocate southward and the topography bounces
back. In the absence of erosion, our model predicts a surface uplift of ~1 km. If this surface uplift were instan-
taneously compensated by erosion, the amount of rock uplift could be as high as 5–6 km.
5. Discussion: Dynamic Subsidence and Surface Uplift in Southernmost Tibet
Multiple unrelated processes have been invoked in the past to explain several observations of vertical land
motion that cannot be explained by horizontal shortening or extension. Classic examples include the
mid‐Miocene uplift of southern Tibet and the Himalaya and the coeval onset of rapid deposition of
the Siwalik series in the foreland basin. Canonical explanations involve removal of the mantle lithosphere
(e.g., Harrison et al., 1992; Molnar et al., 1993) and elastic flexure of the lithosphere (e.g., Lyon‐Caen &
Molnar, 1983). While each process is independently mechanically plausible, they are somewhat incompati-
ble: If lithospheric unloading by removal of the lithospheric mantle in southern Tibet is invoked to explain
the mid‐Miocene uplift of southern Tibet and the High Himalaya, it implies that the vertical load exerted by
the overriding lithosphere decreases. Removing the dense mantle lithosphere would counteract the over-
loading effect of the thickened crust, and the net result would arguably be to unload the overriding litho-
sphere. The flexural response of the subducting plate would adjust accordingly, and the unloaded
overriding lithosphere would be incapable to increase the deflection but would perhaps decrease it. It follows
that if delamination prevails in the upper plate, it therefore simultaneously rules out the lithospheric flexure
hypothesis under an increased load at the plate boundary to explain the synchronous development of the
foreland basin. In contrast, transient dynamic topography is a simple mechanism that provides a single
explanation for these first‐order observations. Here, we show that deposition and erosion of the Kailas
Formation in the southern Lhasa terrane are further evidence of the same process.
Other explanations (e.g., Wang et al., 2015) invoke elasticity in the upper plate. Such a model would work if
elasticity could prevail over long time scales (i.e., that of an orogen). We deem this hypothesis unlikely
because the tectonically disrupted lithosphere and the high thermal regime suggest that viscous relaxation
SHEN ET AL. 11 of 21Geochemistry, Geophysics, Geosystems 10.1029/2020GC009078
(a)
(b)
(c)
(d)
Figure 6. Simplified geodynamic evolution of Indian subduction, the Himalaya, and southern Tibet. Green curves above
cross sections (left) and map views (right) of the modeled dynamic surface uplift and subsidence (differences in dynamic
topography over the time frames) for an idealized Indian‐Eurasian subduction zone, with dynamic surface uplift
(air compensated), dynamic subsidence (sediment compensated), or equivalent erosion (assuming steady elevation).
Slab geometries at each time are based on geophysical observations for present day, and geological arguments for past
reconstructions in the past complemented by lessons from numerical and analog models (left). The black line
is the zero isocontour, representing zero uplift/subsidence.
should quickly take over. Importantly, our model is conversely insensitive to the elasticity of the upper plate;
the dynamic deflection only owes its origin to viscous fluxes in the mantle and its cessation to the release of
the viscous traction underneath the surface. The subsequent rebound (Figure 6) is not due to any elastic
rebound, but only to the restoration of isostatic equilibrium.
5.1. Transient Subsidence Across the Lhasa Terrane
The best fit line of thermal history shows the granites of the Gangdese batholith north of the Kailas basin
after crystallization (50–40 Ma), began with a cooling to ~200°C (60–350°C with 95% confidence interval)
during ~40 to ~28 Ma followed by a reheating phase between 28–26 and 21–20 Ma with temperature increas-
ing to 320–420°C, in the Kailas area (Figure 4b). This reheating is coeval with the heating of the Kailas
Formation during its deposition between ~26 and ~21 Ma (Carrapa et al., 2014), suggesting that both the dee-
per sedimentary rocks of the basin and the underlying batholith were heated by the burial below thick sedi-
mentation in a rapidly subsiding basin. Such burial is in agreement with our inversion of the thermal data
SHEN ET AL. 12 of 21Geochemistry, Geophysics, Geosystems 10.1029/2020GC009078
showing that the batholith has been reheated to temperatures in excess of 320–420°C (Figure 4b). This
implies that subsidence was not restricted to the present‐day exposure of the Kailas basin but spanned a
broader region including the current Gangdese batholith exposures, which also experienced burial.
Isolated exposures of conglomerates atop the batholith (Figure 2) have been interpreted as local remnants
of such a more extended Kailas Formation (Shen et al., 2019) (Figure 2).
Our dynamic models show that the southward migrating wave of dynamic topography implies a phase of
dynamic subsidence. The initiation of deposition could have occurred north of the Gangdese magmatic
arc south of the Lhasa terrane above the Indian slab, subducted since ~35 Ma after the Neo‐Tethyan slab
breakoff at ~45 Ma (Guillot et al., 2003; Replumaz et al., 2014). The deposition of the Rigongla Formation
at ~31 Ma along the northern margin of the Gangdese magmatic arc between Shiquanhe and Xigaze could
correspond to this initial subsidence (Figure 6a). Dynamic topography modeling estimates subsidence
amounting to ~4 km, compatible with the amount of sediment thickness between 3 and 4 km estimated
for Rigongla Formation in Namling (Currie et al., 2016). Afterward, subsidence migrated southward as
the northward drifting Indian plate moved above its own stationary slab, leading to an overturned geometry
(Figure 6). During the Oligocene to Miocene (between 26 and 21 Ma), subsidence occurred in the Gangdese
magmatic arc and Indus‐Yarlung suture zone, yielding a maximum subsidence of ~6 km between the mag-
matic arc and suture zone (Figure 6b). The current extent of the Kailas basin probably represents the location
of the depocenter, which experienced ~4–7 km of burial (Carrapa et al., 2014), and the magnitude of burial
shallowed northward, with ~4 km of burial in the Gangdese batholith according to our thermal modeling
(Figure 6b). Moreover, according to the thermal model in this study, the 16–40°C/Myr heating rate is com-
patible with a sediment accumulation rate of 0.5–1.3 km/Myr, which is consistent with the 4–7 km burial
during 26–21 Ma at a deposition rate of 0.8–1.4 km/Myr (Carrapa et al., 2014).
Importantly, the dynamic deflection did not create the basin by itself: The southward increase in mantle
traction during sedimentation only manifested as a southward tilt of the upper plate. For the deflection to
be filled by water and sediments at an elevation of 1,500–2,900 m above sea level (Ai et al., 2019; DeCelles
et al., 2011), the basin thus needed to be capable of storing sediments. This inference implies that the
dynamic deflection could be recorded only in sedimentary basins in which the outlets of the drainage system
were partly hindered by surrounding topographic highs (Figures 7a and 7b). Indeed, a paleoaltitude analysis
has suggested that the Gangdese magmatic arc was slightly higher (~4,500 m) than the area to the north
(Geochemistry, Geophysics, Geosystems 10.1029/2020GC009078
(a) (b)
(c) (d)
Figure 7. Schematic diagrams showing the dynamic deflection/uplift of southern Tibet. (a and b) Between 26 and 21 Ma,
the southward migration of the dynamic deflection resulted in the uplift of the northern part of the Gangdese
magmatic arc and subsidence of southernmost Tibet, forming the Kailas basin. (c and d) Beginning at approximately
20 Ma, surface uplift took place in southernmost Tibet, and subsidence migrated toward the front of the Himalaya,
resulting in rapid exhumation of the Kailas Formation and Gangdese batholith. Panels d and e zoom in the topographic
evolution around the Kailas basin during 26–21 and 20–15 Ma. The green curve on the top shows the dynamic subsidence
(sediment compensated) as in the Figure 6.
that the main source of the sediments was the Linzizong volcanic rocks to the north, not the Gangdese
batholith (DeCelles et al., 2011; Shen et al., 2019). Sedimentation ceased when the efficient river incision
and evacuation of material from southern Tibet by the paleo‐Yarlung River and Indus River occurred
during the early to middle Miocene (Carrapa et al., 2017).
5.2. Middle Miocene Uplift in Southern Tibet
The period of subsidence in the sampled region was followed by a period of exhumation between 20 and
17 Ma. Considering a thermal gradient of 30°C/km during this exhumation phase, the cooling is estimated
to correspond to a minimum of 6.6 km of exhumation (6.6–13 km considering 95% confidence interval,
according to the thermal model) (Figure 4). Similar magnitudes of exhumation are recorded during the same
time interval across the Ladakh batholith (Kirstein et al., 2006), Kailas basin (Carrapa et al., 2014), Gyirong
basin (Shen et al., 2016), Xigaze area (Dai et al., 2013; Ge et al., 2017, 2018) and eastern Tibet (Li, Kohn,
et al., 2015; Tremblay et al., 2015) (Figures 1 and 8). The elevation of southern Tibet was still relatively
low (1,500–2,900 m) during the time of deposition (26–21 Ma) of the Kailas Formation (Ai et al., 2019;
DeCelles et al., 2011, 2018), while after the phase of exhumation (20–17 Ma), the Namling basin attained ele-
vations of approximately 4,000 m (Spicer et al., 2003). Moreover, no major thrust faults or major deformation
events are observed to be directly associated with the surface uplift of the Kailas basin, which lies in the foot-
wall of the GCT, rests unconformably on the Gangdese batholith to the north (Figure 2), and has a well‐pre-
served, seemingly isopachous stratigraphy (e.g., Yin et al., 1999). Besides, the rapid river incision along the
Yarlung‐Tsangpo River mainly occurred after 15 Ma and was almost confined at the east of the Xigaze area
(e.g., Dai et al., 2013; Li, Kohn, et al., 2015; Rohrmann et al., 2012), so that it also cannot account for the
exhumation between 20 and 17 Ma across the southern Tibet.
SHEN ET AL. 14 of 21Geochemistry, Geophysics, Geosystems 10.1029/2020GC009078
(a)
(b) (c) (d)
Figure 8. Compilation of the existing thermochronologic data in southern Tibet with the present‐day dynamic deflection
(Husson et al., 2014). (a) Distribution of the AFT and AHe data of the Kailas Formation, Gangdese batholith, and Xigaze
basin with the model‐predicted dynamic surface uplift (red) and subsidence (blue) at present day as well as the depth
contours of the foreland basin (yellow) (Husson et al., 2014). The contour values (km) are for a sediment compensation of
dynamic subsidence (blue) or erosion compensated dynamic surface uplift (red). In the absence of erosion or surface
uplift, the magnitude should be divided by a factor of ~6 (see Husson et al., 2014, for details). The age of magmatism
contours by Goussin et al. (2020) are also illustrated. (b–d) AFT, AHe, and ZHe ages of the Kailas Formation, Gangdese
batholith, and Xigaze basin against the distance from Indus‐Yarlung suture zone in different locations. The data are
summarized from Carrapa et al. (2014); Copeland et al. (1995); Dai et al. (2013); Ge et al. (2017, 2018); Li et al.
(2016, 2017); Li, Kohn, et al. (2015); Li, Tian, et al. (2015); Pan et al. (1993); Tremblay et al. (2015); Wang et al. (2007);
Wang et al. (2015); Yang et al. (1999); Zhao et al. (2015); and this study.
In the absence of clear evidence for horizontal tectonics, our dynamic model provides an explanation. Once
the downward deflection associated with the slab migrated to southern locations, the topography uplifted
toward an isostatically compensated elevation (Figures 6b and 7a). The wave of surface uplift first occurred
in the northern Gangdese magmatic arc, according to the young ZFT peak age of modern river sand from the
central Lhasa terrane, showing exhumation at ~27.3 ± 1.3 Ma (Figure 5), and then migrated southward. As
the deflection migrated south of the Kailas basin, it first starved then eventually exhumed and eroded from
SHEN ET AL. 15 of 21Geochemistry, Geophysics, Geosystems 10.1029/2020GC009078
20 Ma onward, while subsidence started in the Himalayan foreland basin (Figures 6c and 7c). Topographic
subsidence may have bypassed the Himalaya itself or was perhaps diminished across the range. This could
occur due to development of the orogenic wedge (i.e., the MCT active during the early Miocene, the MBT
active during the late Miocene, and the MFT active during the Quaternary; e.g., Coutand et al., 2014;
Kohn et al., 2001), such that tectonic shortening and concomitant crustal thickening (e.g., duplex systems)
could have compensated for the otherwise predicted topographic deflection (Webb et al., 2017). Further
exploration of the impacts of the relative southwards motion of the slab on the thrust tectonics, topography,
and climate across the Himalayan orogenic wedge are presented in Webb et al. (2017).
The model‐predicted dynamic surface uplift amounts to approximately 1 km. This value is consistent with
the estimated increase in elevation before and after rock cooling, according to fossil leaf evidence, which sug-
gested a 1,500–2,900 m elevation for the Kailas basin at ~23 Ma (Ai et al., 2019) and a 4,638 ± 847 m elevation
for southern Tibet at 15 Ma (Spicer et al., 2003). The associated exhumation rates can be computed, to the
first order, by assuming that isostatic equilibrium is restored when the elevation remains constant. This
yields at maximum approximately 6 km of exhumation (Figure 6c), which is comparable to data from the
Gangdese batholith. This exhumation was accompanied by intense surface erosion, reducing the
present‐day preserved thickness of the Kailas Formation (DeCelles et al., 2011, 2018) (Figure 7d). In practice,
exhumation does not strictly result in a constant elevation, and some of the surface uplift is not compensated
by erosion. The remainder has uplifted the Kailas basin in southern Tibet from its basin surface elevation
during deposition (1,500–2,900 m), to its modern elevation of 4,500–6,700 m.
5.3. Along‐Strike Dynamic Deflection
Along the Himalayan arc, the present‐day dynamic deflection center (more than 6 km of sediment compen-
sated deflection in the foreland) is located in the middle of the range, with no deflection below the eastern
syntaxis, and a smaller amplitude to the west (−2 km), as shown by Husson et al. (2014) (Figure 8a). It is due
to the geometry of the slab, whose center of mass is located below the middle of the Himalayan range along
the arc‐parallel direction (e.g., Replumaz et al., 2010, 2014). It has been similar since the Miocene time, with
about 8 km of sediments deposited in the middle of the foreland basin along the arc‐parallel direction, and
less than 1 km close to the eastern and western syntaxes (Husson et al., 2014, and references therein).
Thermochronologic data reveal a similar longitudinal pattern for the Kailas formation, whose depocenter
was located above the center of mass of the subducting slab, in the middle of the suture in the arc‐parallel
direction (Figure 8a). In the Mt. Kailas area, rapid exhumation occurred at circa 20–17 Ma for the Kailas
Formation (Carrapa et al., 2014) with AFT ages mostly younger than ~20 Ma (Figure 8b). To the east, in
the Xigaze area, rapid exhumation occurred at circa 16–14 Ma for the Kailas Formation (Ge et al., 2018)
and 16–10 Ma for the Liuqu Formation (Li, Tian, et al., 2015), with also AFT ages younger than ~20 Ma
(Figure 8c). Between the Kailas Formation to the north and the Liuqu Formation to the south, the rocks
from the Xigaze basin also experienced rapid exhumation at circa 16–15 Ma showingYou can also read