Future climate change will impact the size and location of breeding and wintering areas of migratory thrushes in South America - Maurício ...
←
→
Page content transcription
If your browser does not render page correctly, please read the page content below
AmericanOrnithology.org

                                                                                                                  Volume 123, 2021, pp. 1–16
                                                                                                            DOI: 10.1093/ornithapp/duab006

RESEARCH ARTICLE

Future climate change will impact the size and location of breeding and
wintering areas of migratory thrushes in South America

                                                                                                                                               Downloaded from https://academic.oup.com/condor/advance-article/doi/10.1093/ornithapp/duab006/6237321 by guest on 20 April 2021
Natália Stefanini Da Silveira,1,*, Maurício Humberto Vancine,2 Alex E. Jahn,3 Marco Aurélio Pizo,1 and
Thadeu Sobral-Souza4
1
  Department of Zoology, Institute of Biosciences, São Paulo State University (UNESP), Rio Claro, Brazil
2
  Department of Ecology, Institute of Biosciences, São Paulo State University (UNESP), Rio Claro, Brazil
3
  Environmental Resilience Institute, Indiana University, Bloomington, Indiana, USA
4
  Department of Botany and Ecology, Federal University of Mato Grosso (UFMT), Cuiabá, Brazil
*Corresponding author: nat.stefanini@gmail.com
Submission Date: May 11, 2020; Editorial Acceptance Date: January 24, 2021; Published April 19, 2021

    ABSTRACT
    Bird migration patterns are changing worldwide due to current global climate changes. Addressing the effects of
    such changes on the migration of birds in South America is particularly challenging because the details about how
    birds migrate within the Neotropics are generally not well understood. Here, we aim to infer the potential effects of
    future climate change on breeding and wintering areas of birds that migrate within South America by estimating the
    size and elevations of their future breeding and wintering areas. We used occurrence data from species distribution
    databases (VertNet and GBIF), published studies, and eBird for 3 thrush species (Turdidae; Turdus nigriceps, T. subalaris,
    and T. flavipes) that breed and winter in different regions of South America and built ecological niche models using
    ensemble forecasting approaches to infer current and future potential distributions throughout the breeding
    and wintering periods of each species. Our findings point to future shifts in wintering and breeding areas, mainly
    through elevational and longitudinal changes. Future breeding areas for T. nigriceps, which migrates along the Andes
    Mountains, will be displaced to the west, while breeding displacements to the east are expected for the other 2 species.
    An overall loss in the size of future wintering areas was also supported for 2 of the species, especially for T. subalaris, but
    an increase is anticipated for T. flavipes. Our results suggest that future climate change in South America will require
    that species shift their breeding and wintering areas to higher elevations in addition to changes in their latitudes and
    longitude. Our findings are the first to show how future climate change may affect migratory birds in South America
    throughout the year and suggest that even closely related migratory birds in South America will be affected in different
    ways, depending on the regions where they breed and overwinter.
    Keywords: climate change, ecological niche models, migration, Turdidae, South America

    LAY SUMMARY

    • Bird ranges are changing worldwide due to current global climate changes.
    • Bird migration is common in South America, with more than 200 species of Neotropical austral migrants, yet we still
      understand little about how these species are impacted by climate change.
    • We modeled future breeding and winter distributions of 3 species of migratory thrushes in South America.
    • Our results suggest that future wintering and breeding areas for migratory birds in South America will decrease,
      change in latitude and longitude, and shift to higher regions although patterns will likely vary by species.

    No futuro as mudanças climáticas afetarão o tamanho e a localização das áreas de reprodução e
    invernada de sabiás migratórios na América do Sul
    RESUMO
    Os padrões de migração das aves estão mudando em todo o mundo devido às mudanças climáticas globais atuais.
    Abordar os efeitos de tais mudanças na migração de aves na América do Sul é particularmente desafiador, uma vez
    que os detalhes sobre como essas aves migram dentro dos Neotrópicos geralmente não são bem compreendidos.
    Aqui, pretendíamos inferir os efeitos potenciais das mudanças climáticas nas áreas de reprodução e invernada de aves
    migratórias da América do Sul, estimando o tamanho e o local de suas áreas de reprodução e invernada no futuro.

Copyright © American Ornithological Society 2021. All rights reserved. For permissions, e-mail: journals.permissions@oup.com.
2   Climate changes dynamics on South American migratory birds                         N. S. Da Silveira, M. H. Vancine, A. E. Jahn, et al.

    Utilizamos dados de ocorrência de bancos de dados online (VertNet e GBIF, eBird), além de estudos publicados em
    periódicos, de três espécies de sabiás da América do Sul (Turdidae; Turdus nigriceps, T. subalaris e T. flavipes) e construímos
    modelos de nicho ecológico para inferir as distribuições potenciais atuais e futuras ao longo dos períodos de reprodução
    e invernada de cada espécie. Nossos resultados apontam para mudanças futuras nas áreas de invernada e reprodução
    dessas espécies, principalmente por meio de mudanças altitudinais e longitudinais de suas áreas de distribuição. A área
    de reprodução da espécie T. nigriceps, a qual migra ao redor da Cordilheira dos Andes, será deslocada para o oeste
    no futuro, enquanto os deslocamentos de áreas reprodutivas para o leste são esperados para as outras duas espécies.
    Uma perda geral do tamanho das áreas de invernada no futuro também foi prevista para duas das espécies estudadas,
    especialmente para T. subalaris, e também foi observado um aumento de área para a espécie T. flavipes. Nossos

                                                                                                                                               Downloaded from https://academic.oup.com/condor/advance-article/doi/10.1093/ornithapp/duab006/6237321 by guest on 20 April 2021
    resultados sugerem que as mudanças climáticas futuras na América do Sul exigirão que essas espécies mudem suas
    áreas de reprodução e invernada para altitudes mais elevadas, além de mudanças latitudinais e longitudinais. Nossas
    descobertas são as primeiras a mostrar como mudanças climáticas podem afetar as aves migratórias na América do Sul
    no futuro, e sugerem que mesmo aves aparentadas serão afetadas de maneiras diferentes dependendo da região onde
    se reproduzem e passam o inverno na América do Sul.
    Palavras-chave: mudanças climáticas, migração, América do Sul, aves, Modelos de Nicho Ecológico

INTRODUCTION                                                            Bird migration is common in South America, with more
                                                                     than 200 species of Neotropical austral migrants that
Recent years have witnessed an increase in the number                breed at south-temperate latitudes and that overwinter
of studies on the negative impact of current and future              closer to the Equator (Chesser 1994, Jahn et al. 2013).
rapidly changing environmental conditions on biodiver-               Two other migratory systems found in South America are
sity (Bellard et al. 2012, Scheffers et al. 2016, Trisos et al.      altitudinal and intra-tropical migration. Intra-tropical
2020). Such changes may not only affect species richness             migrants only migrate within the tropics (i.e. between
and their abundances, but also morphological and physio-             the tropics of Cancer and Capricorn), with movements
logical traits, ecosystem functions, community assembly,             that are complex and varied (altitudinal, latitudinal, and
and species distributions (Pecl et al. 2017). Global cli-            longitudinal movements). Altitudinal bird migration is
mate change can also impact movement behavior—espe-                  common in the Neotropics, consisting of birds breeding
cially latitudinal and altitudinal movements—as a result             at higher elevations and overwintering at lower elevations
of changes in the location and size of areas suitable for            (Faaborg et al. 2010, Barçante et al. 2017). As is true of
breeding, wintering, and migrating (Thomas et al. 2004,              avian migratory systems on other continents, the main
Bellard et al. 2012, Vergés et al. 2014).                            driver of bird migration in South America is the need
   Across vertebrate species, movement behavior is tightly           to track large-scale spatiotemporal variation in resource
linked to climatic seasonality (Parmesan and Yohe 2003,              availability (Chesser 1994, Joseph 1997, Faaborg et al.
Parmesan 2006, Scheffers et al. 2016). Although migratory            2010, MacPherson et al. 2018). Indeed, despite the wide
species have adapted to track seasonal resource availability,        variety of avian migratory systems found in the Southern
they can be particularly vulnerable to rapid environmental           Hemisphere, most are still poorly understood, in large
change because they move between geographical areas that             part due to their complexity, which are in turn related to
are influenced by a complex set of environmental factors             demographic- and population-specific migratory strat-
that vary across time and space and are often hard to pre-           egies (reviewed by Jahn et al. 2009).
dict (Newton 2008). Long-distance migrants are thought to               One of the main biogeographical differences between
be particularly vulnerable to rapid climate change because           Neotropical austral migrants and Nearctic–Neotropical
they have shown less flexibility in migration timing in the          migratory birds that breed in North America is in the
face of climate change, as compared to short-distance mi-            relative size of their breeding and wintering areas. The
grants (Both et al. 2010, Jones and Cresswell 2010, Végvári          breeding area of most Nearctic–Neotropical migrants (i.e.
et al. 2010; but see Jonzén et al. 2006, reviewed by Knudsen         North America) is overall larger than their available win-
et al. 2011). Nevertheless, numerous migratory birds have            tering area (i.e. Middle America, northern South America),
already been found to be responding to rapid global cli-             whereas the opposite is true for most Neotropical aus-
matic changes (Pulido and Berthold 2010, Sekercioglu                 tral migrants, because South America is much narrower
et al. 2012, Zurell et al. 2018), for example by shifting the        at south-temperate vs. tropical latitudes (Chesser 1994).
location of their wintering and breeding areas (Coppack              Additionally, due to the stabilizing effect of the oceans
et al. 2003, Huntley et al. 2006, Zurell et al. 2018, La Sorte       that make up the majority of the Southern Hemisphere
et al. 2019) and switching from migration to year-round              (Yom-Tov et al. 1994, Dingle 2008), the climate at south-
residency (Fiedler et al. 2004, Niven et al. 2004, Pulido and        temperate latitudes is more seasonally buffered than that
Berthold 2010).                                                      at north-temperate latitudes (Paruelo et al. 1998). As a

Ornithological Applications 123:1–16 © 2021 American Ornithological Society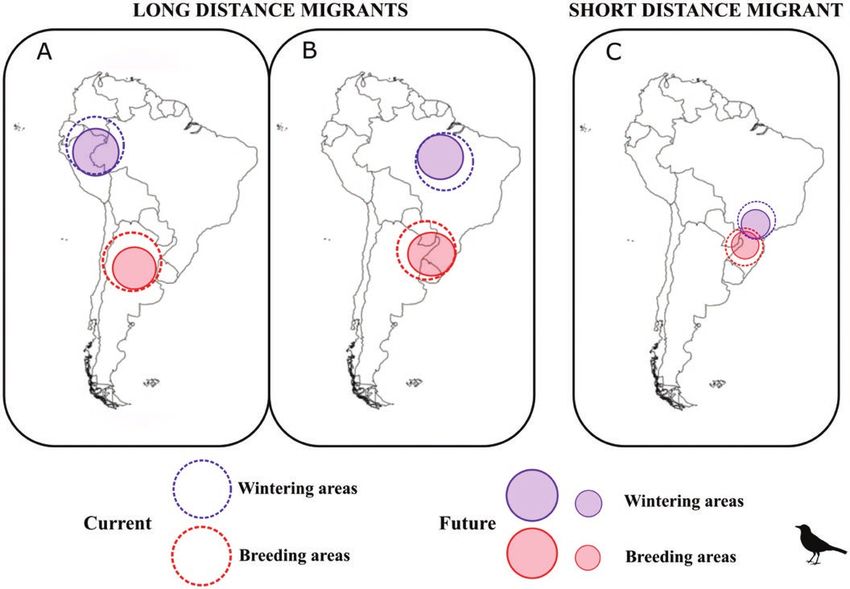
N. S. Da Silveira, M. H. Vancine, A. E. Jahn, et al.              Climate changes dynamics on South American migratory birds 3

result, Neotropical austral migration generally occurs over         experience a less pronounced reduction in breeding
shorter distances than does Nearctic–Neotropical migra-             and wintering areas than the 2 long-distance migrants
tion (Stotz et al. 1996, Jahn et al. 2004, Sekercioglu et al.       because local-scale processes, such as habitat fragmen-
2008, Faaborg et al. 2010). Given the different climatic and        tation and loss, which is widespread in the Atlantic
geographic contexts that migratory birds in South America           Rainforest biome (Ribeiro et al. 2009), tend to have a
live within as compared to their north-temperate counter-           greater influence on short-distance migratory strategies
parts, an evaluation of the potential for climate change            than processes that operate at larger spatial scales, such
to affect such populations throughout their annual cycle            as climate change (Dirnböck et al. 2003; Figure 1C). We

                                                                                                                                      Downloaded from https://academic.oup.com/condor/advance-article/doi/10.1093/ornithapp/duab006/6237321 by guest on 20 April 2021
offers a broader perspective on the potential effects of cli-       conclude with suggestions for future directions for cli-
mate change on birds across the planet and throughout the           mate vulnerability assessments for migratory birds in
year (La Sorte and Jetz 2010, Marra et al. 2015).                   South America, where the vulnerability of migratory
   We aimed to evaluate how the distribution of breeding            birds to current and future climate change throughout
and wintering areas of migratory birds in South America             their annual cycle is still poorly known.
may be affected under future climate change. Turdus
thrushes are an ideal model, because they are common mi-
grants on the continent; are found in a wide variety of habi-
tats, including urban areas (Pizo 2007, Gasperin and Pizo           METHODS
2009); and are relatively easy to identify, such that reliable
occurrence data from various sources are available. Turdus          We applied ecological niche modeling (ENM) approaches
thrushes also migrate in 3 major migratory flyways on the           to predict the current potential distribution of breeding
continent: short-distance Atlantic Rainforest altitudinal           and wintering areas and simulate the effects of future cli-
migration, in which birds migrate altitudinally within the          mate change on the breeding and wintering areas of 3 mi-
Atlantic Rainforest (e.g., Turdus flavipes; Maia-Gouvêa             gratory thrush species (i.e. T. nigriceps, T. subalaris, and
et al. 2005, Alves 2007); long-distance Atlantic Rainforest         T. flavipes). We gathered current and future bioclimatic
migration, a type of intra-tropical migration in which birds        data from WorldClim 1.4 (Hijmans et al. 2005) to assess
migrate latitudinally within the Atlantic Rainforest (e.g.,         current and future climate scenarios. We then integrated
Turdus subalaris in Brazil; Vogel 2014); and long-distance          occurrence data and bioclimatic data with 4 mathematical
Andean migration, a type of Neotropical austral migra-              algorithms and conducted an ensemble forecasting ap-
tion in which birds migrate latitudinally along the Andes           proach to predict future shifts in breeding and wintering
Mountains (e.g., Turdus nigriceps in Argentina; Capllonch           ranges in these species (Peterson et al. 2011). Although
et al. 2008).                                                       these ENMs do not account for the effects of land cover or
   We hypothesized that future climate change will af-              non-climatic factors (i.e. dispersal or biotic interactions),
fect the distribution of the breeding and wintering areas           the effects of climate are a reliable projection of effects of
(Figure 1) of long- vs. short-distance migrant Turdus               climate change at these spatial scales.
thrushes in different ways. Specifically, we expected that
the long-distance Andean migrant (T. nigriceps), which              Species Occurrence Data
migrates along the Andes mountains (hereafter, the                  Species occurrence data were obtained from eBird, which
Andean migratory flyway) would experience displace-                 uses automated filters and regional editors to ensure data
ments of breeding and wintering areas to higher eleva-              quality (Sullivan et al. 2014). The species we studied are
tions, since higher elevations in the Andes Mountains               highly vocal in summer and often occur in open habitats in
are in the vicinity of its current range (Figure 1A). We            winter, increasing their chance of detection. Nevertheless,
expected that the long-distance Atlantic Rainforest                 errors of omission by observers in eBird (due to obser-
migrant (T. subalaris), which migrates latitudinally                vers not being present when the study species is present
within the Atlantic Rainforest (hereafter, the Atlantic             or when the observer and study species are both present,
Rainforest migratory flyway), would experience a re-                but the latter goes undetected; Johnston et al. 2019) pose a
duction of breeding and wintering areas (Figure 1B),                potential bias in our analysis. We evaluated potential bias
since predicted changes in annual rainfall levels in this           in eBird observer coverage by using the Global Human
region, including a prolonged dry season (Scarano and               Footprint Index (HFI; Venter et al. 2016) and detected a
Ceotto 2015), should result in decreases in the breeding            tendency for a higher HFI during winter for T. flavipes
and wintering areas of tropical birds (Shaw and Kelly               and T. subalaris, with the opposite pattern in T. nigriceps
2013, Xu et al. 2017). We also expected that the short-             (Supplementary Material Information S1). This suggests
distance altitudinal migrant (T. flavipes), which migrates          that coverage by observers in eBird may be lower during
altitudinally within the Atlantic Rainforest (hereafter,            the breeding season for T. flavipes and T. subalaris and
the short-distance altitudinal migratory flyway), would             lower during winter for T. nigriceps. We therefore accessed

                                                        Ornithological Applications 123:1–16 © 2021 American Ornithological Society
4   Climate changes dynamics on South American migratory birds                             N. S. Da Silveira, M. H. Vancine, A. E. Jahn, et al.

                                                                                                                                                   Downloaded from https://academic.oup.com/condor/advance-article/doi/10.1093/ornithapp/duab006/6237321 by guest on 20 April 2021
FIGURE 1. Predicted effects of future climatic changes on the size and location of wintering and breeding areas of migratory Turdus
thrushes in South America: (A) a long-distance Andean migrant (T. nigriceps), (B) a long-distance Atlantic Rainforest migrant (T. subalaris),
and (C) a short-distance altitudinal migrant (T. flavipes).

online databases, the Global Biodiversity Information                   pixels, to further even out sample bias (clustering) in ob-
Facility (GBIF) and VertNet, because the use of such data-              server effort. To rarefy the occurrence points, the Spatially
bases has been shown to improve data coverage (Spears                   Rarefy Occurrence Data for SDMs tool from SDMtoolbox
2017). Finally, we supplemented species occurrence data                 2.4 of Arcgis 10.5 was used (Brown et al. 2017). In total,
using published studies (Mestre et al. 2011, Somenzari                  there were 334 occurrence records (n =334; n = 217
et al. 2011).                                                           breeding records and n = 117 wintering records).
   Available occurrence data range from 1980 to 2017 and
were divided into 2 categories: breeding areas (spring and              Climatic Variables
summer; September to March) and wintering areas (May to                 We used 2 different geographic backgrounds to build the
August) (Supplementary Material Figure S1). This division               ENMs, one for each species, using 2.5 arc-minute cell reso-
was based on the date and location (longitude and latitude)             lution (~5 × 5 km at the equator), because the ranges of the
of sampling events of individual birds and on information               study species are on the order of hundreds of kilometers
available in the literature on the annual cycles of these spe-          square and because elevational gradients in South America
cies (T. nigriceps, Capllonch et al. 2008; T. subalaris, Mestre         occur over tens to hundreds of kilometers. Given differ-
et al. 2011, Somenzari et al. 2011, Vogel 2014; T. flavipes,            ences in the spatial scale of breeding and wintering areas of
Alves 2007; Supplementary Material Table S1). All occur-                short- vs. long-distance migrants, we used different back-
rence records that did not have date and location infor-                ground regions to increase ENM accuracy of these migra-
mation were excluded from the analysis, as were duplicate               tion patterns (see Barve et al. 2011 for more information
occurrence data and city centroids.                                     about background selection criteria).
   Because occurrence records are often from areas of high                 We used the entire boundaries of South America as
human density, we plotted occurrence data in relation to                a background to build models of long-distance migra-
the Global Footprint Index map (Supplementary Material                  tions (T. nigriceps and T. subalaris) and used the Atlantic
Information S1). We conducted a spatial rarefaction of oc-              Rainforest Biome delimitation (Muylaert et al. 2018) to build
currence data with a minimum distance of 5 km between                   short-distance migration models. For each delimitation,

Ornithological Applications 123:1–16 © 2021 American Ornithological Society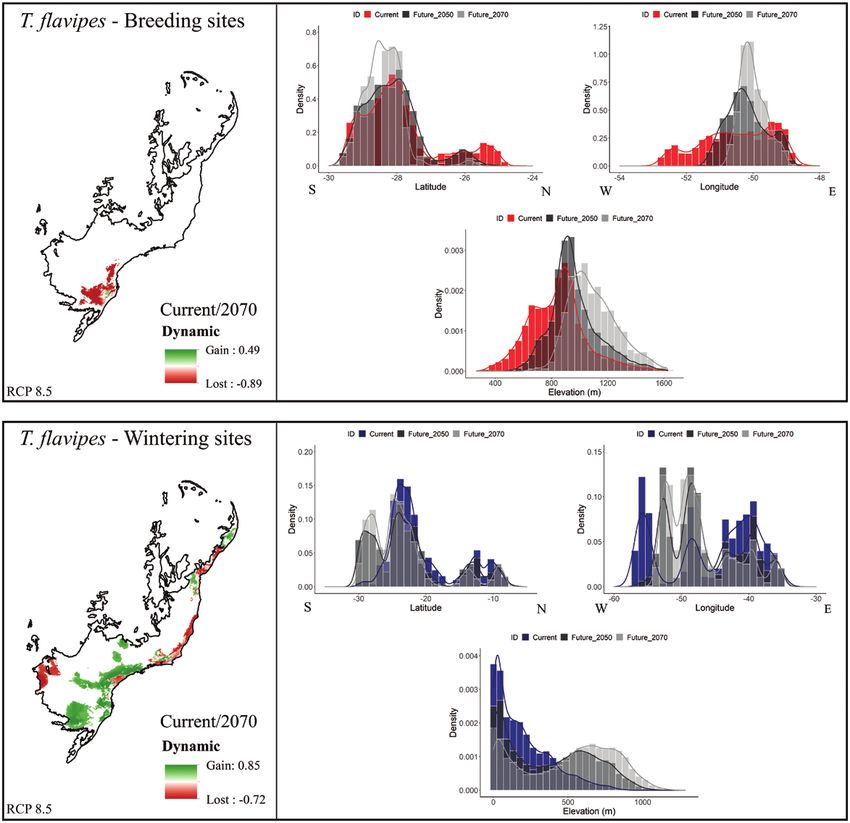
N. S. Da Silveira, M. H. Vancine, A. E. Jahn, et al.                 Climate changes dynamics on South American migratory birds 5

we downloaded all 19 bioclimates and conducted vari-                      We used True Skill Statistics (TSS) values (Allouche
able selection using Factor Analysis (Sobral-Souza et al.              et al. 2006) to conduct model evaluation. The TSS index
2015). For the long-distance migration models, we selected             calculation is based on values of sensitivity and specificity
7 bioclimatic variables: Mean Diurnal Range (bio02),                   of models, such that it is considered a threshold-dependent
Temperature Seasonality (bio04), Max Temperature                       index. To calculate TSS values, we inferred the “maximum
of the Warmest Month (bio05), Mean Temperature of                      sensitivity and specificity” threshold, recognized as the
the Wettest Quarter (bio08), Precipitation of the Driest               best threshold for use of presence-only methods (Liu et al.
Month (bio14), Precipitation of the Wettest Quarter                    2016), as in the case of the present study. To calculate this

                                                                                                                                       Downloaded from https://academic.oup.com/condor/advance-article/doi/10.1093/ornithapp/duab006/6237321 by guest on 20 April 2021
(bio16), and Precipitation of the Warmest Quarter (bio18)              threshold, we divided the occurrence records into training
(Supplementary Material Table S2). For short-distance mi-              and test folding, counting 75% and 25% of occurrence re-
gratory models (T. flavipes) using the Atlantic Rainforest             cords, respectively. This sub-setting procedure was ran-
delimitation, we selected 5 variables: Mean Diurnal Range              domized 10 times to decrease the autocorrelation between
(bio02), Isothermality (bio03), Mean Temperature of the                training and test folding (Peterson et al. 2011) and was run
Warmest Quarter (bio10), Precipitation of the Driest                   to build current predictions and then to predict future
Month (bio14), and Precipitation of the Wettest Quarter                models separately.
(bio16) (Supplementary Material Table S3). These climate                  We overlapped all maps using the frequency ensemble
variables (primarily based on temperature and precipita-               approach. To do so, we used the maximum sensitivity and
tion) have been shown to impact the ecology and move-                  specificity threshold value for each model, built to trans-
ments of migratory birds in South America (MacPherson                  form the continuous map into a binary map. Thereafter,
et al. 2018) and of tropical birds more generally (Şekercioglu         we concatenated the replicates of the same algorithms,
et al. 2012).                                                          as well as between algorithms. Thus, the number of cells
   To build future predictions and test the future effects of cli-     in the final distribution maps shows the standardized fre-
mate changes on breeding and wintering distributions, we used          quencies of predicted presences, combining all generated
climate projections to 2050 (i.e. the mid-point for the period         models of each study species for each temporal and emis-
2041–2060) and 2070 (the mid-point for the period 2061–2080)           sions scenario, for both breeding and wintering points
for 2 contrasting emissions scenarios (IPCC 2014): (1) IPCC            (Supplementary Material Figure S2).
AR-CMIP 5/RCP 4.5 (lower energy demand) and (2) IPCC                      To evaluate the effects of future climate change on
AR-CMIP 5/RCP 8.5 (i.e. maximum power requirement). We                 breeding and wintering areas, we transformed frequency
also used 3 different atmosphere–ocean general circulation             maps into binary maps using the least presence threshold
models (AOGCMs) to generate future climate models: CCSM4,              (LPT) for wintering and breeding areas, separately. The use
MIROC–ESM, and MRI. We selected these AOGCMs fol-                      of the LPT with the highest sensitivity and very low specifi-
lowing the protocol of Varela et al. (2015), who suggest the use of    city values (SE = 1) generates areas with no omission error,
different AOGCMs to reduce model uncertainty.                          selecting the area with all the known occurrences of a spe-
                                                                       cies in each scenario (Liu et al. 2013). We calculated these
Ecological Niche Models                                                LPT values for the current climatic scenario prediction and
To predict potential species distributions in current and              used those values to generate future scenarios.
future climate scenarios, we used ensemble forecasting                    All model ensembles were generated in language R
approaches based on the use of different ENM algo-                     (R Development Core Team 2018), using the bioclim,
rithms (Araújo and New 2007), which reduces the                        gower, and maxent functions of the dismo package
problem of variation inherent with using different types               (Elith and Franklin 2017), ksvm of the kernlab package
of algorithms that are needed to infer species distribu-               (Karatzoglou et al. 2004), and the raster package (Bivand
tions (Peterson et al. 2011). The ensemble forecast is re-             et al. 2019).
commended as a protocol for building ENMs (Araújo
et al. 2019) and is a widely used technique (Hao et al.                Dynamic Changes in Wintering and Breeding Site
2019). We used 4 algorithms to infer species distri-                   Distribution Under Climate Change
butions: (1) Bioclim (Envelope Score; Nix 1986), (2)                   To evaluate changes in wintering and breeding areas,
Domain (Gower Distance; Carpenter et al. 1993), (3)                    we constructed histograms of species occurrence as a
Maximum Entropy (MaxEnt, 3.3.3k; Philipps and Dudík                    function of elevation, latitude, and longitude across all
2008), and (4) Support Vector Machines (SVM; Tax and                   temporal scenarios (current, RCP4.5–2050, RCP4.5–
Duin 2004). We used these algorithms because we ap-                    2070, RCP8.5–2050, and RCP8.5–2070). We evaluated
plied 2 presence-only methods (Bioclim and Gower                       changes in local suitability by subtracting the values
Distance) and 2 machine learning approaches, based on                  of future models from the present model based on
presence and background methods (SVM and MaxEnt;                       frequency ensemble model pixels to infer areas with
Phillips et al. 2006, Li et al. 2011).                                 increasing and decreasing suitability as a result of future

                                                        Ornithological Applications 123:1–16 © 2021 American Ornithological Society
6 Climate changes dynamics on South American migratory birds N. S. Da Silveira, M. H. Vancine, A. E. Jahn, et al.
Downloaded from https://academic.oup.com/condor/advance-article/doi/10.1093/ornithapp/duab006/6237321 by guest on 20 April 2021
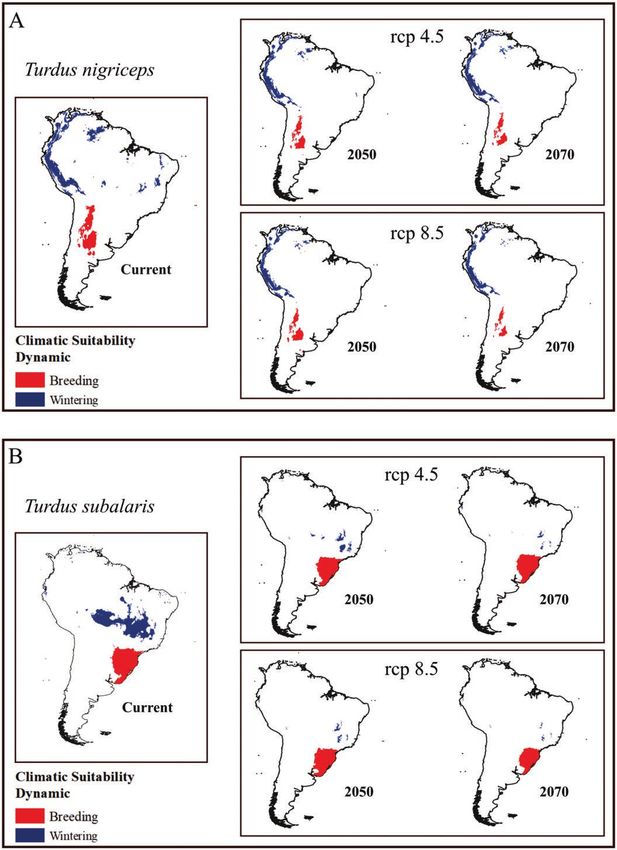
FIGURE 2. Seasonal distributions of 3 migratory Turdus thrushes in South America under future climate change scenarios: (A) a long-
distance Andean migrant (T. nigriceps), (B) a long-distance Atlantic Rainforest migrant (T. subalaris), and (C) a short-distance altitudinal
migrant (T. flavipes). Red bar areas correspond to breeding areas and blue bar areas to wintering areas.
Ornithological Applications 123:1–16 © 2021 American Ornithological SocietyN. S. Da Silveira, M. H. Vancine, A. E. Jahn, et al. Climate changes dynamics on South American migratory birds 7
Downloaded from https://academic.oup.com/condor/advance-article/doi/10.1093/ornithapp/duab006/6237321 by guest on 20 April 2021
FIGURE 2. Continued.
climate change. To test for changes in elevation, latitude, Small areas of the highest regions of the Southern Atlantic
and longitude of breeding and wintering areas, we built Rainforest appear to be appropriate breeding areas for the
and compared histograms of area values under future vs. short-distance altitudinal migrant (T. flavipes; Figure 2C),
current climate scenarios (frequency ensemble models) and a large area of the Atlantic Rainforest was estimated as
using a Wilcoxon test, which is a nonparametric statis- suitable for it to overwinter (Figure 2C). For future projec-
tical test that can be used when the distribution of the tions, we observed changes in the breeding and wintering
differences between the 2 samples cannot be assumed areas of the long-distance Andean migrant, losses of suit-
to be normally distributed (Wilcoxon 1946). We separ- able winter areas of the long-distance Atlantic Rainforest
ately compared samples from the current vs. future dis- migrant, and for the breeding areas of the short-distance
tribution values (for 2050 and 2070) in the 2 emissions altitudinal migrant (Figure 2).
scenarios.
Effects of Future Climate Changes on Wintering and
Breeding Areas
RESULTS Our findings suggest that there will be drastic effects
of future climate change on the breeding and wintering
Distribution of Wintering and Breeding Areas areas of these 3 South American migratory birds (Table
All models showed TSS values above 0.5, indicating a 1; Supplementary Material Figures S3–S8). Overall, our
good fit. Inferences of the potential current distribution results predict a substantial decrease in wintering area
of wintering and breeding areas indicated different pat- for the long-distance Andean migrant (T. nigriceps)
terns for each of the 3 species. Turdus nigriceps (Figure and even more so for the long-distance migrant in
2A) was estimated to breed near the Andes Mountains in the Atlantic Rainforest (T. subalaris), but not for the
Argentina, wintering in the Andes from Peru to Venezuela, short-distance altitudinal migrant (T. flavipes), which
and in smaller areas in lowland Brazil (Figure 2A). Turdus faces a drastic decrease of its breeding area (Table 1).
subalaris, the long-distance Atlantic Rainforest migrant Additionally, the absolute size of the future area of
(Figure 1B), was estimated to breed in southern Brazil and T. flavipes will increase, but in different places relative to
to overwinter in small areas in central Brazil (Figure 2B). its present-day suitable areas, retaining few present-day
Ornithological Applications 123:1–16 © 2021 American Ornithological Society8 Climate changes dynamics on South American migratory birds N. S. Da Silveira, M. H. Vancine, A. E. Jahn, et al.
regions in future projections (Supplementary Material
of area gained or lost. Negative values represent a loss of area as a percentage of the current distribution under future carbon emissions scenarios (RCP 4.5, 2050 and 2060;
TABLE 1. Size of the breeding and wintering areas predicted by present-day and future projection models. The areas are described in absolute size (km2) and in percentages
Turdus flavipes
71.00%
100.00%
62.09%
84.04%
182,116.03
311,432.53
364,583.03
295,207.98
335,175.69
Figures S7 and S8).
Our results suggest that future geographical shifts in
wintering and breeding areas will occur in relation to eleva-
tion, longitude, and latitude (Figures 3–5; Supplementary
Material Table S4), with displacements of breeding and
wintering areas to higher elevations for all 3 species
(Figures 3–5). Indeed, all simulations of future climate
Downloaded from https://academic.oup.com/condor/advance-article/doi/10.1093/ornithapp/duab006/6237321 by guest on 20 April 2021
scenarios pointed to the displacement of breeding and win-
–83.14%
–94.23%
–92.15%
–96.80%
Turdus subalaris
Wintering area
1,254,138.13
211,532.01
72,458.32
98,528.89
40,162.56
tering areas to higher elevations (Figures 3–5). Forecasts
showed a longitudinal displacement of the breeding range
of the long-distance Andean migrant (T. nigriceps) to the
west and a marked loss of suitability in its distribution to
the east (Figure 3). Notably, although we detected large
losses in its overall wintering area, we also noted a gain in
suitable areas in the Andes Mountains (Figure 3). Similarly,
we noted an overall major decrease in the suitability of the
Turdus nigriceps
–34.93%
–38.38%
–38.88%
–44.29%
wintering areas of the long-distance Atlantic Rainforest
859,664.22
559,436.71
529,745.23
525,486.86
478,962.15
migrant (T. subalaris) under future scenarios. Its breeding
areas tend to shift to the east and south, accompanied
by losses in areas to the west and to the north (Figure 4).
Results also indicate a reduction in breeding area for the
short-distance altitudinal migrant (T. flavipes), but an
overall increase in the size of its wintering area. Although
it is projected to lose wintering area to the north and west,
Turdus flavipes
it should experience gains to the south (Figure 5).
–26.12%
–49.09%
–49.10%
–79.71%
702,69.31
51,917.54
35,776.75
35,968.57
14,260.86
Results of the Wilcoxon tests reinforce patterns observed
for the 3 species. In almost all cases, we observed differences
between the suitability of the current and future projections
(P < 0.001), except for latitudinal and longitudinal values in a
few cases (Supplementary Material Table S4). Nonsignificant
RCP 8.5, 2050 and 2070) and positive values represent percent area gained.
latitudinal changes in breeding areas were observed for the
short-distance altitudinal migrant, T. flavipes, under both fu-
Turdus subalaris
ture year’s scenarios RCP 4.5 (Current/2050, w = 5222864,
–4.60%
–4.80%
–4.60%
–25.36%
Breeding area
822,639.02
784,742.18
783,236.93
784,580.39
614,070.19
P = 0.13) and in the breeding latitude of the long-distance
Andean migrant, T. nigriceps, under RCP 4.5 (Current/2070,
w = 155012843, P = 0.079). For wintering areas, no dif-
ference was observed in latitude for the long-distance
Atlantic Rainforest migrant, T. subalaris, under RCP 8.5
(Current/2050, w = 8128700, P = 0.32). A nonsignificant
longitudinal change in breeding areas was observed for the
long-distance Andean migrant under both future year’s
Turdus nigriceps
–41.00%
–52.50%
–42.20%
–68.70%
421,978.16
249,261.14
200,772.30
243,986.20
132,020.87
scenarios RCP 8.5 (Current/2050, w = 151125422, P = 0.75).
A summary of the results of the effects of future climate con-
ditions on elevation, latitude, and longitude for the 3 species
is presented in Supplementary Material Figures S9–S14 and
Tables S4 and S5.
DISCUSSION
RCP 4.5/2050
RCP 4.5/2070
RCP 8.5/2050
RCP 8.5/2070
RCP 4.5/2050
RCP 4.5/2070
RCP 8.5/2050
RCP 8.5/2070
Our results suggest a drastic effect of future climatic
Percentage
conditions on the wintering and breeding areas of 3 spe-
Current
cies of thrushes representing 3 migratory bird flyways
in South America. Although the projected effects are
Ornithological Applications 123:1–16 © 2021 American Ornithological SocietyN. S. Da Silveira, M. H. Vancine, A. E. Jahn, et al. Climate changes dynamics on South American migratory birds 9
Downloaded from https://academic.oup.com/condor/advance-article/doi/10.1093/ornithapp/duab006/6237321 by guest on 20 April 2021
FIGURE 3. Effects of future climate change on wintering and breeding areas across elevation, latitude, and longitude for the long-
distance Andean migrant (Turdus nigriceps). Maps on the left show losses or gains in terms of local suitability between current con-
ditions and the most drastic future climate projection (2070, rcp85). Histograms on the right show climate suitability in relation to
elevation and longitude/latitude for present-day and future projections under the higher carbon emissions scenario (2050, rcp85;
2070, rcp85). Red bar areas correspond to breeding areas and blue bar areas to wintering areas. Areas in dark gray represent the future
scenario for the year 2050 and areas in light gray the future scenario for the year 2070.
different for breeding and wintering areas, our models predict the effects of future climate change on bird mi-
predict overall reductions in the size of the breeding and gration in South America, point to the negative effects
wintering areas of migratory birds in South America, of climate change on seasonal distributions of migratory
with the exception of T. flavipes, for which there was birds in South America.
an overall gain in wintering area size (Supplementary Our results point to an overlap of wintering and
Material Figure S3). Additionally, our models predict breeding areas above 800 m, and significant future in-
shifts toward higher elevations, as well as shifts in lon- creases in the wintering area of the short-distance migrant
gitude and latitude. Overall, these findings, the first to species, T. flavipes, which usually overwinters below 800 m
Ornithological Applications 123:1–16 © 2021 American Ornithological Society10 Climate changes dynamics on South American migratory birds N. S. Da Silveira, M. H. Vancine, A. E. Jahn, et al.
Downloaded from https://academic.oup.com/condor/advance-article/doi/10.1093/ornithapp/duab006/6237321 by guest on 20 April 2021
FIGURE 4. Effects of future climate change on wintering and breeding areas across elevation, latitude, and longitude for the long-
distance Atlantic Rainforest migrant (Turdus subalaris). Maps on the left show losses or gains in terms of local suitability between
current conditions and the most drastic future climatic projection (2070, rcp85). Histograms on the right show climate suitability in
relation to elevation and longitude/latitude for present-day and future projections under the higher carbon emissions scenario (2050,
rcp85; 2070, rcp85). Red bar areas correspond to breeding areas and blue bar areas to wintering areas. Areas in dark gray represent the
future scenario for the year 2050 and areas in light gray the future scenario for the year 2070.
elevation (Alves 2007). The best-performing models were For the long-distance Andean migrant (T. nigriceps),
observed for the breeding season (Supplementary Material suitable wintering areas were predicted in central Brazil
Table S5), mainly due to the quality of breeding season and northern South America, where the species does not
data. As expected, data for wintering areas are scarce in occur, which may have occurred in part because this species
comparison with that for breeding areas, adding to the dif- is closely related to the long-distance Atlantic Rainforest
ficulty of evaluating the spatiotemporal dynamics of win- migrant (T. subalaris), and both may have similar climatic
tering areas (Alves 2007). requirements, increasing the possibility of competitive
Ornithological Applications 123:1–16 © 2021 American Ornithological SocietyN. S. Da Silveira, M. H. Vancine, A. E. Jahn, et al. Climate changes dynamics on South American migratory birds 11
Downloaded from https://academic.oup.com/condor/advance-article/doi/10.1093/ornithapp/duab006/6237321 by guest on 20 April 2021
FIGURE 5. Effects of future climate change on wintering and breeding areas across elevation, latitude, and longitude for the short-
distance altitudinal migrant (Turdus flavipes). Maps on the left show losses or gains in terms of local suitability between current con-
ditions and the most drastic future climatic projection (2070, rcp85). Histograms on the right show climate suitability in relation to
elevation and longitude/latitude for present-day and future projections under the higher carbon emissions scenario (2050, rcp85;
2070, rcp85). Red bar areas correspond to breeding areas and blue bar areas to wintering areas. Areas in dark gray represent the future
scenario for the year 2050 and areas in light gray the future scenario for the year 2070.
exclusion, as has been found in other Neotropical avian below 1,000 m and gains of suitability in regions higher
taxa (Gómez-Bahamón et al. 2020). than 4,000 m in the Andes. The displacement of suitable
areas westwards (i.e. higher longitude values) in breeding
Effects of Future Climate Changes on Wintering and areas also corroborates the gains in the Andean highlands.
Breeding Areas Although the availability of area can vary across elevations
We observed an upslope displacement of suitable areas (Elsen and Tingley 2015), a significant portion of these new
for both breeding and wintering areas across all future suitable areas, especially in the Andean highlands, will not
projections. Our findings suggest losses of suitable areas be covered by forest, which would be unsuitable for the 3
Ornithological Applications 123:1–16 © 2021 American Ornithological Society12 Climate changes dynamics on South American migratory birds N. S. Da Silveira, M. H. Vancine, A. E. Jahn, et al.
forest species we studied (Hansen et al. 2013, Tuanmu and relatively understudied migratory bird systems, such as
Jetz 2014). Neotropical austral and intra-tropical bird migration.
The effects of future climate changes on breeding Our results project future losses of breeding areas
and wintering areas of long-distance Atlantic of short-distance altitudinal migrants in the Atlantic
Rainforest migrants (Figure 2B) are similar to that Rainforest, supporting our prediction of future losses of
predicted for the long-distance Andean migrant suitable breeding areas (Figure 1). Species breeding up-
(T. nigriceps), with a future decrease in the extent of slope (above 800 m) may need to switch migratory routes if
their wintering area. Species that use this flyway are they need to shift their breeding areas to higher elevations
Downloaded from https://academic.oup.com/condor/advance-article/doi/10.1093/ornithapp/duab006/6237321 by guest on 20 April 2021
primarily found in winter in lower elevation riparian (Figure 3). Similarly, other taxonomic groups, such as small
forest, in the ecotone between the Amazonian and mammals (Rowe et al. 2015), other bird species (Freeman
Cerrado biomes (Alves 2007, Vogel 2014). Similarly, and Class Freeman 2014), and amphibians (Bustamante
their breeding areas will undergo overall size reduc- et al. 2005, Raxworthy et al. 2008) are predicted to move
tions, with projected displacements to the southeast to higher elevations. Nevertheless, how these species will
(i.e. toward higher elevations to the east and south; adapt to these changes is still an open question. They may
Figure 4). Thus, the longitudinal trend observed in be able to adapt by changes in their migratory behavior
the climatically extreme future projections can be ex- (Fiedler et al. 2004, Niven et al. 2004, Pulido and Berthold
plained by the expansion of breeding areas in southern 2010), but the resulting impacts of these changes on their
Brazil, including into higher elevations. Species that population dynamics are still unknown. In this context, fu-
are part of the long-distance Atlantic Rainforest ture prediction scenarios may help establish protocols for
flyway tend to inhabit the forest canopy during the the conservation of these species over the long term.
breeding season (Clement 2000); however, much of In the face of rapid climatic changes, we can expect im-
the Atlantic Rainforest is fragmented due to human portant changes for a wide variety of species, with some
activities (Ribeiro et al. 2009). Thus, even if our re- being more impacted than others (Bellard et al. 2012,
sults predict appropriate future climatic conditions Scheffers et al. 2016). Large-scale projections may not be
for breeding and wintering in the Atlantic Rainforest, equally accurate for all species and less accurate for win-
their dependency on forest canopy vegetation, com- tering areas than for breeding areas (Zurell et al. 2018),
bined with high levels of anthropogenic impacts on since winter distributions for many species are not yet
habitat (Supplementary Material Information S1), fully described. Although the species we studied are not
including forest fragmentation (Ribeiro et al. 2009), perfectly representative of all types of migratory birds in
may compromise their future population viability in South America, many bird species on the continent mi-
this region. Additionally, the area available for occu- grate as part of the same migratory systems as the species
pancy can be impacted by local mountain topography we studied (Stotz et al. 1996), such that these results indi-
(Elsen and Tingley 2015), such that understanding cate novel directions for future research on risks of rapid
how changes in both available area and habitat can in climate change for a broad suite of migrants. On the other
concert affect future suitability for a given species is a hand, at finer spatiotemporal scales, other non-climatic
major research challenge. abiotic factors are likely more important in molding the
ecology of species and may even change expected rela-
Dataset and Climate Prediction Models tionships (Spence and Tingley 2020). Considering the po-
The use of citizen science databases (e.g., eBird) has pro- tential for high levels of variation in fine-scale landscape
vided novel information about migratory bird ecology scenarios, future studies should focus on gaining a more
(Jackson et al. 2015, Lin et al. 2015, Coxen et al. 2017) spatially and temporally detailed understanding of the ef-
and has informed ENMs to evaluate the effects of climate fects of future climate change on migratory bird species in
on animal communities (Gonçalves et al. 2016, Newbold South America.
2018). Although citizen science data and broad-scale en- The relatively few studies on breeding and wintering
vironmental data (e.g., climate scenarios) have limitations areas of avian migrants in the Southern Hemisphere
(Wiens et al. 2009), the use of citizen science-based occur- are mainly due to the logistic difficulty associated with
rence data for South American birds is useful in generating tracking organisms at large scales, in addition to the lack
macroecological evaluations when corrections for biases of infrastructure for most countries in this region (Jahn
are applied, such as using multiple databases (e.g., VertNet) et al. 2004). However, emerging technologies and methods,
and by evaluating potential bias using resources such as including citizen science-based platforms, are making de-
the Global HFI (Supplementary Material Information S1). tailed research on bird migration more feasible across the
The use of such data in bird migration studies is relatively globe. Additionally, measuring such individual-level vari-
recent (Coxen et al. 2017, MacPherson et al. 2018), such ables as flight performance and dispersal ability could go
that its full potential has yet to be explored, especially in a long way in developing a more robust understanding of
Ornithological Applications 123:1–16 © 2021 American Ornithological SocietyN. S. Da Silveira, M. H. Vancine, A. E. Jahn, et al. Climate changes dynamics on South American migratory birds 13
how future change is likely to affect different populations crucial role of the accessible area in ecological niche modeling
across their annual cycle (La Sorte and Jetz 2010). We hope and species distribution modeling. Ecological Modelling
this study will inspire further research on the ecology and 222:1810–1819.
Bellard, C., C. Bertelsmeier, P. Leadley, W. Thuiller, and F. Courchamp
conservation of the rich assemblage of migratory birds
(2012). Impacts of climate change on the future of biodiversity.
across the rapidly changing South American landscape. Ecology Letters 15:365–377.
Bivand, R., T. Keitt, B. Rowlingson, E. Pebesma, M. Summer,
SUPPLEMENTARY MATERIAL R. Hijmans, E. Rouault, F. Warmerdam, J. Ooms, and C. Rundel
(2019). Package rgdal: Bindings for the “Geospatial” Data
Downloaded from https://academic.oup.com/condor/advance-article/doi/10.1093/ornithapp/duab006/6237321 by guest on 20 April 2021
Abstraction Library. R package version 1.4-8 0. https://cran.r-
Supplementary material is available at Ornithological project.org/package=rgdal
Applications online. Both, C., C. A. M. Van Turnhout, R. G. Bijlsma, H. Siepel, A. J. Van
Strien, and R. P. B. Foppen, (2010). Avian population conse-
quences of climate change are most severe for long-distance
ACKNOWLEDGMENTS migrants in seasonal habitats: Proceedings of the Royal Society
B: Biological Sciences 277:1259–1266.
We thank M. C. Ribeiro and V. Tonetti for help in the ini- Brown, J. L., J. R. Bennett, and C. M. French (2017). SDMtoolbox 2.0:
tial conception of the study and are grateful to P. Capllonch, The next generation Python-based GIS toolkit for landscape
eBird, GBIF, and VertNet for providing occurrence data. We genetic, biogeographic and species distribution model ana-
would like to thank the reviewers, the Associate Editor, and lyses. Peerj 5:e4095.
the editor-in-chief for the suggestions and the improvement Bustamante, M. R., S. R. Ron, and L. A. Coloma (2005). Cambios en
of the manuscript. la diversidad en siete comunidades de anuros en los Andes de
Funding statement: N.S.S. and M.A.P. receive a research grant Ecuador. Biotropica 37:180–189.
from the Brazilian Council for Scientific and Technological Capllonch, P., K. Soria, and D. Ortiz (2008). Comportamiento
Development (CNPq) (grant number 146979/2016-8), which migratorio del zorzal plomizo (Turdus nigriceps nigriceps) en
together with the Department of Zoology at the State University Argentina. Ornitologia Neotropical 19:161–174.
of São Paulo—Campus Rio Claro funded the research. Carpenter, G., A. N. Gillison, and J. Winter (1993). DOMAIN: A flex-
Ethics statement: In this research, we used all data from on- ible modelling procedure for mapping potential distribu-
line databases. We follow all protocols established by these tions of plants and animals. Biodiversity and Conservation
databases (Ebird, VertNet, GBIF, and Wordclim 1.4). 2:667–680.
Chesser, R. T. (1994). Migration in South America: An overview of
Author contributions: N.S.S., T.S.S., M.H.V., A.E.J., and
the austral system. Bird Conservation International 4:91–107.
M.A.P. formulated the idea; N.S.S. organized the dataset;
Clement, P. (2000). Thrushes. Princeton University Press, Princeton,
N.S.S. and M.H.V. analyzed the data; and N.S.S., T.S.S., M.H.V., NJ, USA.
A.E.J., and M.A.P. wrote the manuscript. All authors contributed Coppack, T., F., Pulido, M. Czisch D. P. Auer, and P. Berthold (2003)
to editing and improving several versions of the manuscript. (2003). Photoperiodic response may facilitate adaptation to
Data availability: The authors confirm that the data sup- climatic change in long-distance migratory birds. Proceedings
porting the findings of this study are available within the ar- of the Royal Society B: Biological Sciences 270.
ticle and in Supplementary Material Table S1. Coxen, C. L., J. K. Frey, S. A. Carleton, and D. P. Collins (2017).
Species distribution models for a migratory bird based on
citizen science and satellite tracking data. Global Ecology and
LITERATURE CITED Conservation 11:298–311.
Dingle, H. (2008). Rowley review. Bird migration in the
Allouche, O., A. Tsoar, and R. Kadmon (2006). Assessing the ac- southern hemisphere: A review comparing continents. Emu
curacy of species distribution models: Prevalence, kappa 108:341–359.
and the true skill statistic (TSS). Journal of Applied Ecology Dirnböck, T., S. Dullinger, and G. Grabherr (2003). A regional im-
43:1223–1232. pact assessment of climate and land-use change on alpine
Alves, M. A. S. (2007). Sistemas de migrações de aves em ambientes vegetation. Journal of Biogeography 30:401–417.
terrestres no Brasil: exemplos, lacunas e propostas para o avanço Elith, J., and J. Franklin (2017). Species distribution modeling.
do conhecimento. Revista Brasileira de Ornitologia 15:231–238. Reference Module in Life Sciences 5.90-5.95. doi:10.1016/
Araújo, M. B., R. P. Anderson, A. M. Barbosa, C. M. Beale, b978-0-12-809633-8.02390-6
C. F. Dormann, R. Early, R. A. Garcia, A. Guisan, L. Maiorano, Elsen, P. R., and M. W. Tingley (2015). Global mountain topography
B. Naimi, et al. (2019). Standards for distribution models in bio- and the fate of montane species under climate change. Nature
diversity assessments. Science Advances 5 :5.40-5.45. Climate Change 5:772–776.
Araújo, M. B., and M. New (2007). Ensemble forecasting of species Faaborg, J., R. T. Holmes, A. D. Anders, K. L. Bildstein, K. M. Dugger,
distributions. Trends in Ecology & Evolution 22:42–47. S. A. Gauthreaux, P. Heglund, K. A. Hobson, A. E. Jahn,
Barçante, L., M. M. Vale, and M. A. Maria (2017). Altitudinal migra- D. H. Johnson, S. C. Latta, et al. (2010). Recent advances in
tion by birds: A review of the literature and a comprehensive understanding migration systems of New World land birds.
list of species. Journal of Field Ornithology 88:321–335. Ecological Monographs 80:3–48.
Barve, N., V. Barve, A. Jiménez-Valverde, A. Lira-Noriega, S. P. Fiedler, W., F. Bairlein, and U. Köppen (2004). Using large-scale
Maher A. T. Peterson, J. Soberón, and F. Villalobos (2011). The data from ringed birds for the investigation of effects of
Ornithological Applications 123:1–16 © 2021 American Ornithological Society14 Climate changes dynamics on South American migratory birds N. S. Da Silveira, M. H. Vancine, A. E. Jahn, et al.
climate change on migrating birds: Pitfalls and prospects. Jonzén, N., A. Lindén, T. Ergon, E. Knudsen, J. O. Vik, D. Rubolini, D.
Advances in Ecological Research 35:49–67. Piacentini, C. Brinch, F. Spina, L. Karlsson, M. Stervander, et al.
Freeman, B. G., and A. M. Class Freeman (2014). Rapid upslope (2006). Rapid advance of spring arrival dates in long-distance
shifts in New Guinean birds illustrate strong distributional migratory birds. Science 312:1959–1961.
responses of tropical montane species to global warming. Joseph, L. (1997). Towards a broader view of neotropical migrants:
Proceedings of the National Academy of Sciences USA Consequences of a re-examination of austral migration.
111:4490–4494. Ornitología Neotropical 8:31–36.
Gasperin, G., and M. A. Pizo (2009). Frugivory and habitat use by Karatzoglou, A., K. Hornik, A. Smola, and A. Zeileis (2004).
thrushes (Turdus spp.) in a suburban area in south Brazil. Urban kernlab—An S4 package for kernel methods in R. Journal of
Downloaded from https://academic.oup.com/condor/advance-article/doi/10.1093/ornithapp/duab006/6237321 by guest on 20 April 2021
Ecosystems 12:425–436. Statistical Software 11:1–20.
Gómez-Bahamón, V., R. Márquez, A. E. Jahn, C. Y. Miyaki, D. T. Knudsen, E., A. Lindén, C. Both, N. Jonzén F. Pulido, N. Saino, W. J.
Tuero, O. Laverde-R, S. Restrepo, and C. D. Cadena (2020). Sutherland, L. A. Bach, T. Coppack, T. Ergon, P. Gienapp, et al.
Speciation associated with shifts in migratory behavior in an (2011). Challenging claims in the study of migratory birds and
avian radiation. Current Biology 30:1312–1321.e6. climate change. Biological Reviews 86:928–946.
Gonçalves, J., J. P. Honrado, J. R. Vicente, and E. Civantos (2016). A La Sorte, F. A., D. Fink, and A. Johnston (2019). Time of emergence
model-based framework for assessing the vulnerability of low of novel climates for North American migratory bird popula-
dispersal vertebrates to landscape fragmentation under envir- tions. Ecography 42:1079–1091.
onmental change. Ecological Complexity 28:174–186. La Sorte, F. A., and W. Jetz (2010). Projected range contractions of
Hansen, M. C., P. V. Potapov, R. Moore, M. Hancher, S. A. Turubanova, montane biodiversity under global warming. Proceedings of
A. Tyukavina, D. Thau, S. V. Stehman, S. J. Goetz, T. R. Loveland, the Royal Society B: Biological Sciences 277:3401–3410.
et al. (2013). High-resolution global maps of 21st-century Li, W., Q. Guo, and C. Elkan (2011). Can we model the probability
forest cover change. Science 342:850–853. of presence of species without absence data? Ecography
Hao, T., J. Elith, G. Guillera-Arroita, and J. J. Lahoz-Monfort (2019). 34:1096–1105.
A review of evidence about use and performance of species Lin, Y. P., D. Deng, W. C. Lin, R. Lemmens, N. D. Crossman, K. Henle,
distribution modelling ensembles like BIOMOD. Diversity and and D. S. Schmeller (2015). Uncertainty analysis of crowd-
Distributions 25:839–852. sourced and professionally collected field data used in spe-
Hijmans, R. J., S. E. Cameron, J. L. Parra, P. G. Jones, and A. Jarvis cies distribution models of Taiwanese moths. Biological
(2005). Very high resolution interpolated climate surfaces Conservation 181:102–110.
for global land areas. International Journal of Climatology Liu, C., G. Newell, and M. White (2016). On the selection of thresh-
25:1965–1978. olds for predicting species occurrence with presence-only
IPCC (2014). Climate Change (2014). Synthesis Report. Contribution data. Ecology and Evolution 6:337–348.
of Working Groups I, II and III to the Fifth Assessment Report of Liu, C., M. White, and G. Newell (2013). Selecting thresholds for
the Intergovernmental Panel on Climate Change (Core Writing the prediction of species occurrence with presence-only data.
Team, R.K. Pachauri and L.A. Meyer, Editors). IPCC, Geneva, Journal of Biogeography 40:778–789.
Switzerland. MacPherson, M. P., A. E. Jahn, M. T. Murphy, D. H. Kim, V. R. Cueto,
Huntley, B., Y. C. Collingham, R. E. Green, G. M. Hilton, C. Rahbek, D. T. Tuero, and E. D. Hill (2018). Follow the rain? Environmental
and S. G. Willis (2006). Potential impacts of climatic change drivers of Tyrannus migration across the New World. The Auk:
upon geographical. Ibis. 148:8–28. Ornithological Advances 135:881–894.
Jackson, M. M., S. E. Gergel, and K. Martin (2015). Citizen science and Maia-Gouvêa, E. R., É. Gouvêa, and A. Piratelli (2005). Comunidade
field survey observations provide comparable results for map- de aves de sub-bosque em uma área de entorno do Parque
ping Vancouver Island White-tailed Ptarmigan (Lagopus leucura Nacional do Itatiaia, Rio de Janeiro, Brasil. Revista Brasileira de
saxatilis) distributions. Biological Conservation 181:162–172. Zoologia 22:859–866.
Jahn, A. E., V. R. Cueto, M. C. Sagario, A. M. Mamani, J. Q. Vidóz, Marra, P. P., E. B. Cohen, S. R. Loss, J. E. Rutter, and C. M. Tonra
J. L. De Casenave, and A. G. Di Giacomo (2009). Breeding and (2015). A call for full annual cycle research in animal ecology.
winter site fidelity among eleven Neotropical austral migrant Biology Letters 11:3.10-3.15.
bird species. Ornitologia Neotropical 20:275–283. Mestre, L. a M., J. Rechetelo, M. A Cochrane, and J. Barlow (2011).
Jahn, A. E., D. J. Levey, V. R. Cueto, J. P. Ledezma, D. T. Tuero, Avifaunal inventory of a southern Amazonian transitional
J. W. Fox, and D. Masson (2013). Long-distance bird migration forest site: The São Luiz farm, Mato Grosso, Brazil. Boletim do
within South America revealed by light-level geolocators. The Museu Paraense Emílio Goeldi, Ciências Naturais 6:147–161.
Auk 130:223–229. Muylaert, R. L., M. H. Vancine, R. Bernardo, J. E. F. Oshima, T. Sobral-
Jahn, A. E., D. J. Levey, and K. G. Smith (2004). Reflections across Souza, V. R. Tonetti, B. B. Niebuhr, and M. C. Ribeiro (2018). A
hemispheres: A system-wide approach to New World bird mi- note on the territorial limits of the Atlantic forest. Oecologia
gration. The Auk 121:1005–1013. Australis 22:302–311.
Johnston, A., W. Hochachka, M. Strimas-Mackey, V. Ruiz Gutierrez, Newbold, T. (2018). Future effects of climate and land-use change
O. Robinson, E. Miller, T. Auer, S. Kelling, and D. Fink (2019). on terrestrial vertebrate community diversity under different
Analytical guidelines to increase the value of citizen science scenarios. Proceedings of the Royal Society B: Biological
data: Using eBird data to estimate species occurrence. bioRxiv Sciences 285:9.35-9.40.
574392. https://doi.org/10.1101/574392 Newton, I. (2008). The Migration Ecology of Birds. Academic,
Jones, T., and W. Cresswell (2010). The phenology mismatch hy- London. London, UK.
pothesis: Are declines of migrant birds linked to uneven global Niven, D. K., J. R. Sauer, G. S. Butcher, and W. A. Link (2004).
climate change? Journal of Animal Ecology 79:98–108. Christmas Bird Count provides insights into population
Ornithological Applications 123:1–16 © 2021 American Ornithological SocietyYou can also read