Future freshwater availability in Cape Town - Student Theses ...
←
→
Page content transcription
If your browser does not render page correctly, please read the page content below

Future freshwater availability in Cape Town
The impact of Climate Change on annual precipitation in the Cape area.

 Bachelor’s thesis
 Human Geography and Urban and Regional Planning
 Student: Thom Horlings
 Student Number: S3416801
 Coördinator: G. Mallon
 Submission date: June 11, 2021

 1
Abstract
From 2015 to 2018, Cape Town, South Africa experienced serious drought resulting in a water crisis.
A combination of increased water demand, population growth and a large dependency on surface
water makes the Cape Town water systems vulnerable for long periods of decreased precipitation.
96% of all freshwater for the city is coming from a network of dams, all dependent on precipitation in
the winter period to replenish. This research focuses on calculating the future fresh water supply for
Cape Town by working out the implications of various climate scenarios on the precipitation in Cape
Town and translating these predictions to the actual supply of freshwater in the dam reservoirs. A
combination of secondary data sources has been used for this study. An analysis on both dam levels
and precipitation showed the relation between precipitation and dam levels. Future precipitation for
various climate change scenarios has been calculated and show a decrease of precipitation for each
scenario, supporting the findings of other researches and predictions. The precipitation predictions
have been used to calculate possible future dam levels under the scenarios. The decrease of
precipitation results in a decrease of dam levels, and thus the freshwater availability. This shows that
Cape Town will need to diversify its water sources in order to be able to keep up with the growing
demand and be more resilient to periods with decreased precipitation or extreme weather events.

 2
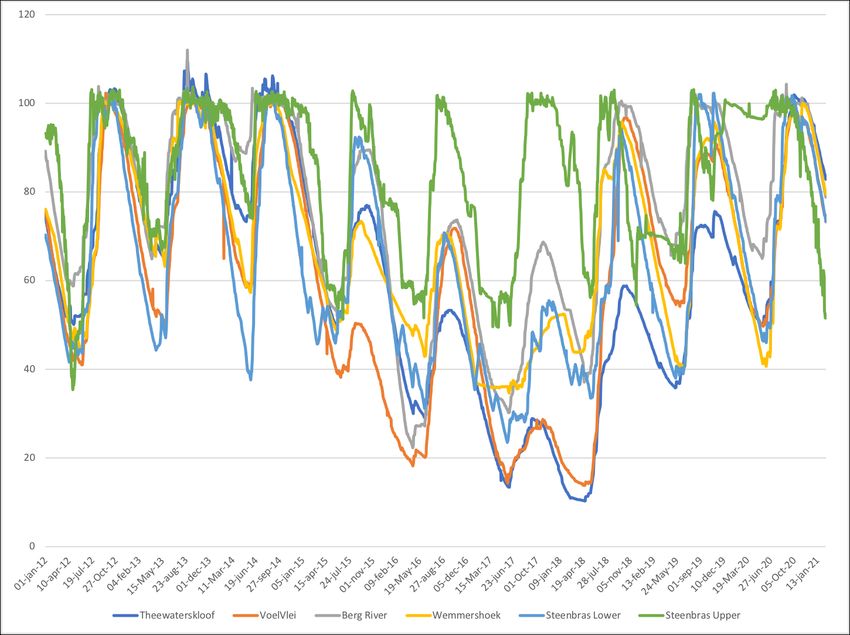
Table of contents

 1 Introduction 4

 1.1 Background 4

 1.2 Research Problem 4

 1.3 Structure 5

 2 Theoretical Framework 5

 2.1 Literature review 5

 2.2 Conceptual Model 7

 2.3 Expected results 7

 3 Methodology 7

 4 Results 10

 4.1 Dam Levels 10

 4.2 Precipitation 13

 4.3 Precipitation / Dam Levels 15

 4.4 Climate Change Impact 16

 4.5 Climate Change / Precipitation 19

 4.6 Societal impact 19

 5 Concluding Paragraph 17

 5.1 Conclusion 17

 5.2 Research recommendations 20

 5.3 Limitations 20

 References 22

 3
1 Introduction

1.1 Background
The dams that supply freshwater to the city of Cape Town dropped to 21% of their capacity in May
2018. The final 10% is difficult to extract for human consumption (Natalie et al, 2019). Therefore, the
city developed a plan which would come into place if the capacity dropped further to 13.5%, this
scenario is referred to as ‘Day Zero’ or ‘The day that the taps run dry’. The plan included centralized
distribution points where citizens could collect 25 liters per day (Natalie et al., 2019; Millington &
Scheba, 2021). Day Zero has been averted due to strict water usage restrictions (Mahr, 2018) and
early winter rains (Natalie et al., 2019). The water use was restricted to 50 liters per person (Holder &
Kommenda, 2018; Sousa et al, 2018). To achieve this Capetonians had to reuse their shower water,
limit their loo flushes and recycle water from their washing machines (Mahr, 2018). The drinking
water of Cape Town is mainly coming from dam reservoirs located in the near proximity of the city
(City of Cape Town, 2018). Due to longer droughts and an increasing population the city of Cape
Town is facing difficulties in supplying enough fresh drinking water (Wilson, 2018). The water
scarcity reached its peak in the summer of 2018, after a 3-year period of decreased precipitation (Otto
et al., 2018). The economic consequences of this drought are estimated at 400 million US dollar in
agriculture losses, 30.000 job losses and a 13-20% decrease in exports (OECD, 2021).

Cape Town is highly dependent on surface water sources for its water supply. Precipitation is
collected in various dam reservoirs in and around Cape Town. These reservoirs rely mostly on
precipitation in the winter period to replenish and provide the city with freshwater in the dry summer
months (City of Cape Town, 2020). This large dependency on rainfall becomes increasingly a
problem for Cape Town due to the expected decrease in precipitation. Climate change will impact
weather patterns all over the world, including precipitation patterns (IPCC, 2015). The impact of
climate changes on weather patterns varies for each location, natural factors and the intensity of
climate change. For the Cape Town area a decrease in precipitation has been predicted (Trenberth,
2011; IPCC, 2017). Changes in precipitation patterns will affect the freshwater availability for many
regions in the world (Jackson et al., 2001). Research is necessary to predict the implications and
prepare accordingly.

1.2 Research Problem
The aim of the research is to investigate the impact of climate change on the freshwater availability of
Cape Town. Cape town is highly dependent on winter rainfall that is stored in a network of 14 dam
reservoirs. These dams are Cape Town's main source for freshwater, since they are responsible for
98% of Cape Town’s water supply (City of Cape Town, 2020). A change in precipitation will
therefore have a large influence on the water availability. The relation between precipitation and water
levels in the dam reservoirs will be investigated, this relation will be used to predict future dam levels
by looking at the predictions for precipitation patterns in the specific area. Since the climate
predictions are still highly uncertain the four climate scenarios from the IPCC (2015, 2017) will be
used, this allows to investigate the effects of climate change, while implementing the uncertainty of
climate change in the research.

The findings will help understand the relation between precipitation and actual catchment of rainwater
in the reservoirs and will help predict future water availability from precipitation in the Cape Town
area. The following main research question has been formulated:

 4
What impact does a change in precipitation patterns have on the future freshwater availability of
 Cape Town, South Africa?

To answer the main research question the following sub questions have been formulated:
 1. What is the relation between historic precipitation and dam levels?
 2. What is the expected effect of various climate change scenarios on precipitation patterns?
 3. What is the expected future freshwater availability in Cape Town?

1.3 Structure
This paper has five chapters. In chapter one the topic is introduced, the aim of the research is
explained, and the research problem is defined. Chapter two includes the theoretical framework in
which the main concepts are defined. Furthermore, the conceptual model and expected results are
positioned here. Chapter three contains the methodology, where the data collection and research
methods are explained. The results are presented in chapter four. Chapter five contains the
conclusions, future research suggestions and limitations, in this section the results and theory will be
combined in order to answer the research questions.

2 Theoretical framework

2.1 Literature review
Precipitation is a part of the water cycle, precipitation consists of evaporated water from the oceans
and water transpired from plans and soil (Jackson et al., 2001). Trenberth (2011) explains the
hydrological cycle as water that is evaporated by the sun’s radiation, which is then moved by wind,
forms clouds and eventually falls back on the earth’s surface as rain or snow. The water will then find
its way back to the oceans through rivers, completing the cycle. In South Africa most precipitation
falls in the form of rain (Cape Town, 2019). Most of South Africa receives summer rainfall, whereas
Cape Town receives most of its rainfall in the winter months. Primarily due cold fronts tracking
eastwards across the South Atlantic (Natalie et al., 2019). This rainwater is collected in a network of
14 dams, with a collective capacity of around 900.000 Ml, however most of this capacity comes from
the six largest dams located outside the city itself. The catchment areas of these dams are the
mountainous areas outside the city where rainfall is higher than in Cape Town itself (City of Cape
Town, 2018).

Otto et al. (2018) investigated the 2015-2018 water shortage to find out the causes and the change of
reoccurrence. They found evidence that a lack of precipitation in the catchment areas was the key
variable in the historic droughts. Furthermore, they established that the drought was a very rare event,
but climate change has significantly increased the chance of prolonged droughts to occur in the future.
Climate change will influence the water cycle and precipitation patterns, mainly increasing the
extremes (Trenberth, 2011). Human-induced environmental change has its impact on the hydrological
cycle, and the use of water as a resource. However, the hydrological change can have different
impacts in varying areas (Arnell, 2014). Changes in precipitation and evaporation aspects of the water
cycle will directly influence the freshwater availability of Cape Town since the city is largely
dependent on the freshwater reservoirs for its drinking water supply. A projected decrease in
precipitation and an increase in evaporation for the Cape Town area will decrease the supply of
drinking water from the dams, resulting in the need for Cape Town to control demand carefully and
diversify its water supply sources (City of Cape Town, 2018; Ziervogel, 2018).

 5
The Earth’s climate has been changing throughout history, mainly due to variations in the Earth’s
orbit that dictate the amount of solar energy our planet receives (NASA, n.d.). However, the current
trend of global warming is extremely likely to be caused by human activity at a much faster pace than
ever recorded. An important indicator is the amount of carbon dioxide in the atmosphere, currently
exceeding 400 parts per million (IPCC, 2015). The Intergovernmental Panel on Climate Change
(IPCC) has been studying the changing climate since 1988 and published several influential reports on
this topic. Four scenarios for global temperature increase have been made based on a set of variables
including population, economic growth and carbon use (Raftery et al., 2017; IPCC, 2015). These
scenarios are called Representative Concentration Pathways (RCP) and include a stringent scenario
(RCP2.6), two moderate scenarios (RCP4.0 and RCP6.0) and one scenario with very high GHG
emissions (RCP8.5) (IPCC, 2015). These scenarios are used to predict the effects of global warming
on various natural processes such as surface temperature, sea ice, sea level and acidity of the oceans.

In 2015, 196 countries signed the Paris Agreement, an international treaty that binds the countries to
put efforts to limit global warming by as much as 2 degrees celsius, while aiming for 1,5 degrees,
compared to pre-industrial levels (Rogelj et al., 2016). The degree to which these countries will
succeed in the reduction of their greenhouse gas emissions will largely determine which of the IPCC’s
RCP scenarios will become reality. A global increase of temperature will affect natural processes like
precipitation patterns. However, these changes will not be uniform for all areas (Arnell, 2014).
Precipitation is likely to increase in higher latitudes, while mid-latitude and subtropical dry regions
precipitation will likely decrease (Trenberth, 2011; IPCC, 2015). For the Cape Town areas
specifically, a decrease of precipitation is projected (IPCC, 2013; IPCC 2017). Whereas precipitation
changes are sometimes predicted differently by various models, a decrease of precipitation is shown
in over 90% of the models of Dosio et al. (2019). The actual consequences of global warming on
precipitation will depend on the actual increase of greenhouse gasses in the atmosphere.

Sousa et al. (2018) concluded that severe events like the South African 2015-2018 drought can be
expected to occur more often in the future. They also stated that even though dam levels have
recovered from the drought the situation remains critical as water use continuously needs to be
monitored. It should be remembered that change in precipitation is not the only variable regarding
water scarcity, the growing population and increasing water use also pressures water demand (Sousa
et al., 2018). Furthermore, Cape Town is a highly unequal city and water scarcity is a day-to-day
reality for many lower-class Capetonians; concern is that the pressing climate crisis will further
increase these existing inequalities (Millington & Sheba, 2021). Informal settlements often lack good
water availability as residents have to stand in line at standpipes for water (Ziervogel, 2018), this
reflects in the water consumption as informal settlements use 3.6% of the total water consumption
while formal settlements consume 64.5% (Parks et al., 2019).

 6
2.2 Conceptual model

 Figure 1. Conceptual model

As seen in figure 1, a simplified version of the freshwater supply in Cape Town is represented.
Precipitation in the catchment areas will make its way to the dam reservoirs. In these reservoirs it will
be subject to evaporation which slowly reduces the total amount of water in the reservoirs. The total
amount of water in the dam reservoirs is not the total amount of freshwater available for use at any
specific moment, since the last 10% can hardly be extracted with the current infrastructure (Natalie et
al, 2019). Climate change will most certainly affect the precipitation patterns and evaporation, and
therefore influencing the availability of freshwater. This research will focus on the effects of climate
change on the precipitation in the Cape Town area, and its direct impact on the freshwater availability.
The effect of climate change on evaporation is not a focus of the study and will therefore not be
discussed extensively, however it should be reminded that global warming will likely increase the
evaporation and therefore influence the freshwater supply as well.

2.3 Expected results
It is expected that there will be a relationship between precipitation and the water levels in the dam
reservoirs. Also, it is expected that annual precipitation will decrease in the Cape Town area, and that
this is correlated with global warming as the IPCC (2015, 2017) suggests. Furthermore, this decrease
in precipitation will most likely result in lower dam levels and less freshwater in the future since we
expect the precipitation to be correlated with the dam water levels.

3 Methodology
For this research secondary data has been analyzed. The main data that was used are the historic dam
levels from the City of Cape Town Open Data Portal, historic precipitation records of the Cape Town
area retrieved from NASA, and predictions in precipitation patterns from the IPCC. Lastly spatial data
on the dam areas will be needed for the analysis. Secondary data was used since the gathering of
primary data is beyond the possibilities of this thesis, since climatic data needs to be collected over a
longer period of time and requires specific tools. Since all data is secondary climate data is does not
contain any personal information or other ethical sensitive data. The main ethical consideration is to
reference all data sources correctly.

Firstly, a profile of the daily water levels in the dam reservoirs has been made. This dataset is coming
from the City of Cape Town Open Data Portal and has daily data on all 14 dams from 2012 onwards.
The profile exists out of a graph of the dam levels of the six largest dams combined and a graph
showing the dam levels separately to allow for comparison between the dams.

 7
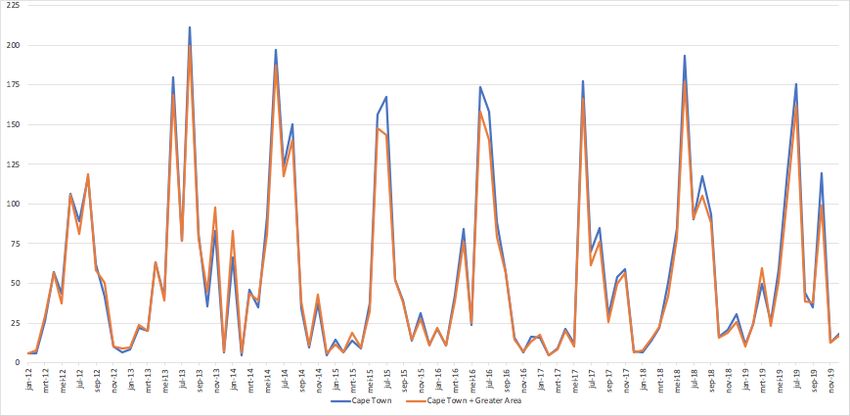
Figure 2. Spatial representation of the studied area. The frame shows the area of which precipitation
data was collected, referred to as ‘Greater Cape Town Area’. The red dots show the location of the six
 largest dams in ascending order of volume: 1=Theewaterskloof, 2=VoelVlei, 3=Berg River,
 4=Wemmershoek, 5= Steenbras Lower, 6=Steenbras Upper.

Next to a profile of the dam levels a profile of monthly precipitation in the Cape Town area has been
made to gain a better understanding of the precipitation patterns of the last decades. For this analysis
there is a distinction between precipitation from Cape Town and from Cape Town, including a greater
area, from now on referred to as Cape Town Greater Area. This greater area is included since the six
largest dams, providing almost all of the freshwater, are located outside Cape Town itself. The Cape
Town Greater Area and spatial locations of the six largest dams can be seen in Figure 2.
The original precipitation data from NASA is the average precipitation for a grid of 0.5x0.5 degrees,
the Greater Cape Town Area is a square of 3x3 of these grids. The average precipitation of these 9
grids has been combined to compute a working average which can be used for analysis. In order to
test for trends in the precipitation data a Seasonal Mann-Kendall test has been conducted. This test is
a non-parametric test that tests for monotonic trends in seasonal data. For this test the whole dataset of
precipitation data was used, resulting in 38 years of usable data. The tested time period is from 1981
until 2019. The significance level for this test was set at 5%, so if the probability value was less than
0.05 the trend was evaluated to be significant. The Null-Hypothesis for this test is: There is no trend

 8
in the series. The Seasonal Mann-Kendall test will produce two tables, one depicting the whole
dataset, the other depicting the individual months. In the test all months are compared to the same
month over the years, so all Januarys will be compared over the years to spot for an increase or
decrease in precipitation for this month.
For the comparison between precipitation and dam levels only a small portion of the precipitation data
has been used, since the dam levels are only available from 2012 onwards. A graph will show the
combined data on precipitation and dam levels to show the relation between these variables. This
analysis will answer the 1st sub question.

For further analysis the four RCP climate scenarios from the IPCC will be used. Each scenario will
have a different expected influence on the global average temperature increase. For each scenario the
impact on precipitation for South Africa will be predicted as precisely as data allows. The IPCC has
made a prediction about precipitation change based on the average global increase of one degree
Celsius (IPCC, 2015). This prediction is used to create a formula that combines the prediction of
future temperature increase and the prediction of precipitation change per temperature increase. By
using the computed current average annual precipitation, the future precipitation can be predicted.

Projected Precipitation = Current Precipitation ⋅ (Difference of precipitation ⋅ Increase of global
average temperature)/100 + 1) or:

 = ⋅ (( ⋅ )/100 + 1)

P = Expected Average Annual Precipitation
C = Current Average Annual Precipitation
D = Percentage difference of precipitation
W = Increase in global average temperature change in degrees Celsius

This formula is designed to calculate future annual precipitation based on the current annual
precipitation and climate change variables impacting the precipitation. In this formula C will be
calculated in the first section of the analysis by analyzing and computing the average annual
precipitation based on historic precipitation data. Variable D is spatially dependent on the projection
of the IPCC, in the case of the Cape Town Greater Area D ranges from -3 to -9. This value is derived
from the IPCC (2017) as shown in figure 9. Variable W is dependent on the actual increase of global
temperature in degrees Celsius, since the actual increase of temperature is uncertain the RCP’s from
the IPCC (2015) will be used to make predictions about this variable. This will result in an overview
of the impact of the four RCP climate scenarios on precipitation for the Cape Town area. With the
outcomes of these scenarios the freshwater availability of Cape Town in the future can be predicted.
Additional information from the Cape Town local government on new projects to increase the
freshwater supply in the future combined with the outcomes of the climate scenarios will answer the
third sub question.

All of the analysis and sub questions combined will give an overview and prediction of the impact of
the climate change scenarios on the precipitation in the Cape Town area, resulting in the future
freshwater availability of the city. The analysis and findings combined will answer the main research
question.

 9
4 Results
4.1 Dam levels

 Figure 3. Combined water stored in the 6 major dams from 2012-2021.
In figure 3 the combined water storage in the 6 largest dam reservoirs is presented over the time
period 2012 until the start of 2021. These 6 dams have a combined storage capacity of 898221 Ml,
adding up to 99.5% of the total water storage for Cape Town. The 8 smaller dams together have a
storage capacity of 4304 Ml, or 0.5%, and are therefore not included in the analysis. Important notion
in figure 3 is the dependency of the winter rainfalls to restore enough capacity for the upcoming dry
season. Another important notion is the sharp decrease of combined dam levels in the 2015-2018
period. The bar shows the 13.5% storage capacity threshold which would trigger the ‘Day Zero’
scenario.

 10
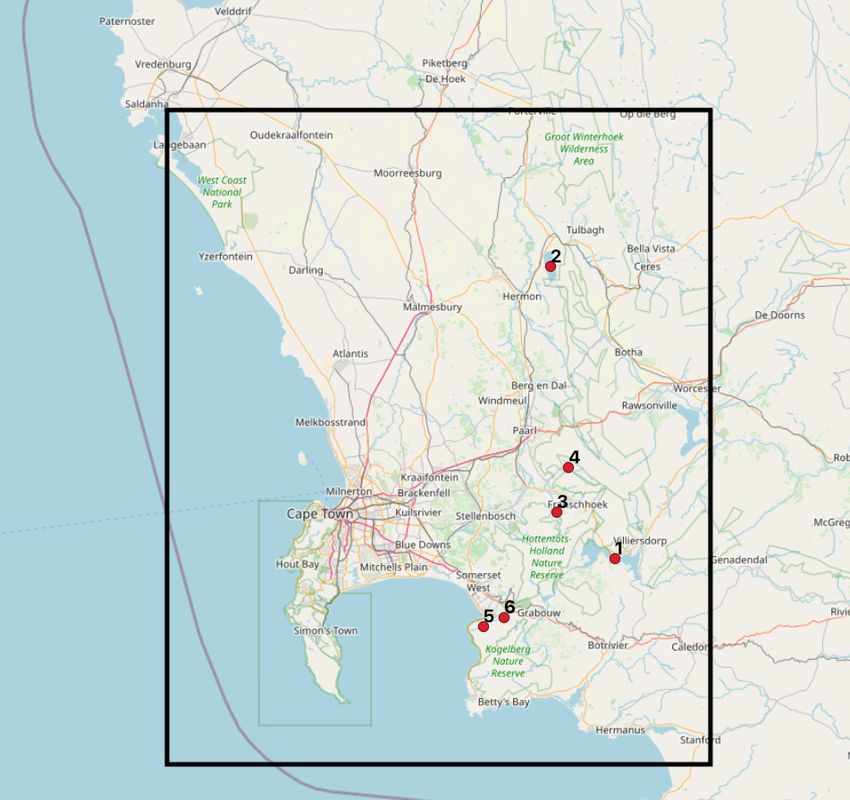
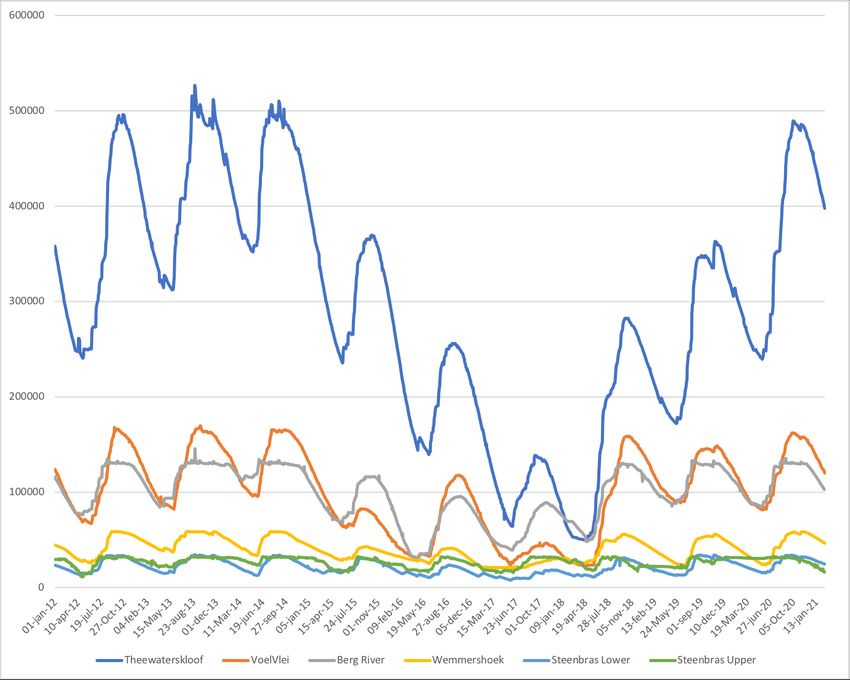
Figure 4. Relative dam levels from the six largest dams in Cape Town area from 2012 to 2021

The graph in figure 4 shows the percentage of storage capacity used for the 6 largest dams. Important
notion here is that all dams are affected by the drought except for Steenbras Upper. Steenbras Upper
does not only function as a freshwater reservoir, it also produces electricity through a system of
pumps. Therefore, the water levels of Steenbras Upper are maintained artificially at a high level in
order to guarantee enough water for electricity production. The two largest dams (Theewaterskloof
and VoelVlei) are affected the most by the lack of precipitation in the 2016-2018 winter periods as the
water levels drop to 10.3% and 13.8% respectively in April 2018. Other dams (Berg River,
Wemmershoek, Steenbras Lower) did also not recharge to full capacity during the winter rainfalls in
the 2015-2018, however the storage levels are not as low as Theewaterskloof and VoelVlei.

 11
Figure 5. Dam levels in absolute numbers, from 2012-2021

Figure 5 shows the actual dam levels of the six main dams. It also shows the comparable storage
capacities of the various dams. Clearly visible is that Theewaterskloof has the largest capacity by far,
followed by VoelVlei and Berg River. The other three dams are considerably smaller in their capacity.

 12
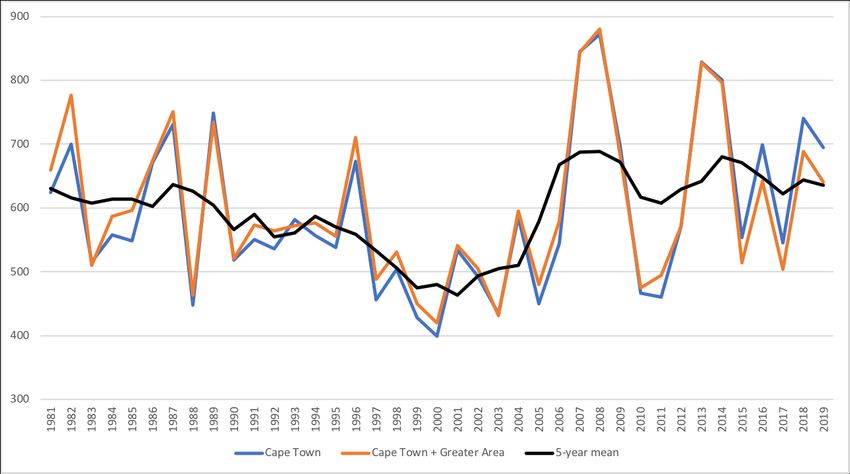
4.2 Precipitation

 Figure 6a. Precipitation from 2012-2019 in Cape Town and Greater Area.
 Figure 6b. Average monthly precipitation from 1981-2019 in Cape Town and Greater area.
 Figure 6c. Annual precipitation from 1981-2019 in Cape Town and Greater area.

 13
Figure 6a shows the precipitation in Cape Town and Cape Town Greater Area in the time period
2012-2019. Both areas are displayed to show the similarities, although the greater area is more
mountainous and is further inland compared to the Cape Town area the precipitation patterns are
fairly similar. This contradicts the City of Cape Town (2018) which states that precipitation is
significantly higher in the mountainous areas around the dams. Figure 6b shows the dispersion of
rainfall over the year, this clearly shows a peak of precipitation in the winter months compared to
summer months, which confirms the statement of Natalie et al. (2019). Figure 6c shows the annual
precipitation in both areas over the time period of 1981-2019. Based on this graph there is no
monotonic trend over the whole time period. However, a decreasing trend in the 5-year mean can be
seen from 1981 until 2001. Whereas after that the average mean goes up and then goes up and down,
largely due to the large differences in annual precipitation in this period. Based on these graphs it can
be seen that there is variability in the total annual precipitation, while the precipitation follows a
pattern year-round.

 Kendall's tau -0,111
 S' -4,000
 Var(S') 44,000
 p-value (Two-tailed) 0,651
 alpha 0,050
 Figure 7a. Test results of the Seasonal Mann-Kendall trend test, model results.

 Series\Test Kendall's tau p-value Sen's slope
 JAN -0,031 0,790 -0,049
 FEB -0,112 0,321 -0,111
 MAR -0,203 0,071 -0,407
 APR -0,128 0,255 -0,516
 MAY 0,001 1,000 0,003
 JUN 0,266 0,018 2,033
 JUL 0,088 0,439 0,632
 AUG 0,266 0,018 1,428
 SEP 0,001 1,000 0,005
 OCT 0,001 1,000 0,002
 NOV 0,247 0,028 0,593
 DEC -0,155 0,168 -0,257
 Figure 7b. Test results of the Seasonal Mann-Kendall trend test, monthly results.

Figure 7a and b show the results from the seasonal Mann-Kendall trend test conducted on the
precipitation data from the Greater Cape Town region from 1981-2019. Figure 7a shows that the
model itself is not significant, this means that we cannot reject the null-hypothesis: There is no trend
in the series. This means that there is no significant increasing or decreasing trend in the precipitation
data. This supports our findings of Figure 6(c) that there is no monotonic trend in the annual
precipitation. Although in figure 6c two periods can be distinguished in the 5-year mean, 1981 until
2004 shows a decreasing trend in the 5-year mean, while from 2004 the average increases again.
However, the variability between the various years seems also to be larger than in the 1981-2004
period. The seasonal Mann-Kendall trend test tests only for upward or downward trends in the dataset,
when there are multiple trends in the same dataset the model will not be significant. However, the test
provides us also with results of the individual months shown in Figure 7b. It should be noted that 3
months are significant. These months are June, August and November. For these months Kendall's tau
and Sen’s slope are both positive, indicating that there is a positive precipitation trend in these

 14
months. This means that the precipitation in these months is increasing over the years. This
contradicts our expectation of a decrease in precipitation over the years. However, since the model
itself is not significant nothing can be said about trends in the entire dataset, and consequently a
decrease in annual precipitation cannot be excluded. With a p-value of 0.071 March March is close to
being significant with a confidence level of 0.05. It seems that there is a trend in probability values
with a month being (almost) significant every 2 or 3 months. The main difference between March and
the three significant months is the Sen’s slope. For March Sen’s slope is negative, indicating that there
is a decreasing trend in precipitation in March over the time period.

4.3 Combined analysis Precipitation / Dam Levels

 Figure 8. Historic precipitation and dam levels from 2012 until 2019 on a monthly basis.

Figure 8 shows a combination of the 6 largest dam levels and the precipitation from 2012 until 2019.
Notions here are the correlation between the upward dam level during peaks in precipitation, and a
decrease in dam levels in dry periods. The period of low dam levels in 2015-2018 is clearly visible,
however at first glance the precipitation in that same period of time does not look that problematic.
However, as seen in Figure 6c annual precipitation in the 2015-2018 period is lower than the 2012-
2014 period, supporting the findings of Otto et al. (2018) that a lack of precipitation was a key
variable for the water crisis. An explanation for this can be found in the sharp single peaks in
precipitation from 2015-2018, indicating that the rain season is shorter than the broader peak of
previous years.

 15
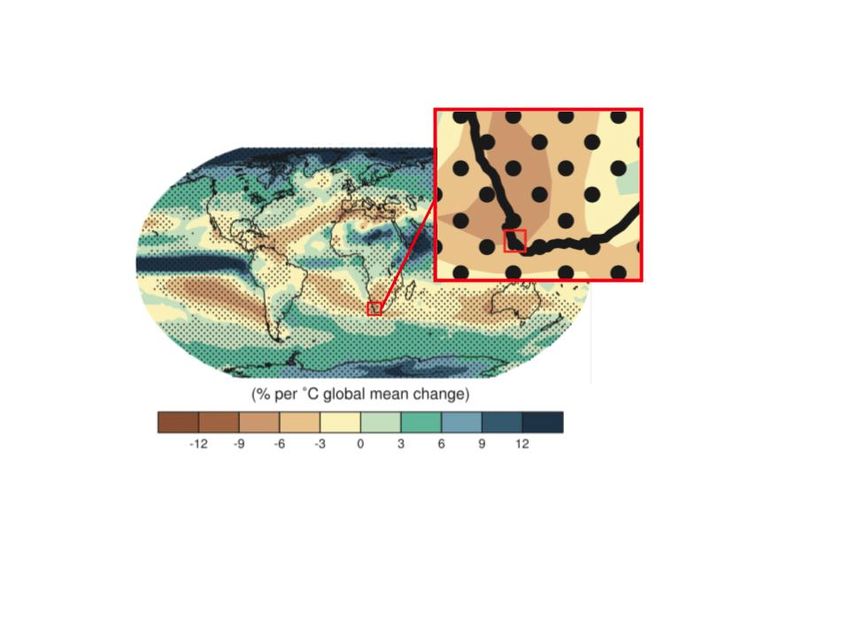
4.4 Climate Change impact
In order to establish the impact of climate change on future annual precipitation a formula has been
created based on current precipitation, RCP scenarios from the IPCC (2015) and precipitation
projections from the IPCC (2017). The formula has been discussed in the Methodology section of this
thesis.

 = ⋅ (( ⋅ )/100 + 1)

To establish future expected average annual precipitation (P), the current average annual precipitation
(C), percentage difference of precipitation (D) and increase in global average temperature change (W)
need to be established.

The C can be derived from the precipitation analysis. The average annual precipitation over 20 years
(1986-2005) for Cape Town is 542mm, the average for the greater area including Cape Town is 556,9
mm. For this analysis the average of the Greater Cape Town area will be used, since this includes the
spatial area where all dams are included. The specific time period is chosen to match the
corresponding time period of which D can be derived.

 Figure 9. Precipitation change in 2081-2100, % per °C compared to 1986-2005 time period (derived
 from IPCC, 2017, Page 1061, Figure 12.10, modified)

The D can be derived from Figure 9. This figure displays a categorical representation of Earth, where
precipitation change is displayed per degree Celsius increase of the global mean. The percentual
change is compared to precipitation data from 1986-2005, therefore the current average annual
precipitation (C) has been calculated over the same time period. Zooming in on South Africa learns
that Cape Town is categorized in the category -9/-6, while a small portion of the studied Greater Cape
Town area falls in the -6/-3 category. For this analysis an interval from 1.5 between -3 and -9 will be
used, this will allow for detailed analysis and include the uncertainty range of the model into the
analysis.

 16
2081-2100

 RCP Mean Likely range

 2.6 1.0°C 0.3°C to 1.7°C

 4.6 1.8°C 1.1°C to 2.6°C

 6.0 2.2°C 1.4°C to 3.1°C

 8.5 3.7°C 2.6°C to 4.8°C
Figure 10: RCP Pathways from the IPCC (2015). Global Mean Surface Temperature Change for each
 of the RCP Scenarios.

The W can be derived from the RCP projections of the IPCC. The four RCP scenarios all represent a
pattern of different greenhouse emissions resulting in various ranges of mean surface temperature
increase. Using the RCP temperature projections as a variable in the formula allows for projections
made for each range. For each RCP the low, mean and high range will be used as input for the
formula, this ensures that the range is also represented in the analysis. These variables are shown in
Figure 11.

 RCP 2.6 RCP 4.6 RCP 6.0 RCP 8.5

 Low Mean High Low Mean High Low Mean High Low Mean High

 0.3°C 1.0°C 1.7°C 1.1°C 1.8°C 2.6°C 1.4°C 2.2°C 3.1°C 2.6°C 3.7°C 4.8°C
 Figure 11: Temperature ranges for each RCP, used as variables in the formula. Derived from the
 IPCC (2015).

Now that all of the variables are known, this will result in the following inputs:
 = ⋅ (( ⋅ )/100 + 1)
 P = Variable that will be calculated, in average mm per year.
 C = 556,9 (mm)
 D = Interval of 1.5 between -3 and -9.
 W = All values of Figure X. Being the low, mean and high values of each RCP projection.

 RCP 2.6 RCP 4.6 RCP 6.0 RCP 8.5
 Low Mean High Low Mean High Low Mean High Low Mean High

 -3.00 551.89 540.19 528.50 538.52 526.83 513.46 533.51 520.14 505.11 513.46 495.08 476.71

 -4.50 549.38 531.84 514.30 529.33 511.79 491.74 521.82 501.77 479.21 491.74 464.18 436.61

 -6.00 546.88 523.49 500.10 520.14 496.75 470.02 510.12 483.39 453.32 470.02 433.27 396.51

 -7.50 544.37 515.13 485.90 510.96 481.72 448.30 498.43 465.01 427.42 448.30 402.36 356.42

 -9.00 541.86 506.78 471.69 501.77 466.68 426.59 486.73 446.63 401.52 426.59 371.45 316.32

Figure 12. Results of all variables in the formula. Expected average annual precipitation in 2081-2100
 per RCP scenario and % interval.

 17
RCP 2.6 RCP 4.6 RCP 6.0 RCP 8.5
 Low Mean High Low Mean High Low Mean High Low Mean High

 -3.00 -0.90% -3.00% -5.10% -3.30% -5.40% -7.80% -4.20% -6.60% -9.30% -7.80% -11.10% -14.40%

 -4.50 -1.35% -4.50% -7.65% -4.95% -8.10% -11.70% -6.30% -9.90% -13.95% -11.70% -16.65% -21.60%

 -6.00 -1.80% -6.00% -10.20% -6.60% -10.80% -15.60% -8.40% -13.20% -18.60% -15.60% -22.20% -28.80%

 -7.50 -2.25% -7.50% -12.75% -8.25% -13.50% -19.50% -10.50% -16.50% -23.25% -19.50% -27.75% -36.00%

 -9.00 -2.70% -9.00% -15.30% -9.90% -16.20% -23.40% -12.60% -19.80% -27.90% -23.40% -33.30% -43.20%

Figure 13. Results of all variables in the formula. Expected average annual precipitation in 2081-2100
 per RCP scenario and % interval. In % decreased from the average annual precipitation from 1986-
 2005.

Figure 12 and 13 show the results of all variable combinations in the formula. They show that all
scenarios predict a decrease in annual precipitation rates, since all predictions are lower than the
original annual average of 556,9mm. It also shows that the range of predicted annual precipitation is
quite extensive ranging from 551.89mm in the RCP 2.6 Low scenario with a variable of -3.00, to
316.32mm in the RCP 8.5 scenario with a variable of -9.00. A decrease in annual precipitation was to
be expected due to the D variable which is negative for all scenarios (-3 till -9), there is an expected
decrease in precipitation for every degree Celsius increase of the global average mean. This supports
the findings of the IPCC (2017) that a precipitation decrease is very likely (>90% of the simulations)
in winter months (JJA) and likely (>66% of the simulations) in summer months (DJF). Figure 11
includes the widest ranges of the D variable and RCP estimates, a combination of the widest ranges
therefore results in the most extreme results of expected precipitation. Although the widest range is
included, it should be remembered that for both variables the actual numbers are most likely more
moderate. The D variable is retrieved from a map projection (Figure 8), showing a relatively small
area Northwards from Cape Town being categorized as -9 / -6, while most of the surrounding area is
in the -6 / -3 category. The studied area did mostly fall into the -9 / -6 category but was partially on
the border of the two categories, indicating that the actual numbers are likely to be on the low end of
the category. Regarding the RCP scenarios, the RCP 8.5 is the high-end scenario where little is being
done to stop emitting greenhouse gasses. Although not impossible, efforts are being made around the
globe to reduce emissions and avert the RCP 8.5 scenario. On the other end, the RCP 2.6 is a very
positive scenario with emissions being cut drastically on short notice, therefore it does not seem like
this scenario will become reality.

 18
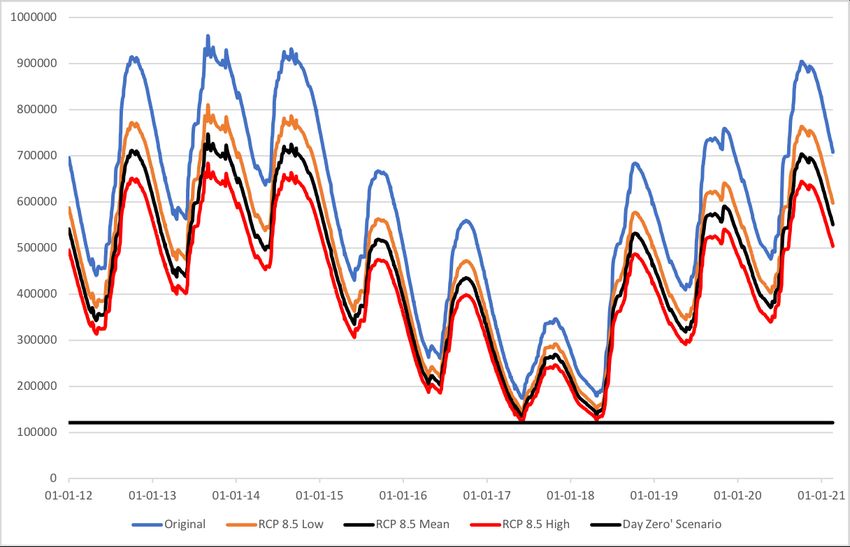
4.5 Combined analysis Climate Change / Precipitation
As can be seen in Figure 12 and 13 there will be a predicted decrease in precipitation under all
scenarios. To translate the decrease in precipitation to a prediction of future dam levels the
percentages of Figure 13 are used to indicate future dam levels.

 Figure 14. Dam levels under the RCP 8.5 scenario.

In Figure 14 the historic dam levels of 2012 until the beginning of 2021 have been decreased with the
RCP 8.5 results of figure 12, the mean value for the D variable of -6.00 has been used. This results in
a decrease of 15.6% under the RCP 8.5 Low scenario, 22.2% under the RCP 8.5 Mean scenario and
28.8% under the RCP 8.5 High scenario. This graph is however not representative for the actual
influence of the decreased precipitation on the dam levels, but only shows the percentage decrease of
dam levels. A representative graph would need data on water consumption and evapotranspiration
over the same period as input as well, in order to calculate the in and outgoing water flows. Although
not accurate figure 14 gives an insight on permanent decreased storage levels and its implications. In
this model the storage levels approached the ‘Day Zero’ scenario at 13.5% capacity in two summer
periods in a row. The lowest dam levels in this model were 13.77 and 14.21 respectively, marginally
above the 13.50 percent threshold.

4.6 Societal impact
The aforementioned results are a prediction of Cape Town’s future freshwater supply from the
existing dam infrastructure, which is responsible for 96% of the total freshwater supply. Only 4% is
currently coming from other sources, this number is scheduled to be 25% in 2040 as Cape Town is
diversifying its water sources (City of Cape Town, 2020). This diversification is needed to decrease
the dependency on precipitation as the main freshwater source. Other sources considered include
seawater desalination; water reclamation; ground water extraction; diversion of Lourens, Upper Wit
and Molenaars rivers and removing alien vegetation in key-areas (City of Cape Town, 2018).

 19
The diversification and expansions of water sources are needed in order to keep up with the water
demand of a thirsty and growing city. Cape Town has a large tourist sector responsible for 10% of the
economic output (Parks et al., 2019), this sector is vulnerable to water shortages; incoming tourists
declined 20% during the peak water shortage of 2018 (Hyman, 2019). Also, agricultural output
decreased by 400 million USD (OECD, 2021) indicating that the water shortages had large financial
consequences for Cape Town.

The growing population also increases the need for expanding existing water infrastructure. The
population of Cape Town has been growing at over 2% per year since the 1950’s. Although the
growth rate is expected to decrease to around 1.5% annually in 2030, another 1 million inhabitants
will be added to the city’s population in 2033 (United Nations, 2019). Furthermore, the social
inequality in Cape Town needs to be addressed, as already many Capetonians lack access to
freshwater (Ziervogel, 2018; Parks et al., 2019). Fear is that as water is becoming scarcer the
inequality will only grow bigger (Millington & Sheba, 2021).

5 Concluding paragraph

5.1 Conclusion
A quantitative data analysis has been used to answer the main research question “What impact does
change in precipitation patterns have on the future freshwater availability of Cape Town, South
Africa?”. Various types of data were analyzed independent and dependent from each other. The
combined precipitation and dam level analysis showed a correlation between these two variables,
indicating that precipitation has a direct influence on the volume of the dam reservoirs. This analysis
answered the first sub question.
A prediction of future annual precipitation was made by a combination of historic precipitation data,
IPCC precipitation projections and the IPCC’s RCP scenarios. The outcome of the created formula
resulted in a table with future annual precipitation rates under various combinations of the
precipitation projections and RCP scenarios. The main finding was that the precipitation is going to
decrease under each scenario and is largely influenced by the average mean temperature and
variability in precipitation projections. These findings support the claims by Trenberth (2011), Dosio
et al. (2019) and the IPCC (2015, 2017). This analysis answered the second sub question.
Consequently, the projected precipitation was translated to future dam levels to indicate future water
supply from the existing infrastructure. This analysis was flawed due missing data on water
consumption and evapotranspiration, which were needed in order to create an accurate prediction of in
and outgoing water flows. However, the graph gives an indication on decreased water levels under the
RCP 8.5 scenario.

All in all, we can conclude that Climate Change will have a negative influence on the precipitation for
Cape Town and surrounding areas and will therefore impact the freshwater availability for the city.
However, it remains unclear to what extent the average precipitation will decrease. It should be
remembered that climate change does not only affect precipitation patterns, but also increases the
chances of irregular events and extreme droughts. Combined with a growing population it is clear that
Cape Town needs to diversify its water supply in order to prevent a new ‘Day Zero scenario’ in the
future.

 20
5.2 Research recommendations
The research mainly focused on the influence of climate change on precipitation and its result to
future freshwater availability. However, there are more factors such as evapotranspiration, vegetation,
population change and water use that influence the total water supply and demand. In order to fully
understand and predict the availability of freshwater in the future all of these factors need to be
considered. Since these factors are highly connected a combined study on all variables need to be
conducted in order to make accurate predictions about the future fresh water supply and demand.

5.3 Limitations
The research is partially limited by data availability. The secondary data has been collected from
various sources, all maintaining various intervals and available year records. This especially affected
the analysis on the historic dam levels since data was only available from 2012 onwards, therefore the
correlation analysis with precipitation was not as extensive. Another data limitation was the
precipitation data, various datasets with daily intervals where not accessible. Therefore, another
dataset with monthly intervals had to be used, diminishing the accuracy of the analysis. The data was
not available Since daily precipitation was not available, the accuracy of the prediction of future dam
levels/freshwater availability could not be analyzed according to the original intended method.

Another limitation in researching climate data is the uncertainty when it comes to projections for
future patterns. Since climate change is highly uncertain and its trajectory is dependent on future
human actions, all predictions include a high degree of uncertainty. All models used as input for the
analysis are solid models from the IPCC; it has a solid basis, however building and combining these
models decrease its accuracy and make accurate conclusions very difficult.

 21
References

Arnell, N. (2014). Hydrology and Global Environmental Change. New York: Routledge.

City of Cape Town (2018). Water Services and the Cape Town Urban Water Cycle. Retrieved on 21-02-2021
from:
https://resource.capetown.gov.za/documentcentre/Documents/Graphics%20and%20educational%20material/Wa
ter%20Services%20and%20Urban%20Water%20Cycle.pdf. Cape Town: Water and Sanitation Department,
City of Cape Town.

City of Cape Town (2020). Our Shared Water Future. Retrieved on 21-02-2021 from:
https://resource.capetown.gov.za/documentcentre/Documents/City%20strategies,%20plans%20and%20framewo
rks/Cape%20Town%20Water%20Strategy.pdf. Cape Town: Water and Sanitation Department, City of Cape
Town.

Dosio, A., Jones, R. G., Jack, C., Lennard, C., Nikulin, G., & Hewitson, B. (2019). What can we know about
future precipitation in africa? robustness, significance and added value of projections from a large ensemble of
regional climate models. Climate Dynamics: Observational, Theoretical and Computational Research on the
Climate System, 53(9-10), 5833–5858.

Holder, J., Kommenda, N., (2018). Day Zero: how Cape Town is running out of water. The Guardian. 03-02-
2018.

Hyman, A. (2019). Cape Town seeking to change Day Zero narrative to bring tourists back. Times Live, 18-06-
2018.

IPCC (2013). Long-term Climate Change: Projections, Commitments and Irreversibility. Cambridge University
Press, Cambridge, United Kingdom and New York, NY, USA.

IPCC (2015). Fifth Assessment Report. Cambridge University Press, Cambridge, United Kingdom and New
York, NY, USA.

IPCC (2017). Regional Climate Projections. Cambridge University Press, Cambridge, United Kingdom and
New York, NY, USA.

Jackson, R.B., Carpenter, S.R., Dahm, C.N., McKnight, D.M., Naiman, R.J., Postel, S.L., Running, S.W.
(2001). Water in a Changing World. Ecological Applications, 11, 1027–1045.

Mahr, K. (2018). How Cape Town was saved from running out of water. The Guardian, 04-08-2002.

Millington, N., & Scheba, S. (2021). Day zero and the infrastructures of climate change: water governance,
inequality, and infrastructural politics in cape town's water crisis. International Journal of Urban and Regional
Research, 45(1), 116–132.

NASA. (n.d.). Power Data Access Viewer. Retrieved on 01-03-2021 from https://power.larc.nasa.gov/data-
access-viewer/. Hampton: NASA.

 22
NASA. (n.d.). Climate Change, How do we Know?. Retrieved on 05-03-2021 from
https://climate.nasa.gov/evidence/. NASA.

Natalie, B., Blamet, R., Cash, B., Swenson, E., Fahad, A., Bopape, M., Straus, D., Reason, C. (2019). The Cape
Town “Day Zero” drought and Hadley cell expansion. Climate and Atmospheric Science. 27.

OECD (2021), Water Governance in Cape Town, South Africa. OECD Studies on Water, OECD Publishing,
Paris.

Otto, F.E.L., Wolski, P., Lehner, F., Tebaldi, C., Oldenborgh, G.J. van, Hogesteeger, S., Singh, R., Holden, P.,
Fučkar, N.S., Odoulami, R.C., New, M. (2018). Anthropogenic influence on the drivers of the Western Cape
drought 2015–2017. Environmental Research Letters, 13.

Parks, R., Mclaren, M., Toumi, R., Rivett, U. (2019). Experiences and lessons in managing water from Cape
Town. Briefing Paper 29, Imperial College London, London.

Raftery, A.E., Zimmer, A., Frierson, D.M.W., Startz, R., Liu, P. (2017). Less than 2 °C warming by 2100
unlikely. Nature Climate Change, 7, 637–641.

Rogelj, J., den Elzen, M., Höhne, N., Fransen, T., Fekete, H., Winkler, H., Schaeffer, R., Sha, F., Riahi, K.,
Meinshausen, M., 2016. Paris Agreement climate proposals need a boost to keep warming well below 2 °C.
Nature, 534, 631–639.

Sousa, P. M., Blamey, R. C., Reason, C. J. C., Ramos, A. M., & Trigo, R. M. (2018). The ‘day zero’ cape town
drought and the poleward migration of moisture corridors. Environmental Research Letters, 13(12), 124025–
124025.

Trenberth, K.E., (2011). Changes in precipitation with climate change. Climate Research, 47, 123–138.

United Nations, (2019). World Population Prospects 2019. Retrieved on 9 June, 2021 from
https://population.un.org/wpp/.

Wilson, J. (2018) Cape Town’s Water Crisis: Little Rain for A Lot of People, BuildingGreen. Retrieved on 27-
02-2021 from https://www.buildinggreen.com/newsbrief/cape-town-s-water-crisis-little-rain-lot-people.

Ziervogel, G. (2018). Climate adaptation and water scarcity in South Africa. Current History. 177(799), 181-
186.

 23
You can also read