Genome wide identification and functional characterization of natural antisense transcripts in Salvia miltiorrhiza - Nature
←
→
Page content transcription
If your browser does not render page correctly, please read the page content below

www.nature.com/scientificreports
OPEN Genome‑wide identification
and functional characterization
of natural antisense transcripts
in Salvia miltiorrhiza
Mei Jiang1, Haimei Chen1, Jingting Liu1, Qing Du1,2, Shanfa Lu1* & Chang Liu1*
Salvia miltiorrhiza is one of the most widely used traditional medicines. Natural antisense transcripts
(NATs) are a class of long noncoding RNAs that can regulate gene expression. Here, we identified 812
NATs, including 168 cis-NATs and 644 trans-NATs from twelve root, flower, and leaf samples of S.
miltiorrhiza using RNA-seq. The expression profiles for 41 of 50 NATs and their sense transcripts (STs)
obtained from RNA-Seq were validated using qRT-PCR. The expression profiles of 17 NATs positively
correlated with their STs. GO and KEGG pathway analyses mapped the STs for cis-NATs to pathways
for biosynthesis of secondary metabolites. We characterized four NATs in detail, including NAT0001,
NAT0002, NAT0004, and NAT00023. Their STs are kaurene synthase-like 1 and the homologs of UDP-
glucose flavonoid 3-O-glucosyltransferase 6, UDP-glycosyltransferase 90A1, and beta-glucosidase 40,
respectively. The first gene is involved in the biosynthesis of bioactive tanshinones, the next two are
involved in anthocyanin biosynthesis, whereas the last is involved in phenylpropanoid biosynthesis.
Besides, we found seven STs that are potential targets of miRNAs. And we found two miRNAs
including miR156a and miR7208, might originate from NATs, NAT0112 and NAT0086. The results
suggest that S. miltiorrhiza NATs might interact with STs, produce miRNAs, and be regulated by
miRNAs. They potentially play significant regulatory roles in the biosynthesis of bioactive compounds.
Natural antisense transcripts (NATs) are a class of long noncoding RNAs, which transcribe in the opposite direc-
tion of protein-coding g enes1. Relatively, the transcripts of protein-coding genes were called sense transcripts
(STs). Base on the position of NATs and their STs, NATs can be divided into two categories, namely, cis-NATs and
trans-NATs2,3. Cis-NATs originated from the same genomic loci with STs. In contrast, trans-NATs originated from
different genomic loci with STs. NATs were initially detected in b acteria4, then they were found in p
rokaryotes5
and eukaryotes6. With the recent development of high-throughput DNA sequencing technologies and bioinfor-
matics analysis methods, genome-wide NATs have been reported in various plants, such as Arabidopsis thaliana7,
Oryza sativa8, Zea mays9, Saccharum officinarum10, and Petunia hybrida11.
It is found that NATs play an essential role in regulating gene expression through different m echanisms12,
such as mechanisms related to transcriptional i nterference13, RNA–DNA i nteractions14, RNA–RNA interactions
in the n ucleus15, and RNA–RNA interactions in the c ytoplasm16. In Arabidopsis thaliana, a cis-NAT produc-
ing from the opposite strand of MADS AFFECTING FLOWERING4 (MAF4) gene can positively regulate the
expression of its ST MAF4, thereby affecting flowering time. It activates MAF4 by recruiting WDR5a to MAF4
to enhance histone 3 lysine 4 trimethylation (H3K4me3)17. In Oryza sativa, a cis-NAT was produced from an
R2R3-MYB gene locus and suppressed the R2R3-MYB by mediating chromatin modifications18. In mutant plants
with downregulation of the NAT by RNA interference (RNAi), the expression level of the R2R3-MYB transcript
significantly increases, resulting in twisted leaf blades. Besides, a NAT originates from the CYCLING DOF FAC-
TOR 5 (CDF5) gene locus in Arabidopsis thaliana. In mutant plants with a T-DNA insertion in non-overlapping
regions of CDF5, the expression level of CDF5 transcript was strongly reduced compared with wild plants, while
its NAT increased 2–4 f olds19.
1
Key Laboratory of Bioactive Substances and Resource Utilization of Chinese Herbal Medicine From Ministry of
Education, Engineering Research Center of Chinese Medicine Resources From Ministry of Education, Institute
of Medicinal Plant Development, Chinese Academy of Medical Sciences, Peking Union Medical College,
Beijing 100193, People’s Republic of China. 2College of Pharmacy, Key Laboratory of Plant Resources of
Qinghai‑Tibet Plateau in Chemical Research, Qinghai Nationalities University, Xining 810007, Qinghai, People’s
Republic of China. *email: sflu@implad.ac.cn; cliu6688@yahoo.com
Scientific Reports | (2021) 11:4769 | https://doi.org/10.1038/s41598-021-83520-6 1
Vol.:(0123456789)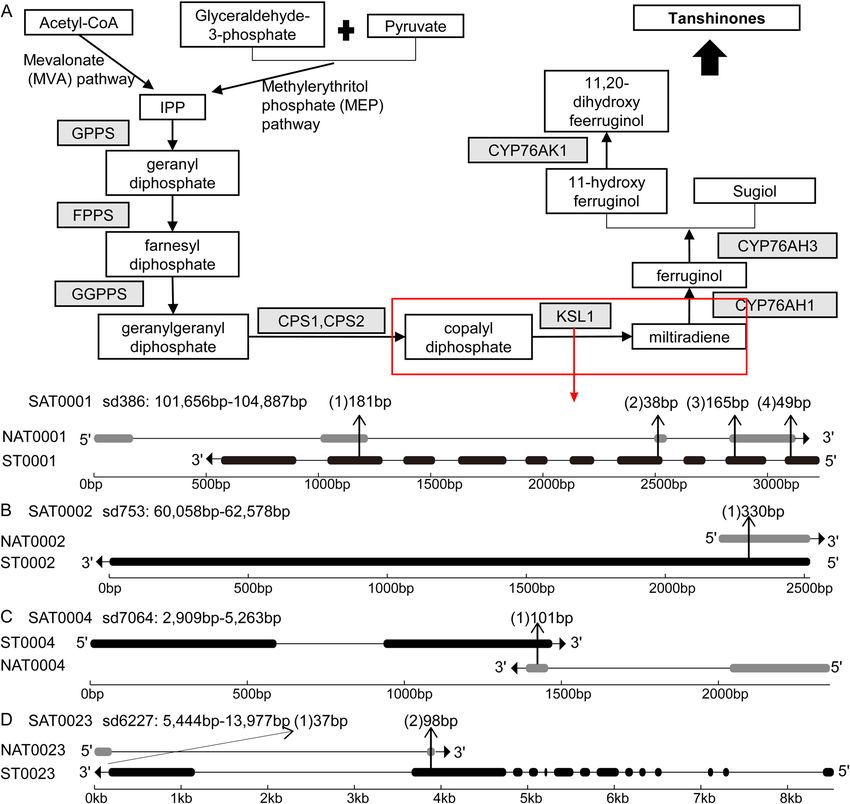
www.nature.com/scientificreports/
Salvia miltiorrhiza Bunge is one of the most important traditional medicines from the Lamiaceae family.
Tanshinones is one of the major active compounds in S. miltiorrhiza and are used to treat cardiovascular diseases
through anti-atherosclerosis20, anti-oxidation21, etc. Besides, this plant also produces many fl
avonoids22, such as
rutin, isoquercitrin, and astragalin. Various genes in the biosynthetic pathway of tanshinones have been identified
in S. miltiorrhiza. These include the SmCPS gene encoding copalyl diphosphate synthase, SmKSL gene encoding
ent-kaurene synthase23, SmCYP76AH1 gene encoding cytochrome P450 enzymes24, etc. The whole-genome25,26,
transcriptome27–29, and m icroRNAs30–32 of S. miltiorrhiza have been reported, respectively. However, a system-
atic analysis of NATs is not yet available for S. miltiorrhiza. Here, we conducted a genome-wide identification of
NATs in S. miltiorrhiza. The results suggest that NATs might interact with different types of molecules such as
the STs and miRNAs, and consequently play an important role in a wide range of biological processes such as
the biosynthesis of active compounds and glycosylation.
Results
Global identification of NATs in Salvia miltiorrhiza. To identify the NATs in S. miltiorrhiza, we car-
ried out strand-specific RNA-seq (ssRNA-seq) analysis of 12 RNA samples extracted from three tissues, includ-
ing roots (r), flowers (f), and leaves (l). We obtained 25.3, 53.8, and 26.7 million paired-end reads from pooled
flower, leaf, and root samples. And we obtained 44.5 (p01_f), 43.4 (p02_f), 42.9 (p03_f), 42.5(p01_l), 44.2
(p02_l), 41.6 (p03_l), 44.2 (p01_r), 41.9 (p02_r) and 40.9 (p03_r) million paired-end reads (Table S1).
We identified the NATs using the bioinformatic pipeline shown in Fig. 1. In step 1, 83.5%, 79.2%, and
84.3% reads from flowers, leaves, and roots, respectively, were mapped to the S. miltiorrhiza reference genome
sequence25. We assembled a total of 63,858 transcripts. Among them, 30,478 were previously annotated protein-
coding transcripts in the reference genome. Using an FPKM cutoff value of 1, we found a total of 44,596 tran-
scripts, including 22,099 previously annotated protein-coding transcripts expressed in at least one of the three
tissues. In step 2, we identified 21,790 candidate NATs. It includes 2,875 candidate cis-NATs and 18,915 candidate
trans-NATs. Then, we identified 6,323 candidate trans-NATs based on the annealing potential of complementary
regions. In step 3, we obtained 2,444 candidate cis-NATs and 5,085 candidate trans-NATs with a sequence length
of more than 200 bp. These candidate NATs were subject to a series of filtering steps based on noncoding RNA
identification. After removing transcripts with the maximum length of predicted open-reading frame ≥ 100 aa,
transcripts matching the protein database, and transcripts with protein-coding potential (CPC score > 0), we
finally annotated 812 NATs, which include 168 cis-NATs and 644 trans-NATs (Table S2, Sfile 1). The number of
cis-NATs and trans-NATs correspond to 0.55% (168/30,478) and 2.11% (644/30,478) of predicted protein-coding
genes, respectively.
Characterization of NATs in S. miltiorrhiza. We analyzed the features of the identified NATs. It includes
average size, exon number, and the length of overlapping regions. The length of cis-NATs ranged from 200 to
2641 bp, with an average size of 647.16 bp. The length of trans-NATs ranged from 200 to 4341 bp with an average
size of 545.62 bp. The majority length distribution ranged from 200 to 300 bp in both cis-NATs and trans-NATs
(Fig. 2A). There were also some NATs with lengths longer than 1000 bp. In general, the length distribution of
cis-NATs and trans-NATs was similar. However, the number of exons in cis-NATs (the average number was 2.07)
was more than that in trans-NATs (the average number was 1.10).
The mapping relationships between NATs and STs were found to be m ultiplex33. Some NATs are mapped to
multiple STs. On the other hand, some STs were mapped to multiple NATs. This phenomenon was also observed
in the SAT pairs (ST and NAT pairs) of S. miltiorrhiza. We classified the mapping relationships of SAT pairs into
four types, including “1 versus 1”, “1 versus n”, “n versus 1”, and “n versus n” (Table S2). “1 versus 1” represents
one NAT mapped to one ST, “1 versus n” represents one NAT mapped to multiple STs, “n versus 1” represents
multiple NATs mapped to one ST, and “n versus n” represents multiple NATs mapped to multiple STs. We found
a total of 1045 SAT pairs corresponding to 168 cis-NATs and 644 trans-NATs. For cis-NATs, 134 and 34 formed
1 versus 1 and n versus 1 relationship, respectively. However, we found no 1 versus n and n versus n relationships
for cis-NATs. For trans-NATs, 411, 159, 155, and 152 formed 1 versus 1, 1 versus n, n versus 1, and n versus n
relationships. The multiplex relationships are most likely due to duplicate genes in the genome. Then, we exam-
ined the proportion of the length of overlapping regions between STs and NATs (Fig. 2B). In general, the average
proportion of the overlapping region to NATs (73.08%) is larger than that of STs (53.37%).
We classified the cis-NATs into four types based on the location relative to the STs. It includes convergent (with
3′-ends overlapping), divergent (with 5′-ends overlapping), STs containing NATs (S > N), and NATs containing
STs (N > S) (Fig. 2C). Among the 168 cis-NATs, 40 were divergent, 60 were convergent, 60 were STs containing
NATs, and 8 were NATs having STs. The primary type was convergent and STs containing NATs.
Conservation of NATs identified in S. miltiorrhiza. To determine the conservation of NATs identified
in S. miltiorrhiza, we searched the PlncRNADB (http://bis.zju.edu.cn/PlncRNADB/index.php) and GreeNC34
databases for homologs. A total of 4 NATs, NAT0030, NAT0047, NAT0131, and NAT0346, were found to be
conserved among the species of Medicago truncatula and Mimulus guttatus (Table 1).
Functional enrichment analyses of the STs having cis‑NATs. To explore NATs’ putative function, we
analyzed Gene Ontology (GO) enrichment and Kyoto Encyclopedia of Genes and Genomes (KEGG) pathway35
analyses on all the STs having cis-NATs in three tissues analyzed. Almost all STs were mapped to GO terms. The
STs were mapped to the subgroups of the biological processes, the cellular components subgroup, and the molec-
ular functions subgroup counted for 68.1%, 94.1%, and 67.6%, respectively. Among them, five GO terms were
significantly enriched. The terms include defense response by callose deposition, regulation of transport, cel-
Scientific Reports | (2021) 11:4769 | https://doi.org/10.1038/s41598-021-83520-6 2
Vol:.(1234567890)www.nature.com/scientificreports/
Figure 1. The bioinformatics pipeline used to identify NATs in S. miltiorrhiza. The figure has three columns.
The main steps of the pipeline are shown in the left column. The detailed analytical processes are shown in the
middle column. The results produced by a particular process are shown in the right column.
lular response to the extracellular stimulus, vesicle organization, and ADP binding (Table S3). Moreover, 14 STs
were mapped to 19 KEGG pathways, including anthocyanin biosynthesis, beta-alanine metabolism, biosynthesis
of antibiotics, biosynthesis of secondary metabolites, carbon metabolism, cutin, suberine and wax biosynthe-
sis, cyanoamino acid metabolism, lipoic acid metabolism, metabolic pathways, phenylpropanoid biosynthesis,
plant-pathogen interaction, propanoate metabolism, protein processing in the endoplasmic reticulum, purine
metabolism, pyrimidine metabolism, riboflavin metabolism, RNA polymerase I, starch and sucrose metabolism
and valine, leucine, and isoleucine degradation (Table S4).
Validation of ssRNA‑seq experiments using quantitative real‑time PCR (qPCR). To validate the
expression levels of cis-NATs and STs obtained from ssRNA-Seq in S. miltiorrhiza, we performed strand-specific
reverse transcription-quantitative real-time PCR (ssRT-qPCR) on 25 SAT pairs with three replicates for each
Scientific Reports | (2021) 11:4769 | https://doi.org/10.1038/s41598-021-83520-6 3
Vol.:(0123456789)www.nature.com/scientificreports/
Figure 2. Characterization of S. miltiorrhiza NATs. (A) Length distribution of NATs. (B) Comparison of the
proportion of the length of overlapping regions to that of STs and NATs with the length of the overlapping
region. (C) Schematic representation of different types of cis-NATs based on the location relative to the STs. STs
and NATs were depicted as gray and black bars, respectively. Arrows indicated the directions of transcription.
Start of alignment in End of alignment in Start of alignment in End of alignment in
NAT ID ID in database Identity level Alignment length query query subject subject
Mguttatus_Migut.
NAT0030 78.472 144 4 143 91 233
M00719.1
Mguttatus_Migut.
NAT0047 83.333 270 192 461 263 532
N03196.1
Mguttatus_Migut.
NAT0131 88.341 223 77 299 78 300
J00829.1
Mtruncatula_
NAT0346 77.953 127 55 176 72 195
Medtr2g041250.1
Table 1. List of conserved NATs identified in S. miltiorrhiza.
tissue. We selected 25 SAT pairs for validation if they met one of the following two conditions: (1) the expression
profiles of NATs and parental genes were positively correlated with r values ≥ 0.9; and (2) the parental genes of
these NATs were mapped to the GO terms or the KEGG pathways of interest. The SAT pairs satisfied condi-
tion 1 included SAT0005, SAT0010, SAT0011, SAT0013, SAT0015, SAT0018, SAT0021, SAT0024, SAT0025. The
SAT pairs satisfied condition 2 included SAT0001, SAT0002, SAT0003, SAT0004, SAT0005, SAT0006, SAT0007,
SAT0008, SAT0009, SAT0010, SAT0011, SAT0012, SAT0013, SAT0014, SAT0015, SAT0016, SAT0017, SAT0018,
SAT0019, SAT0020, SAT0021, SAT0022, SAT0023. Detailed information for these 25 SAT pairs were shown in
Table S5. The sequences of NATs and STs were showed in Sfile 2. For each transcript, we calculated the average
expressed level of three replicates. Then we calculated the Pearson correlation coefficients (r) of the expressed
level between ssRNA-Seq and ssRT-qPCR. Forty-one of 50 transcripts showed a positive correlation, twenty-
three of which had an r valve more than 0.9 (Fig. 3, Figure S1). These results indicate that the data from RNA-Seq
Scientific Reports | (2021) 11:4769 | https://doi.org/10.1038/s41598-021-83520-6 4
Vol:.(1234567890)www.nature.com/scientificreports/
Figure 3. Validation of the expression level of 25 NATs in flower (F), root (R), and leaf (L) tissues of S.
miltiorrhiza. The X-axis shows the expression levels in the three tissues using the two methods: ssRNA-seq and
ssRT-qPCR. Y-axis shows the relative expression levels normalized to the mean expression levels across the
three tissues. Error bars represent the standard errors. r: the correlation coefficient between the expression levels
determined by the two experiments.
and qPCR are highly consistent. Moreover, the qPCR data also confirmed the differential expression of cis-NATs
in the three tissues analyzed.
Differential expression of cis‑NATs in flowers, leaves, and roots. The expression of cis-NATs in
flowers, leaves, and roots was analyzed using nine RNA-Seq data from the three tissues with three biological rep-
lications from each tissue. We found six cis-NATs differentially expressed among three tissues in S. miltiorrhiza,
namely, NAT0005, NAT0039, NAT0050, NAT0076, NAT0080, NAT0131 (Table S6). Among them, NAT0076
Scientific Reports | (2021) 11:4769 | https://doi.org/10.1038/s41598-021-83520-6 5
Vol.:(0123456789)www.nature.com/scientificreports/
in leaves was expressed higher than that in flowers. NAT0039 and NAT0131 in roots were expressed lower
than those in flowers. NAT0080 in roots were expressed higher than those in flowers. NAT0039, NAT0076, and
NAT0131 in roots were expressed lower than those in leaves. NAT0005, NAT0050, and NAT0080 in roots were
expressed higher than those in leaves.
Co‑expression of NATs and cognate STs. It is shown that NATs could regulate the expression of cor-
responding STs12. To preliminarily explore the function of NATs in S. miltiorrhiza, we examined the correlation
of expression levels between cis-NATs and the cognate STs using nine RNA-Seq data from the three tissues with
three biological replications from each tissue (Table S7). A total of 19 of 168 (11.31%) cis-SATs pairs had a signifi-
cantly positive correlation coefficient with r valve ≥ 0.9. And the trans-SATs pairs had a relatively low proportion.
Only 37 of 644 (5.75%) pairs had a significantly positive correlation coefficient.
We also examined the correlation of expression levels between NATs and the cognate STs using the qPCR
data; 22 of 25 pairs had a positive correlation coefficient, of which 17 pairs had r valve more than 0.9 (Fig. 4). The
remaining three pairs had a negative correlation coefficient. The correlation coefficient values are − 0.06, − 0.61,
and − 0.10, respectively (Fig. 4B, M, U). The results suggest a high correlation between 68% NATs and their
cognate STs.
Differential expression and co‑expression of NATs associated with tanshinone biosynthe‑
sis. Tanshinones are a class of active compounds mainly produced in the roots of S. miltiorrhiza. They are
widely used for the treatment of cardiovascular diseases20. We found that the SmKSL1 gene (Sfile 3) involved
in tanshinone biosynthesis had a cis-NAT. SmKSL1 converses diterpenoid precursor, (E,E,E)-geranylgeranyl
diphosphate (GGPP) to the skeleton of miltiradiene (Fig. 5A)23. This SAT pair was named SAT0001, which
contains ST0001 and NAT0001. There were four overlapped regions with a length of 181 bp, 38 bp, 165 bp, and
49 bp, respectively (Fig. 5A). Both NAT0001 and ST0001 had the highest expression level in roots and the lowest
in flowers (Fig. 4A). The correlation coefficient of this SAT pair was 0.99, indicating a co-expression.
Differential expression and co‑expression of NATs associated with glycosylation and de‑gly‑
cosylation. Glycosylation is a key step in modifying the complexity and diversity of secondary metabolites
in plants36. The uridine diphosphate-glucosyltransferase (UDP-glucosyltransferase, UGT) is one of the glycosyl-
transferases that use UDP-glucuronic acid as a glycosyl donor to catalyze glycosidic bond formation37. We found
two transcripts (ST0002 and ST0004), which encode candidate UDP-glucosyltransferases, had cis-NATs (Sfiles
4, 5). Besides, ST0002 was mapped to the UDP-glucose flavonoid 3-O-glucosyltransferase 6 gene of Fragaria x
ananassa that can catalyze quercetin to form the 3-O-glucosides38. SAT0002 belongs to the type ST containing
NAT (Fig. 5B). Both NAT0002 and ST0002 had one exon and one overlapped region with a length of 330 bp.
NAT0002 had the highest expression level in roots and the lowest in flowers. However, ST0002 had the highest
expression level in leaves and the lowest in roots (Fig. 4B). The correlation coefficient of this SAT pair was − 0.06.
The type of SAT0004 was convergent (with 3′-ends overlapping) (Fig. 5C). Both NAT0004 and ST0004 had two
exons and overlapped in the second exon with 101 bp length. Both NAT0004 and ST0004 had the highest expres-
sion levels in roots and the lowest in flowers (Fig. 4D). The correlation coefficient of this SAT pair was 0.99.
β-glucosidase catalyzes the hydrolysis of terminal, non-reducing β-D-glucosyl residues to release β-D-glucose
and the corresponding free a glycone39. ST0023 was mapped to the β-glucosidase 40 gene of A. thaliana (Sfile
6). ST0023 had a cis-NAT, termed NAT0023. The type of SAT0023 was convergent (with 3`-ends overlapping)
(Fig. 5D). There were two overlapped regions with a length of 37 bp and 98 bp, respectively. NAT0023 had the
highest expression level in roots and the lowest in leaves, whereas ST0023 had the highest expression level in
roots and the lowest in flowers. The correlation coefficient of this SAT pair was 0.30 (Fig. 4W).
Identification of miRNA targeting STs for cleavage in S. miltiorrhiza. It was reported that NATs
regulate the expression of their STs by increasing the stability of ST mRNA through RNA duplex formation. Pre-
cisely, NATs can mask specific sites leading to mRNA degradation, such as miRNA40. We found a high propor-
tion of positive correlation between NATs and STs from ssRNA-seq and qPCR data. To explore putative mecha-
nism of NATs in acting as a regulator in S. miltiorrhiza, we identified the STs having miRNA-binding sites in the
region overlapped with NATs using p sRNATarget41. A total of seven STs potentially to be cleaved were identified,
namely, ST0003, ST0005, ST0009, ST0010, ST0018, ST0019, and ST0025 (Table 2). Besides, all the seven SAT
pairs had a positive correlation with a correlation coefficient of more than 0.85 (Fig. 4C, E, I, J, R, S, Y).
Identification of pri‑miRNAs originating from NATs. MiRNAs can regulate gene expression by
direct cleavaging complementary transcripts to regulate the metabolite biosynthesis in plants42,43. We searched
the NATs against miRNA sequences found in S. miltiorrhiza44,45 to identify the pri-miRNAs originating from
NATs. Two miRNAs, namely, miR156a and miR7208, were aligned to the NAT0112 and NAT0086, respectively
(Fig. 6A, B). We then analyzed the secondary structure of the region aligned to miRNAs in NATs, showing the
secondary structure meets the criteria of plant miRNA annotation46. The miR156a originated from the over-
lapped region of the SAT. In a previous study, miR156 could target SQUAMOSA promoter binding protein likes
(SPLs) transcript in S. miltiorrhiza47. And the miR7208 did not originate from the SAT’s overlapped region, and
its function was unknown.
Scientific Reports | (2021) 11:4769 | https://doi.org/10.1038/s41598-021-83520-6 6
Vol:.(1234567890)www.nature.com/scientificreports/
Figure 4. The correlation of expression levels of 25 NAT and ST pairs in flower (F), root (R), and leaf (L) tissues
of S. miltiorrhiza. The X-axis shows the three tissues. Y-axis shows relative expression levels of NATs and STs
analyzed using the ssRT-qPCR method. Error bars represent the standard error among three replicates. The
values of r represent the correlation coefficient of expression levels between NATs and STs.
Discussion
NATs have been identified in many plant species and are important regulators of various biological processes12.
Understanding the regulatory mechanism of NATs is important for the quality improvement of S. miltiorrhiza.
A total of 812 NATs, including 168 cis-NATs and 644 trans-NATs, were identified in S. miltiorrhiza in this study
through genome-wide analysis.
The general features of NATs from S. miltiorrhiza are similar to those found in other plants. However, the
number of identified NATs was lower. The following reasons may cause it. Firstly, we defined NATs as transcripts
complementary to protein-coding genes, so we only retain the SATs whose STs are protein-coding genes. Sec-
ondly, some NATs are polyadenylated, and some are not. The ratio of these two types of NATs varies in different
species17,48. In this study, we identified only the polyadenylated NATs. Thirdly, NATs usually have lower expression
Scientific Reports | (2021) 11:4769 | https://doi.org/10.1038/s41598-021-83520-6 7
Vol.:(0123456789)www.nature.com/scientificreports/
Figure 5. Gene structures of four SAT pairs. Panel (A) had two parts: the biosynthetic pathway of tanshinones
in S. miltiorrhiza (above) and the gene structure of SAT0001 pairs (below). The enzymes were shaded in gray.
The related ST and chemical compounds were highlighted with a white rectangle. Solid arrows indicated the
reactions that have been experimentally validated, and dashed arrows indicated the hypothetical reactions.
KSL1 that was encoded by ST0001 was marked by a red rectangle. In the area describing the gene structure, gray
and black horizontal bars represent NAT and ST’s exons, respectively. The lines between bars represent introns.
Arrows indicate the directions of transcription. The length of the overlapping region is marked above the
structure. Similarly, panels (B, C, D) displayed the structures of SAT0002, SAT0004, and SAT0023 pairs in the
same way as for SAT0001, respectively.
levels. For instance, NATs were more than ten folds lower than their STs on average in some o rganisms49. We
might not identify the NATs with very low expression levels. As a result, it is possible that performing polyA (-)
RNA-seq will reveal additional NATs in S. miltiorrhiza.
To predict the function of NATs identified in S. miltiorrhiza, we performed GO and KEGG pathway enrich-
ment analyses on the STs with cis-NATs. These STs were mapped to a broad range of terms from biological pro-
cesses, cellular components, and molecular functions. Some STs were mapped to multiple pathways. For example,
ST0117 was mapped to four pathways: beta-alanine metabolism, carbon metabolism, propanoate metabolism,
valine, leucine, and isoleucine degradation. ST0087 was mapped to three pathways: purine metabolism, pyrimi-
dine metabolism, and RNA polymerase I.
In contrast, multiple STs were mapped to the same pathway. For example, six STs, namely, ST0137, ST0023,
ST0135, ST0076, ST0141, and ST0002, were all mapped to the biosynthesis of secondary metabolites pathway.
Scientific Reports | (2021) 11:4769 | https://doi.org/10.1038/s41598-021-83520-6 8
Vol:.(1234567890)www.nature.com/scientificreports/
Aligned MiRNA
ST MiRNA Start End Fragment Alignmenta Aligned ST Fragment Inhibition
:-::::::::-
AGGU-GAAGGAGCU UGCUUGAGCUUC
ST0003 PC-3p-131493_9 211 230 Cleavage
CAAGAA ::::-:::: UUCCACCU
:::::::::::
mtr-miR2673a_L- CUCUUCCUCUUCCUC AAGGAAGAGGAAGCG
ST0005 680 700 Cleavage
1_1ss21AT UUCCUC GAAGCU
:-:::::
::::-::::::
GCUCACUUCUCUCUC UAUGAGAGAGAGAGA
ST0009 bdi-miR156e-3p_1ss21GT 1204 1225 Cleavage
UGUCAUC :::--:::: GAUGAGA
:-:-::::--:
UCAAGGAGGGGAAAG AGUUACUUUUUU
ST0010 PC-5p-1795513_1 2018 2041 Cleavage
ACAAGGCCC :-:::: UCUUCUUCUUGU
:::--::::::
UGUUCUUGACGU GUCGGUGGAGACGUC
ST0018 pab-miR951 230 251 Cleavage
CUGGACCACG ::::::-- AAGAAAG
:-:::-::--:
stu-miR156d-3p_R- GCUCUCUAUUCUUCU GGUGAGAGGUGGAGA
ST0019 1887 1907 Cleavage
1_1ss10GT GUCAUC GAGAGC
-:-:::::::
::-::::::-:
UGAUUGAGCCGUGCC CAUUUUGGCAUGGCU
ST0025 osa-miR171b 561 581 Cleavage
AAUAUC :::--::- AGAUUC
Table 2. List of miRNAs targeting the overlapped regions of STs. a “:”: match; “-”: mismatch.
Figure 6. Gene structures of two SAT pairs and the predicted hairpin structures of pre-miRNA. (A) and
(B) panels showed information about SAT0112 and SAT0086, respectively. Each panel had two parts, gene
structures (above) and predicted hairpin structure (below). In gene structure, the gray and black bars represent
exons of NAT and ST, respectively. The lines between bars represent introns. Arrows indicate the transcription
direction. The length of the overlapping region was marked above the structure. In the part of the predicted
hairpin structure, the miRNA was marked by a red line. The gene structures were drawn using GSDS v2.062 and
the hairpin structures of pre-miRNA were drawn using RNAstructure v6.0.163.
Scientific Reports | (2021) 11:4769 | https://doi.org/10.1038/s41598-021-83520-6 9
Vol.:(0123456789)www.nature.com/scientificreports/
Two STs, namely, ST0023, ST0135, were mapped to the phenylpropanoid biosynthesis pathway. These results
suggest that NATs may play a comprehensive role in the biological processes in S. miltiorrhiza.
Several NATs are found to associate with genes involved in important pathways. SmKSL1 is a key enzyme
involved in the biosynthesis of tanshinones. It catalyzes diterpenoid precursor (E,E,E)-geranylgeranyl diphos-
phate (GGPP) to miltiradiene23. The cis-NAT (NAT0001) was identified to pair with SmKSL1. SmKSL1 and
NAT0001 showed a high level of co-expression with a correlation coefficient of 0.99. Both SmKSL1 and NAT0001
were highly expressed in roots. The result was consistent with the accumulation of tanshinones in the roots of
S. miltiorrhiza. As a result, NAT0001 might represent a novel mechanism in the regulation of tanshinone bio-
synthesis by NATs.
Besides, NAT0004 is a cis-NAT paired with ST0004, which encode a candidate UDP-glucosyltransferase
catalyzing the transfer of sugars to various receptors to form the glycosidic bond37. Secondary metabolites, such
as flavonoids, are important receptors of this r eaction36. This enzymatic reaction leads to the glycosylation of
metabolites and is a key step in the biosynthesis of various bioactive compounds50. Like SmKSL1 and NAT0001,
NAT0004 and ST0004 also showed a high co-expression pattern with a correlation coefficient of 0.99. As a
result, NAT0004 might represent a novel mechanism in regulating flavonoids and glycosylation by NATs in S.
miltiorrhiza.
NATs can regulate the expression of their STs at one or multiple steps of the gene expression process, such
as pre-transcription, transcription, and post-transcription51. The regulation of gene expression by NATs can
egative51. We found 17 of the 25 SAT pairs had a significantly positive correlation. These
be either positive or n
NATs can positively regulate the expression of STs by the following two mechanisms. In the pre-transcription
step, positive expression correlation may result from transcriptional activation. For example, NATs can enhance
H3K4me3 deposition to their STs’ promoter, subsequently activate transcription initiation of STs17. In the post-
transcription step, NATs can positively regulate the expression of their STs by limiting mRNA degradation. For
example, NATs can mask specific sites that lead to mRNA degradation through binding with their STs, increasing
the ST mRNA stability16.
In contrast, we found three pairs of ST and NAT had negative correlation coefficients. These NATs can
negatively regulate the expression of their STs by the following mechanisms. In the pre-transcription step, NATs
can regulate transcription initiation by affecting histone m odifications52, DNA methylation53, and mediating
54
chromatin modifications . In the transcription step, NATs can negatively regulate their STs’ expression by co-
transcription, resulting in transcriptional interference. For example, a DNA region is transcribed in both direc-
tions simultaneously. The two RNA polymerases on the opposite strand collide, causing transcription to p ause55
simultaneously-transcription step, negative expression correlation may result from translational repression. For
example, NAT can bind to the 5′ end of the NAT mRNA resulting in the binding site of the 30S ribosomal subunit,
thereby inhibiting NAT t ranslation56. The next step is to validate the function of NAT0001 and NAT0004 and
explore the potential molecular mechanisms.
Materials and methods
Sample collection. Two-year-old S. miltiorrhiza (line 99-3) plants were grown under natural growth con-
ditions in the garden of the Institute of Medicinal Plant Development, Beijing, China (Geospatial coordinates:
N 40° 2′ 0" E 116° 16′ 5′).Flower (f), leaf (l) and root (r), samples were collected from three individual plants
(named as p01, p02 and p03) and stored immediately in liquid nitrogen. We kept these samples in the − 80°
refrigerator until use.
RNA extraction, library construction, and ssRNA sequencing. We divided these samples into two
groups. In one group, the replicate samples were mixed by tissue type, named as p00_f, p00_l and p00_r respec-
tively. In the other group, we extract RNAs from each of the samples (p01_f, p02_f, p03_f, p01_l, p02_l, p03_l,
p01_r, p02_r. p03_r). We extracted RNAs from in total 12 RNA samples using the RNA extraction kit (TianGen,
China). NanoDrop 2000 spectrophotometer (Thermo Scientific, USA) and Agilent 2100 Bioanalyzer (Agilent
Technologies, USA) were used to detect the quantity and quality of total RNA, respectively. Then mRNA was
isolated from total RNA using OligoTex mRNA midi kit (Qiagen) and cleaved into small fragments with 300 bp
to 400 bp in length. The library construction was carried out using the ScriptSeq mRNA-Seq Library Preparation
Kit (Illumina-compatible) according to the manufacturer’s recommendation. Sequencing was carried out using
the Hiseq 2500 platform (Illumina, America). The raw sequence data have been submitted to GenBank under
the Bioproject number: PRJNA683774.
Prediction of NATs. To globally identify NATs in S. miltiorrhiza, we developed a stringent selection pipe-
line that contains three steps (Fig. 1).
In step 1, RNA-seq data of each tissue were mapped to the reference S. miltiorrhiza genome25 using TopHat
in the Tuxedo packages (v2.1.1)57. Mapped reads were assembled into transcripts and then annotated based on
the reference genome using Cufflinks in the Tuxedo packages (v2.2.1)57. We merged the reassembled transcripts
from three tissues into a single unified transcriptome.
In step 2, we searched the reassembled transcripts against protein-coding transcripts based on the annota-
tion of reference genome using the BLASTN (v2.7.1) with an E-value cutoff of 1e-5. The BLASTN results were
further analyzed using the Perl script in N ATpipe58. We consider the transcripts meeting one of the following
two conditions as candidate NATs: (1) the complementary region is longer than 50% of either transcript of the
NAT pair; (2) the consecutive complementary region of the NAT pair should be 100 bp or longer. We selected
the transcripts that complement transcripts annotated as genes and located in the same loci with the gene as
cis-NATs. By contrast, we considered the transcripts located in different loci with the gene as trans-NATs. Then,
Scientific Reports | (2021) 11:4769 | https://doi.org/10.1038/s41598-021-83520-6 10
Vol:.(1234567890)www.nature.com/scientificreports/
we predicted RNA hybridization for trans-NATs using the RNAplex (v2.4.14). The results from BLASTN and
RNAplex analyses were evaluated using the Perl script in N ATpipe58. The transcripts meet the following two
conditions were considered trans-NATs: (1) annealed region coincident with the complementary region and is
longer than 80% of the complementary region, (2) any bubble within the annealed region shorter than 10% of
the total region.
In step 3, we removed the transcripts with a length shorter than 200 bp and those with the potential to encode
proteins. We considered the transcripts meet one of the following three conditions to have the protein-encoding
potential: (1) transcripts with the maximum length of coding protein more than 100 aa, (2) transcripts matching
the Swissprot or Pfam database, and (3) transcripts with Coding Potential Calculator (CPC) score more than 059.
The transcripts with the length of amino acid greater than 100 that is the length of the open reading frame (ORF)
greater than 300, were identified using the getorf program in EMBOSS package (v 6.5.7.0) with the following
parameter: “-minsize 300 -find 1 -reverse N”. We searched these ORFs against the Swissprot database using the
BLASTN (v2.7.1) with an e-value cutoff of 1e-5. Next, we searched the ORFs against the Pfam database using
the PfamScan.pl (v1.6) with an e-value cutoff of 1e-5.
Conservation of NATs identified in S. miltiorrhiza. To determine the conservation of NATs identified
in S. miltiorrhiza, we searched the PlncRNADB (http://bis.zju.edu.cn/PlncRNADB/index.php) and GreeNC34
databases for homologs using BLASTN with the following parameters: a word size 7, an e value cutoff of 10–5,
and 50% alignment coverage of both sequences.
Functional enrichment analysis of STs. The sequences of STs having cis-NATs were extracted using
the gffread module in Tuxedo packages (v2.1.1)57 and then annotated on the Metascape web s erver60. We fur-
ther analyzed the results related to the GO and KEGG in detail35. We consider the terms with a q value < 0.05,
a minimum count of 3, and an enrichment factor ≥ 1.5 as significantly enriched. The q value is the multi-test
adjusted p value calculated using the Banjamini–Hochberg method. The enrichment factor is the ratio between
the observed counts and the counts expected by chance.
Differential expression analysis of NATs. We analyzed the expression of NATs using the Cuffdiff in
57
the Tuxedo
packages
(v2.2.1) . The NATs were considered differentially expressed under the two conditions:
log2 fold change ≥ 1 and q ≤ 0.05.
Strand‑specific quantitative real‑time PCR analysis. To validate the expression of NATs and their
cognate STs in each tissue, we collected samples from root, stem, and leaf and extracted RNA using the RNA
extraction kit (TianGen, China). We used the strand-specific quantitative real-time PCR (ssRT-qPCR) m ethod61
to validate the expression level. The gene SmActin was used as internal control, as described p
reviously29. First,
the sequences of NATs or STs were extracted using the gffread module in Tuxedo packages (v2.1.1)57. Then, the
primers were designed on the Integrated DNA Technologies (IDT) webserver. Nucleotide tags were added to the
primers for reverse transcription to distinguish NATs and STs. The tag sequence for NATs was “GCTAGCTTC
AGCTAGGCATC,” and that for STs was “CCAGATCGTTCGAGTCGT.” The primer sequences were listed in
Table S8, Sfile 1. RNA was reversely transcribed to cDNA using strand-specific primers and the TransScript kit
(TianGen, China). We carried qPCR with three technical replicates for each cDNA using the qPCR kit (Takara,
Japan). We used approximately 1 µl cDNA, 1ul 10 µM each of the forward and reverse primer, 0.4 µl passive ref-
erence dye (50×) polymerase, 10 µl 2 × TransStart Top Green qPCR SuperMix and 6.6 µl d dH2O for qPCR with
the following conditions: 94 °C for 30 s; 35 cycles of 94 °C for 5 s, and 60 °C for 34 s.
We used the average values from three technical replicates to calculate the Pearson correlation coefficients
of expression level between ssRNA-Seq and ssRT-qPCR. The false discovery rate (q value) was calculated using
R’s fdrtool package (v3.60).
Correlation of the expression profiles of NATs and their cognate STs. For ssRNA-Seq data, we
calculated the Pearson correlation coefficients of expression level between NATs and their cognate STs based on
each transcript’s FPKM values. For ssRT-qPCR data, we calculated the Pearson correlation coefficients based on
the values of Ct[X] − Ct[ACT], in which ‘ACT’ stands for SmActin gene and ‘X’ stands for transcripts tested in
this study. The false discovery rate (q value) was calculated using R’s fdrtool package (v3.60).
Received: 3 October 2020; Accepted: 29 January 2021
References
1. Katayama, S., Tomaru, Y., Kasukawa, T., Waki, K. & Wahlestedt, C. Antisense transcription in the mammalian transcriptome.
Science 309, 1564–1566. https://doi.org/10.1126/science.1112009 (2005).
2. Lavorgna, G. et al. In search of antisense. Trends Biochem. Sci. 29, 88–94. https://doi.org/10.1016/j.tibs.2003.12.002 (2004).
3. Chen, J., Miao, S., Kent, W. J., Huang, X. & Rowley, J. D. Over 20% of human transcripts might form sense-antisense pairs. Nucl.
Acids Res. 32, 4812–4820. https://doi.org/10.1093/nar/gkh818 (2004).
4. Barrell, B. G., Air, G. M. & Hutchison, C. A. 3rd. Overlapping genes in bacteriophage phiX174. Nature 264, 34–41. https://doi.
org/10.1038/264034a0 (1976).
Scientific Reports | (2021) 11:4769 | https://doi.org/10.1038/s41598-021-83520-6 11
Vol.:(0123456789)www.nature.com/scientificreports/
5. Tomizawa, J., Itoh, T., Selzer, G. & Som, T. Inhibition of ColE1 RNA primer formation by a plasmid-specified small RNA. Proc.
Natl. Acad. Sci. USA. 78, 1421–1425. https://doi.org/10.1073/pnas.78.3.1421 (1981).
6. Williams, T. & Fried, M. A mouse locus at which transcription from both DNA strands produces mRNAs complementary at their
3’ ends. Nature 322, 275–279. https://doi.org/10.1038/322275a0 (1986).
7. Wang, X. J., Gaasterland, T. & Chua, N. H. Genome-wide prediction and identification of cis-natural antisense transcripts in
Arabidopsis thaliana. Genome Biol. 6, R30. https://doi.org/10.1186/gb-2005-6-4-r30 (2005).
8. Lu, T. et al. Strand-specific RNA-seq reveals widespread occurrence of novel cis-natural antisense transcripts in rice. BMC Genom.
13, 721. https://doi.org/10.1186/1471-2164-13-721 (2012).
9. Xu, J. et al. Natural antisense transcripts are significantly involved in regulation of drought stress in maize. Nucl. Acids Res. 45,
5126–5141. https://doi.org/10.1093/nar/gkx085 (2017).
10. Lembke, C. G., Nishiyama, M. Y. Jr., Sato, P. M., de Andrade, R. F. & Souza, G. M. Identification of sense and antisense transcripts
regulated by drought in sugarcane. Plant Mol. Biol. 79, 461–477. https://doi.org/10.1007/s11103-012-9922-1 (2012).
11. Zubko, E. & Meyer, P. A natural antisense transcript of the Petunia hybrida Sho gene suggests a role for an antisense mechanism
in cytokinin regulation. Plant J. Cell Mol. Biol. 52, 1131–1139. https://doi.org/10.1111/j.1365-313X.2007.03309.x (2007).
12. Faghihi, M. A. & Wahlestedt, C. Regulatory roles of natural antisense transcripts. Nat. Rev. Mol. Cell Biol. 10, 637–643. https://doi.
org/10.1038/nrm2738 (2009).
13. Prescott, E. M. & Proudfoot, N. J. Transcriptional collision between convergent genes in budding yeast. Proc. Natl. Acad. Sci. USA.
99, 8796–8801. https://doi.org/10.1073/pnas.132270899 (2002).
14. Bernstein, E. & Allis, C. D. RNA meets chromatin. Genes Dev. 19, 1635–1655. https://doi.org/10.1101/gad.1324305 (2005).
15. Hastings, M. L., Milcarek, C., Martincic, K., Peterson, M. L. & Munroe, S. H. Expression of the thyroid hormone receptor gene,
erbAalpha, in B lymphocytes: alternative mRNA processing is independent of differentiation but correlates with antisense RNA
levels. Nucl. Acids Res. 25, 4296–4300. https://doi.org/10.1093/nar/25.21.4296 (1997).
16. Faghihi, M. A. et al. Expression of a noncoding RNA is elevated in Alzheimer’s disease and drives rapid feed-forward regulation
of beta-secretase. Nat. Med. 14, 723–730. https://doi.org/10.1038/nm1784 (2008).
17. Zhao, X. et al. Global identification of Arabidopsis lncRNAs reveals the regulation of MAF4 by a natural antisense RNA. Nat.
Commun. 9, 5056. https://doi.org/10.1038/s41467-018-07500-7 (2018).
18. Liu, X. et al. A novel antisense long noncoding RNA, TWISTED LEAF, maintains leaf blade flattening by regulating its associated
sense R2R3-MYB gene in rice. New Phytol. 218, 774–788. https://doi.org/10.1111/nph.15023 (2018).
19. Henriques, R. et al. The antiphasic regulatory module comprising CDF5 and its antisense RNA FLORE links the circadian clock
to photoperiodic flowering. New Phytol. 216, 854–867. https://doi.org/10.1111/nph.14703 (2017).
20. Chang, C. C. et al. The anti-atherosclerotic effect of tanshinone IIA is associated with the inhibition of TNF-α-induced VCAM-1,
ICAM-1 and CX3CL1 expression. Phytomed. Int. J. Phytother. Phytopharmacol. 21, 207–216. https://doi.org/10.1016/j.phyme
d.2013.09.012 (2014).
21. Tao, S. et al. Tanshinone I activates the Nrf2-dependent antioxidant response and protects against As(III)-induced lung inflam-
mation in vitro and in vivo. Antioxid. Redox Signal. 19, 1647–1661. https://doi.org/10.1089/ars.2012.5117 (2013).
22. Zeng, H. et al. Comparative analysis of the major chemical constituents in Salvia miltiorrhiza roots, stems, leaves and flowers during
different growth periods by UPLC-TQ-MS/MS and HPLC-ELSD methods. Molecules (Basel, Switzerland) https: //doi.org/10.3390/
molecules22050771 (2017).
23. Gao, W. et al. A functional genomics approach to tanshinone biosynthesis provides stereochemical insights. Org. Lett. 11, 5170–
5173. https://doi.org/10.1021/ol902051v (2009).
24. Guo, J. et al. CYP76AH1 catalyzes turnover of miltiradiene in tanshinones biosynthesis and enables heterologous production of
ferruginol in yeasts. Proc. Natl. Acad. Sci. USA. 110, 12108–12113. https://doi.org/10.1073/pnas.1218061110 (2013).
25. Xu, H. et al. Analysis of the genome sequence of the medicinal plant Salvia miltiorrhiza. Mol. Plant 9, 949–952. https://doi.
org/10.1016/j.molp.2016.03.010 (2016).
26. Zhang, G. et al. Hybrid de novo genome assembly of the Chinese herbal plant danshen (Salvia miltiorrhiza Bunge). Gigascience 4,
62. https://doi.org/10.1186/s13742-015-0104-3 (2015).
27. Xu, Z. et al. Global identification of the full-length transcripts and alternative splicing related to phenolic acid biosynthetic genes
in Salvia miltiorrhiza. Front. Plant Sci. 7, 100. https://doi.org/10.3389/fpls.2016.00100 (2016).
28. Xu, Z. et al. Full-length transcriptome sequences and splice variants obtained by a combination of sequencing platforms applied to
different root tissues of Salvia miltiorrhiza and tanshinone biosynthesis. Plant J. Cell Mol. Biol. 82, 951–961. https: //doi.org/10.1111/
tpj.12865(2015).
29. Chen, H., Wu, B., Nelson, D. R., Wu, K. & Liu, C. Computational identification and systematic classification of novel cytochrome
P450 genes in Salvia miltiorrhiza. PLoS ONE 9, e115149. https://doi.org/10.1371/journal.pone.0115149 (2014).
30. Li, C., Li, D., Li, J., Shao, F. & Lu, S. Characterization of the polyphenol oxidase gene family reveals a novel microRNA involved in
posttranscriptional regulation of PPOs in Salvia miltiorrhiza. Sci. Rep. 7, 44622. https://doi.org/10.1038/srep44622 (2017).
31. Zhou, H., Li, C., Qiu, X. & Lu, S. Systematic analysis of alkaline/neutral invertase genes reveals the involvement of Smi-miR399
in regulation of SmNINV3 and SmNINV4 in Salvia miltiorrhiza. Plants (Basel, Switzerland) https://doi.org/10.3390/plants8110
490 (2019).
32. Shao, F., Qiu, D. & Lu, S. Comparative analysis of the Dicer-like gene family reveals loss of miR162 target site in SmDCL1 from
Salvia miltiorrhiza. Sci. Rep. 5, 9891. https://doi.org/10.1038/srep09891 (2015).
33. Shao, J. et al. Genome-wide identification and characterization of natural antisense transcripts by strand-specific RNA sequencing
in ganoderma lucidum. Sci. Rep. 7, 5711. https://doi.org/10.1038/s41598-017-04303-6 (2017).
34. Paytuví Gallart, A., Hermoso Pulido, A., Anzar Martínez de Lagrán, I., Sanseverino, W. & Aiese Cigliano, R. GREENC: a Wiki-
based database of plant lncRNAs. Nucl. Acids Res. 44, 1161–1166. https://doi.org/10.1093/nar/gkv1215 (2015).
35. Kanehisa, M., Sato, Y., Kawashima, M., Furumichi, M. & Tanabe, M. KEGG as a reference resource for gene and protein annota-
tion. Nucl. Acids Res. 44, D457-462. https://doi.org/10.1093/nar/gkv1070 (2016).
36. Tiwari, P., Sangwan, R. S. & Sangwan, N. S. Plant secondary metabolism linked glycosyltransferases: an update on expanding
knowledge and scopes. Biotechnol. Adv. 34, 714–739. https://doi.org/10.1016/j.biotechadv.2016.03.006 (2016).
37. Lairson, L. L., Henrissat, B., Davies, G. J. & Withers, S. G. Glycosyltransferases: structures, functions, and mechanisms. Annu. Rev.
Biochem. 77, 521–555. https://doi.org/10.1146/annurev.biochem.76.061005.092322 (2008).
38. Griesser, M. et al. Multi-substrate flavonol O-glucosyltransferases from strawberry (Fragaria×ananassa) achene and receptacle. J.
Exp. Bot. 59, 2611–2625. https://doi.org/10.1093/jxb/ern117 (2008).
39. Escamilla-Treviño, L. L. et al. Arabidopsis thaliana beta-Glucosidases BGLU45 and BGLU46 hydrolyse monolignol glucosides.
Phytochemistry 67, 1651–1660. https://doi.org/10.1016/j.phytochem.2006.05.022 (2006).
40. Yuan, J.-H. et al. The MBNL3 splicing factor promotes hepatocellular carcinoma by increasing PXN expression through the alter-
native splicing of lncRNA-PXN-AS1. Nat. Cell Biol. 19, 820–832. https://doi.org/10.1038/ncb3538 (2017).
41. Dai, X., Zhuang, Z. & Zhao, P. X. Computational analysis of miRNA targets in plants: current status and challenges. Brief. Bioinform.
12, 115–121. https://doi.org/10.1093/bib/bbq065 (2011).
42. Jones-Rhoades, M. W., Bartel, D. P. & Bartel, B. MicroRNAS and their regulatory roles in plants. Annu. Rev. Plant Biol. 57, 19–53.
https://doi.org/10.1146/annurev.arplant.57.032905.105218 (2006).
Scientific Reports | (2021) 11:4769 | https://doi.org/10.1038/s41598-021-83520-6 12
Vol:.(1234567890)www.nature.com/scientificreports/
43. Tirumalai, V., Swetha, C., Nair, A., Pandit, A. & Shivaprasad, P. V. miR828 and miR858 regulate VvMYB114 to promote anthocyanin
and flavonol accumulation in grapes. J. Exp. Bot. 70, 4775–4792. https://doi.org/10.1093/jxb/erz264 (2019).
44. Xu, X. et al. Deep sequencing identifies tissue-specific microRNAs and their target genes involving in the biosynthesis of tanshi-
nones in Salvia miltiorrhiza. PLoS ONE 9, e111679. https://doi.org/10.1371/journal.pone.0111679 (2014).
45. Zhang, H. et al. Identification and characterization of Salvia miltiorrhizain miRNAs in response to replanting disease. PLoS ONE
11, e0159905. https://doi.org/10.1371/journal.pone.0159905 (2016).
46. Meyers, B. C. et al. Criteria for annotation of plant MicroRNAs. Plant Cell 20, 3186–3190. https://doi.org/10.1105/tpc.108.06431
1 (2008).
47. Zhang, L. et al. Genome-wide analysis and molecular dissection of the SPL gene family in Salvia miltiorrhiza. J. Integr. Plant Biol.
56, 38–50. https://doi.org/10.1111/jipb.12111 (2014).
48. Dutrow, N. et al. Dynamic transcriptome of Schizosaccharomyces pombe shown by RNA-DNA hybrid mapping. Nat. Genet. 40,
977–986. https://doi.org/10.1038/ng.196 (2008).
49. Ozsolak, F. et al. Comprehensive polyadenylation site maps in yeast and human reveal pervasive alternative polyadenylation. Cell
143, 1018–1029. https://doi.org/10.1016/j.cell.2010.11.020 (2010).
50. Saito, K. et al. The flavonoid biosynthetic pathway in Arabidopsis: structural and genetic diversity. Plant Physiol. Biochem. 72,
21–34. https://doi.org/10.1016/j.plaphy.2013.02.001 (2013).
51. Pelechano, V. & Steinmetz, L. M. Gene regulation by antisense transcription. Nat. Rev. Genet. 14, 880–893. https: //doi.org/10.1038/
nrg3594 (2013).
52. Yap, K. L. et al. Molecular interplay of the noncoding RNA ANRIL and methylated histone H3 lysine 27 by polycomb CBX7 in
transcriptional silencing of INK4a. Mol. Cell 38, 662–674. https://doi.org/10.1016/j.molcel.2010.03.021 (2010).
53. Latos, P. A. et al. Airn transcriptional overlap, but not its lncRNA products, induces imprinted Igf2r silencing. Science 338,
1469–1472. https://doi.org/10.1126/science.1228110 (2012).
54. Gupta, R. A. et al. Long non-coding RNA HOTAIR reprograms chromatin state to promote cancer metastasis. Nature 464,
1071–1076. https://doi.org/10.1038/nature08975 (2010).
55. Palmer, A. C., Ahlgren-Berg, A., Egan, J. B., Dodd, I. B. & Shearwin, K. E. Potent transcriptional interference by pausing of RNA
polymerases over a downstream promoter. Mol. Cell 34, 545–555. https://doi.org/10.1016/j.molcel.2009.04.018 (2009).
56. Kawano, M., Aravind, L. & Storz, G. An antisense RNA controls synthesis of an SOS-induced toxin evolved from an antitoxin.
Mol. Microbiol. 64, 738–754. https://doi.org/10.1111/j.1365-2958.2007.05688.x (2007).
57. Trapnell, C. et al. Transcript assembly and quantification by RNA-Seq reveals unannotated transcripts and isoform switching
during cell differentiation. Nat. Biotechnol. 28, 511–515. https://doi.org/10.1038/nbt.1621 (2010).
58. Yu, D., Meng, Y., Zuo, Z., Xue, J. & Wang, H. NATpipe: an integrative pipeline for systematical discovery of natural antisense
transcripts (NATs) and phase-distributed nat-siRNAs from de novo assembled transcriptomes. Sci. Rep. 6, 21666. https://doi.
org/10.1038/srep21666 (2016).
59. Kang, Y.-J. et al. CPC2: a fast and accurate coding potential calculator based on sequence intrinsic features. Nucl. Acids Res. 45,
W12–W16. https://doi.org/10.1093/nar/gkx428 (2017).
60. Zhou, Y. et al. Metascape provides a biologist-oriented resource for the analysis of systems-level datasets. Nat. Commun. 10, 1523.
https://doi.org/10.1038/s41467-019-09234-6 (2019).
61. Kawakami, E. et al. Strand-specific real-time RT-PCR for distinguishing influenza vRNA, cRNA, and mRNA. J. Virol. Methods
173, 1–6. https://doi.org/10.1016/j.jviromet.2010.12.014 (2011).
62. Hu, B. et al. GSDS 2.0: an upgraded gene feature visualization server. Bioinformatics 31, 1296–1297. https://doi.org/10.1093/bioin
formatics/btu817(2015) (2015).
63. Reuter, J. S. & Mathews, D. H. RNAstructure: software for RNA secondary structure prediction and analysis. BMC Bioinform. 11,
129. https://doi.org/10.1186/1471-2105-11-129 (2010).
Acknowledgements
This work was supported by the Chinese Academy of Medical Sciences Innovation Funds for Medical Sciences
(CIFMS) [2016-I2M-3-016, 2017-I2M-1-013], the National Science Foundation Funds [81872966], and the
National Science &Technology Fundamental Resources Investigation Program of China [2018FY100705], Qing-
hai Tibet Plateau phytochemistry Key Laboratory (2020-ZJ-Y20). The funders were not involved in the study
design, data collection and analysis, decision to be published, or manuscript preparation.
Author contributions
C.L. conceived the study. M.J. performed data analysis and NATs validation and drafted the manuscript. H.M.C.
collected S. miltiorrhiza, extracted RNA for next-generation sequencing. J.T.L. performed qPCR validation exper-
iments; S.L. reviewed the manuscript critically. Q.D. designed and revised the manuscript. All authors have read
and agreed on the contents of the manuscript.
Competing interests
The authors declare no competing interests.
Additional information
Supplementary Information The online version contains supplementary material available at (https://doi.
org/10.1038/s41598-021-83520-6).
Correspondence and requests for materials should be addressed to S.L. or C.L.
Reprints and permissions information is available at www.nature.com/reprints.
Publisher’s note Springer Nature remains neutral with regard to jurisdictional claims in published maps and
institutional affiliations.
Scientific Reports | (2021) 11:4769 | https://doi.org/10.1038/s41598-021-83520-6 13
Vol.:(0123456789)www.nature.com/scientificreports/
Open Access This article is licensed under a Creative Commons Attribution 4.0 International
License, which permits use, sharing, adaptation, distribution and reproduction in any medium or
format, as long as you give appropriate credit to the original author(s) and the source, provide a link to the
Creative Commons licence, and indicate if changes were made. The images or other third party material in this
article are included in the article’s Creative Commons licence, unless indicated otherwise in a credit line to the
material. If material is not included in the article’s Creative Commons licence and your intended use is not
permitted by statutory regulation or exceeds the permitted use, you will need to obtain permission directly from
the copyright holder. To view a copy of this licence, visit http://creativecommons.org/licenses/by/4.0/.
© The Author(s) 2021
Scientific Reports | (2021) 11:4769 | https://doi.org/10.1038/s41598-021-83520-6 14
Vol:.(1234567890)You can also read


