Growing up in a new world: trait divergence between rural, urban, and invasive populations of an amphibian urban invader - NeoBiota
←
→
Page content transcription
If your browser does not render page correctly, please read the page content below
A peer-reviewed open-access journal
NeoBiota 69: 103–132 (2021)
doi: 10.3897/neobiota.69.67995                           RESEARCH ARTICLE
                                                                                                                            NeoBiota
https://neobiota.pensoft.net                                                                         Advancing research on alien species and biological invasions

           Growing up in a new world: trait divergence
          between rural, urban, and invasive populations
                 of an amphibian urban invader

            Max Mühlenhaupt1,2, James Baxter-Gilbert2, Buyisile G. Makhubo3,
                           Julia L. Riley4,5, John Measey2

1 Department of Biology, Chemistry, Pharmacy, Institute of Biology, Freie Universität Berlin, Königin-Luise-
Str. 1-3, 14195 Berlin, Germany 2 Centre for Invasion Biology, Department of Botany and Zoology, Stel-
lenbosch University, Stellenbosch, Western Cape, 7600, South Africa 3 School of Life Sciences, University of
KwaZulu-Natal, Private Bag X54001 Durban, 4000, South Africa 4 Department of Botany and Zoology,
Stellenbosch University, Stellenbosch, Western Cape, 7600, South Africa 5 Department of Biology, Dalhousie
University, Halifax, Nova Scotia, B3H 4R2, Canada

Corresponding author: Max Mühlenhaupt (max.muehlenhaupt@sunrisepc.de)

Academic editor: Sandro Bertolino | Received 28 April 2021 | Accepted 9 September 2021 | Published 20 October 2021

Citation: Mühlenhaupt M, Baxter-Gilbert J, Makhubo BG, Riley JL, Measey J (2021) Growing up in a new world:
trait divergence between rural, urban, and invasive populations of an amphibian urban invader. NeoBiota 69: 103–132.
https://doi.org/10.3897/neobiota.69.67995

Abstract
Cities are focal points of introduction for invasive species. Urban evolution might facilitate the success of
invasive species in recipient urban habitats. Here we test this hypothesis by rearing tadpoles of a successful
amphibian urban coloniser and invader in a common garden environment. We compared growth rate,
morphological traits, swimming performance, and developmental rate of guttural toad tadpoles (Scle-
rophrys gutturalis) from native rural, native urban, and non-native urban habitats. By measuring these
traits across ontogeny, we were also able to compare divergence across different origins as the tadpoles
develop. The tadpoles of non-native urban origin showed significantly slower developmental rate (e.g.,
the proportion of tadpoles reaching Gosner stage 31 or higher was lower at age 40 days) than tadpoles of
native urban origin. Yet, tadpoles did not differ in growth rate or any morphological or performance trait
examined, and none of these traits showed divergent ontogenetic changes between tadpoles of different
origin. These findings suggest that prior adaptation to urban habitats in larval traits likely does not play
an important role in facilitating the invasion success of guttural toads into other urban habitats. Instead,
we suggest that evolutionary changes in larval traits after colonization (e.g., developmental rate), together
with decoupling of other traits and phenotypic plasticity might explain how this species succeeded in
colonising extra-limital urban habitats.

Copyright Max Mühlenhaupt et al. This is an open access article distributed under the terms of the Creative Commons Attribution License (CC
BY 4.0), which permits unrestricted use, distribution, and reproduction in any medium, provided the original author and source are credited.
104                   Max Mühlenhaupt et al. / NeoBiota 69: 103–132 (2021)

Keywords
AIAI hypothesis, development, growth rate, invasion biology, morphology, performance, tadpole, urban
evolution

Introduction

Invasive species pose a major threat to global biodiversity, human wellbeing, and the
economy (Pejchar and Mooney 2009; Gallardo et al. 2016; Mollot et al. 2017; Hanley
and Roberts 2019; Diagne et al. 2021). The introduction of invasive populations is
fundamentally linked to human activities such as global transport and habitat altera-
tion (Pyšek et al. 2010; Blackburn et al. 2011; Hill et al. 2017b; McLean et al. 2017).
Heavily-modified landscapes, like cities, harbour a significant proportion of invasive
species (Cadotte et al. 2017; Gaertner et al. 2017), moreover, urban land cover is pre-
dicted to expand rapidly with rising human populations - especially in countries within
biodiversity hotspots (Seto et al. 2012). Urban areas are focal points of introduction for
alien biota due to global trade and transportation (Padayachee et al. 2017; Bullock et al.
2018; Gippet et al. 2019; Rivkin et al. 2019), and they show distinct habitat character-
istics that make cities more similar to each other than when comparing each city to its
surrounding less-disturbed environment (McKinney 2006; Grimm et al. 2008). Those
habitat characteristics (e.g., reduced native biodiversity and predator species richness,
higher rates of impervious surface area, and the urban heat-island effect; McKinney
2006; Grimm et al. 2008; Ramamurthy and Bou-Zeid 2017) can also facilitate, if not
promote, the establishment of invasive populations (McKinney 2008; Santangelo et
al. 2018; Des Roches et al. 2020; Reed et al. 2020). Thus, if an alien population has
established in one city, there may be an increased likelihood that propagules from that
population could disperse to other cities where they encounter similar environmental
conditions due to the homogenisation of urban landscapes, making their establishment
and spread more likely (McKinney 2006; Rivkin et al. 2019; Reed et al. 2020).
     Recently, evolutionary biologists have begun studying the adaptive divergence of
traits in urban populations compared to populations from rural habitats (Johnson and
Munshi-South 2017; Santangelo et al. 2018). Research has shown that urban popula-
tions can evolve to cope with novel challenges that cities pose (e.g., Brans et al. 2017a,
b; Tüzün et al. 2017; Putman et al. 2019; Corsini et al. 2021). However, whether and
how adaptation to urban habitats facilitates the establishment success of populations
transported to cities outside their natural ranges remains largely unknown (Reed et
al. 2020; Borden and Flory 2021). The ”Anthropogenically Induced Adaptation to
Invade” (AIAI) hypothesis (Hufbauer et al. 2012) postulates that anthropogenically
modified habitats force adaptations in native populations to the anthropogenic selec-
tion regime, and given that altered landscapes are well connected due to global trade,
the likelihood of prior adapted populations being transported to another anthropo-
genically modified habitat is high (e.g., Brady and Hay 2020). As human landscape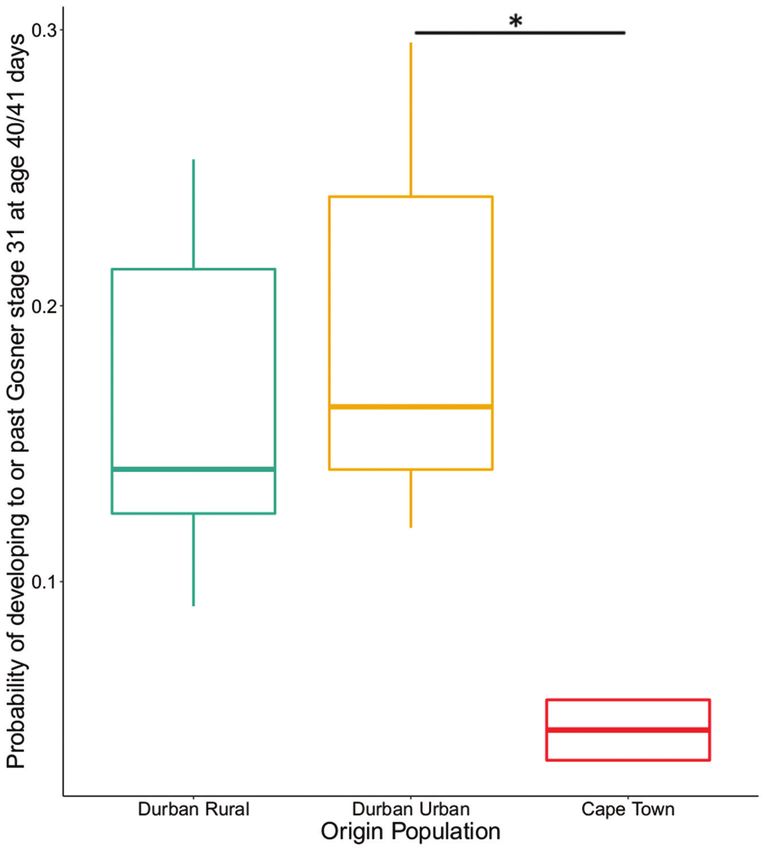
Trait divergence between rural, urban, and invasive tadpoles         105

alterations lead to homogenisation of habitats (McKinney 2006), a prior adapted pop-
ulation will display a phenotype that is less likely to be mismatched in the recipient
altered habitat compared to when being introduced to an unaltered habitat (Hufbauer
et al. 2012). Thus, cities – as highly modified and interconnected habitats - pose an
excellent opportunity to test the AIAI hypothesis.
     To date, few studies have investigated whether prior adaptation to urban habitats
facilitates invasion success in introduced habitats (Borden and Flory 2021). One such
prior adaptation shown to provide invasive populations an advantage in urban land-
scapes are adaptive shifts in thermotolerance which occur in human-modified habi-
tats before colonisation of novel ranges of the little fire ant (Wasmannia auropunctata;
Foucaud et al. 2013) and several species of parrot (Jackson et al. 2015; Strubbe et al.
2015). Furthermore, several studies have shown that prior adaptation to the selective
regime of the introduced range enhances invader fitness (Rey et al. 2012; Vahsen et al.
2018; Saarinen et al. 2019; Sherpa et al. 2019; Alzate et al. 2020). To study if and how
urban evolution leads to prior adaptation in invasive populations some key attributes
are required of the model system. First, there needs to be a population in an urban and
in a rural habitat (preferably in close proximity) in the native range where the urban
population is confronted with novel environmental challenges compared to the an-
cestral rural environment (Hufbauer et al. 2012; Borden and Flory 2021). Second, an
invasive population must have been established in an urban area and this population
must have originated from the native urban population (Hufbauer et al. 2012; Borden
and Flory 2021). Third, to study evolutionary changes, the traits examined must be
shown to be genetically fixed (e.g., by using a common garden experiment; Hufbauer
et al. 2012; Lambert et al. 2020; Borden and Flory 2021).
     Amphibians provide an excellent model system for examining the relationship be-
tween urban adaptations and invasions. Currently, there are more than 120 amphibian
species with recognised invasive populations globally (Measey et al. 2020a), many of
which were established through urban/suburban landscapes (e.g., Rebelo et al. 2010;
Moore et al. 2015; Tingley et al. 2015) or other anthropogenically-altered habitats (e.g.,
aquacultural areas; Wang et al. 2019). Furthermore, a number of traits (e.g., growth
rate, body shape, and developmental rate) have been demonstrated to diverge between
rural/urban, and native/invasive amphibian populations (Iglesias-Carrasco et al. 2017;
Iglesias-Carrasco et al. 2018; Eakin et al. 2019) and amphibians are well-known to
show rapid evolution particularly in larval traits (e.g., Skelly and Freidenburg 2008;
Nunes et al. 2014; Melotto et al. 2020). For example, comparisons of rural and urban
populations have shown that wood frog tadpoles (Lithobates sylvaticus) in suburban
pools were larger and developed earlier compared to tadpoles from rural pools (Eakin
et al. 2019), also urban adult males tended to be larger and have a better body condi-
tion in several amphibian species compared to rural adult males (Iglesias-Carrasco et
al. 2017). Thus, urban amphibian populations, especially of urban exploitative species,
benefit from altered biotic and abiotic factors in urban wetlands, such as reduced inter-
specific competition and longer hydroperiods (i.e., wetland permanency) (Rubbo and
Kiesecker 2005; Hassall 2014; Hill et al. 2017a). This trend is continued for invasive
106 Max Mühlenhaupt et al. / NeoBiota 69: 103–132 (2021)
amphibian populations that benefit from reduced competition by growing and devel-
oping faster, presumably to begin reproducing sooner (Phillips 2009; Pujol-Buxó et al.
2020). There has not been much work done on how tadpole swimming performance
and the underlying morphological traits (i.e., body shape and tail morphology; Van
Buskirk et al. 1997; Dayton et al. 2005; Teplitsky et al. 2005; Arendt 2010) diverge
between rural and urban or between native and invasive populations. These traits,
however, are known to change in response to novel selection regimes such as reduced
predation and/or competition (i.e., larger bodies and smaller tail fins; Smith and Van
Buskirk 1995; Relyea 2002; Relyea 2004; Dayton et al. 2005). Since urban bodies of
water often represent habitats with reduced predation and interspecific competition
for aquatic organisms (Rubbo and Kiesecker 2005; Hassall 2014), selection on mor-
phological and performance traits may differ between rural and urban populations.
Here, we will examine the trait divergence in tadpoles of the guttural toad (Sclerophrys
gutturalis) of three different origins in South Africa: native rural (Durban Rural), native
urban (Durban Urban), and non-native urban (Cape Town, an invasive population that
originated from Durban; Telford et al. 2019), within a common garden experiment. We
focus on a suite of traits across development including tadpole body shape, tail morphol-
ogy, and swimming performance. Furthermore, we examine whether these traits diverge
across larval ontogeny between tadpoles of different origin. In doing so, we aim to test
three hypotheses relating to the tadpoles’ development, morphology, and performance
capacity. Firstly, we predict that native rural tadpoles grow and develop slower than native
urban tadpoles and urban invasive tadpoles grow and develop the fastest (i.e., relating to
evolved increases in growth and developmental rate in urban/invasive populations; Sar-
gent and Lodge 2014; Brans and De Meester 2018). Secondly, we expect that native rural
tadpoles will have more slender bodies, but larger tail fins relative to body size, compared
to native urban tadpoles and that invasive urban tadpoles have the bulkiest bodies with the
smallest tail fins relative to body size (i.e., relating to reduced predation and competition
in urban/invasive habitats; Rubbo and Kiesecker 2005; Hassall 2014; Hill et al. 2017a and
following the findings of previous work on tadpole morphology; Smith and Van Buskirk
1995; Relyea 2002; Relyea 2004; Dayton et al. 2005). With these differences in growth,
development and shape established, we then predict that native rural tadpoles will exhibit
the fastest swimming speeds with native urban tadpoles being intermediary and invasive
urban tadpoles to exhibit the slowest swimming speeds, owing to the expected differences
in morphology and following the known effect of body and tail shape on performance
(Van Buskirk et al. 1997; Dayton et al. 2005; Teplitsky et al. 2005; Arendt 2010).
Materials and methods
Study species
The guttural toad is a large bufonid (maximum snout-vent length (SVL)) of 140mm;
du Preez et al. 2004), which is sexually dimorphic in body size (Baxter‐Gilbert et al.Trait divergence between rural, urban, and invasive tadpoles 107
2020; Suppl. material 1: Fig. S1) and has a wide distribution in sub-Saharan Africa
(Fig. 1A, B; du Preez et al. 2004; Telford et al. 2019). This habitat generalist can be
found in a variety of environments including forests, grasslands, agricultural, and ur-
ban areas (du Preez et al. 2004; Channing et al. 2012; Baxter‐Gilbert et al. 2020). Gut-
tural toads breed in natural water bodies, such as shallow pools in rivers, and anthro-
pogenic bodies of water, such as garden ponds and ditches. A single clutch can contain
up to 25,000 eggs, laid in gelatinous strings (du Preez et al. 2004). Tadpoles usually
develop over the course of five to six weeks with toadlets leaving the water as soon as
the front legs have fully developed (du Preez et al. 2004; Suppl. material 1: Fig. S2).
The species has successfully established invasive populations in Mauritius, Réun-
ion, and near Cape Town (Constantia, South Africa) (Measey et al. 2017; Telford et
al. 2019; Measey et al. 2020b). Recent genetic analyses have confirmed that all three
invasive populations originated from a clade located in the area around the port city
of Durban in eastern South Africa (Telford et al. 2019). In the case of the invasive
Cape Town population, guttural toads were most likely introduced as eggs or tadpoles
within a shipment of aquatic plants at the end of the 1990s originating from a residen-
tial area of Durban (De Villiers 2006; Measey et al. 2017).
Sampling sites, animal collection, husbandry, and breeding
Breeding-sized adults (Suppl. material 1: Fig. S1) were collected from the end of
November 2019 to the beginning of February 2020. We collected toads from two
sites in the rural area surrounding Durban (hereafter referred to as “Durban Rural”:
29°51'31"S, 30°43'18"E and 29°28'17"S, 31°13'25"E with 302 m and 54 m eleva-
tion above sea-level [a. s. l.], respectively), from two urban sites in and near Durban
(hereafter referred to as “Durban Urban”: 29°50'55"S, 31°00'30"E and 29°49'08"S,
30°56'37"E with 24 m and 194 m elevation a. s. l., respectively). Toads from the
extra-limital range in Constantia near Cape Town (hereafter referred to as “Cape
Town”: 34°01’29"S, 18°26'03"E with 50–100 m elevation a. s. l.) were collected as
part of an invasive species control operation (Davies et al. 2020a, 2020b). We chose
the Durban Urban sites because they show similar habitat characteristics as the Cape
Town sites, like high relative proportion of impervious surface area, well-established
human populations, high numbers of buildings and roads, and the bodies of water
within those urban sampling sites were either anthropogenically altered or created
(e.g., fish ponds, fountains, or ditches) with heavily modified shorelines (Fig. 1D, E)
and frequently contained ornamental fish species. All these characteristics are typical
of urban environments (Rubbo and Kiesecker 2005; du Toit and Cilliers 2011; Moll
et al. 2019) and have frequently been shown to drive adaptation in urban populations
(e.g., Winchell et al. 2016; Corsini et al. 2021). Conversely, the Durban Rural sites
have very low relative proportions of impervious surface area, few human settlements
nearby with low human population densities and little human alteration. The bodies
of water within our rural sites (i.e., a large lake and a series of ponds) are charac-
terised by only very few anthropogenic modifications of the shoreline with riparian108 Max Mühlenhaupt et al. / NeoBiota 69: 103–132 (2021)
Figure 1. Overview of the study system A a guttural toad (Sclerophrys gutturalis): this female was photo-
graphed in Cape Town B the species’ natural and non-native distribution in South Africa. The approxi-
mate locations of sampling sites are demarcated for Durban Rural (green), Durban Urban (yellow), and
Cape Town (red). Further we show the general appearance of C the Durban Rural D durban Urban, and
E Cape Town sampling sites.
grasslands consisting of mainly native plants and the presence of native fish species
(Fig. 1C).
Shortly after collection, toads were transported to an experimental facility located
at the University of KwaZulu-Natal (Westville Campus) situated at one of our sampling
locations for Durban Urban. In the facility, toads were housed by sex and collection site
in large plastic mesocosms (110 cm L × 130 cm W × 50 cm H) until they were used
for breeding. Each mesocosm contained at least two water bowls (~ 15 cm L × 10 cm
W × 5 cm H) on a 10 cm layer of soil mixed with leaf litter collected outside of the
greenhouse. Crickets (Acheta domesticus) were fed to adults ad libitum every other day.
To initiate breeding, we injected adults with a synthetic gonadotrophin, leuroprore-
lin acetate (Lucrin Depot, Abbott), diluted 1:20 with Ringer’s solution using 0.666 ml
of that dilution for females and 0.333 ml for males (Hamilton et al. 2005; Hudson et al.
2015). Breeding was induced from December 2019 to the beginning of March 2020 in
batches of breeding pairs due to logistical reasons. This means that clutches were not all
laid at the same time but rather breeding was carried out over the whole period described.
However, we spread breeding for the different toad origins over this entire period. Injec-
tions took place at ~17:00 h. After a breeding pair was injected, pairs of male and female
toads were placed into plastic containers (26 × 41 cm) filled to a height of 4 cm with aged
tap water and left overnight. Usually, males would initiate amplexus shortly after being
introduced to the female. The next morning at ~09:00 h containers were checked for
fertilised clutches and adults were removed from the containers. All adults were used forTrait divergence between rural, urban, and invasive tadpoles 109 breeding only once. New clutches were cleaned from any faecal material and water was replaced with aged tap water and filled to a height of 15 cm in the plastic containers. We replaced water regularly with aged tap water and made sure tanks were well aerated and clean. Embryonal development was rapid and, after one day, most embryos had hatched. For our mesocosm experiment, this was considered as “age 0" day for tadpoles. Mesocosm experiment Prior to the experiment, large plastic mesocosms (110 cm L × 130 cm W × 50 cm H; n = 33) located in the experimental facility were filled with 600 L of tap water and left to age for a week. Subsequently, the water was inoculated with water from a standing water tank to induce establishment of phyto- and zooplankton communities within the mesocosms. This water tank was located in the greenhouse (i.e., preventing access from toads and fish) and had live aquatic vegetation and algae growing within it. After another week, 50 g of rabbit chow (Rabbit Pellets, Westerman’s Premium; 9% protein, 1.25% fat, 0.75% calcium by weight) was added for additional nutrients (Semlitsch and Boone 2009). Mesocosms were placed under work benches so that half of the water surface was shaded and the other half received sunlight through the roof pan- els of the facility. After approximately one month, all mesocosms contained a visible phyto- and zooplanktonic community and were subsequently deemed ready for use. At the clutch age of three days, 1000 tadpoles from a single clutch (i.e., full siblings) were enumerated and introduced to a readied mesocosm where they would be housed until the end of the experiment. For a summary of the average daily maximum and minimum temperatures inside the mesocosms over the course of the experiment see Suppl. material 1: Fig. S3. Sample sizes and measurements across ontogeny At clutch age of three days, 20 tadpoles from one clutch were randomly selected for measurements (see below) and were returned to their respective mesocosms afterwards. At the age of ten days, and subsequently every ten days (i.e., age 20, 30, 40, 50 and 60 days), 20 tadpoles were randomly selected from each mesocosm, and measurement procedures were repeated (for sample sizes see Table 1). Note that for some clutches we were not able to conduct measurements on the scheduled day and instead conducted measurements on the next possible day (Suppl. material 1: Table S1). For all trait meas- urements, we made sure to only include tadpoles that did not show development past Gosner stage 41 (i.e., hindlimbs fully developed but tail not resorbed and front limbs did not emerge; Gosner 1960) as metamorphosis strongly affects the expression of the traits we examined in subsequent stages (Watanabe and Sasaki 1974; Gilbert 2000; Vitt and Caldwell 2013). Notes were made on any individuals that reached metamor- phosis as they climbed on to floating platforms placed inside the mesocosms. After the measurements (see below), tadpoles were returned to their respective meso- cosms. We acknowledge that our replicates cannot be assumed to be fully independent
110                       Max Mühlenhaupt et al. / NeoBiota 69: 103–132 (2021)

Table 1. Sample sizes for guttural toad (Sclerophrys gutturalis) tadpoles across age: numbers below the
specific traits correspond to the total number of tadpoles measured at the specific age. The total number
of clutches used in this experiment was 10 (3/7), 14 (8/6), and 9 for Durban Rural, Durban Urban and
Cape Town, respectively. The numbers in brackets correspond with the specific number of clutches de-
rived from adults collected in either the first or seco nd sampling location for Durban Rural or Durban
Urban, respectively (see Methods). For a more detailed report of the sample sizes in this experiment see
Suppl. material 1: Table S1.

       Traits           Durban Rural                Durban Urban                       Cape Town
                tail fin height,

                                                   tail fin height,

                                                                                     tail fin height,
                 Body height,

                                                    Body height,

                                                                                      Body height,
                                   acceleration

                                                                      acceleration

                                                                                                        acceleration
                  SVL, body

                                   SVL, body

                                                                      SVL, body
                  tail muscle

                                                     tail muscle

                                                                                       tail muscle
                                    Maximum

                                                                       Maximum

                                                                                                         Maximum
                                    maximum

                                                                       maximum

                                                                                                         maximum
                  width, tail

                                    width, tail

                                                                       width, tail
                                     velocity,

                                                                        velocity,

                                                                                                          velocity,
                     length

                     height

                                      length

                                                        height

                                                                         length

                                                                                          height
Age (Days)
2–4               199      199         199   272         271            272   180          180              179
10–12             200      199         200   240         235            240   160          160              160
20                200      200         200   180         179            180   160          160              160
30                200      199         200   180         180            180   80            80              80
40–41             160      160         160   180         180            180   80            80              80
50                 60       60          60   180         180            180   60            60              60
60                 60       60          60   100         100            100   40            40              40

(e.g., a tadpole that was randomly picked for measurements at an age of three days
might have been picked for another subsequent measurement at a higher age). How-
ever, since each mesocosm housed 1000 tadpoles at the start of the experiment, it is
unlikely that a single tadpole was recurrently picked for measurements. As such our
statistical analyses use the assumption that repeated measurements of an individual
tadpole did not occur.

Morphological measurements and developmental rate
We measured standard morphological variables of tadpoles: SVL, tail length, body
width, body height, tail muscle height, and tail fin height to 0.001 mm (Altig 2007;
Suppl. material 1: Fig. S4). Images were scaled using millimeter paper in the back-
ground of tadpole pictures. Tadpole morphology was measured using the measure-
ment function of the image and video analysis software Tracker (Open Source Physics,
USA) (Brown and Cox 2009). To observe differences in body shape, we also calculated
body volume (mm3) using the formula ��4 × π x.SVI. × hady width. × height ��4 × π
x.SVI. × hady width. × height (e.g., tadpoles with bulkier bodies have higher values
than tadpoles with more slender bodies). At the age of 40/41 days (see Table 1 for
sample sizes, Suppl. material 1: Table S1), we also carefully examined tadpole images
to see whether tadpoles had developed to, or past, Gosner stage 31 (i.e., well-developed
hindlimbs; Gosner 1960) to study if developmental rate diverges between tadpoles of
different origin. The purpose of using Gosner stage 31 as a threshold was to have a clear
morphological marker (i.e., hindlimb; Gosner 1960) that is unambiguously identifi-
able from images of the tadpoles.
Trait divergence between rural, urban, and invasive tadpoles 111
Performance measurements and video analysis
All tadpoles that underwent morphological measurements were also tested for swim-
ming performance on the same day. Performance trials were carried out in a clear
plexiglass tank (30 × 5 cm) filled with 3 cm of aged tap water (Wagener et al. 2021).
A mirror was attached to the tank at an angle of 45° to enable us to record the move-
ment of tadpoles using a dorsal and lateral point of view. At the start of the trial, an
individual tadpole was gently placed inside the arena and left to acclimate for ~5 s.
Water temperature was recorded using a standard digital thermometer. Tadpoles were
tapped at the tail fin with a fine metal wire to initiate burst escape swimming for ~30 s.
Videos of tadpoles swimming were recorded using a camera (Canon PowerShot G16)
at 120 frames per second.
High-speed videos were recorded from a dorsal and lateral perspective to the tad-
pole, using an angled mirror attached to the tank. As a swimming bout we defined
the movement of a tadpole, initiated by rapid lashes of the tail fin in response to an
approach or a touch by the metal wire, from the beginning to the end of the displace-
ment. Only swimming bouts that were carried out on a horizontal plane with a dis-
placement at least 2 cm away from its initial position were selected. For each tadpole,
we analysed three swimming bouts that were judged to yield the highest values for
velocity and acceleration. Using the image and video analysis software Tracker (Brown
and Cox 2009), we extracted the x- and y-coordinates from the videos and the dis-
placement (mm) of the tadpole per frame was calculated. Videos were scaled using
millimeter paper in the background of videos. We filtered the displacement data us-
ing a fourth order zero-phase shift low-pass Butterworth filter (Christodoulakis et al.
2010) and used a 12 Hz cut-off frequency which was determined as a 10th of the video
recording frame rate. The Butterworth fourth order zero-phase shift low-pass filter is
used to reduce noise in a data set by a given cut-off frequency (i.e., reducing the num-
ber of data points to filter noise in a data set) with the possibility to differentiate the
filtered data into velocity (first derivate against time) and acceleration (second derivate
against time) (Winter 2004; Erer 2007). From the filtered data we extracted maximum
swimming velocity (mm × s-1) and maximum swimming acceleration (mm × s-2) for
each tadpole.
Statistical analysis
All statistical analyses were conducted using R version 4.0.1 (R Core Team 2020). Be-
fore analysis, we explored our data following Zuur et al. (2010). We did not find any
unexplainable outliers and ensured the models did not contain strongly confounded
predictor variables. All figures presented in the results section were created using the
R package “ggplot2” (Hadley 2016). All morphological and performance traits were
log-transformed prior to analysis. Following model analysis (see details below), we veri-
fied assumptions of normality and homoscedasticity of outliers prior to interpretation.
Also, we conducted post-hoc multiple comparison tests between all origins (Durban112 Max Mühlenhaupt et al. / NeoBiota 69: 103–132 (2021) Rural, Durban Urban, Cape Town) using the function “emmeans” from the R pack- age “emmeans” (Lenth et al. 2018). All p-values generated for these comparisons were Tukey-adjusted (Lenth et al. 2018). Ontogenetic differentiation of morphological and performance traits To examine differences in growth rate and body volume, we fitted linear mixed effect models (LMM) using the R package “lme4” (Bates et al. 2015). As response variables, we used SVL and body volume, while the fixed effects we used were origin (categori- cal variable with three levels: Durban Rural, Durban Urban, Cape Town), age (days; continuous), and their interaction term. If the interaction term was non-significant, it was removed and the models re-run. The models also included a random intercept and slope of mesocosm ID to control dependencies in our data due to clutch effects and ef- fects of being reared in the same mesocosm, as well as a random intercept of parentage site to accommodate dependency among observations of tadpoles with parentage from the same sampling site. To examine differences in the other variables of interest (tail length, tail muscle height, tail fin height, maximum swimming velocity, and maximum swimming acceleration), we fitted separate LMMs with the variables each using the same fixed and random effects as detailed for the growth rate and body volume models, but these models also included SVL as a fixed effect to standardise the variables with respect to body length. We did not include water temperature in any of our models examining differences in performance traits, because temperature and tadpole age are confounded. Specifically, water temperatures were lower at a higher age (β = –0.033, t = -15.76, p < .001; results from a linear model performed using the “lm” function in the R package “stats” with age as fixed effect; R Core Team 2020). Trait differences at 40 days We also examined trait differences at a specific point in development. We chose age 40/41 days because previous literature has shown that at this age individual traits can diverge between populations (e.g., in European common frogs, Rana temporaria; Van Buskirk and Arioli 2005), and also, because at this age our sample size was still rela- tively high (Table 1). Furthermore, metamorphosis in this species has been previously reported to commence at around an age of 40 days (du Preez et al. 2004), which also corresponded to observations made in this experiment (Suppl. material 1: Fig. S2). Once again, we fitted separate LMMs using the R package “lme4” (Bates et al. 2015) with SVL, body volume, tail length, tail muscle height, tail fin height, maximum swimming velocity, and maximum swimming acceleration as response variables. For all models, apart from the models with SVL or body volume as response variables, we included SVL as a fixed effect. For all models, we also included origin as a fixed effect and included the random intercepts of mesocosm ID and parentage site. Again, we did not include water temperature in our models examining differences in performance variables (see above) to ensure that model results were comparable.
Trait divergence between rural, urban, and invasive tadpoles            113

Developmental rate
To examine differences in developmental rate between tadpoles from different origin
populations, we fitted a generalised linear mixed effects model (GLMM) with logit
link function using the R package “lme4” (Bates et al. 2015). The binomial response
variable described whether tadpoles had developed to or past Gosner stage 31 (Gosner
1960) at an age of 40/41 days or not. We included origin as a fixed effect (categorical
variable with three levels: Durban Rural, Durban Urban, Cape Town) and the random
intercepts of mesocosm ID and parentage site.

Results
Ontogenetic differentiation of morphological and performance traits

None of the observed morphological or performance traits showed significant differ-
ences between tadpoles of different origin (Table 2, Suppl. material 1: Table S2, Fig. 2).
Snout-vent length (SVL) and body volume increased with age (Table 2 and Fig. 2A,
B). Tail length, tail muscle height, tail fin height, maximum swimming velocity, and
maximum swimming acceleration were positively correlated with SVL (Table 2). Only
tail length, relative to SVL, increased with age, whereas in relation to SVL, tail mus-
cle height, maximum swimming velocity, and maximum swimming acceleration de-
creased with age (Table 2). Tail fin height, in relation to SVL, did not change with age
(Table 2).

Morphological and performance trait differences at the age of 40 days
We did not find significant effects of tadpole origin on any morphological or perfor-
mance trait at the age of 40/41 days (Table 3, Suppl. material 1: Table S3, Suppl. material
1: Fig. S5). Tail muscle height, tail fin height, tail length, maximum swimming velocity,
and maximum swimming acceleration were all positively correlated with SVL (Table 3).

Developmental rate
The proportion of tadpoles having developed to or past Gosner stage 31 (Gosner 1960)
was highest for Durban Urban (0.189), followed by Durban Rural (0.179) and was low-
est for Cape Town tadpoles (0.05) as calculated from the raw data. Based on our statisti-
cal analyses, the proportion of tadpoles developing to or past Gosner stage 31 in Cape
Town was only significantly lower in comparison with Durban Urban and no other
significant differences were found (Table 4 and Fig. 3). This general pattern also corre-
sponds with our data indicating that time to metamorphosis tended to be longer in Cape
Town clutches than in clutches from the other habitats, although we were not able to run
a statistical test on this data set due to a limited sample size (Suppl. material 1: Fig. S2).
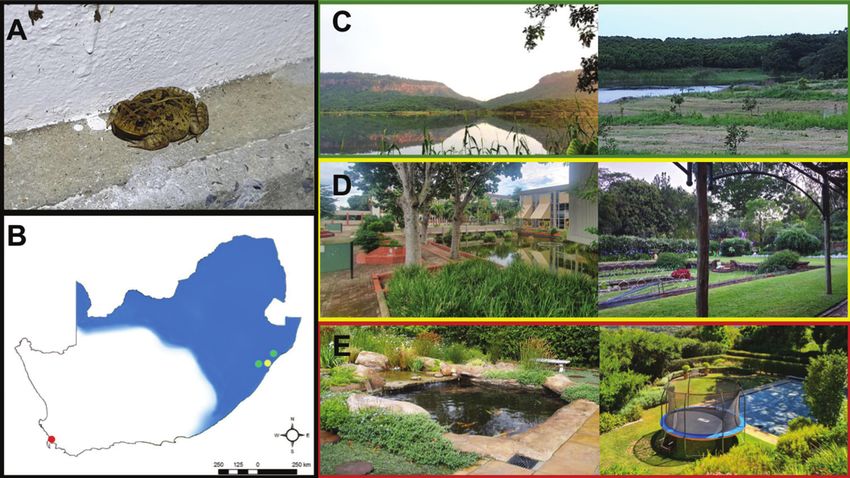
114                    Max Mühlenhaupt et al. / NeoBiota 69: 103–132 (2021)

Figure 2. Trait changes across 60 days post-hatching in tadpoles: none of the observed traits were signifi-
cantly different between origins (native rural – Durban Rural, native urban – Durban Urban, non-native
urban – Cape Town). Presented are A snout-vent length (growth rate) B body volume C tail length D tail
muscle height E tail fin height F maximum swimming velocity, and G maximum swimming acceleration.
All morphological and performance variables were log-transformed prior to analysis and predicted data
was back-transformed before plotting. Circles represent predictions from linear mixed effect models and
the lines represent predicted linear regressions with 95% confidence intervals.

Discussion

Here we show, in a common garden experiment, that the invasive urban Cape Town
population of the guttural toad has a slower larval development (i.e., the proportion
of tadpoles having developed to or past Gosner stage 31 at the age of 40/41 days)
compared to the native urban population from Durban. Contrary to our predictions,
tadpoles of urban/rural or native/invasive origin do not differ in growth rate, or any
of the other morphological or performance traits we examined. From this, we suggest
that prior adaptation to urban habitats (AIAI hypothesis sensu Hufbauer et al. 2012)
in larval morphological, performance, and developmental traits of the guttural toad
did not enhance its invasion success in Cape Town. Rather, the slower larval develop-
ment in Cape Town toads arose within the short period (~ 20 years or 10 generations)
since introduction, indicating bridgehead effects (e.g., Bertelsmeier and Keller 2018).
Had our experiment been able to continue to metamorphosis, we would predict larger
metamorphs from Cape Town given that growth rates did not differ, and which is also
consistent with previous literature on the topic (e.g., Harkey and Semlitsch 1988;
Newman 1989; Touchon et al. 2013; Tarvin et al. 2015). Owing to the study de-
sign used (i.e., a common garden experiment), we cannot rule out potential different
habitat- or site-specific factors that may result in situational or plastic response in wild
populations, however from an innate trait standpoint, we assert that the morphological
Trait divergence between rural, urban, and invasive tadpoles                    115

Figure 3. Probability of reaching Gosner stage 31 or higher (Gosner 1960) for tadpoles of native rural
(Durban Rural), native urban (Durban Urban), and non-native urban (Cape Town) origin at an age of
40/41 days as predicted from our generalised linear mixed effect model. Presented are boxplots. The boxes
denote the interquartile ranges (IQR), the bars inside the boxes correspond with the predicted medians
from the models. The whiskers extend to 1.5 × IQR. Asterisks denote significant differences as determined
by post-hoc multiple comparisons.

or performance traits we examined are not diverging within the larval stage between
urban/rural or native/invasive origin populations.
    One of the most prominent differences between the areas of Durban and Cape
Town is the Mediterranean climate in Cape Town compared to subtropical Durban.
The invasive toad population in Cape Town is confronted with a colder, drier, and
more seasonal climate compared to the climate of the source habitat (Vimercati et al.
2019). Previous studies have already shown that this novel climatic regime likely led
to both physiological as well as behavioural changes in adult toads (Vimercati et al.
116 Max Mühlenhaupt et al. / NeoBiota 69: 103–132 (2021)
Table 2. Outcomes of linear mixed effect models testing for differences in morphological and perfor-
mance traits between guttural toad tadpoles of native rural origin (Durban Rural), native urban origin
(Durban Urban), and invasive urban origin (Cape Town) raised in a common garden environment. All
variables were log-transformed prior to analysis. Presented are model coefficient estimates (β) with their
corresponding standard errors (SE) for fixed effects and variance estimates (σ²) for random effects and re-
siduals. Test statistics (t) are given, and all significant values (p < .05) are presented in bold. For categorical
variables, reference levels are presented in brackets behind the variable name.
Model Variable Names Model Output
Snout-Vent Length Fixed Effects β SE t p
Intercept (Cape Town) 0.412 0.042 9.740 .011
Origin (Durban Rural) 0.064 0.052 1.239 .341
Origin (Durban Urban) 0.025 0.052 0.492 .672
Age 0.006 < 0.001 11.970 < .001
Random Effects σ²
Mesocosm ID < 0.001
Parentage Site 0.002
Residuals 0.008
Body Volume Fixed Effects β SE t p
Intercept (Cape Town) 1.208 0.151 7.983 .016
Origin (Durban Rural) 0.220 0.186 1.187 .358
Origin (Durban Urban) 0.114 0.185 0.614 .602
Age 0.020 0.002 12.606 < .001
Random Effects σ²
Mesocosm ID < 0.001
Parentage Site 0.026
Residuals 0.085
Tail Muscle Height Fixed Effects β SE t p
Intercept (Cape Town) -0.544 0.035 -5.690 .003
Snout-Vent Length 0.542 0.017 31.681 < .001
Origin (Durban Rural) -0.013 0.042 -0.306 .789
Origin (Durban Urban) 0.002 0.042 0.041 .971
Age -0.003 < 0.001 -5.578 < .001
Random Effects σ²
Mesocosm ID < 0.001
Parentage Site 0.001
Residuals 0.008
Tail Fin Height Fixed Effects β SE t p
Intercept (Cape Town) -0.009 0.064 -0.139 .902
Snout-Vent Length 0.393 0.012 31.917 < .001
Origin (Durban Rural) -0.049 0.078 -0.577 .623
Origin (Durban Urban) -0.040 0.078 -0.517 .657
Age -0.004 0.009 -0.434 .670
Random Effects σ²
Mesocosm ID < 0.001
Parentage Site 0.004
Residuals 0.004
Tail Length Fixed Effects β SE t p
Intercept (Cape Town) 0.265 0.009 29.937 < .001
Snout-Vent Length 0.729 0.011 68.726 < .001
Origin (Durban Rural) 0.009 0.010 0.992 .437
Origin (Durban Urban) 0.014 0.009 1.522 .290
Age 0.001 < 0.001 6.995 < .001
Random Effects σ²
Mesocosm ID < 0.001
Parentage Site < 0.001Trait divergence between rural, urban, and invasive tadpoles 117
Model Variable Names Model Output
Residuals 0.003
Maximum Swimming Velocity Fixed Effects β SE t p
Intercept (Cape Town) 1.529 0.090 17.066 .003
Snout-Vent Length 0.667 0.026 25.656 < .001
Origin (Durban Rural) 0.030 0.109 0.277 .808
Origin (Durban Urban) 0.046 0.109 0.423 .714
Age -0.004 0.001 -3.348 .004
Random Effects σ²
Mesocosm ID < 0.001
Parentage Site 0.008
Residuals 0.018
Maximum Swimming Acceleration Fixed Effects β SE t p
Intercept (Cape Town) 2.819 0.042 66.838 < .001
Snout-Vent Length 0.592 0.032 18.303 < .001
Origin (Durban Rural) 0.056 0.049 1.142 .374
Origin (Durban Urban) 0.051 0.049 1.036 .414
Age -0.001 < 0.001 -2.505 .017
Random Effects σ²
Mesocosm ID < 0.001
Parentage Site 0.002
Residuals 0.028
2018; Vimercati et al. 2019; Madelaire et al. 2020; Barsotti et al. 2021). For example,
Madelaire et al. (2020) demonstrated that Cape Town adults show a more efficient
water-conservation behaviour than toads from Durban. From extensive research on
the effects of toad metamorph size, we know that larger metamorphs desiccate less
rapidly and, are able to disperse further, potentially increasing chances of reaching
new bodies of water (Cohen and Alford 1993; Goater et al. 1993; Beck and Congdon
2000; Chelgren et al. 2006; Child et al. 2008; Cabrera-Guzmán et al. 2013). Thus, the
drier summers in Cape Town, during which guttural toads metamorphose, may lead
to strong selection for larger metamorph body sizes (as we hypothesize will arise via
the longer larval developmental time found in this study) in the invasive population.
Given the substantial literature reporting differences in tadpole growth rates due
to ecological or evolutionary factors, we were surprised that we did not find any dif-
ferences in growth rate among the three location types. Several studies on body size
differences among rural and urban, as well as among native and invasive populations,
across a wide range of taxa report higher growth rates and larger adult body sizes for ur-
ban and/or invasive populations (Phillips 2009; y Gomez and Van Dyck 2012; Sargent
and Lodge 2014; Hall and Warner 2017; Iglesias-Carrasco et al. 2017; Pujol-Buxó et
al. 2020; Putman and Tippie 2020), which is widely attributed to lower interspecific
competition, higher food abundance, and novel ecological opportunities in urban and/
or invasive ranges. The opposite trend is, however, also possible. For example, studies
of cladocerans, several orders of insects, and on passerine birds (Brans et al. 2017a, b;
Gianuca et al. 2018; Merckx et al. 2018; Corsini et al. 2021) have found negative ef-
fects of urban environments on body size. In the case of our study species, the guttural
toad, Baxter-Gilbert et al. (2020) showed that invasive populations of guttural toads118 Max Mühlenhaupt et al. / NeoBiota 69: 103–132 (2021)
Table 3. Model output of linear mixed effect models examining differences in guttural toad tadpoles
(Sclerophrys gutturalis) at the age of 40/41 days between guttural toad tadpoles of native rural origin (Dur-
ban Rural), native urban origin (Durban Urban), and invasive urban origin (Cape Town) raised in a com-
mon garden environment. All morphological and performance variables were log-transformed prior to
analysis. Given are model coefficient estimates (β) with their corresponding standard errors (SE) for fixed
effects and variance estimates (σ²) for random effects and residuals. Test statistics (t) are presented, and all
significant values (p < .05) are presented in bold. For categorical variables, reference levels are presented in
brackets behind the variable name.
Model Variable Names Model Output
Snout-Vent Length Fixed Effects β SE t p
Intercept (Cape Town) 0.659 0.026 25.291 < .001
Origin (Durban Rural) 0.025 0.032 0.796 .437
Origin (Durban Urban) 0.043 0.031 1.362 .190
Random Effects σ²
Mesocosm ID 0.002
Parentage Site 0.000
Residuals 0.006
Body Volume Fixed Effects β SE t p
Intercept (Cape Town) 1.993 0.075 26.487 < .001
Origin (Durban Rural) 0.070 0.092 0.757 .459
Origin (Durban Urban) 0.141 0.090 1.564 .135
Random Effects σ²
Mesocosm ID 0.020
Parentage Site 0.000
Residuals 0.051
Tail Muscle Height Fixed Effects β SE t p
Intercept (Cape Town) -0.684 0.080 -8.572 .004
Snout-Vent Length 0.659 0.050 13.212 < .001
Origin (Durban Rural) -0.010 0.089 -0.113 .921
Origin (Durban Urban) 0.029 0.089 0.327 .775
Mesocosm ID 0.001
Parentage Site 0.005
Residuals 0.007
Tail Fin Height Fixed Effects β SE t p
Intercept (Cape Town) -0.038 0.025 -1.525 .147
Snout-Vent Length 0.456 0.031 14.914 < .001
Origin (Durban Rural) -0.024 0.018 -1.363 .315
Origin (Durban Urban) -0.018 0.018 -1.032 .424
Random Effects σ²
Mesocosm ID < 0.001
Parentage Site < 0.001
Residuals 0.002
Tail Length Fixed Effects β SE t p
Intercept (Cape Town) 0.312 0.023 13.772 < .001
Snout-Vent Length 0.734 0.031 23.409 < .001
Origin (Durban Rural) 0.014 0.011 1.220 .238
Origin (Durban Urban) 0.017 0.011 1.534 .142
Random Effects σ²
Mesocosm ID < 0.001
Parentage Site 0.000
Residuals 0.003
Maximum Swimming Velocity Fixed Effects β SE t p
Intercept (Cape Town) 1.329 0.089 14.999 < .001
Snout-Vent Length 0.754 0.075 10.012 < .001
Origin (Durban Rural) -0.007 0.090 -0.083 .942
Origin (Durban Urban) 0.078 0.090 0.865 .479Trait divergence between rural, urban, and invasive tadpoles 119
Model Variable Names Model Output
Random Effects σ²
Mesocosm ID < 0.001
Parentage Site 0.005
Residuals 0.018
Maximum Swimming Acceleration Fixed Effects β SE t p
Intercept (Cape Town) 2.675 0.110 24.272 < .001
Snout-Vent Length 0.737 0.099 7.421 < .001
Origin (Durban Rural) 0.008 0.109 0.077 .945
Origin (Durban Urban) 0.112 0.109 1.028 .413
Random Effects σ²
Mesocosm ID 0.001
Parentage Site 0.007
Residuals 0.029
on the islands of Mauritius and Réunion have smaller adult body sizes compared to
native populations. Observations made in this study (see Suppl. material 1: Fig. S1)
indicate that adult body sizes might diverge between rural, urban, and invasive popu-
lations, as well. Yet, our study suggests that any adult body size differences are not
driven by innate differences in tadpole growth rate, and it is unclear how they arose in
adults (e.g., due to environmental factors such as food, due to phenotypic plasticity or
due to directional selection for smaller or larger adult body sizes). In another success-
ful amphibian invader, the African clawed frog (Xenopus laevis), Kruger et al. (2021)
showed that despite differences in adult body sizes between the core and periphery of
the species’ invasive distribution in France, the tadpoles did not show significant dif-
ferences in growth rates when raised in a common garden experiment, indicating the
decoupling of traits between life stages (but see Phillips 2009 for coupling of growth
rate across larval and juvenile stages in cane toads, Rhinella marina). The decoupling
of traits might also be a potential driver for the apparent similarities in growth rates of
guttural toad tadpoles. Furthermore, the guttural toad is an infamous urban exploiter
with synanthropic behaviour, frequently making use of artificial light sources for forag-
ing and artificial bodies of water for hydration and reproduction (du Preez et al. 2004;
Measey et al. 2017; Vimercati et al. 2017; Baxter-Gilbert et al. 2020; Measey et al.
2020b). Thus, the terrestrial stage of the species might benefit from ecological oppor-
tunities in urban environments that are not available for the aquatic stage and growth
rate might be decoupled between the tadpole and adult stage.
Urban bodies of water have been reported to frequently show high levels of modi-
fication (especially of the riparian zone) and, partly as a consequence, show reduced
native biodiversity and high abundance of invasive species (reviewed in Hassall 2014),
but can also act as biodiversity hotspots in a city (Hassall 2014; Hill et al. 2017a).
Given the potential reduction in predation and competition for Durban Urban and
Cape Town tadpoles, we expected that Durban Rural tadpoles would show the most
conducive phenotype for predator escape and overall better performance under high
competition scenarios (i.e., high burst escape swimming speed, slim bodies and large
tail fins; Smith and Van Buskirk 1995; Relyea 2002; Relyea 2004; Dayton et al. 2005),
which is in line with the enemy release hypothesis (Colautti et al. 2004; Liu and Stiling120 Max Mühlenhaupt et al. / NeoBiota 69: 103–132 (2021)
Table 4. (A) Model output of a generalised linear mixed effects model used to examine differences in gut-
tural toad (Sclerophrys gutturalis) tadpole developmental rates across origins. We present model coefficient
estimates (β) and the corresponding standard errors (SE) for fixed effects, as well as variance estimates
(σ²) for random effects. Test statistics (z) are presented and all significant values (p < .05) are presented in
bold. For the categorical variables, reference levels are presented in brackets behind the variable name. (B)
Results of post-hoc multiple comparisons testing for differences in developmental rate among guttural
toad (Sclerophrys gutturalis) tadpole origins. Presented are conditional odds ratios with their corresponding
standard errors (SE). Test statistics (z) and p-values (pcorr) corrected using a “tukey” adjustment (Lenth et
al. 2018) are given. Significant values are bolded.
(A) Output from the generalised linear mixed effect model
Variable Names
Fixed Effects β SE z p
Intercept (Cape Town) -3.08 0.599 -5.142 < .001
Origin (Durban Rural) 1.37 0.663 2.066 .039
Origin (Durban Urban) 1.534 0.654 2.347 .019
Random Effects σ²
Mesocosm ID 0.324
Parentage Site < 0.001
(B) Multiple Comparisons between Origins
Origin Comparison Conditional Odds Ratio SE z pcorr
Cape Town – Durban Rural 0.254 0.169 -2.066 0.097
Cape Town – Durban Urban 0.216 0.141 -2.347 0.049
Durban Rural – Durban Urban 0.849 0.344 -0.404 0.914
2006). However, similar to growth rate, swimming performance and the underlying
morphological variables did not diverge between tadpoles of different origin. The ur-
ban (Durban Urban) and non-native urban (Cape Town) sampling sites frequently
had artificial ponds that were used for breeding by guttural toads (Vimercati et al.
2017) and, also frequently contained non-native ornamental fish species such as gold-
fish (Carassius auratus) and koi (Cyprinus rubrofuscus) (MM, JB-G & JM pers. obs.).
Similarly, the water bodies in our rural sampling sites also contained fish, but of native
fish species (MM, JB-G & BM pers. obs.) Ornamental fish species as well as many
fish species, native to sub-tropical South Africa, are well-known to reduce invertebrate
densities such as dragonfly larvae (reviewed in Wellborn et al. 1996; Brown et al. 2012;
see also Richardson et al. 1995; Preston et al. 2017) but may not predate on toad
tadpoles due to unpalatability (see Brown et al. 2012 and citations within; Manteifel
and Reshetnikov 2002; Üveges et al. 2019). Invertebrate predators, on the other hand,
have been reported to reduce densities of the larvae of some invasive amphibian spe-
cies, like cane toads (Crossland and Alford 1998; Cabrera-Guzmán et al. 2012) and
African clawed frogs (Warren et al. 2021). Thus, ornamental fish species may carry
out a similar ecological function as native fish species and therefore, a similar selection
regime is present in both rural and urban ponds from the perspective of guttural toads.
More research is needed, however, to understand the facilitating role ornamental and/
or invasive fish species might play in urban bodies with respect to the invasion success
of pond-breeding amphibians (e.g., Adams et al. 2007).
In this common garden experiment, we raised the F1 progeny from toads collected
in the wild. Thus, we cannot rule out maternal/paternal effects on differences or simi-Trait divergence between rural, urban, and invasive tadpoles 121
larities between tadpoles (e.g., Kawecki and Ebert 2004), and the effect of phenotypic
plasticity induced by environmental cues in the tadpole’s respective habitats that might
enhance fitness under the current selective regime. Anuran tadpoles are well-known to
show high levels of phenotypic plasticity in swimming performance and underlying
morphological traits in response to a variety of environmental factors (e.g., Loman and
Claesson 2003; Relyea 2004; Hoverman et al. 2005; Castaneda et al. 2006; Whiles et al.
2010; Gomez-Mestre et al. 2013). Interestingly, Bókony et al. (2021) demonstrated that
urban tadpoles of common toads (Bufo bufo) showed higher baseline stress and a more
efficient recovery to baseline levels compared to tadpoles from natural habitats, partly as
a response to water pollutants. These differences disappeared, however, when individuals
were raised in a common garden environment, suggesting that divergence in the efficacy
of negative feedback is driven by phenotypic plasticity rather than microevolutionary
change (Bókony et al. 2021). Urban-exploitative and invasive species often express high-
ly flexible generalist phenotypes that enable them to colonise new habitats such as cities
(Rodewald and Gehrt 2014; Ducatez et al. 2018; Franzén et al. 2020; Palacio 2020) and
phenotypic plasticity plays an important role in facilitating the success of a small number
of highly abundant species in cities (reviewed in Lowry et al. 2013; Rodewald and Gehrt
2014). Therefore, phenotypic flexibility might also play an important role in the invasion
success of guttural toads and we suggest future research to investigate if and how phe-
notypic plasticity might drive invasion success in this and other urban adapted species.
We show here that prior adaptation in larval growth rate as well as morphological
and performance traits is unlikely to have facilitated the invasion success of guttural
toads in Cape Town. Furthermore, the reduction in developmental rate likely arose af-
ter the introduction to Cape Town. Thus, bridgehead effects and decoupled evolution
of traits are more likely to drive successful colonisation of new habitats in this species.
Our findings suggest several promising avenues of future research. For example, we
suggest investigations examine divergent selection for aquatic and terrestrial life stages
in amphibian invaders, and how this might lead to coupling or decoupling of traits
across life stages. We also know little about how certain habitat characteristics in urban
environments, such as altered species composition or anthropogenic structures, might
facilitate colonisation of invasive populations or how possible plastic traits can enhance
invasion success across different habitat types - which are both important knowledge
gaps to address.
Acknowledgements
We would like to thank NCC Environmental Services (Western Cape) for providing us
with toads from Cape Town, and the managements of Durban Botanic Gardens, and
Shongweni Dam and Nature Reserve for providing us with access to their facilities for
toad collection. MM, JM & JB-G would like to acknowledge the DSI-NRF Centre of
Excellence for Invasion Biology. We would also like to thank N.S. Dludla for invaluable
assistance during the experiment and P. Kowalski for invaluable assistance during field-
work. Furthermore, J. Jeschke provided helpful comments on the first draft of this man-122 Max Mühlenhaupt et al. / NeoBiota 69: 103–132 (2021)
uscript and we would like to thank the lab members of the Measey lab at Stellenbosch
University for productive discussions that helped shape this manuscript. We would
also like to show our gratitude towards S. Bertolino, F.G. Ficetola, and an anonymous
reviewer, who helped improve the quality of this manuscript. We acknowledge support
by the OpenAccess Publication Fund of Freie Universität Berlin for paying the APC.
As the authors, we confirm that we have no conflict of interest, regarding the con-
tent of this study or its outcomes.
References
Adams MJ, Pearl CA (2007) Problems and opportunities managing invasive bullfrogs: is there any
hope? In: Gherardi F (Ed.) Biological invaders in inland waters: profiles, distribution, and threats.
Springer, 679–693. https://link.springer.com/chapter/10.1007%2F978-1-4020-6029-8_38
Altig R (2007) A primer for the morphology of anuran tadpoles. Herpetological Conservation
and Biology 2(1): 71–74. http://www.herpconbio.org/Volume_2/Issue_1/Altig_2007b.pdf
Alzate A, Onstein RE, Etienne RS, Bonte D (2020) The role of preadaptation, propagule pres-
sure and competition in the colonization of new habitats. Oikos 129(6): 820–829. https://
doi.org/10.1111/oik.06871
Arendt J (2010) Morphological correlates of sprint swimming speed in five species of spade-
foot toad tadpoles: comparison of morphometric methods. Journal of Morphology 271(9):
1044–1052. https://doi.org/10.1002/jmor.10851
Barsotti AMG, Madelaire CB, Wagener C, Titon Jr B, Measey J, Gomes FR (2021) Challenges
of a novel range: Water balance, stress, and immunity in an invasive toad. Comparative
Biochemistry and Physiology Part A: Molecular & Integrative Physiology 253: e110870.
https://doi.org/10.1016/j.cbpa.2020.110870
Bates D, Mächler M, Bolker B, Walker S (2015) Fitting linear mixed-effects models using
lme4. Journal of Statistical Software 67(1): 1–48. https://doi.org/10.18637/jss.v067.i01
Baxter-Gilbert J, Riley JL, Wagener C, Mohanty NP, Measey J (2020) Shrinking before our isles: the
rapid expression of insular dwarfism in two invasive populations of guttural toad (Sclerophrys
gutturalis). Biology Letters 16(11): e20200651. https://doi.org/10.1098/rsbl.2020.0651
Baxter‐Gilbert J, Florens FV, Baider C, Perianen YD, Citta DS, Appadoo C, Measey J (2021)
Toad‐kill: Prey diversity and preference of invasive guttural toads (Sclerophrys gutturalis) in
Mauritius. African Journal of Ecology 59(1): 168–177. https://doi.org/10.1111/aje.12814
Beck CW, Congdon JD (2000) Effects of age and size at metamorphosis on performance and
metabolic rates of Southern Toad, Bufo terrestris, metamorphs. Functional ecology 14(1):
32–38. https://doi.org/10.1046/j.1365-2435.2000.00386.x
Bertelsmeier C, Keller L (2018) Bridgehead effects and role of adaptive evolution in invasive
populations. Trends in Ecology & Evolution 33(7): 27–534. https://doi.org/10.1016/j.
tree.2018.04.014
Blackburn TM, Pyšek P, Bacher S, Carlton JT, Duncan RP, Jarošík V, Wilson JR, Richardson
DM (2011) A proposed unified framework for biological invasions. Trends in Ecology &
Evolution 26(7): 333–339. https://doi.org/10.1016/j.tree.2011.03.023You can also read