Heterogeneity in endothelial cells and widespread venous arterialization during early vascular development in mammals
←
→
Page content transcription
If your browser does not render page correctly, please read the page content below
www.nature.com/cr
                  Cell Research                                                                                                                                           www.cell-research.com

                  ARTICLE                   OPEN

                  Heterogeneity in endothelial cells and widespread venous
                  arterialization during early vascular development in mammals
                  Siyuan Hou 1,2,3,9, Zongcheng Li 2,9, Ji Dong 4,9, Yun Gao 4,9, Zhilin Chang5,9, Xiaochen Ding5,9, Shuaili Li5, Yunqiao Li5,
                  Yang Zeng2, Qian Xin5, Baihan Wang5, Yanli Ni2, Xiaowei Ning5, Yuqiong Hu4, Xiaoying Fan 4, Yu Hou 4, Xianlong Li2, Lu Wen4,6,
                                           ✉                     ✉                ✉
                  Bin Zhou 7, Bing Liu1,2,5 , Fuchou Tang 4,6,8 and Yu Lan 1

                  © The Author(s) 2022

                      Arteriogenesis rather than unspecialized capillary expansion is critical for restoring effective circulation to compromised tissues in
                      patients. Deciphering the origin and specification of arterial endothelial cells during embryonic development will shed light on the
                      understanding of adult arteriogenesis. However, during early embryonic angiogenesis, the process of endothelial diversification
                      and molecular events underlying arteriovenous fate settling remain largely unresolved in mammals. Here, we constructed the
                      single-cell transcriptomic landscape of vascular endothelial cells (VECs) during the time window for the occurrence of key
                      vasculogenic and angiogenic events in both mouse and human embryos. We uncovered two distinct arterial VEC types, the major
                      artery VECs and arterial plexus VECs, and unexpectedly divergent arteriovenous characteristics among VECs that are located in
1234567890();,:

                      morphologically undistinguishable vascular plexus intra-embryonically. Using computational prediction and further lineage tracing
                      of venous-featured VECs with a newly developed Nr2f2CrexER mouse model and a dual recombinase-mediated intersectional genetic
                      approach, we revealed early and widespread arterialization from the capillaries with considerable venous characteristics.
                      Altogether, our findings provide unprecedented and comprehensive details of endothelial heterogeneity and lineage relationships
                      at early angiogenesis stages, and establish a new model regarding the arteriogenesis behaviors of early intra-embryonic
                      vasculatures.

                      Cell Research (2022) 32:333–348; https://doi.org/10.1038/s41422-022-00615-z

                  INTRODUCTION                                                                                 past decade. Studies of cellular and molecular events underlying
                  During mammalian embryogenesis, the cardiovascular system is                                 the specification of arterial VECs during embryonic development
                  the first functional organ system to form. Vascular endothelial cells                         will help to understand adult arteriogenesis.
                  (VECs) undergo de novo differentiation from mesodermal                                          In developmental setting, arteries can form in multiple ways,6
                  precursors and assemble into a primordial vascular network                                   with cell fate conversion playing a role under certain circum-
                  through vasculogenesis. During the establishment of vasculature,                             stances. In mice, endocardial cells contribute to a substantial
                  VECs are needed to grow new vessels from pre-existing ones via                               proportion of postnatal coronary arteries through de novo lineage
                  sprouting angiogenesis, while the immature vascular plexus                                   conversion during trabecular compaction.7 New arteries can also
                  undergoes further remodeling to form recognizable arteries and                               be generated from venous VECs. During hindbrain vascularization
                  veins and build a hierarchically organized vascular network.1–4                              in zebrafish, artery forms by medial sprouting and migration of
                  Arteriogenesis refers to the formation of new arteries and                                   endothelial cells from a bilateral pair of primitive veins, that is, the
                  arterioles either de novo by means of capillary arterialization or                           primordial hindbrain channels.8,9 During mouse development, the
                  by growth from pre-existing arterial collaterals, which is crucial in                        coronary arteries of the heart are initially formed by venous VECs
                  embryonic vascular development as well as in adult tissues.5 The                             from the sinus venosus.10,11 In the postnatal mouse retina, vein-
                  growth of arteries but not capillaries has been demonstrated to be                           derived endothelial tip cells continuously migrate from veins to
                  the key to restoring effective circulation to compromised tissues.6                          arterial areas and contribute to emerging arteries.3,12 Notably,
                  Unfortunately, due to the insufficient understanding of arterial                              although the conversion of venous VECs into arteries is observed
                  specification and arterial conduit formation, the field of ther-                               during the later stages of organogenesis and in tissue regenera-
                  apeutic angiogenesis has not made significant progress in the                                 tion, it is not thought to occur during the expansion of the early

                  1
                   Key Laboratory for Regenerative Medicine of Ministry of Education, Institute of Hematology, School of Medicine, Jinan University, Guangzhou, Guangdong, China. 2State Key
                  Laboratory of Experimental Hematology, Haihe Laboratory of Cell Ecosystem, Institute of Hematology, Fifth Medical Center of Chinese PLA General Hospital, Beijing, China.
                  3
                   Integrated Chinese and Western Medicine Postdoctoral Research Station, Jinan University, Guangzhou, Guangdong, China. 4Beijing Advanced Innovation Center for Genomics
                  and Biomedical Pioneering Innovation Center, School of Life Sciences, Peking University, Beijing, China. 5State Key Laboratory of Proteomics, Academy of Military Medical
                  Sciences, Academy of Military Sciences, Beijing, China. 6Ministry of Education Key Laboratory of Cell Proliferation and Differentiation, Beijing, China. 7The State Key Laboratory of
                  Cell Biology, CAS Center for Excellence in Molecular Cell Science, Shanghai Institute of Biochemistry and Cell Biology, Chinese Academy of Sciences, University of Chinese
                  Academy of Sciences, Shanghai, China. 8Peking-Tsinghua Center for Life Sciences, Peking University, Beijing, China. 9These authors contributed equally: Siyuan Hou, Zongcheng
                  Li, Ji Dong, Yun Gao, Zhilin Chang, Xiaochen Ding. ✉email: bingliu17@126.com; tangfuchou@pku.edu.cn; rainyblue_1999@126.com

                  Received: 18 September 2021 Accepted: 23 December 2021
                  Published online: 25 January 2022
S. Hou et al.
334
      vasculature in mammals, when instead branching morphogenesis              The transcriptomically defined embryo proper VECs were
      is generally acknowledged to take place.3,4,6,10–12                    further divided into eight clusters (EP0–EP7), the characteristics
         Recently, single-cell RNA sequencing (scRNA-seq) has been           of which were inferred by their spatiotemporal distribution and
      applied to investigate the heterogeneity of endothelial cells in       the expression of key genes10,27–36 (Fig. 1b–e; Supplementary
      distinct tissues from adult mice.13–15 It is proposed that VECs        information, Fig. S2i–k and Tables S1, S3). EP0 mainly contained
      display different properties that correspond to distinct vascular      cells from E8.0 embryos, indicative of its features of primordial
      beds13,14 and present an arterial-capillary-venous zonation and        VECs (Fig. 1b–e). Although these earliest VECs may originate
      seamless continuum of transcriptional states.13,15 scRNA-seq has       independently, their molecular characteristics were similar. Using
      also been used to study gastrulation and organogenesis in mouse        the known arterial and venous genes, we scored the arteriovenous
      embryos.16,17 Nevertheless, a high-precision and genome-scale          features of all the VEC populations (Fig. 1f, g). Hematopoietic cells
      gene expression landscape of early embryonic VECs is still lacking.    were used as a negative control as they were expected to lack
      Knowledge of the cellular evolutions and molecular programs            both arterial and venous features36 (Fig. 1f). None of the
      underlying the stepwise arteriovenous fate settling will have          populations showed both apparent arterial and venous features
      important implications for developing new approaches for both          (Fig. 1f), in line with the notion that arterial and venous fates are
      regenerative and therapeutic purpose. Here, we used scRNA-seq,         mutually exclusive.37 EP1 and EP6 manifested different degrees of
      spanning the time window for the occurrence of key vasculogenic        venous characteristics, whereas four clusters (EP2, EP3, EP5, and
      and angiogenic events in both mouse and human embryos,18,19            EP7) displayed arterial characteristics to different degrees (Fig. 1f,
      together with genetic lineage tracing, to decipher the endothelial     g). Importantly, the clusters of embryo proper VECs could be
      heterogeneity and lineage relationships during early vascular          readily distinguished in the specifically reconstituted Uniform
      development.                                                           Manifold Approximation and Projection (UMAP) by only using the
                                                                             genes included in the Gene Ontogeny (GO) term ‘artery
                                                                             development’ (Fig. 1h). We also evaluated the arteriovenous
      RESULTS                                                                manifestations of yolk sac VECs, and found that arterial- or venous-
      Transcriptomic identification of distinct VEC populations in            featured cells were much fewer than in embryo proper VECs at all
      mid-gestational mouse embryos                                          the comparable developmental stages (Supplementary informa-
      We first analyzed mouse embryos from embryonic day (E) 8.0,             tion, Fig. S2l). The further yielded three clusters of yolk sac VECs
      when most vessel primordia still comprise a series of disconnected     were mainly related to their developmental stages rather than
      clusters of Pecam1-expressing cells,18,19 to E11.0, when the first      arteriovenous features (Fig. 1c, f, g; Supplementary information,
      hematopoietic stem cells emerge following endothelial-to-              Fig. S2m, n). Therefore, arteriovenous characteristics made a
      hematopoietic transition.20,21 Immunophenotypic endothelial cells      considerable contribution to the identities of distinct VEC
      (CD45−CD31+CD144+) were collected from different parts of              populations in the embryo proper but not yolk sac. We also
      embryos16,18,22 (Fig. 1a; Supplementary information, Fig. S1a, b       validated the higher expression of endothelial CD36 and Neurl336
      and Table S1). Well-based scRNA-seq23 was performed on a total         in the yolk sac of late stage (E9.5–E10.0) than in early stage (E8.5),
      of 2213 cells (Supplementary information, Fig. S1c); 93.4% of these    in accordance with the transcriptomic finding (Supplementary
      cells passed rigorous quality control checks with no batch effect      information, Fig. S2o, p).
      detected (Supplementary information, Fig. S1d, e). Transcriptomi-         To determine whether the VEC populations we had identified
      cally, VECs were readily distinguished from hematopoietic cells        could be readily recognized using other sequencing strategies, we
      that exhibited considerable expression of Itga2b and Gata1             performed droplet-based (10× Genomics) scRNA-seq. A total of
      although they possessed an endothelial immunophenotype22,24,25         10,465 immunophenotypic endothelial cells from 44 embryos at
      (Supplementary information, Fig. S2a, b). Hematopoietic cells,         E9.0–E10.0 passed rigorous quality control measures and no batch
      together with allantoic VECs that were characterized by the            effect was detected (Supplementary information, Fig. S3a–c and
      expression of Hoxa10 and Hoxa11 and sampled from E8.0–E8.5,26          Table S4). Unsupervised clustering yielded eight clusters (Supple-
      were excluded from the subsequent analyses as they were outside        mentary information, Fig. S3d and Table S4). Of these, five clusters,
      the scope of this work (Supplementary information, Fig. S2a, b and     which comprised the majority of the sampled cells (96.9%),
      Table S1).                                                             exhibited early or arteriovenous VEC characteristics (Supplemen-
         The anatomical distribution of VECs allowed us to assign            tary information, Fig. S3d, e). The other three clusters were less
      identities to the two major VEC populations as the embryo              relevant and were thus excluded from the subsequent analyses.
      proper VEC group and the yolk sac VEC group (Fig. 1b, c;               One of these clusters was a Gata4-expressing population, which
      Supplementary information, Fig. S2c–g and Tables S1, S2). Genes        likely involved cardiac (Hand2+) and liver (Oit3+) VECs,13,17,38
      that were highly expressed in the embryo proper VECs                   presumably due to accidental incorporation during the dissection
      compared with their expression in the yolk sac VECs were               of embryos, as the heart and visceral bud should be prospectively
      mainly related to neurogenesis and artery development                  excluded before sampling (Supplementary information,
      (Supplementary information, Fig. S2h and Table S2), consistent         Fig. S3d–g). The features of the five major clusters corresponded
      with the notion that VECs and neurons adopt various common             closely with the clusters identified by the well-based scRNA-seq,
      mechanisms to control the patterning of vascular and neuronal          among which Vwa1+ VEC population was transcriptomically
      networks during development.2 On the other hand, genes                 similar to EP7, with both expressing a set of arterial genes along
      overrepresented in the yolk sac VEC group were predominantly           with several specific genes, such as Vwa1 and Nid2 (Fig. 1e;
      associated with membrane activities, such as cell adhesion and         Supplementary information, Fig. S3e, h). Principal Component
      transport (Supplementary information, Fig. S2e–h and Table S2).        Analysis (PCA) recapitulated the result obtained via UMAP, with
      These findings indicated that embryonic VECs shared features            the top genes of the PC1 axis including several known arterial
      associated with the biological processes of their neighboring          markers, validating the arterial properties of the arterial VEC and
      cells, suggesting the existence of parenchymal gene signatures         Vwa1+ VEC clusters (Supplementary information, Fig. S3h, i). Taken
      during the early development of VECs. Thus, from a transcrip-          together, our findings showed that identification of the principal
      tomics point of view, the difference between intra- and extra-         VEC populations was reproducible using different sequencing
      embryonic locations was more pronounced than that between              strategies. However, given the relatively limited resolution and
      different developmental stages when discriminating between             lack of spatiotemporal information resulting from the droplet-
      embryonic VECs (Fig. 1b, c; Supplementary information,                 based scRNA-seq, we returned to the well-based scRNA-seq data
      Fig. S2e–h and Tables S1, S2).                                         for the subsequent analyses.

                                                                                                                   Cell Research (2022) 32:333 – 348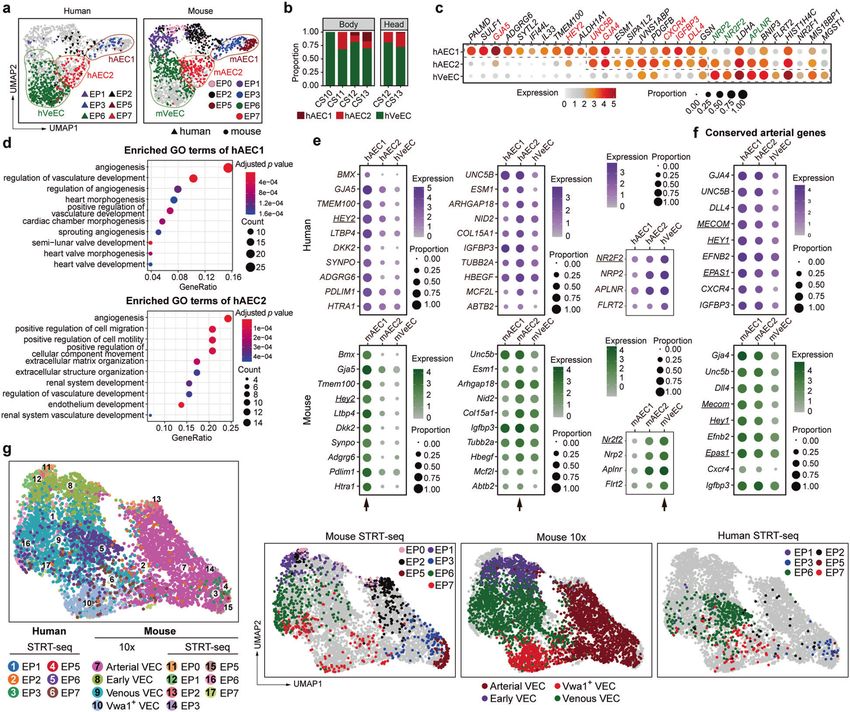
S. Hou et al.
                                                                                                                                                    335

Fig. 1 Transcriptomic identification of diverse VEC populations in the mid-gestational mouse embryos. a Schematic illustration of
strategies used for embryo dissection and cell preparation for the subsequent scRNA-seq. Heart, visceral bud, and umbilical and vitelline
vessels outside the embryo proper (purple) were excluded. b, c UMAP plots showing sampling locations of all sequenced cells (b) and stages
(c) and further yielded twelve clusters (c) of all VECs. The main areas of three subtypes of cells (b), eight clusters from embryo proper (c) and
three clusters from yolk sac (c) are indicated as closed dashed curves. d Bar graph showing the proportion of each VEC cluster at the
corresponding locations and stages. DA, dorsal aorta. e Dot plot showing the average expression levels and expression proportions of key
feature genes distinguishing eight embryo proper VEC clusters. The size of the dot represents the proportion of cells expressing the indicated
gene within a cluster, and the color indicates the average expression level of cells within a cluster. Genes in red font indicate the known
arterial genes, and those in green font indicate known venous genes. The clusters to which each feature gene belongs are shown at the
bottom. Note that embryo proper VEC clusters showed a biased distribution of known arteriovenous markers expect for EP0. f Scatterplot
showing the average arteriovenous scores of the cells in each cluster. Main distribution ranges of arteriovenous scores in each of the eight
embryo proper VEC clusters are also indicated as an oval shape. g UMAP plots showing arterial/venous scores of the individual cells in VEC
clusters. The main areas of embryo proper VECs and yolk sac VECs are indicated as closed dashed curves. h UMAP plot with cells colored by
embryo proper VEC clusters. The UMAP coordinates were determined by using 107 genes in the GO term of artery development
(GO: 0060840).

Spatiotemporal localization of distinct embryonic VEC                      first-order side branches at E9.5–E10.5 (Fig. 2b, c; Supplementary
populations                                                                information, Fig. S4d–f), with the relatively high Ltbp4+ signals at
To delineate the exact localization of each VEC cluster in the             later stage indicative of EP5 characteristics (Supplementary
embryo proper, we specifically generated two pan-arterial VEC               information, Fig. S5a). Thus, the development from EP2 to EP3
reporter mouse lines, Unc5btdTomato and Dll4tdTomato, using a              and EP5 represented the gradual cellular progression of major
CRISPR/Cas9-mediated gene knockin strategy, and both expres-               artery structures.
sion was further validated on the postnatal retina39–41 (Fig. 2a;             EP6 mainly came from E9.5–E10.0 and was characterized by the
Supplementary information, Fig. S4a). We then developed a set of           expression of the venous VEC marker Nrp2 in addition to Kitl, but
marker combinations to delineate the exact localization of                 not arterial VEC markers (Fig. 1d, e; Supplementary information,
principal VEC populations identified here (Supplementary infor-             Fig. S4b). EP6 was localized at known venous structures, such as
mation, Fig. S4b). EP1 and EP2, the two main clusters identified at         the anterior cardinal veins, and also abundantly present in the
E8.5 lacked Kitl expression. Anatomically, EP2 was located                 nearby capillary plexus (Fig. 2b, c; Supplementary information,
exclusively at major arteries, including the dorsal aortae and             Fig. S4d–f). It was thus identified as vein & venous plexus VECs.
internal carotid arteries at E8.5, and was thus recognized as early        Distributed at the same developmental stages as EP6, EP7
arterial VECs (Fig. 1d, e; Supplementary information, Fig. S4b, c). In     expressed several known arterial genes in addition to Kitl, such
comparison, EP1 showed a vascular plexus distribution and was              as Dll4, Unc5b, Hey1, Efnb2, and Gja4, but a low level of major artery
designated as early plexus VECs (Supplementary information,                genes, such as Gja5 and CD44, and venous VEC genes, such as Nrp2
Fig. S4b, c). EP3 and EP5 were localized at dorsal aortas and their        and Nr2f2 (Fig. 1d, e; Supplementary information, Fig. S4b).

Cell Research (2022) 32:333 – 348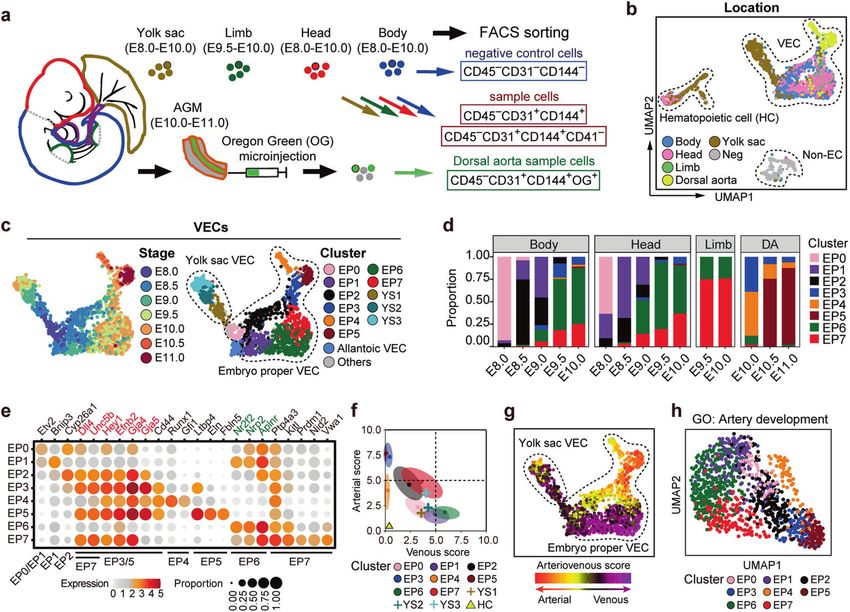
S. Hou et al.
336

      Fig. 2 Anatomical localization of distinct VEC populations in the embryo proper. a Schematic models of the gene-targeting strategies for
      generating Unc5b-tdTomato (left) and Dll4-tdTomato (right) reporter mouse lines via CRISPR/Cas9 system. Note that the tdTomato cDNA was
      introduced between the last exon and the 3' UTR of mouse Unc5b or Dll4 genes to ensure that tdTomato was expressed in exactly the same
      way as the labeled genes without abolishing their function. b Representative immunostaining on sagittal sections of E10.0 Unc5b-tdTomato;
      Kitl-GFP embryos at body part. Note that the localization of major artery VECs (Unc5b-tdTom+CD44+Nrp2−Kitl-GFP−Endomucin+, blue
      arrowheads) at known arteries such as the dorsal aorta, EP7 VECs (Unc5b-tdTom+CD44−Nrp2−Kitl-GFP+Endomucin+, yellow arrowheads) at
      intersegmental arteries and vascular plexus, and EP6 VECs (Unc5b-tdTom−CD44−Nrp2+Kitl-GFP+Endomucin+, yellow arrows) at vascular
      plexus adjacent to EP7. Unc5b+ arterial VECs and Nrp2+ venous VECs displayed a largely complementary expression pattern, and they
      comprised most VECs in mid-gestational embryos. Images in white boxes are shown at high magnification. The diagrams on the left indicate
      the positions of sections and imaging. DA, dorsal aorta. Scale bars, 100 μm. c Representative immunostaining on cross sections of E10.0 Dll4-
      tdTomato embryos at body part. Note the localization of major artery VECs (Dll4-tdTom+CD44+Nrp2−Endomucin+, blue arrowheads) at known
      arteries such as DA, EP6 VECs (Dll4-tdTom−CD44−Nrp2+Endomucin+, yellow arrows) at vascular plexus and known veins such as ACVs, and
      EP7 VECs (Dll4-tdTom+CD44−Nrp2−Endomucin+, yellow arrowheads) at vascular plexus adjacent to EP6. Images in red boxes are shown at
      high magnification. The diagram on the upper left indicates the position of sections. nt, neural tube; ACV, anterior cardinal vein; DA, dorsal
      aorta. Scale bars, 100 μm. d UMAP plots combining VECs from our original data and those from arterial reporter mouse models including Dll4-
      tdTomato and Unc5b-tdTomato embryos. Note that the indicated marker combinations at given developmental stages effectively distinguish
      the in silico-identified main VEC populations, which are outlined in dashed curves. e UMAP plots showing the expression levels of indicated
      arteriovenous marker genes. Dashed outlines of different VEC populations are also indicated. f Schematic diagram of the conventional model
      (left) and proposed model in the present study (right) illustrating the molecular characteristics of early intra-embryonic vasculatures. The
      dashed circles in red and green correspond to arterial and venous VECs, respectively.

      EP7 served as the anatomical extension of the EP3 arterial              the perineural vascular plexus, vascular sprouts within the neural
      structure, generally being located at the distal branches of major      tube, intersegmental vessels at the body trunk, and capillaries in
      arteries, and was adjacent to the EP6 plexus in the form of small       the limb buds (Fig. 2b, c; Supplementary information, Figs. S4d–f
      vessels widely distributed throughout the whole embryo, including       and S5b). Therefore, EP7 was identified as arterial plexus VECs.

                                                                                                                    Cell Research (2022) 32:333 – 348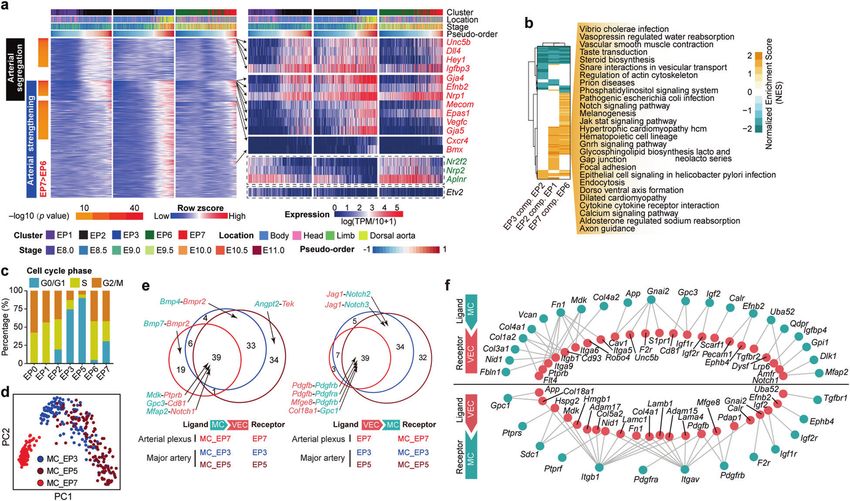
S. Hou et al.
                                                                                                                                                   337

Fig. 3 Molecular evolution and predicted VEC–mural cell interactions of different arterial vasculatures in the embryo proper. a Heatmaps
showing the dynamic relative expression levels of pattern genes in EP1, EP2 and EP3 with the corresponding relative expression levels in EP6
and EP7 (smoothed over 20 adjacent cells). Cells are ordered by pseudo-order axes inferred in Supplementary information, Fig. S6a. Genes are
ordered firstly by pattern categories and then by P values of comparison between EP6 and EP7. Expression levels of selected arterial genes
from the pattern genes (red font), known venous genes (green font), and the primordial VEC maker Etv2 are shown on the right. b Heatmap
showing the normalized enrichment scores (NES) of KEGG pathways by GSEA analysis between each two spatially or temporally adjacent
embryo proper VEC clusters. Only significantly changed pathways (FDR < 0.1) in at least one pair of comparison are shown. Row and column
dendrogram are generated by using hierarchical clustering of significance indicators (1, significantly up-regulated; 0, not significantly
changed; −1, significantly down-regulated between the indicated pairs) with Ward’s linkage algorithm and Euclidean distance measure.
Shared up-regulated pathways by two types of arterial VEC segregation (EP2 compared with EP1 and EP7 compared with EP6) are noted on
the right. c Bar charts showing the constitutions of cells with different cell cycle phases in the indicated embryo proper VEC clusters based on
molecular signatures in the scRNA-seq data. d PCA of mural cell populations. Mural cells with different derivations are shown in different
colors. Note that MC_EP7 was separated from the other two mural cell populations in the dimension reduction maps, indicating their distinct
molecular features. MC, mural cells. e Venn diagrams showing the numbers of shared and distinct heterologous ligand–receptor pairs
between different arterial VEC populations and their corresponding mural cell populations. Representative ligand–receptor pairs are
indicated. MC, mural cells. f Networks of shared heterologous ligand–receptor pairs among three arterial vasculatures. The panel above shows
gene network with MC as ligand and VEC as receptor, and the panel below shows gene network with VEC as ligand and MC as receptor.
MC, mural cells.

   Furthermore, we isolated different endothelial populations from        readily discriminated, whereas the morphologically well-defined
both Dll4tdTomato and Unc5btdTomato reporter mouse lines using the        major veins and venous plexus were largely indistinguishable on a
same marker combinations as those used for immunostaining, and            molecular basis. The asymmetric arteriovenous characteristics are
performed scRNA-seq (Supplementary information, Fig. S5c and              different to those seen in adults, where VECs display different
Table S5). Importantly, when projected onto the original UMAP,            properties that correspond to distinct vascular beds13,15 (Fig. 2f).
the newly sequenced VEC populations clustered together with the
cell populations that they were presumed to be (Fig. 2d, e). We           Molecular characteristics and mural cell properties of different
also validated previously unknown markers of two arterial-                arterial vasculatures in the embryo proper
featured clusters with the use of RNAscope. As a marker gene of           We next investigated changes in gene expression across spatially
early arterial VECs (EP2) (Fig. 1e; Supplementary information,            or temporally continuous VEC populations. The pseudo-order
Fig. S2k), endothelial Cyp26a1 expression was confined to the              within EP1 and EP2 inferred a continuum of arterial–venous
aortae at E8.5 and was absent at E10.0 (Supplementary informa-            identity on the initially established circulatory loop, whereas that
tion, Fig. S5d). Ptp4a3 was transcriptionally activated in arterial       within EP2 and EP3 represented the molecular changes occurring
plexus VECs (EP7) (Fig. 1e), which, anatomically, showed a                in major arteries during their development (Fig. 3a; Supplemen-
predominantly endothelial expression pattern. The location was            tary information, Fig. S6a and Table S3). We revealed three main
restricted to some small vessels, including intersegmental                expression patterns which respectively represented changes in
branches from the dorsal aorta, in accordance with that of EP7,           segregation into the first arterial fate and/or in the subsequent
identified by the known arterial markers Dll4 or Unc5b (Supple-            strengthening of arterial features (Fig. 3a; Supplementary informa-
mentary information, Fig. S5d).                                           tion, Table S3), and found that the expression of most arterial
   Taken together, two types of arterial VECs, namely the major           segregation-related genes was also elevated in EP7 compared
artery VECs (EP3 and EP5) and arterial plexus VECs (EP7) could be         with their expression in EP6, with many acknowledged arterial

Cell Research (2022) 32:333 – 348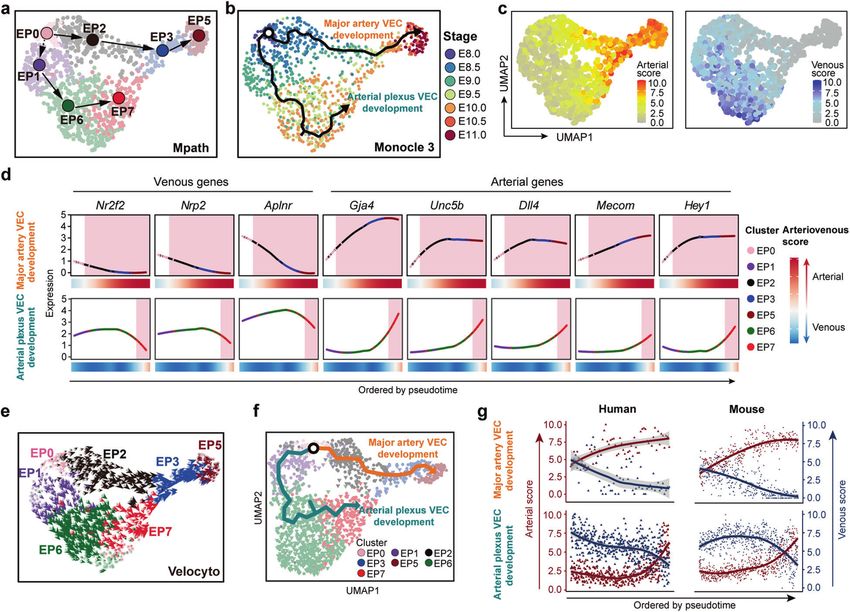
S. Hou et al.
338
      markers highly ranked (Fig. 3a; Supplementary information,                 Fig. S8f). Some human VECs were clearly assigned to the two types
      Table S3). The similarity between these two types of arterial fate         of arterial-featured VECs, namely major arterial VECs EP3 and EP5,
      segregation, namely the initial major artery fate settling (EP2 as         which were together renamed as AEC1 to simplify the annotation,
      compared with EP1) and arterial fate segregation in the vascular           and arterial plexus VECs EP7, which were renamed hereafter as
      plexus (EP7 as compared with EP6) was further supported by their           AEC2 (Fig. 4a–c; Supplementary information, Fig. S8f, g and
      considerable sharing of significantly enriched signaling pathways           Table S7). Both human AEC populations showed a higher
      (Fig. 3b; Supplementary information, Table S3), top differentially         proportion of cells in a quiescent status compared with the
      expressed genes and transcription factors, and enriched terms              venous-featured VEC population EP6 (renamed hereafter as VeEC),
      (Supplementary information, Fig. S6b–g). Cell cycle analysis of            with AEC1 being the most quiescent (Supplementary information,
      distinct VEC populations demonstrated an increase in quiescent             Fig. S8h). In addition, enriched terms of the highly expressed
      status accompanied by arterial feature segregation, strengthening,         genes in human AEC2 but not AEC1 showed characteristics that
      and maturation, including when EP7 was compared with EP6                   suggested a propensity toward cell migration and motility
      (Fig. 3c). This was in accordance with previous findings showing            (Fig. 4d).
      the enabling role played by cell cycle suppression in arterial                We next determined conserved arteriovenous feature genes in
      differentiation.10,42,43 The different proliferation status of distinct    these two species during vascular development. A total of 68 and
      VEC populations was also validated by flow cytometric evaluation            10 conserved genes were screened out for major arterial VECs
      of Ki67 expression and BrdU incorporation with subsequent                  (AEC1) and arterial plexus VECs (AEC2), respectively (Fig. 4e;
      immunostaining (Supplementary information, Fig. S6h–j).                    Supplementary information, Fig. S8i and Table S7). On the other
         Different arterial VEC populations showed distinct mural cell           hand, only four genes were screened out as conserved genes for
      coverage status around E10. PDGFRβ-expressing mural cells were             the embryonic venous-featured VEC population, including the
      distributed among all the arterial vasculatures that we identified          known venous markers NR2F2, NRP2, and APLNR (Fig. 4e). We also
      (major arteries and the arterial plexus), whereas α-SMA-expressing         made an effort to identify conserved arterial genes, which were
      mural cells were restricted to the major arteries (Supplementary           defined as those highly expressed in both AEC populations when
      information, Fig. S7a, b). We further isolated PDGFRβ-expressing           respectively compared with the corresponding venous VEC
      mural cells around the dorsal aorta at E9.5 and E10.5 and in limb          population. A total of 20 conserved arterial genes were identified,
      buds at E9.5,44 corresponding to three different arterial popula-          with the 9 most conserved ones being well-known arterial genes,
      tions including two major artery VEC populations EP3 and EP5 and           including three transcription factors, MECOM, HEY1, and EPAS1, as
      arterial plexus VECs EP7, respectively, and performed scRNA-seq            well as UNC5B and DLL4 (Fig. 4f; Supplementary information,
      (Fig. 3d; Supplementary information, Fig. S7a–c and Table S6). Of          Fig. S8j), the homologs of which in mouse were used as pan-
      note, most of the heterologous ligand–receptor pairs in the                arterial markers for the in situ validation in this study (Figs. 1e and
      arterial plexus were shared with those in the major arteries,              2b, c; Supplementary information, Figs. S4c–f and S5b).
      implying largely similar mechanisms underlying the arterial                   Finally, an integrated single-cell intra-embryonic VEC map
      stabilization mediated by mural cell–VEC interactions, irrespective        within the time window of our interest was constructed, which
      of the vascular beds (Fig. 3e, f; Supplementary information,               included the datasets of both mouse and human embryonic VECs
      Fig. S7d, e and Table S6). More potential interactions were found          developed here, using both well-based and droplet-based
      in major arteries than in the arterial plexus, with E10.5 having the       sequencing strategies. This will act as a resource to facilitate
      highest number, suggesting enhanced mural cell–VEC interactions            future studies of early vascular development in mammals (Fig. 4g;
      during artery maturation (Fig. 3e, f; Supplementary information,           Supplementary information, Fig. S8k and Table S7).
      Fig. S7e and Table S6).
                                                                                 Evolutionarily conserved developmental paths of two types of
      Transcriptomic identification of two types of arterial VEC                  arterial VECs predicted by trajectory analyses
      populations in human embryos                                               Mpath48 predicted two developmental paths of VECs from
      To determine whether our finding with respect to the two types of           primordial VECs (EP0). One was toward mature arterial VECs
      embryonic arterial VECs is conserved among mammals, scRNA-seq              (EP5), experiencing early arterial VECs (EP2) and the subsequent
      was performed with immunophenotypic endothelial cells derived              maturing arterial VECs (EP3), which represented the step-by-step
      from different intra-embryonic sites of totally five human embryos          cellular changes of major artery VECs. The other was toward early
      that were spatiotemporally comparable to mouse embryos used in             plexus VECs (EP1) and further vein & venous plexus VECs (EP6),
      this study45,46 (Supplementary information, Fig. S8a, b and                with the final fate as arterial plexus VECs (EP7), reflecting the
      Table S7). A total of 835 of 966 (86.4%) sampled cells passed a            cellular evolution of the vascular plexus (Fig. 5a). Trajectory
      strict quality control assessment, and the batch effect and cell           analysis by Monocle 3 at single-cell resolution17 largely recapitu-
      cycle effect were regressed out (Supplementary information,                lated the actual temporal order of the sampled cells and showed
      Fig. S8b, c and Table S7). Similar to the result of 10× Genomics           two major directions (Fig. 5b). In general, two waves of arterial fate
      scRNA-seq of mouse VECs (Supplementary information,                        were sequentially segregated out. One came directly from
      Fig. S3d–g), a GATA4+HAND2+ and a GATA4+OIT3+ cluster,                     primordial VECs, known as via vasculogenesis, and the other
      possibly corresponding to cardiac and liver endothelial cells,             involved the branching of arterial plexus VECs from the venous-
      respectively, were also identified38,47 (Supplementary information,         featured VEC population, through angiogenesis and remodeling
      Fig. S8d, e). These two minor clusters, together with a                    (Fig. 5b–d; Supplementary information, Table S1). We also
      hematopoietic cell cluster featured by the expression of erythroid         performed RNA velocity analysis to predict the future state of
      cell marker GYPA and the presumed hemogenic endothelial cells              each individual cell, based on an algorithm that was distinct from
      characterized by RUNX1 expression, were excluded; the two                  other trajectory analyses.49 The results were consistent with the
      remaining vascular VEC clusters of interest were retained for              findings from Mpath and Monocle 3, showing two waves of
      further analyses.46                                                        arterial differentiation, one of which was presumably derived from
         Human embryonic VECs were combined with mouse embryo                    vein & venous plexus VECs (EP6) (Fig. 5e). Taken together,
      proper VECs identified by the same sequencing strategy for the              trajectory analyses by distinct algorithms all indicated the
      integration and comparison analysis (Figs. 1b, c, 4a; Supplemen-           occurrence of venous plexus arterialization (Fig. 5c; Supplemen-
      tary information, Fig. S8d, e and Table S7). The assignment                tary information, Table S1).
      accuracy was further confirmed by correlation analysis in Mutual               We next explored whether our finding with respect to the
      Nearest Neighbors (MNN) Space (Supplementary information,                  development paths of two types of embryonic arterial VECs is

                                                                                                                        Cell Research (2022) 32:333 – 348
S. Hou et al.
339
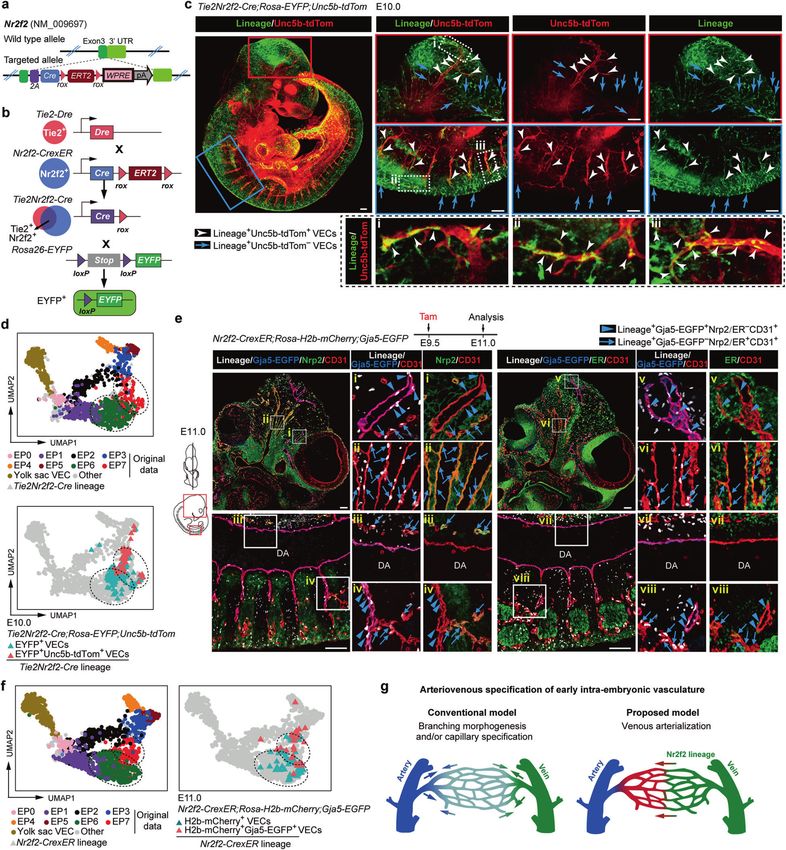
Fig. 4 Transcriptomic identification of different arterial VEC populations in human embryos. a UMAP plots showing integrated analysis of
VECs from mouse and human embryos by STRT-seq. The human EP3 and EP5 combination was renamed as human arterial VEC1 (hAEC1), EP7
as hAEC2, and EP6 as human venous VEC (hVeEC), corresponding to the mouse EP3 and EP5 combination (mAEC1), EP7 (mAEC2), and EP6
(mVeEC), respectively. b Bar graph showing the proportion of each human cluster at the corresponding locations and stages. CS, Carnegie
stage. c Dot plot showing the expression levels of top ten marker genes for each of the three indicated human VEC populations. Note that
hAEC1 and hAEC2 shared several classical arterial genes, whereas hAEC1 specifically overrepresented GJA5 and HEY2. Known arterial and
venous genes are indicated in red and green, respectively. d The top ten enriched GO biological process terms of hAEC1 (upper) and hAEC2
(lower). Dot color indicates the statistical significance of the enrichment and dot size represents the number of genes annotated to each term.
e, f Dot plots showing the average expression level and expression percentage of the top ten (all included if less than ten) conserved genes
for each of the three types of arteriovenous VECs as indicated by arrows (e) and those of the nine conserved arterial genes, when defined as
significantly overrepresented in all the four comparisons (two arterial clusters respectively compared to the corresponding venous cluster in
both human and mouse) (f). Size of the dot represents the percentage of cells expressing the indicated gene within a cluster, and color
indicates the average expression level of the gene within a cluster. Genes are listed in ascending order of Fisher’s combined P value from
independent P values of human and mouse datasets. Genes encoding transcription factors are underlined. g UMAP plots showing integrated
analysis of three embryonic VEC-related datasets from human and mouse embryos and sequenced by using STRT-seq and 10× Genomics
methods.
conserved among mammals. Trajectory analysis within the mouse regarding the two major types of arterial VEC populations
integrated dataset of human and mouse by Monocle 3 also and their developmental paths.
identified two predominant paths from primordial VECs (Fig. 5f).
The gradual changes in arteriovenous features along the Widespread capillary arterialization from venous-featured
respective paths of these two waves of arterial VEC development plexus during early expansion of intra-embryonic
were similar between human and mouse (Fig. 5g; Supplementary vasculatures
information, Fig. S8l). Specifically, mitotic nuclear division-related Finally, we explored whether arterial plexus VECs arise from
genes were enriched in the gene set with an expression pattern arterialization of venous plexus VECs, as deduced from the
that showed gradual down-regulation along major artery VEC bioinformatics analysis. We specifically chose the canonical
development in both human and mouse (Supplementary venous marker Nr2f2 and generated a Nr2f2CrexER mouse line
information, Fig. S8l). Taken together, it was basically conserved which allows inducible genetic lineage tracing (Fig. 6a). First, we
in mid-gestational vascular development between human and checked the expression of CrexER by ER immunostaining from
Cell Research (2022) 32:333 – 348S. Hou et al.
340
Fig. 5 Computational analysis predicted the basically conserved development paths of two types of arterial VECs between human and
mouse. a Developmental trajectory among embryo proper VEC clusters inferred by Mpath. The directional arrows are inferred by Mpath and
sampling stages. b Trajectory of cells in embryo proper VEC clusters inferred by monocle 3 showed two major directions mapped with
sampling stages, which largely recapitulated the actual temporal order of the sampled cells. c UMAP plots showing arterial (left) and venous
(right) scores of the individual cells in the embryo proper VEC group. d Loess regression-smoothened expression of the indicated venous and
arterial marker genes along two distinct arterial VEC development paths inferred by Monocle 3. Smoothened arteriovenous scores are also
shown at the bottom. Red shading, arterial-featured VEC populations. e Velocity vector field displayed on the UMAP plot at single-cell level,
with each arrow colored by cluster showing the movement direction and speed of each individual cell, indicating two waves of arterial
differentiation, one of which was presumably derived from vein & venous plexus VECs (EP6). f UMAP plot showing the trajectory inferred by
Monocle 3, which identified two predominant paths from primordial VECs. g Scatter plots showing arterial (red) and venous (blue) scores of
the cells along major artery VEC development (upper) and artery plexus VEC development (lower) paths, with loess-smoothed fit curves
indicated. VECs from human and mouse embryos are illustrated separately, and cells are ordered by pseudotime.
E8.0 to E9.5 and confirmed that its expression was in general Using either Rosa-EYFP or Rosa-H2b-mCherry as the reporter of
consistent with that of Nr2f2 at the transcriptional level (Fig. 1e; Cre recombinase, we performed genetic lineage tracing. We
Supplementary information, Fig. S9a–c). Nr2f2-CrexER was unde- confirmed there was no leakiness of Nr2f2-CrexER without
tectable in the vasculature at E8.0, in contrast to Nrp2 that tamoxifen induction (Supplementary information, Fig. S10a). At
exhibited scattered expression in the aortae and ubiquitous yet E10.0, Tie2Nr2f2-Cre lineage-labeled cells were widely distributed
inconsistent expression in other vascular primordia (Fig. 1e; throughout the vasculature, but were seldom detected in the
Supplementary information, Fig. S9a). At later stages, Nr2f2- aorta, similar to that traced by a single dose of tamoxifen
CrexER was expressed in the anatomically recognized veins and induction at E8.5 and observed at E11.0 (Supplementary informa-
also in the vascular plexus, showing a mutually exclusive tion, Fig. S10b, c). These results were in line with the previous
expression pattern with that of Dll4. This was similar to the notion and also the trajectory analysis here, indicating that the
performance of Nrp2 with regard to the vasculature (Supplemen- initial fates of major artery VECs and venous VECs have already
tary information, Fig. S4c–e). These findings provided support for been segregated by the time when VECs acquire Nr2f2 expression
the identity of Nr2f2-CrexER as a venous-featured marker to label and become venous at around E8.5 (Fig. 5b, e). Histologically, the
both early plexus VECs (EP1) and vein & venous plexus VECs (EP6) contribution of the Tie2Nr2f2-Cre lineage to the Unc5b+ arterial
but neither primordial VECs nor arterial-featured VEC populations plexus VECs was evident, including those located at the branches
(Fig. 1e; Supplementary information, Fig. S9b, c). We also of internal carotid arteries, the intersegmental arteries, and the
generated a Tie2-Dre;Nr2f2-CrexER mouse model, in which the limb bud arterial plexus (Fig. 6c; Supplementary information,
Cre-mediated ablation occurred specifically in the Nr2f2- Fig. S10d). By further scRNA-seq with the isolated Tie2Nr2f2-Cre
expressing VECs but not in other cell types50 (Fig. 6b), to lineage-labeled VECs, we clearly showed the arterial characteristics
constitutively trace the fate of venous-featured VECs and achieve of most lineage-traced Unc5b+ VECs with a loss of Nr2f2
better vasculature visualization. expression, providing molecular validation of the conversion from
Cell Research (2022) 32:333 – 348S. Hou et al.
341
Fig. 6 Genetic lineage tracing showing the capillary arterialization from venous-featured plexus during early expansion of intra-
embryonic vasculatures. a Schematic model of the gene-targeting strategy for generating Nr2f2-CrexER mouse line via CRISPR/Cas9 system.
b Schematic model showing the working principle for sequential Dre and Cre recombination. The final readout is Cre–loxp recombination.
c Whole-mount immunostaining of E10.0 Tie2Nr2f2-Cre;Rosa-EYFP;Unc5b-tdTomato embryo with antibodies of RFP (red) and GFP (green) to
detect Unc5b-tdTomato+ cells and Tie2Nr2f2-Cre lineage-traced cells, respectively. Note that in addition to the Unc5b-tdTom− VECs (blue
arrows), the labeling by Tie2Nr2f2-Cre lineage is also observed in the Unc5b-tdTom+ arterial VECs (white arrowheads), the distribution of which
includes the branches of internal carotid arteries and the intersegmental arteries. Images in red boxes, reconstructions with a total of 70 μm
thickness; images in blue boxes, reconstructions with a total of 100 μm thickness; images in dotted boxes show inserts at high magnification.
Scale bars, 100 μm. d UMAP plots combining the cells from our original data and E10.0 Tie2Nr2f2-Cre lineage-labeled VECs
(CD41−CD43−CD45−CD31+CD144+). Note that the lineage-labeled VECs are mainly clustered together with EP6 and EP7. Dashed outlines
of EP6 and EP7 are indicated. e Representative immunostaining on sagittal sections of E11.0 Nr2f2-CrexER;Rosa-H2b-mCherry;Gja5-EGFP embryos
after single dose of tamoxifen induction at E9.5. Note that in addition to the Gja5-EGFP−Nrp2/ER+CD31+ venous VECs (blue arrows), the
labeling by Nr2f2-CrexER lineage is also observed in the Gja5-EGFP+Nrp2/ER−CD31+ artery plexus VECs (blue arrowheads), the distribution of
which includes the branches of internal carotid arteries and the intersegmental arteries but not DA. The diagrams on the left indicate the
positions of the sections and imaging. DA, dorsal aorta. Scale bars, 100 μm. f UMAP plots combining the cells from our original data and E11.0
Nr2f2-CrexER lineage-labeled VECs (CD41−CD43−CD45−CD31+CD144+). Note that the lineage-labeled VECs are mainly clustered together with
EP6 and EP7. Dashed outlines of EP6 and EP7 are indicated. g Diagram showing the conventional model (left) and newly proposed model
(right) regarding the arteriovenous specification of early intra-embryonic vasculature.
Cell Research (2022) 32:333 – 348S. Hou et al.
342
venous- to arterial-featured VECs (Fig. 6d; Supplementary informa- angioblasts, sprouting from pre-existing arterial VECs, and
tion, Fig. S10e, f and Table S5). arterialized from unspecialized capillary VECs.3,21,51,52 Except for
Single dose tamoxifen induction in the Nr2f2-CrexER;Rosa- the initial generation of preliminary vasculature from mesodermal
reporter mouse model at E9.5 labeled mainly vein & venous progenitors in early embryos, such as the formation of dorsal
plexus VECs (EP6) but few, if any, early plexus VECs (EP1) (Fig. 1d, aorta, cardinal veins, and vitelline vessels,3,21,51 the aortic arch
e). Importantly, at E11.0, Gja5+ and Unc5b+ arterial plexus VECs arteries are reported to be derived from the second heart field
but not aortic VECs were evidently lineage-traced by E9.5 mesoderm via vasculogenesis at mid-gestation.53–55 Whether and
induction, although the tracing efficiency varied at least in part to what extent arterial capillaries are directly formed from
due to the different Rosa-reporter systems (Fig. 6e; Supplementary angioblasts in mammalian embryos is still unclear, which needs
information, Fig. S11a). Furthermore, the ER expression in the further investigations, e.g., with the help of newly developed
lineage-traced arterial plexus VECs was largely diminished, complicated lineage tracing systems.56,57 Notably, although the
validating the conversion from venous- to arterial-featured VECs intersegmental arteries are proposed to be formed by endothelial
histologically (Fig. 6e; Supplementary information, Fig. S11a). Flow sprouting from the aortas as evidenced by three-dimensional
cytometric analysis further confirmed that tamoxifen treatment at visualization of the CD31+ vasculature in mouse embryo,19 a more
E9.5 led to the labeling in both Dll4−CD44− VECs (presumed EP6, rigorous study using genetic lineage-tracing strategy with a Gja5-
vein & venous plexus VECs) and Dll4+CD44− VECs (presumed EP7, CreER mouse model by tamoxifen induction at E9.5 indicates that
arterial plexus VECs) in multiple embryonic sites, but seldom in Gja5 lineage-labeled VECs are abundantly observed in aortas but
Dll4+CD44+ VECs in the aorta-gonad-mesonephros (AGM) region seldom detected in the intersegmental arteries at later stages.58
(major artery VECs) (Supplementary information, Fig. S11b). We Together with our findings, these data highlight the notion that
also performed additional scRNA-seq of the Nr2f2-CrexER lineage- capillary arterialization from venous-featured VECs rather than
labeled VECs with Gja5-EGFP as an arterial indicator, and validated arterial sprouting from major artery VECs predominantly con-
the unambiguous arterial identity of partial Nr2f2-CrexER lineage- tributes to the formation of intersegmental arterial VECs. There-
traced cells when induced at E9.5 (Fig. 6f; Supplementary fore, our finding reshapes the conventional model regarding the
information, Fig. S11c, d and Table S5). arteriogenesis behaviors of early intra-embryonic vasculatures.
Regarding the distribution of the lineage-traced cells within the The rapid acquisition of arterial characteristics directly in venous-
vasculature and their contribution to the arterial-featured VECs, featured VECs in the vascular plexus of the embryo proper occurs
the lineage-tracing results of those induced at E9.5, those induced concurrently with the dramatic cellular expansion and precedes
at E8.5, or using the constitutive Tie2;Nr2f2-Cre system were the development of major organs in the embryo,17 which suggests
similar. This indicated that the conversion to an arterial fate an efficient way to cooperate with organogenesis. Although
predominantly occurred from the population with more apparent embryonic arterial plexus VECs are starting to show an arterial
venous characteristics (EP6) rather than directly from early plexus identity on a molecular level, their future fate may not be fixed at
VECs (EP1), in line with the prediction of the trajectory analysis this time point, which will depend on specific microenvironment
(Fig. 5a, b, e). Taken together, genetic lineage tracing clearly cues.10,12,41,43
revealed early and extensive capillary arterialization from venous- These findings together will shed new light on the under-
featured plexus during mouse embryonic development, involving standing of adult arteriogenesis, especially with regard to the
multiple anatomical sites. This reshapes the conventional model of poorly understood process of capillary arterialization, which will
arteriogenesis, which predominantly involves branching morpho- have obvious diagnostic and therapeutic impacts for many
genesis from pre-existing arteries and symmetric remodeling with important diseases and conditions.6 The present data also provide
arterial specification from unspecialized capillaries during the an invaluable transcriptomic resource for deeply investigating the
expansion of early vasculature4 (Fig. 6g). mechanisms underlying arteriovenous specification of VECs, which
will without doubt pave the way for studies in the vascular
regeneration field.
DISCUSSION
Our present data provide unprecedentedly comprehensive details
of the single-cell mapping of early embryonic VECs in both human MATERIALS AND METHODS
and mouse. Specifically, we revealed evolutionarily conserved Mice
evident arteriovenous features of early intra-embryonic vascula- Mice were handled at the Laboratory Animal Center of Academy of Military
tures. Importantly, most of the in silico-identified VEC populations Medical Sciences in accordance with institutional guidelines. Mouse manipula-
here were immunophenotypically and anatomically determined tions were approved by the Animal Care and Use Committee of the Institute.
and further transcriptomically validated. The arterial plexus VECs Gja5EGFP/+, KitlGFP/+, RosaLoxP-Stop-LoxP-EYFP, RosaLoxP-Stop-LoxP-H2b-mCherry and
Tie2Dre/+ mice were described previously.50,59–62 The Dll4tdTomato/+,
identified here presumably correspond to the pre-artery cells that Unc5btdTomato/+and Nr2f2CrexER/+ mouse lines were generated with the
are defined in the coronary capillary vessels, as both of them are CRISPR/Cas9 technique by Beijing Biocytogen and Shanghai Model
morphologically indistinguishable from their neighboring VECs in Organisms Center, respectively. All mice were maintained on C57BL/6
the vascular plexus but display apparent arterial characteristics. background. Embryos were staged by somite pair (sp) counting: E8.0,
We also found that they share several novel arterial markers, such 1–7 sp; E8.5, 8–12 sp; E9.0, 13–20 sp; E9.5, 21–30 sp; E10.0, 31–35 sp; E10.5,
as Slc45a4 (Supplementary information, Fig. S8j), Mecom (Fig. 4f), 36–40 sp; and E11.0, 41–45 sp. For well-based scRNA-seq, each embryo was
Igfbp3 (Fig. 4c, f), and Ptp4a34,10 (Fig. 1e; Supplementary isolated and further dissected into several parts including yolk sac, head,
information, Fig. S6e). body, and limb buds, excluding heart, visceral bud, and vitelline and
During mammalian development, the venous-to-arterial fate umbilical vessels outside embryo proper. For droplet-based scRNA-seq (10×
Genomics), embryo proper was collected as a whole excluding heart,
conversion is known to occur in later stages of organogenesis and visceral bud, and vitelline and umbilical vessels outside embryo proper. In
be confined to specific organs; e.g., the coronary arteries are some experiments, caudal half of E10.0 embryo was dissected under heart
initially formed from venous VECs of the sinus venosus.10,11 To the with limbs removed. The AGM region was dissected as reported.63 The
best of our knowledge, the arterialization of venous-featured VECs dorsal part of caudal half after the AGM region removed was collected as
that we revealed here represents the earliest and most extensive trunk. To specifically capture aortic luminal VECs, we performed micro-
fate conversion from venous- to arterial-featured VECs reported to injection of fluorescent dye Oregon Green into the dorsal aortas of
date in mammals. In addition to the fate conversion from venous- E10.0–E11.0 embryos as reported.63 The fluorescent dye Oregon Green 488
featured VECs revealed here, arterial capillaries might be formed in was purchased from Invitrogen. Staining was performed as previously
other potential ways, including de novo generation from described63 except that the concentration of staining solution was 5 μmol/L
Cell Research (2022) 32:333 – 348S. Hou et al.
343
and the time of staining was 3 min before washed. Primary embryonic phosphatase-labelled oligos were sequentially hybridized followed by the
single-cell suspension was acquired by type I collagenase digestion. For application of TSA Plus Fluorescein Kit (Histova, NEON 4-color IHC Kit for
lineage tracing, tamoxifen (sigma, T5648) was dissolved in corn oil and FFPE, 1:300, 40 °C for 20 min) to produce punctate dots. After the
administered to pregnant mice by oral gavage at the indicated time. hybridization, the tissues were blocked with 10% normal serum in TBS-
Pregnant mice received 0.1 mg tamoxifen per gram body weight. 1% BSA for 30 min at RT, followed by the incubation with ERG primary
antibody (Abcam) overnight at 4 °C. After 3 washes for 5 min each in TBST,
sections were incubated with corresponding HRP-conjugated secondary
Human embryonic sample collection and ethics statement antibody (Zhongshan golden bridge) for 30 min at RT. After 3 washes in
Human embryonic samples were acquired immediately after elective TBST, sections were stained with TSA Plus Fluorescein Kit (Histova, NEON
medical termination of pregnancy in Affiliated Hospital of Academy of 4-color IHC Kit for FFPE, 1:100, 1–2 min) and finally stained with DAPI.
Military Medical Sciences (the Fifth Medical Center of the PLA General
Images were captured under a confocal fluorescence microscope (ZEISS
Hospital). Informed consent in writing was signed before sample collection
LSM 880).
and all experiments were performed in accordance with protocols
approved by the Ethics Committee of the Affiliated Hospital of Academy
of Military Medical Sciences (ky-2017- 3-5). Carnegie stages (CS) were used BrdU cell proliferation assay
to determine the stages of embryos according to the sp number: CS10, Mice at E10.0 of gestation were weighed and injected with 0.1 μg/g BrdU.
8–12 sp; CS11, 13–20 sp; CS12, 21–29 sp; CS13, 30–34 sp. For flow Half an hour after injection, the mice were euthanized via cervical
cytometric analysis and sorting, head and limb were dissected in the same dislocation. Embryos were isolated immediately, fixed with 4% parafor-
way as mouse, the rest part of embryos were collected as samples named maldehyde for 2 h at 4 °C and embedded in paraffin. BrdU was detected by
body. Primary embryonic single-cell suspension was acquired by type I treating tissue sections with 2 N HCl for 20 min at 37 °C and incubating
collagenase digestion. BrdU primary antibody (Abcam, 1:100) overnight at 4 °C. After 3 washes for
2 min each in PBS, a corresponding HRP-conjugated secondary antibody
(Zhongshan golden bridge) was applied for 30 min at RT. After 3 washes
Flow cytometry for 2 min each in PBS, sections were stained with TSA Plus Fluorescein Kit
Cells were sorted and analyzed by flow cytometers FACS Aria 2 (BD (Histova, NEON 5-color IHC Kit for FFPE, 1:100, 20–60 s). After all antigens
Biosciences), and the data were analyzed using FlowJo software (Tree Star).
were labeled, images were captured on an Akoya Vectra Polaris
For well-based scRNA-seq, the sampling cells were purified by FACS as
(PerkinElmer). The numbers of BrdU+ endothelial cells in each EP cluster
CD45−CD31+CD144+, which contained predominantly VECs and a subset were measured using ImageJ software from merged images.
of hematopoietic cells with apparent CD41 expression. Meanwhile,
CD45−CD31−CD144− non-ECs in the body were used as negative controls.
For droplet-based scRNA-seq (10× Genomics), only immunophenotypic Retina whole-mount immunostaining
VEC population (CD45−CD31+CD144+) were collected. Cells from mouse Mouse retina whole mount immunostaining was prepared as described in
were stained by the following antibodies: CD31 (BD or BioLegend, previously published standard protocol64 with minor modifications. Briefly,
MEC13.3), CD41 (BD or eBioscience, MWReg30), CD43 (BD, S7), CD44 after anesthesia, the ocular globes were removed immediately and fixed in
(eBioscience or BioLegend, IM7), CD45 (eBioscience, 30-F11), CD144 the ice-cold 4% paraformaldehyde for 2 h. Eyes were washed with PBS for
(eBioscience, eBioBV13), Dll4 (BioLegend, HMD4-1), CD140b (BioLegend, at least 5 min, and then the retinas were dissected and cut into four radial
APB5) and Ki67 (BD). For cell cycle analysis, cells were fixed using Fixation incisions under a stereomicroscope (Leica MC170 HD). Dissected retinas
and Permeabilization Solution (BD) after surface marker staining, and then were incubated and permeabilized overnight at 4 °C with blocking buffer
Ki67 and Hoechst (Sigma) staining were performed. Cells from human (1% BSA, 0.5% Triton X-100). The retinas were washed and then incubated
embryos were stained by the following antibodies: CD31 (BD, WM59), with incubation buffer (2% goat serum, 1% bovine serum albumin (BSA),
CD34 (BD, 563) and CD45 (BD, 2D1). 7-amino-actinomycin D (7-AAD; and 0.5% Triton X-100 in PBS) for 1 h at RT, and stained with primary
eBioscience) was used to exclude dead cells. antibody in incubation buffer diluted 1:1 with PBS at 4 °C overnight.
Retinas were then washed with PBS and incubated for 2 h at RT with
suitable species-specific IgG (Zhongshan golden bridge) in incubation
Immunofluorescence buffer (0.5% bovine serum albumin (BSA), and 0.25% Triton X-100 in PBS).
Embryos were isolated, fixed with 4% paraformaldehyde for 30 min to 2 h After 3 washes in PBS, retinas were stained with TSA Plus Fluorescein Kit
at 4 °C, embedded in paraffin, and sectioned at 5–6 μm with Leica RM2235.
(Histova, NEON 4-color IHC Kit for FFPE, 1:100, 20–60 s). Images were
Sections were deparaffinized with ethanol of gradient concentration, then
captured under a confocal fluorescence microscope (Nikon Ti-E A1).
blocked in blocking solution (Zhongshan golden bridge) for 30 min at
room temperature (RT), followed by incubation with primary antibodies
overnight at 4 °C. After 3 washes for 3 min each in PBS, sections were Embryo whole-mount immunostaining
incubated with corresponding secondary antibodies (Zhongshan golden E10.0 embryos were fixed in 2% paraformaldehyde for 0.5 h on ice.
bridge) for 30 min at RT. After 3 washes in PBS, sections were stained with Immunostaining was performed as described below. Samples were
TSA Plus Fluorescein Kit (Histova, NEON 5-color IHC Kit for FFPE, 1:100, bleached in 5% H2O2 for 1 h on ice to block endogenous peroxidase. After
20–60 s). The antibodies were thoroughly eluted by heating the slides in that, samples were incubated for 1 h in blocking solution (0.2% bovine
citrate buffer (pH 6.0) for 20 min at 95 °C using microwave. After that, the serum albumin, 1% milk, 0.4% (v/v) Triton X-100 in PBS), then incubated
next primary antibody was detected following the steps above. Each overnight at 4 °C with the designated primary antibodies in blocking
antigen was labeled by distinct fluorophores. After all the antibodies were solution. After 3 washes for 1 h each in PBS-MT (1% milk, 0.4% (v/v) Triton
detected sequentially, the sections were finally stained with DAPI. Images X-100 in PBS), samples were incubated with suitable species-specific IgG
were collected by confocal microscope (Nikon Ti-E A1/ZEISS LSM 880). The (Zhongshan golden bridge) in PBS-MT overnight at 4 °C. After 3 washes for
primary antibodies were as follows: αSMA (Cell Signaling, 1:1000), CD36 20 min each in PBS-T (0.4% (v/v) Triton X-100 in PBS), samples were stained
(Abcam, 1:100), CD44 (BD Biosciences, 1:40), Estrogen Receptor α (Abcam, with TSA Plus Fluorescein Kit (Histova, NEON 4-color IHC Kit for Whole-
1:200), Endomucin (eBioscience, 1:100), GFP (Cell Signaling, 1:200), Ltbp4 mount/Cytometry, 1:500, 20 min). Finally, the samples were dehydrated in
(R&D, 1:400), Nrp2 (Cell Signaling, 1:150), Pdgfrβ (Cell Signaling, 1:100), 100% methanol, soaked in graded concentrations of BABB (phenylcarbinol
CD31 (Cell Signaling, 1:100 or Abcam, 1:1000), ERG (Abcam, 1:100), Runx1 and benzyl benzoate, 1:2)/methanol (50%, 100%; 1 min each). Images were
(Abcam, 1:200), BrdU (Abcam, 1:300), and RFP (Rockland, 1:1000). collected by a confocal microscope (Nikon Ti-E A1/ ZEISS LSM 880).
RNAscope mRNA in situ hybridization assay combined with scRNA-seq library construction
immunofluorescence STRT-seq. For well-based scRNA-seq (modified STRT-seq), single cells in
mRNA expression was determined using double-Z design RNA probes good condition were picked into lysis buffer by mouth pipetting. The
specifically designed to hybridize with Cyp26a1/Ptp4a3 molecules scRNA-seq preparation procedure was based on STRT with some
(Advanced Cell Diagnostics, Hayward, CA). RNAscope assay was performed modifications.23,65,66 cDNAs were synthesized using sample-specific 25-nt
carefully step by step according to the RNAscope® Multiple Fluorescent oligo dT primer containing 8-nt barcode (TCAGACGTGTGCTCTTCCGATCT-
Reagent Kit v2 Assay (323100-USM; Advanced Cell Diagnostics, Newark, XXXXXXXX-NNNNNNNN-T25, X representing sample-specific barcode
CA). Briefly, tissues were pre-treated with heat and protease prior to whereas N standing for unique molecular identifiers (UMIs)) (Supplemen-
hybridization of the target probe. Preamplifier, amplifier and an alkaline tary information, Table S8) and template switch oligo (TSO) primer for
Cell Research (2022) 32:333 – 348You can also read