Homogenized century-long surface incident solar radiation over Japan
←
→
Page content transcription
If your browser does not render page correctly, please read the page content below
Earth Syst. Sci. Data, 14, 463–477, 2022
https://doi.org/10.5194/essd-14-463-2022
© Author(s) 2022. This work is distributed under
the Creative Commons Attribution 4.0 License.

              Homogenized century-long surface incident solar
                          radiation over Japan
             Qian Ma, Kaicun Wang, Yanyi He, Liangyuan Su, Qizhong Wu, Han Liu, and Youren Zhang
        State Key Laboratory of Earth Surface Processes and Resource Ecology, College of Global Change and Earth
                            System Science, Beijing Normal University, Beijing 100875, China
                                  Correspondence: Kaicun Wang (kcwang@bnu.edu.cn)

                                    Received: 6 July 2021 – Discussion started: 23 August 2021
                      Revised: 17 December 2021 – Accepted: 19 December 2021 – Published: 4 February 2022

       Abstract. Surface incident solar radiation (Rs ) plays a key role in climate change on Earth. Rs can be directly
       measured, and it shows substantial variability on decadal scales, i.e. global dimming and brightening. Rs can
       also be derived from the observed sunshine duration (SunDu) with reliable accuracy. The SunDu-derived Rs has
       been used as a reference to detect and adjust inhomogeneity in the observed Rs . However, both the observed Rs
       and SunDu-derived Rs may have inhomogeneity. In Japan, SunDu has been measured since 1890, and Rs has
       been measured since 1961 at ∼ 100 stations. In this study, the observed Rs and SunDu-derived Rs were first
       checked for inhomogeneity independently using the statistical software RHtests. If confirmed by the metadata of
       these observations, the detected inhomogeneity was adjusted based on the RHtests quantile-matching method.
       Second, the two homogenized time series were compared to detect further possible inhomogeneity. If confirmed
       by the independent ground-based manual observations of cloud cover fraction, the detected inhomogeneity was
       adjusted based on the reference dataset. As a result, a sharp decrease of more than 20 W m−2 in the observed
       Rs from 1961 to 1975 caused by instrument displacement was detected and adjusted. Similarly, a decline of
       about 20 W m−2 in SunDu-derived Rs due to steady instrument replacement from 1985 to 1990 was detected
       and adjusted too. After homogenization, the two estimates of Rs agree well. The homogenized SunDu-derived
       Rs show an increased at a rate of 0.9 W m−2 per decade (p < 0.01) from 1961 to 2014, which was caused by
       a positive aerosol-related radiative effect (2.2 W m−2 per decade) and a negative cloud cover radiative effect
       (−1.4 W m−2 per decade). The brightening over Japan was the strongest in spring, likely due to a significant
       decline in aerosol transported from Asian dust storms. The observed raw Rs data and their homogenized time
       series used in this study are available at https://doi.org/10.11888/Meteoro.tpdc.271524 (Ma et al., 2021).

1   Introduction                                                     Ground-based observations of Rs are the first recommen-
                                                                  dation for detecting global dimming and brightening. How-
                                                                  ever, observational data may be inevitably ruined by artifi-
Surface incident solar radiation (Rs ) plays a vital role in      cial shifts, which my lead to the variability in Rs with large
atmospheric circulation, hydrologic cycling, and ecologi-         uncertainties. Wang et al. (2015) point out that instrument
cal equilibrium; therefore, its decrease and increase, termed     replacements and the reconstruction of the observational net-
global dimming and brightening (Wild et al., 2005; Shi et         work introduced substantial inhomogeneity into the time se-
al., 2008), have received widespread interest from the pub-       ries of observed Rs over China for 1990–1993. Manara et
lic and scientific community (Allen et al., 2013; Xia, 2010;      al. (2016) also show the instrument changes from the Rob-
Wang et al., 2013; Tanaka et al., 2016; Ohmura, 2009; He          itzsch pyranometer to the Kipp & Zonen CM11 pyranometer
et al., 2018). In addition, the impact factors such as clouds     before 1980 caused no clear dimming in Italy. Until recently,
and aerosols on the variation in Rs have been widely studied      Wild et al. (2021) use a well-maintained data series at a site
(Wild et al., 2021; Qian et al., 2006; Feng and Wang, 2021a).

Published by Copernicus Publications.
464                                      Q. Ma et al.: Homogenized century-long surface incident solar radiation over Japan

in Germany with long time duration to investigate the dim-         Jordan recorder is 10 % more sensitive than the Campbell–
ming and brightening in central Europe under clear-sky con-        Stokes recorder for SunDu measurements (Noguchi, 1981).
ditions and point out that the aerosol pollutants are likely ma-   The homogenization of SunDu has been carried out in the
jor drivers in the Rs variations. Augustine and Hodges (2021)      Iberian Peninsula (Sanchez-Lorenzo et al., 2007), Switzer-
use Surface Radiation Budget (SURFRAD) Network obser-              land (Sanchez-Lorenzo and Wild, 2012), and Italy (Manara
vations to explore the variability in Rs over the US from 1996     et al., 2015).
to 2019 and find that cloud fraction can explain 62 % of the          The measurement of Rs , which started in 1961 in Japan,
variation of Rs , while aerosol optical depth (AOD) only ac-       has a long history (Tanaka et al., 2016), and a data record of
counts for 3 %. Both studies also indicate the measurement         more than half a century has been accumulated. The dataset
instruments have been changed over the observational time          has been widely used to study decadal variability (Wild et
periods, which may introduce non-climatic shifts and inho-         al., 2005; Stanhill and Cohen, 2008) and to evaluate model
mogeneity in the raw data series.                                  simulations (Allen et al., 2013; Dwyer et al., 2010). The Ep-
   Homogenizing the observed Rs has been attempted in              pley and Robitzsch pyranometers used to measure Rs over
China (Wang et al., 2015; Tang et al., 2011; Yang et               Japan were replaced by the Moll–Gorczynski thermopile
al., 2018), Italy (Manara et al., 2016), Spain (Sanchez-           pyranometers in the early 1970s (Tanaka et al., 2016). How-
Lorenzo et al., 2013), and Europe (Sanchez-Lorenzo et              ever, the possible inhomogeneity of the observed Rs over
al., 2015). It is essential to find a homogeneous reference        Japan has not been well quantified, and most existing stud-
station to compare with the possible inhomogeneous sta-            ies directly used raw Rs data (Wild et al., 2005; Tanaka et
tion to test and adjust the inhomogeneity in the observed          al., 2016; Tsutsumi and Murakami, 2012; Allen et al., 2013;
time series, as done for the homogenization of air temper-         Wild and Schmucki, 2011; Kudo et al., 2012; Ohmura, 2009).
ature (Du et al., 2020; Zhou et al., 2021). However, this pro-     Some studies have had to abandon data from the early years
cess is difficult for Rs because the instrument replacement        and focused on only Rs data collected after 1975 (Tsutsumi
of Rs generally occurs nearly simultaneously throughout a          and Murakami, 2012; Dwyer et al., 2010). Therefore, the ob-
country. Therefore, the sunshine-duration-derived (SunDu-          served decadal variability in Rs over Japan is questionable,
derived) Rs (Yang et al., 2006) has been used as a homo-           especially for the 1961–1975 time period.
geneous reference dataset to detect and adjust the inhomo-            In Japan, SunDu observations started in 1890, and more
geneity in Rs in China (Wang et al., 2015).                        than a century of data have been recorded. They cannot
   SunDu records the hours of surface direct solar radiation       be too precious for the climate change detection on a cen-
exceeding 120 W m−2 and provides an alternative way to es-         tury scale. It is reported that the Jordan recorders used
timate Rs (Yang et al., 2006; Stanhill and Cohen, 2008).           to measure SunDu were replaced by EKO rotating-mirror
SunDu-derived Rs is capable of capturing the variability in        recorders in approximately 1986 (Inoue and Matsumoto,
Rs . He et al. (2018) use the SunDu-derived Rs at ∼ 2600           2003; Stanhill and Cohen, 2008). Therefore, SunDu obser-
stations to revisit the global dimming and brightening over        vations over Japan themselves may suffer inhomogeneity is-
different continents and restate the dimming over China and        sues.
Europe is consistent with the increasing trend of clouds and          Non-climatic shifts in the observations may severely in-
aerosols. Feng and Wang (2021a, b) merge the satellite re-         fluence the climate assessment; therefore rigorous homog-
trievals with SunDu-derived Rs to produce high-resolution          enization is required. The World Meteorological Organiza-
long-term solar radiation over China and indicate the cloud        tion (WMO) guidelines on climate metadata and homoge-
fraction could explain approximately 86 %–97 % of Rs varia-        nization list 14 data homogenization assessment techniques
tion. Zeng et al. (2020) demonstrate that SunDu plays a dom-       developed and applied by different groups/authors (Aguilar
inant role in determining Rs based on a random forest model        et al., 2003). Reeves et al. (2007) compared eight represen-
framework across China. Stanhill and Cohen (2005) indicate         tative homogenization methods and provided guidelines for
the high correlation between SunDu and Rs at the 26 stations       which procedures work best in different situations; for exam-
in the United States. Sanchez-Lorenzo et al. (2008) show the       ple the standard normal homogeneity (SNH) test (Alexander-
variation in SunDu is consistent with that in Rs over west-        sson, 1986) works best if good reference series are available,
ern Europe for 1938–2004 and the SunDu time evolution in           and two-phase regressions of the Wang procedure (Wang,
spring can partly be explained by clouds and that in win-          2003) are optimal for an unavailable condition of good ref-
ter can be related to the anthropogenic aerosol emissions.         erence series. Based on the comparison work, the RHtests
Stanhill and Cohen (2008) establish a simple linear relation-      method was improved by detecting multiple change points in
ship between Rs and SunDu to determine the long-term vari-         the climate data no matter if the reference series are avail-
ation in Rs over Japan. Manara et al. (2017) highlight that at-    able (Wang, 2008b; Wang et al., 2010, 2007; Wang, 2008a).
mospheric turbidity should be considered when using SunDu          This method, which first detects the change points in a series
for investigating multidecadal evolution of Rs .                   using penalized maximal tests and then tunes the inhomoge-
   Artificial shifts in SunDu observations may come from           neous data segments to be consistent with other segments in
the replacement of instruments. It has been revealed that the      empirical distributions, has been widely used in homogeniz-

Earth Syst. Sci. Data, 14, 463–477, 2022                                            https://doi.org/10.5194/essd-14-463-2022

Q. Ma et al.: Homogenized century-long surface incident solar radiation over Japan                                           465

ing climate variables (Dai et al., 2011; Wang et al., 2010; Du    data homogenization. RHtests (http://etccdi.pacificclimate.
et al., 2020; Zhou et al., 2021).                                 org/software.shtml, last access: 21 January 2022) is a widely
   Discontinuities inevitably occurred in the long-term ob-       used method to detect and adjust multiple change points in
servation system which are required to be checked out and         a climate data series, such as in surface temperature (Du et
adjusted in the raw data. The homogenized series pose a sig-      al., 2020), radiosonde temperature (Zhou et al., 2021), pre-
nificant role in the realistic and reliable assessment of cli-    cipitation (Wang et al., 2010), and surface incident solar ra-
mate trend and variability. The main objective of this study      diation (Yang et al., 2018). RHtests provides two algorithms,
is to detect and adjust the inhomogeneity in Rs estimates over    the penalized maximal t (PMT) test (Wang et al., 2007) and
Japan. The metadata were first extracted from website infor-      the penalized maximal F (PMF) test (Wang, 2008b), to de-
mation and related records at each site. The SunDu observa-       tect change points. The problem of lag-1 autocorrelation in
tions were converted into Rs . The RHtests method was ap-         detecting mean shifts in time series was also resolved (Wang,
plied to homogenize the observed Rs and SunDu-derived Rs ,        2008a). The PMT algorithm requires the base time series to
and finally, the century-long homogenized Rs data were pro-       have no trend, and hence a reference series is needed. It is
duced over Japan. Furthermore, the impacts of cloud cover         invalid when a reference series is not often available or its
and aerosols on Rs variation over Japan in recent decades         homogeneity is not sure; also the trend in the base and refer-
were explored.                                                    ence series are probably different. The PMF algorithm allows
                                                                  the time series to be in a constant trend and thus is applicable
2     Data and methods                                            without a reference series. Both algorithms have higher de-
                                                                  tection power, and the false-alarm rate can be reduced by an
2.1    Surface incident solar radiation and sunshine              empirically constructed penalty function.
       duration                                                      As the instrument changes for Rs and SunDu observation
                                                                  happened nearly nationwide and simultaneously, it is difficult
The monthly observed Rs at 105 stations and SunDu at              to find reference data series to match the base data series,
156 stations were downloaded from the Japan Meteorology           and hence the PMF algorithm was used to detect the change
Agency (JMA) website (see Table S1 in the Supplement              points in this study. Multiple change points were detected
and Fig. 1). Rs records were available from 1961. During          including climate signals and artificial shifts, and only the
the 1960s, two Rs measurements were conducted in paral-           ones confirmed by discontinuity information from metadata
lel by both Eppley and Robitzsch pyranometers. In the early       in Table S2 were left to be adjusted. Then two homogenized
1970s (see Fig. 2 and Table S2), these instruments were re-       series based on the direct measurement of Rs and SunDu-
placed by Moll–Gorczynski thermopile pyranometers. This           derived Rs were obtained.
replacement occurred at approximately 12.4 % of Rs stations          Large uncertainties may still exist in both homogenized
in 1971, followed by 22.9 %, 24.8 %, 3.8 %, and 30.5 % in         data series, as the discontinuities in the raw observations may
the next 4 years, which may have caused severe data discon-       not be sufficiently and correctly recorded in the metadata.
tinuity problems (Tanaka et al., 2016).                           Further change points can be detected by considering the im-
   SunDu has been routinely measured since 1890. Jordan           pact of the variation in independent climate variables such as
recorders were replaced by EKO rotating-mirror recorders at       clouds and aerosols on the Rs variation. If these uncertain-
49.4 % of SunDu stations in 1986. Until 1990, nearly all of       ties were found, further change point detections were needed
the SunDu stations used new instruments for observations;         based on the PMT or PMF algorithm.
4.5 % of SunDu stations before 1985 and 9.0 % of SunDu               To diminish all significant artificial shifts caused by the
stations after 2000 were moved away from the original sites       change points, newly developed quantile-matching (QM) ad-
(see Fig. 2 and Table S2) (Stanhill and Cohen, 2008).             justments in RHtests (Vincent et al., 2012; Wang et al., 2010)
   In this study, SunDu was used to derive Rs based on the        were performed to adjust the series so that the empirical dis-
following equation (Yang et al., 2006):                           tributions of all segments of the detrended base series agree
                                                                  with each other. The corrected values are all based on the
Rs /Rc = a0 + a1 · n/N + a2 · (n/N)2 ,                     (1)
                                                                  empirical frequency of the datum to be adjusted.
where n is sunshine duration hours; N is the maximum pos-            Another independent homogenization method proposed
sible sunshine duration; Rc is surface solar radiation under      by Katsuyama (1987), which was developed due to the
clear skies; and a0 , a1 , and a2 are coefficients. This method   replacement of the Jordan recorders with EKO rotating-
was recommended in many studies (Wang et al., 2015; Tang          mirror recorders during the late 1980s, is denoted as follows:
et al., 2011).
                                                                  SR = 0.8SJ SJ < 2.5 h d−1 ,                                  (2)
2.2    Homogenization method
Both Rs and SunDu measurements over Japan suffer
severe inhomogeneity problems, which require rigorous

https://doi.org/10.5194/essd-14-463-2022                                            Earth Syst. Sci. Data, 14, 463–477, 2022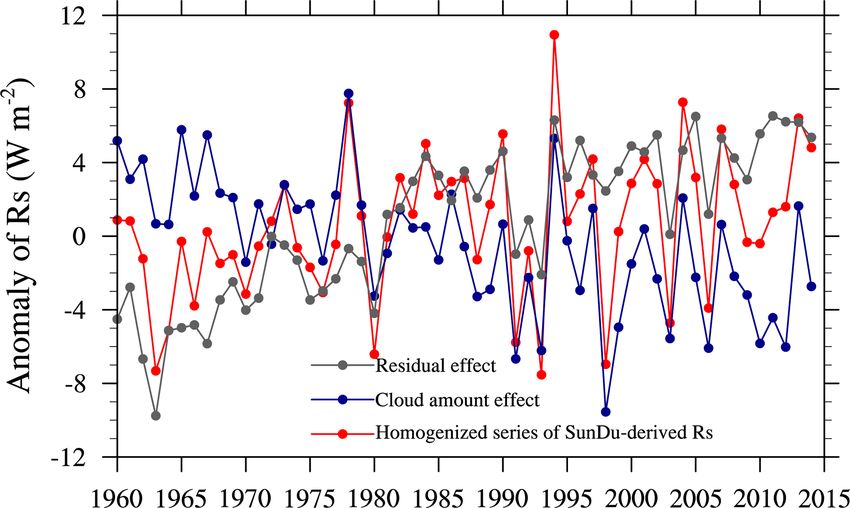
466                                       Q. Ma et al.: Homogenized century-long surface incident solar radiation over Japan

Figure 1. The spatial distribution of stations over Japan with observed sunshine duration (SunDu, 156 stations) and surface incident solar
radiation (Rs , 105 stations) data. The colours indicate the data length of the SunDu records from 1890 to 2015 and Rs records from 1961 to
2015. Unit: month.

Figure 2. The fraction of stations that suffer from data inhomo-
geneity due to site relocation, the change of instruments, and the      Figure 3. The anomalies of surface incident solar radiation (Rs ) de-
measurement method for sunshine duration (SunDu) records, cloud         rived from homogenized sunshine duration (SunDu) data (red line)
amount (CA) records, and surface incident solar radiation (Rs )         by the RHtests QM method and other independent data (blue line)
records. In total, there were 156 stations with SunDu records, 105      adjusted by the method in Katsuyama (1987). Both of the homoge-
of which had Rs records and 155 of which had CA records. The            nized datasets yield nearly the same Rs variation.
inhomogeneity information shown here was derived from meta-
data from https://www.data.jma.go.jp/obd/stats/data/en/smp/index.
html (last access: 21 January 2022) and was used as primary in-
                                                                        use it to cross-validate the accuracy of the RHtests method.
formation to perform the inhomogeneity adjustment in the RHtests
method detailed in Sect. 2.2.                                           Since most artificial shifts in the observation system were
                                                                        undocumented worldwide, the statistical methods including
                                                                        RHtests are optimal to identify these non-climatic signals and
                                                                        reduce the discontinuities in the data series. As RHtests can
                                                                      detect the change points in the raw data series when the meta-
SR = SJ − 0.5 SJ ≥ 2.5 h d−1 ,                                 (3)
                                                                        data are unavailable, while Katsuyama (1987) cannot, RHt-
                                                                        ests was selected in this study.
where SJ is the daily SunDu observed by the Jordan recorders
before replacement and SR is the daily SunDu adjusted to be
consistent with the values observed with the EKO rotating-              2.3   Clouds
mirror recorders.
   These two homogenization methods were compared in this               Clouds play an important role in Rs variation (Norris and
study and yielded nearly the same SunDu-derived Rs varia-               Wild, 2009). Monthly cloud cover observations at 155 sta-
tion, as shown in Fig. 3. Although the second method pro-               tions were also available on the JMA website. The observa-
posed by Katsuyama (1987) is simple and efficient, we just              tion time for cloud amount has been 08:00–19:00 LT since

Earth Syst. Sci. Data, 14, 463–477, 2022                                                   https://doi.org/10.5194/essd-14-463-2022
Q. Ma et al.: Homogenized century-long surface incident solar radiation over Japan                                             467

1981 at 9.0 % of cloud amount stations and 08:30–17:00 LT          were converted into annual values for calculation. If there
from 1990 to 1995 at another 15.4 % of cloud amount sta-           are missing values in any month in a specific year, the an-
tions (see Fig. 2 and Table S2). However, the difference be-       nual value for that year is set to a missing value. The linear
tween annual raw and homogenized cloud data is trivial, as         regression was used for trend calculation.
cloud data are relatively homogeneous in space compared
with Rs and SunDu observations. A site observation of cloud        3     Results
amount can represent the value over a large spatial scale,
likely leading to a few inhomogeneity issues for cloud data.       In this section, we first compared the observed Rs and
   To explore the impact of the cloud cover anomaly on the         sunshine-duration-derived Rs before and after adjustment to
Rs variation, the cloud cover radiative effect (CCRE), defined     demonstrate the necessity and feasibility of the homogeniza-
as the change in Rs produced by a change in cloud cover, was       tion procedure in Sect. 3.1. As artificial shifts may not be suf-
proposed by the following (Norris and Wild, 2009):                 ficiently and correctly documented by metadata, uncertain-
                                                                   ties may still exist in the homogenized series. We then tried
CCRE0 (lat, long, y, m) = CC0 (lat, long, y, m)                    to explore these uncertainties by considering the influence
× CRE(lat, long, m)/CC(lat, long, m),                       (4)    of other independent climate variables such as clouds and
                                                                   aerosols on the Rs variation and ultimately created a more
where lat is the latitude, long is the longitude, y is the year,   reasonable homogenized Rs series in Sect. 3.2. In Sect. 3.3,
m is the month, CCRE0 is the cloud cover radiative effect          we claimed the significant correction in trend analysis of Rs
anomaly, CC0 is the cloud cover anomaly, CC is the clima-          in Japan and quantified the influence of clouds and aerosols
tology of cloud cover in 12 months, and CRE is the cloud           on the Rs variation.
radiative effect calculated by the Rs difference under all-sky
and clear-sky conditions.                                          3.1    Homogenization of observed Rs and
   The residual radiative effect was determined by remov-                 sunshine-duration-derived Rs
ing the CCRE anomalies from the Rs anomalies. It is noted
that a part of the cloud albedo radiative effect proportional      The comparisons between raw data and homogenized data at
to the cloud amount was contained in the CCRE, as a large          each site were shown in Fig. 4, and their differences were
cloud amount tends to yield enhanced cloud albedo, whereas         illustrated in Fig. 5. Compared with raw data, the absolute
another part of the cloud albedo radiative effect due to the       values of biases between Rs and SunDu-derived Rs at 74 sta-
aerosol first indirect effect (more aerosols facilitating more     tions decrease after homogenization, of which the absolute
cloud condensation nuclei may enhance cloud albedo) may            values of biases decrease by more than 4 W m−2 at 42 sta-
be included in the residual radiative effect, which mainly         tions and more than 10 W m−2 at 8 stations. The root mean
contains the aerosol radiative effect.                             square errors at 80 stations were reduced after homogeniza-
   Clouds and the Earth’s Radiant Energy System (CERES)            tion, of which reductions are more than 4 W m−2 at 40 sta-
provides a reliable surface incident solar radiation (Ma et        tions. After adjustments, the correlation coefficients between
al., 2015) primarily based on the Moderate Resolution Imag-        the annual observed Rs and annual SunDu-derived Rs are
ing Spectroradiometer (MODIS) cloud and aerosol products           improved at 68 stations, including an improvement of more
(Kato et al., 2012). The cloud amount in CERES agrees well         than 0.2 at 31 stations. There are 41 stations (marked with red
with the observations, and the annual CRE in CERES is well         in Table S1, Fig. 6) at which the correlation coefficients were
correlated with the annual cloud amount in Fig. 10. The re-        greater than 0.5, and the biases and the root mean square er-
gional average cloud amount over Japan in Fig. 10 (blue line)      rors generally decrease after homogenization.
increases at a rate of 0.7 % per decade from 1960 to 2015,            Figure 7, as an example, shows the time series of surface
which is consistent with the previous results (Fig. 4 in Tsut-     incident solar radiation (Rs and SunDu-derived Rs ) at the
sumi and Murakami, 2012).                                          Hamada site (WMO ID: 47755; lat 34.9, long 132.07) be-
   In this study, long-term observations of cloud amount and       fore and after homogenization. Details in the improvements
monthly cloud radiative effect (CRE) data in the CERES             after homogenization at most stations can be traced back to
EBAF (Energy Balanced and Filled) edition were used fol-           Figs. 4, 5, and 6. The improved patterns of time series of
lowing Eq. (4) to distinguish the cloud cover radiative effect     surface incident solar radiation after homogenization high-
from Rs variation.                                                 light the necessity and feasibility of the RHtests method.
                                                                   The SunDu-derived Rs variation over Japan during recent
                                                                   decades inferred from these “perfect” data at 41 sites (Fig. 8)
2.4   Data processing
                                                                   was nearly identical to that from all available data at 156 sites
We first interpolated the monthly observational data at sites      (as shown in Table 1 and Fig. 9).
into 1◦ × 1◦ grid data and then calculated the area average of
the climate variables. As the brightening and dimming over
Japan were the main concern in this study, monthly values

https://doi.org/10.5194/essd-14-463-2022                                             Earth Syst. Sci. Data, 14, 463–477, 2022
468                                       Q. Ma et al.: Homogenized century-long surface incident solar radiation over Japan

Figure 4. The spatial distribution of bias, root mean square error, and the correlation coefficient between SunDu-derived surface incident
solar radiation (Rs ) and observed Rs before (a, c, e) and after (b, d, f) homogenization. Improvements were made at most sites after
homogenization.

3.2   Uncertainties in Rs observations                                 can be clearly found. The sharp decreases in Rs in 1991 and
                                                                       1993 are due to the combined effect of the volcanic eruption
Figure 9 displays the change in Rs during the last 5 decades,          of Mount Pinatubo in the Philippines in 1991 (Robock, 2000)
while Fig. 10 shows the variation in observed clouds over              and the simultaneous significant increases in clouds (Fig. 8 in
Japan. The sharp decrease in Rs in 1963 caused by the vol-             Tsutsumi and Murakami, 2012). The volcanic eruption of El
canic eruption of Mount Agung in Indonesia (Witham, 2005)              Chichón in Mexico in 1982 exerted little impact on the de-

Earth Syst. Sci. Data, 14, 463–477, 2022                                                  https://doi.org/10.5194/essd-14-463-2022
Q. Ma et al.: Homogenized century-long surface incident solar radiation over Japan 469
Table 1. Trends of surface incident solar radiation (Rs ) in Japan during specific time periods for different types of datasetsa . Unit:
W m−2 per decade.
Caseb Datasetsc 1961–1980 1981–1995 1996–2014 1961–2014
Selected 41 stations OBS-raw −12.0∗∗ −2.1 2.4 −0.3
OBS_HM −4.8∗ −2.1 2.4 1.5∗∗
OBS_2HM −0.8∗ −2.1 2.4∗ 0.9∗∗
SunDu-derived 1.4 −11.3∗∗ 1.4 −2.1∗∗
SunDu-derived_HM 1.4 −1.3∗ 1.5 0.9∗∗
All stations OBS-raw −11.2∗∗ −1.3 2.2 0.2
OBS_HM −8.4∗∗ −1.3 2.2 0.8
OBS_2HM 0.7 −1.3 2.2 1.6∗∗
SunDu-derived 2.3∗ −10.6∗∗ 1.2 −1.9∗∗
SunDu-derived_HM 1.6 −1.2 1.4 0.9∗
Radiative effect CCRE series −1.1 −1.4 −0.0 −1.4∗∗
Residual series 2.4∗∗ −0.1 1.2∗ 2.2∗∗
a The trend calculations were based on the linear regression method. Values with two asterisks (∗∗ ) imply p < 0.01, and those with one
asterisk (∗ ) imply 0.01 < p < 0.1.
b R trends were calculated by different numbers of observations, including all stations that are available on the JMA website and 41
s
stations (marked with red in Table S1, detailed in Sect. 3.1) that are significantly improved after homogenization. This implies that the
sample number has a subtle impact on the trend calculation over Japan. Radiative effects from clouds and aerosols were also explored.
c Trend calculations were based on the raw (observational) measurements of surface incident solar radiation (OBS-raw), their
homogenized series (OBS_HM), derived incident solar radiation from sunshine duration hours (SunDu-derived), and their
homogenized series (SunDu-derived_HM). OBS_HM from 1961 to 1970 was further homogenized by using SunDu-derived_HM as
reference data, termed OBS_2HM. It is found that homogenized SunDu-derived Rs values have the lowest uncertainties among these
five datasets in Sect. 3.1. The cloud cover radiative effect (CCRE) was denoted as the change in Rs produced by a change in cloud
cover, and the CCRE calculations were performed following Eq. (4) by observed cloud amounts and the cloud radiative effect (CRE)
from CERES satellite retrieval. Residual effect series were obtained by removing the CCRE from homogenized SunDu-derived Rs
anomalies.
cline in Rs and may have been compensated by the decrease beginning of operation in the Rs observation network in ap-
in clouds, as shown in Fig. 10. The pronounced Rs decline in proximately 1961, and the parallel use of two different types
1980 coincides with the significant increase in clouds, while of instruments during the 1960s may result in the large vari-
the lightening of Rs in 1978 and 1994 encounters abrupt de- ability in observed Rs (Tanaka et al., 2016). At this time, the
creases in cloud covers. clouds fluctuated gently, as shown in Fig. 10, and the change
As shown in Fig. 9, no major modifications were found in in volcanic aerosols from 1965 to 1966 was nearly the same
Rs observations before and after homogenization (compar- as that from 1962 to 1963 (Table 2 in Sato et al., 1993), so
ison between the light-blue and dark-blue lines). However, the sudden decline in the direct observations of Rs from 1965
the SunDu-derived Rs series are smoother after adjustment to 1966, which was twice as large as that from 1962 to 1963,
by the QM method, as the sharp decrease from 1983 to 1993 is suspicious. It is inferred that anthropogenic aerosols play
caused by the replacement of sunshine duration instruments a subtle role in the significant reduction in Rs , as this type of
(Jordan recorders were replaced with EKO rotating-mirror phenomenon is common for both polluted and pristine sta-
recorders) (Stanhill and Cohen, 2008) was repaired (compar- tions in Japan (Fig. 22 in Tanaka et al., 2016).
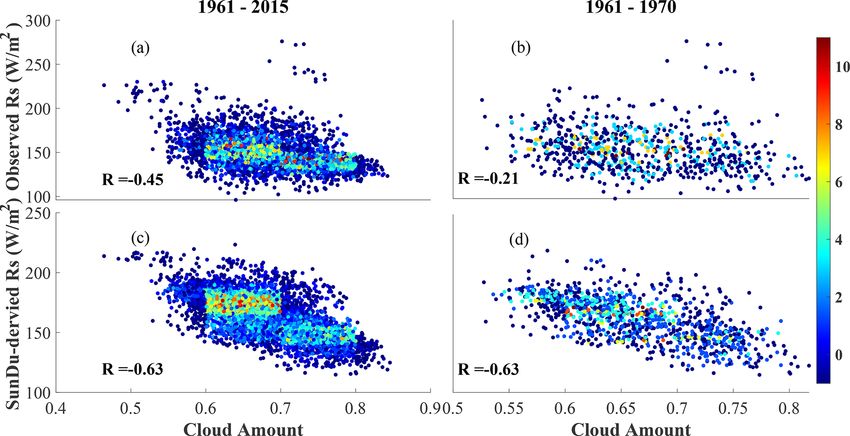
ison between the light-red line and dark-red lines). Despite Figure 11 shows the correlation coefficients between ho-
the identical increase in Rs via both the homogenized direct mogenized Rs (observed and SunDu-derived) and cloud
measurements of Rs and the homogenized SunDu-derived amount. In general, the observed Rs (−0.45) is less corre-
Rs during the 1995–2014 period, their variations in Rs from lated than the SunDu-derived Rs (−0.67), particularly from
1961 to 1994 are different (dark-red line and dark-blue line). 1961 to 1970, −0.21 compared with −0.64. This in turn sup-
Large discrepancies in Rs variation were found during the ports the reliability of homogenized SunDu-derived Rs , espe-
time period of 1961–1970, although homogenization was cially during the time period of 1961–1970. The false vari-
performed on the direct measurements of Rs and SunDu- ability of the observed Rs from 1961 to 1970 was modified by
derived Rs (dark-blue line and dark-red line in Fig. 9). An the RHtests method against the homogenized SunDu-derived
existing study noted the inaccurate instruments used at the Rs as shown in Fig. 12.
https://doi.org/10.5194/essd-14-463-2022 Earth Syst. Sci. Data, 14, 463–477, 2022
470                                         Q. Ma et al.: Homogenized century-long surface incident solar radiation over Japan

                                                                        Figure 6. Taylor diagram describing the relative biases, standard-
                                                                        ized deviations, and correlation coefficients between the annual
                                                                        observed surface incident short-wave radiation (Rs ) and annual
                                                                        sunshine-duration-derived (SunDu-derived) Rs before and after ho-
                                                                        mogenization at 41 selected stations (numbered 1–41 here). “REF”
                                                                        can be treated as the perfect point, where values the closer to this
                                                                        point indicate a better evaluation. The size and direction of the trian-
                                                                        gles denote the magnitude and negativity or positivity of biases, re-
                                                                        spectively. The boxes indicate the smaller bias in raw (black colour)
                                                                        or HM (red colour) series. This figure shows that biases decrease at
                                                                        most sites (in red boxes) after homogenization, except for the five
                                                                        stations numbered 4, 25, 32, 36, and 41 (in black boxes). Three sta-
                                                                        tions (numbered 1, 8, and 40 in black colour) listed below the panel
                                                                        are beyond the scope of the figure, with the bias (triangle), ratio of
                                                                        the standardized deviation (above the — line), and correlation coef-
                                                                        ficient (below the — line) shown. In addition to the improvements in
                                                                        the correlation coefficients after homogenization, the biases and the
Figure 5. Histograms of the difference of (a) absolute values of        standard deviations generally become small in this Taylor diagram.
bias, (b) root mean square error, and (c) correlation coefficient be-
tween SunDu-derived surface incident solar radiation (Rs ) and ob-
served Rs before and after homogenization. Their differences de-        liability of the adjusted SunDu-derived Rs (dark-red line in
crease after homogenization.                                            Fig. 9).
                                                                           From the above analysis, it can be inferred that fewer un-
                                                                        certainties exist in homogenized SunDu-derived Rs , which
                                                                        was confirmed by another work that utilized a different data-
   General decreases in stratospheric aerosol optical depth             adjusted method (Stanhill and Cohen, 2008).
(AOD) were reported in Sato et al. (1993) from 1965 to 1980,
and clouds fluctuated slightly, as shown in Fig. 10; both of            3.3   Trends of Rs over Japan
these factors contributed to a brightening of Rs . This is in
agreement with the SunDu-derived Rs and contrasts with the              The trends of Rs during specific time periods for different
direct measurements of Rs .                                             types of datasets are listed in Table 1. Direct measurements
   During the 1985–1990 period, clouds varied slightly, as              of Rs and SunDu-derived Rs from 41 selected stations and all
shown in Fig. 10, and the observed atmospheric transmission             available stations reveal similar variations in Rs over Japan,
under cloud-free conditions increased (Wild et al., 2005),              which demonstrates that the sample number has a subtle im-
which suggests that the large declines in directly observed             pact on the estimation of global brightening and dimming
Rs and SunDu-derived Rs are defective and reinforce the re-             over Japan.

Earth Syst. Sci. Data, 14, 463–477, 2022                                                    https://doi.org/10.5194/essd-14-463-2022
Q. Ma et al.: Homogenized century-long surface incident solar radiation over Japan                                                       471

Figure 7. Time series of annual anomalies of observed surface inci-
dent solar radiation (Rs ) and SunDu-derived Rs at the Hamada site
(WMO ID: 47755; lat 34.9, long 132.07) before and after homoge-          Figure 9. Time series of annual anomalies of the surface inci-
nization.                                                                dent solar radiation (Rs ) based on direct observations (light-blue
                                                                         line) and their homogenized series (dark-blue line) and sunshine-
                                                                         duration-derived (SunDu-derived) Rs (light-red line) and their ho-
                                                                         mogenized series (dark-red line). All of the lines were calculated
                                                                         based on as many observations as possible. The light-blue line and
                                                                         dark-blue line were calculated from the Rs observations at 105 sites,
                                                                         while the light-red line and dark-red line were derived from the
                                                                         SunDu-derived Rs at 156 sites. The Rs variations are nearly the
                                                                         same as those shown in Fig. 6, which were calculated based on the
                                                                         41 selected sites in Sect. 3.1. Large discrepancies were found in the
                                                                         homogenized data series (dark-blue and dark-red lines).

Figure 8. Time series of annual anomalies of surface incident solar
radiation (Rs ) based on direct Rs observations (light-blue line) and
their homogenized series (dark-blue line) and sunshine-duration-
derived (SunDu-derived) Rs (light-red line) and their homogenized
series (dark-red line). All of the lines were calculated based on ob-
servations at 41 sites. Details on how these 41 sites were selected
are given in Sect. 3.1. The Rs variations are nearly the same as those
shown in Fig. 7, which were calculated based on all available ob-
servations.
                                                                         Figure 10. The cloud amount (CA) from CERES (blue line) agrees
                                                                         well with that derived from surface observations (red line) over
                                                                         Japan. At the annual timescale, the negative cloud radiative effect
   A revisit of global dimming and brightening was listed                (-CRE, grey line) in CERES correlated well with the cloud amount.
in Table 1. Major differences were found in the time
period of 1961–1980, ranging from −11.2 (−12.0) to
−8.4 (−4.8) W m−2 per decade before and after Rs ho-                     Rs series, the decadal variation in Rs over Japan, which was
mogenization for all available stations (41 selected sta-                totally different from former studies (Wild et al., 2005; Nor-
tions) over Japan; significant repairs occurred during the               ris and Wild, 2009), was remedied. Direct measurements of
1981–1995 period, ranging from −10.6 (−11.3) to −1.2                     Rs display a trend of nearly zero from 1961 to 2014 over
(−1.3) W m−2 per decade before and after SunDu-derived                   Japan, while their homogenization series report a positive
Rs homogenization for all available stations (41 selected sta-           change of 0.8–1.6 W m−2 per decade; SunDu-derived Rs de-
tions) over Japan. Both corrections were mainly attributed               creases at a rate of 1.9 W m−2 per decade, while its homoge-
to the homogenization of corrupted raw data caused by the                nized series reveals a brightening of 0.9 W m−2 per decade.
replacement of instruments for Rs and SunDu measurements.                   The combined effects of clouds and aerosols on Rs
After careful checking and adjustment of the SunDu-derived               make the global dimming and brightening complicated.

https://doi.org/10.5194/essd-14-463-2022                                                    Earth Syst. Sci. Data, 14, 463–477, 2022
472                                        Q. Ma et al.: Homogenized century-long surface incident solar radiation over Japan

Figure 11. Scatter plot of homogenized monthly surface incident solar radiation (Rs ) (observed and SunDu-derived solar radiation) as a
function of ground-based observations of cloud amount over Japan at all stations only when both cloud amount data and observed Rs data
are available: (a, c) for 1961–2015 and (b, d) for 1961–1970. The smallest correlation coefficient in (b) indicates that the observed Rs data
are spurious for 1961–1970 and that SunDu-derived Rs are more convincing.

                                                                         Figure 13. Area-averaged anomalies of homogenized SunDu-
Figure 12. Time series of annual anomalies of the surface incident       derived Rs (red line) over Japan. The cloud cover radiative effect
solar radiation (Rs ) based on Rs observations after two rounds of       (CCRE, blue line) was denoted as the change in Rs produced by
homogenization (dark-blue line). The homogenized series of ob-           a change in cloud cover and calculated following Eq. (4) by ob-
served Rs from 1961 to 1970 shown in Fig. 7 was tuned by the             served cloud amounts and the cloud radiative effect (CRE) from the
RHtests method again using the homogenized series of SunDu-              CERES satellite retrieval. The residual effect (grey line) was ob-
derived Rs (dark-red line in Figs. 7 and 10) as a reference.             tained by removing the cloud cover radiative effect (CCRE) from
                                                                         the homogenized SunDu-derived Rs anomalies.

The CCRE can explain 70 % of global brightening from                     2.4 W m−2 per decade for this time period. The cloud radia-
1961 to 2014 at monthly and interannual timescales, while                tive effect (−1.4 W m−2 per decade) modulates Rs variation
the residual radiative effect dominates the decadal varia-               of −1.2 W m−2 per decade for the 1981–1995 period, while
tion in Rs , as shown in Fig. 13 and Table 1, which is in                the residual radiative effect (1.2 W m−2 per decade) domi-
agreement with Wang et al. (2012). Homogenized SunDu-                    nates Rs variation of 1.4 W m−2 per decade from 1996 to
derived Rs shows an increase of 1.6 W m−2 per decade                     2014.
from 1961 to 1980; however, a persistent increase in cloud                  Homogenized SunDu-derived Rs shows a slight increase
amount yields a CCRE decrease of 1.1 W m−2 per decade.                   of 0.9 W m−2 per decade from 1961 to 2014 with a 90 % con-
The residual radiative effect accounts for an increase of                fidence interval. However, the CCRE accounts for a deceased

Earth Syst. Sci. Data, 14, 463–477, 2022                                                    https://doi.org/10.5194/essd-14-463-2022
Q. Ma et al.: Homogenized century-long surface incident solar radiation over Japan 473
Rs of 1.4 W m−2 per decade, which implies that cloud cover
changes are not the primary driving forces for the Rs trend
over Japan. Meanwhile, the residual radiative effect exhibits
an increase of 2.2 W m−2 per decade, which surpasses the
negative CCRE.
Several studies demonstrate a generally cleaner sky over
Japan from the 1960s to the 2000s (except for the years im-
pacted by volcanic eruptions) based on atmospheric trans-
parency and aerosol optical properties (Wild et al., 2005;
Kudo et al., 2012), which supports the dominant role of
aerosols in Rs brightening over Japan, as revealed by the
residual radiative effect here. Furthermore, the residual ra-
diative effect in this study is stronger than that in Norris
and Wild (2009), as raw data were remedied and more ac-
curate satellite data from CERES were adopted to quantify
the radiative effect. Tsutsumi and Murakami (2012) demon-
strate that cloud amount categories exert an important effect
on Rs variation. Rs enhancement by the increased appear-
ance of large cloud amounts is superior to Rs decline by the
decreased appearance of small cloud amounts during 1961–
2014, which yields increased Rs with increasing total cloud
amount. They also pointed out that the decrease in cloud op-
tical thickness due to the large emissions of SO2 and black
carbon from East Asia through the aerosol semi-direct effect
(absorption of more energy by aerosols results in the evapo-
ration or suppression of clouds) may have facilitated the in-
creased Rs over Japan.
The decrease in spring dust storms in March–May dur-
ing the last 5 decades from China (Qian et al., 2002; Zhu et
al., 2008), which may travel to neighbouring countries (Uno
et al., 2008; Choi et al., 2001), could also have triggered the
increase in Rs over Japan. The Rs variation and radiative ef-
fect in different seasons are categorized in Fig. 14 and Ta-
ble 2, in which an increasing trend of 1.5 W m−2 per decade
in the homogenized SunDu-derived Rs prevails in spring for
the whole time period, dominated by a dramatic increase
of 2.8 W m−2 per decade in the residual effect and an even
larger increase for 1961–1980 (3.1 W m−2 per decade) and
1996–2014 (3.4 W m−2 per decade). Figure 14. Same as Fig. 12 but for the four seasons. The decrease in
Asian spring dust may have triggered the brightening over Japan for
1961–2015, as the Rs in spring increases most among the seasons.
4 Data availability
Monthly observed surface incident solar radiation, sun- 5 Conclusions
shine duration, and cloud amount data were provided by
Japan Meteorological Agency (2022; https://www.data.jma. The homogenization of raw observations related to Rs can
go.jp/obd/stats/data/en/smp/index.html, last access: 21 Jan- significantly improve the accuracy of global dimming and
uary 2022), and monthly cloud radiative effect (CRE) brightening estimation and provide a reliable assessment of
data were derived from Clouds and the Earth’s Radi- climate trends and variability. In this study, we for the first
ant Energy System for CERES EBAF data (https://ceres. time homogenized the raw Rs observations and obtained a
larc.nasa.gov/order_data.php, last access: 21 January 2022; more reliable Rs data series over Japan for a century.
CERES Science Team, 2022). The homogenized observed Documented artificial shifts in metadata play an important
Rs and SunDu-derived Rs used in this study are avail- role in regulating the raw observations. If change points were
able at https://doi.org/10.11888/Meteoro.tpdc.271524 (Ma et confirmed by metadata or other independent climate vari-
al., 2021). ables, the RHtests method was applied to remove the dis-
https://doi.org/10.5194/essd-14-463-2022 Earth Syst. Sci. Data, 14, 463–477, 2022474 Q. Ma et al.: Homogenized century-long surface incident solar radiation over Japan
Table 2. Trends of surface incident solar radiation (Rs ) in Japan during specific time periods for different types of datasets for all seasons.
Unit: W m−2 per decade.
Season Datasets 1961–1980 1981–1995 1996–2014 1961–2014
Spring SunDu-derived_HM 3.1 −1.5 3.4∗ 1.5
CCRE series −0.7 −1.6 −1.6 −0.9
Residual series 4.9∗∗ −0.5∗∗ 2.2∗∗ 2.8∗
Summer SunDu-derived_HM 1.4 −3.4 0.6 0.4
CCRE series −1.9 −2.1 −4.4∗∗ −2.7
Residual series 2.0∗∗ −1.8 1.5∗∗ 2.8
Autumn SunDu-derived_HM 0.6 1.5 3.3∗∗ 1.0∗
CCRE series −1.3∗∗ 1.6 1.6 −0.9
Residual series 1.8∗∗ 0.8∗∗ 2.1∗∗ 2.0∗
Winter SunDu-derived_HM 0.6 −1.5 −1.6 0.5
CCRE series −0.6 −3.3 −0.6 −0.7
Residual series 1.1∗∗ 0.9∗∗ −0.9∗∗ 1.2∗∗
∗ 0.01 < p < 0.1. ∗∗ p < 0.01.
continuities. In this study, shifts in the homogenized raw Rs 1961–2014, cloud amounts dominated seasonal and interan-
were further checked by exploring the relationship with the nual Rs variations, while aerosols (including aerosol–cloud
ground-based cloud amount and tuned again using homoge- interactions) drove decadal Rs variations over Japan, noted
nized SunDu-derived Rs as the reference data. By comparing by other studies, in response to general cleaner skies and a re-
the variations in independent climate variables of clouds and duction in spring Asian dust storms (Wang et al., 2012; Kudo
aerosols, the homogenized SunDu-derived Rs proved to be et al., 2012).
more reliable in detecting Rs variability over Japan.
A revisit of global dimming and brightening is made based
on the homogenized Rs series. Rs over Japan increases at Supplement. The supplement related to this article is available
a rate of 1.6 W m−2 per decade for 1961–1980, which is online at: https://doi.org/10.5194/essd-14-463-2022-supplement.
contrary to the trend (−4.8 to −12.0 W m−2 per decade)
in the unreasonable Rs observation. A slight decrease
of 1.2 W m−2 per decade for 1981–1995 in homogenized Author contributions. QM and KW designed the research and
SunDu-derived Rs accounts for only 1/10 of the trend in its wrote the paper. LS collected the raw data. YH homogenized the
raw data. QW provided the technical support. YZ and HL checked
unadjusted series. This directly contributes a brightening of
the data.
0.9 W m−2 per decade (with a 99 % confidence interval) for
the last 5 decades in homogenized series, which is totally
contrary to the variation in its original series. Global bright-
Competing interests. The contact author has declared that nei-
ening since 1961 over Japan is consistent with that in Stanhill ther they nor their co-authors have any competing interests.
and Cohen (2008), except that the magnitude is not as large.
We also explored how the clouds and aerosols mediate the
transformation of Rs . The brightening in Japan for 1961– Disclaimer. Publisher’s note: Copernicus Publications remains
1980 was the combined effect of cloud cover (negative effect) neutral with regard to jurisdictional claims in published maps and
and aerosols (positive effect). The dimming for 1981–1995 institutional affiliations.
was governed by reduced cloud amounts, while the increase
in Rs for 1996–2014 was controlled by decreased aerosols.
These results are different from those in Norris and Wild Acknowledgements. This study is funded by the National Key
(2009), as homogenization was performed on the raw data, R&D Program of China (grant no. 2017YFA0603601) and the Na-
and more accurate cloud radiative effect data series from tional Science Foundation of China (grant no. 41930970), and the
CERES were utilized in our study. During the entire period of project is supported by the State Key Laboratory of Earth Surface
Processes and Resource Ecology (grant no. 2017-KF-03). We thank
Earth Syst. Sci. Data, 14, 463–477, 2022 https://doi.org/10.5194/essd-14-463-2022Q. Ma et al.: Homogenized century-long surface incident solar radiation over Japan 475
many institutions for sharing their data, including the Japan Meteo- over China and Japan?, J. Geophys. Res., 115, D00K08,
rological Agency for observation data over Japan (https://www.data. https://doi.org/10.1029/2009JD012945, 2010.
jma.go.jp/obd/stats/data/en/smp/index.html, last access: 21 January Feng, F. and Wang, K.: Merging ground-based sunshine duration
2022) and Clouds and the Earth’s Radiant Energy System for observations with satellite cloud and aerosol retrievals to produce
CERES EBAF data (https://ceres.larc.nasa.gov/order_data.php, last high-resolution long-term surface solar radiation over China,
access: 21 January 2022). We thank the Expert Team on Climate Earth Syst. Sci. Data, 13, 907–922, https://doi.org/10.5194/essd-
Change Detection and Indices (ETCCDI) for providing the RHt- 13-907-2021, 2021a.
estsV4 homogenization package (http://etccdi.pacificclimate.org/ Feng, F. and Wang, K.: Merging High-Resolution Satellite Surface
software.shtml, last access: 21 January 2022). Radiation Data with Meteorological Sunshine Duration Obser-
vations over China from 1983 to 2017, Remote Sens., 13, 602,
https://doi.org/10.3390/rs13040602, 2021b.
Financial support. This research has been supported by the Na- He, Y., Wang, K., Zhou, C., and Wild, M.: A Revisit of
tional Key R&D Program of China (grant no. 2017YFA0603601) Global Dimming and Brightening Based on the Sun-
and the National Science Foundation of China (grant shine Duration, Geophys. Res. Lett., 45, 4281–4289,
no. 41930970), and the project is supported by the State Key https://doi.org/10.1029/2018GL077424, 2018.
Laboratory of Earth Surface Processes and Resource Ecology Inoue, T. and Matsumoto, J.: Seasonal and secular variations of sun-
(grant no. 2017-KF-03). shine duration and natural seasons in Japan, Int. J. Climatol., 23,
1219–1234, https://doi.org/10.1002/joc.933, 2003.
Japan Meteorological Agency (JMA): Tables of Monthly Climate
Review statement. This paper was edited by Bo Zheng and re- Statistics, JMA [data set], https://www.data.jma.go.jp/obd/stats/
viewed by two anonymous referees. data/en/smp/index.html, last access: 21 January 2022.
Kato, S., Loeb, N. G., Rose, F. G., Doelling, D. R., Rutan, D.
A., Caldwell, T. E., Yu, L., and Weller, R. A.: Surface Ir-
radiances Consistent with CERES-Derived Top-of-Atmosphere
Shortwave and Longwave Irradiances, J Climate, 26, 2719–2740,
References https://doi.org/10.1175/JCLI-D-12-00436.1, 2012.
Katsuyama, M.: On comparison between rotating mirror sunshine
Aguilar, E., Auer, I., Brunet, M., Peterson, T. C., and Wieringa, J.: recorders and Jordan sunshine recorders, Weather Service Bul-
Guidelines on climate metadata and homogenization, World Me- letin, 54, 169–183, 1987.
teorological Organization, Geneva, WMO-TD No. 1186, 55 pp., Kudo, R., Uchiyama, A., Ijima, O., Ohkawara, N., and Ohta, S.:
2003. Aerosol impact on the brightening in Japan, J. Geophys. Res.,
Alexandersson, H.: A homogeneity test applied 117, D07208, https://doi.org/10.1029/2011JD017158, 2012.
to precipitation data, J. Climatol., 6, 661–675, Ma, Q., Wang, K. C., and Wild, M.: Impact of geolocations of vali-
https://doi.org/10.1002/joc.3370060607, 1986. dation data on the evaluation of surface incident shortwave radi-
Allen, R. J., Norris, J. R., and Wild, M.: Evaluation of multi- ation from Earth System Models, J. Geophys. Res.-Atmos., 120,
decadal variability in CMIP5 surface solar radiation and inferred 6825–6844, https://doi.org/10.1002/2014JD022572, 2015.
underestimation of aerosol direct effects over Europe, China, Ma, Q., He, Y., Wang, K., and Su, L.: Homogenized solar radiation
Japan, and India, J. Geophys. Res.-Atmos., 118, 6311–6336, data set over Japan (1870-2015), National Tibetan Plateau Data
https://doi.org/10.1002/jgrd.50426, 2013. Center [dataset], 10.11888/Meteoro.tpdc.271524, 2021.
Augustine, J. A. and Hodges, G. B.: Variability of Surface Ra- Manara, V., Beltrano, M. C., Brunetti, M., Maugeri, M., Sanchez-
diation Budget Components Over the U.S. From 1996 to Lorenzo, A., Simolo, C., and Sorrenti, S.: Sunshine duration vari-
2019–Has Brightening Ceased?, J. Geophys. Res.-Atmos., 126, ability and trends in Italy from homogenized instrumental time
e2020JD033590, https://doi.org/10.1029/2020JD033590, 2021. series (1936–2013), J. Geophys. Res.-Atmos., 120, 3622–3641,
CERES Science Team: Dataset of CERES EBAF, NASA LaRC https://doi.org/10.1002/2014JD022560, 2015.
[data set], https://ceres.larc.nasa.gov/data/, last access: 21 Jan- Manara, V., Brunetti, M., Celozzi, A., Maugeri, M., Sanchez-
uary 2022. Lorenzo, A., and Wild, M.: Detection of dimming/brightening in
Choi, J. C., Lee, M., Chun, Y., Kim, J., and Oh, S.: Chem- Italy from homogenized all-sky and clear-sky surface solar radia-
ical composition and source signature of spring aerosol tion records and underlying causes (1959–2013), Atmos. Chem.
in Seoul, Korea, J. Geophys. Res., 106, 18067–18074, Phys., 16, 11145–11161, https://doi.org/10.5194/acp-16-11145-
https://doi.org/10.1029/2001JD900090, 2001. 2016, 2016.
Dai, A., Wang, J., Thorne, P. W., Parker, D. E., Haimberger, Manara, V., Brunetti, M., Maugeri, M., Sanchez-Lorenzo,
L., and Wang, X. L.: A New Approach to Homogenize A., and Wild, M.: Sunshine duration and global radi-
Daily Radiosonde Humidity Data, J. Climate, 24, 965–991, ation trends in Italy (1959–2013): To what extent do
https://doi.org/10.1175/2010JCLI3816.1, 2011. they agree?, J. Geophys. Res.-Atmos., 122, 4312–4331,
Du, J., Wang, K., Cui, B., and Jiang, S.: Correction of Inhomo- https://doi.org/10.1002/2016JD026374, 2017.
geneities in Observed Land Surface Temperatures over China, Noguchi, Y.: Solar radiation and sunshine duration in
J. Climate, 33, 8885–8902, https://doi.org/10.1175/JCLI-D-19- East Asia, Arch. Meteor. Geophy. B, 29, 111–128,
0521.1, 2020. https://doi.org/10.1007/BF02278195, 1981.
Dwyer, J. G., Norris, J. R., and Ruckstuhl, C.: Do climate
models reproduce observed solar dimming and brightening
https://doi.org/10.5194/essd-14-463-2022 Earth Syst. Sci. Data, 14, 463–477, 2022476 Q. Ma et al.: Homogenized century-long surface incident solar radiation over Japan Norris, J. R. and Wild, M.: Trends in aerosol radiative effects over Measurements, J. Meteorol. Soc. Jpn., Ser. II, 86, 57–67, China and Japan inferred from observed cloud cover, solar “dim- https://doi.org/10.2151/jmsj.86.57, 2008. ming”, and solar “brightening”, J. Geophys. Res., 114, D00D15, Tanaka, K., Ohmura, A., Folini, D., Wild, M., and Ohkawara, https://doi.org/10.1029/2008JD011378, 2009. N.: Is global dimming and brightening in Japan limited Ohmura, A.: Observed decadal variations in surface solar ra- to urban areas?, Atmos. Chem. Phys., 16, 13969–14001, diation and their causes, J. Geophys. Res., 114, D00D05, https://doi.org/10.5194/acp-16-13969-2016, 2016. https://doi.org/10.1029/2008JD011290, 2009. Tang, W.-J., Yang, K., Qin, J., Cheng, C. C. K., and He, J.: So- Qian, W., Quan, L., and Shi, S.: Variations of the Dust lar radiation trend across China in recent decades: a revisit Storm in China and its Climatic Control, J. Cli- with quality-controlled data, Atmos. Chem. Phys., 11, 393–406, mate, 15, 1216–1229, https://doi.org/10.1175/1520- https://doi.org/10.5194/acp-11-393-2011, 2011. 0442(2002)0152.0.CO;2, 2002. Tsutsumi, Y. and Murakami, S.: Increase in Global Solar Qian, Y., Kaiser, D. P., Leung, L. R., and Xu, M.: More Radiation with Total Cloud Amount from 33 Years Ob- frequent cloud-free sky and less surface solar radiation in servations in Japan, J. Meteorol. Soc. Jpn., 90, 575–581, China from 1955 to 2000, Geophys. Res. Lett., 33, L01812, https://doi.org/10.2151/jmsj.2012-409, 2012. https://doi.org/10.1029/2005gl024586, 2006. Uno, I., Yumimoto, K., Shimizu, A., Hara, Y., Sugimoto, Reeves, J., Chen, J., Wang, X. L., Lund, R., and Lu, Q. Q.: N., Wang, Z., Liu, Z., and Winker, D. M.: 3D structure A Review and Comparison of Changepoint Detection Tech- of Asian dust transport revealed by CALIPSO lidar and niques for Climate Data, J. Appl. Meteorol. Clim., 46, 900–915, a 4DVAR dust model, Geophys. Res. Lett., 35, L06803, https://doi.org/10.1175/jam2493.1, 2007. https://doi.org/10.1029/2007GL032329, 2008. Robock, A.: Volcanic eruptions and climate, Rev. Geophys., 38, Vincent, L. A., Wang, X. L., Milewska, E. J., Wan, H., 191–219, https://doi.org/10.1029/1998RG000054, 2000. Yang, F., and Swail, V.: A second generation of ho- Sanchez-Lorenzo, A. and Wild, M.: Decadal variations in es- mogenized Canadian monthly surface air temperature for timated surface solar radiation over Switzerland since the climate trend analysis, J. Geophys. Res., 117, D18110, late 19th century, Atmos. Chem. Phys., 12, 8635–8644, https://doi.org/10.1029/2012JD017859, 2012. https://doi.org/10.5194/acp-12-8635-2012, 2012. Wang, K., Dickinson, R. E., Ma, Q., Augustine, J. A., Sanchez-Lorenzo, A., Brunetti, M., Calbó, J., and Martin- and Wild, M.: Measurement Methods Affect the Observed Vide, J.: Recent spatial and temporal variability and trends Global Dimming and Brightening, J. Climate, 26, 4112–4120, of sunshine duration over the Iberian Peninsula from a https://doi.org/10.1175/JCLI-D-12-00482.1, 2013. homogenized data set, J. Geophys. Res., 112, D20115, Wang, K., Ma, Q., Li, Z., and Wang, J.: Decadal variability of sur- https://doi.org/10.1029/2007JD008677, 2007. face incident solar radiation over China: Observations, satellite Sanchez-Lorenzo, A., Calbó, J., and Martin-Vide, J.: Spa- retrievals, and reanalyses, J. Geophys. Res.-Atmos., 120, 6500– tial and Temporal Trends in Sunshine Duration over 6514, https://doi.org/10.1002/2015JD023420, 2015. Western Europe (1938–2004), J. Climate, 21, 6089–6098, Wang, K. C., Dickinson, R. E., Wild, M., and Liang, S.: At- https://doi.org/10.1175/2008jcli2442.1, 2008. mospheric impacts on climatic variability of surface inci- Sanchez-Lorenzo, A., Calbó, J., and Wild, M.: Global and dif- dent solar radiation, Atmos. Chem. Phys., 12, 9581–9592, fuse solar radiation in Spain: Building a homogeneous dataset https://doi.org/10.5194/acp-12-9581-2012, 2012. and assessing their trends, Global Planet. Change, 100, 343–352, Wang, X. L.: Comments on “Detection of Undocumented Change- https://doi.org/10.1016/j.gloplacha.2012.11.010, 2013. points: A Revision of the Two-Phase Regression Model”, Sanchez-Lorenzo, A., Wild, M., Brunetti, M., Guijarro, J. J. Climate, 16, 3383–3385, https://doi.org/10.1175/1520- A., Hakuba, M. Z., Calbó, J., Mystakidis, S., and Bar- 0442(2003)0162.0.Co;2, 2003. tok, B.: Reassessment and update of long-term trends Wang, X. L.: Accounting for Autocorrelation in Detecting Mean in downward surface shortwave radiation over Europe Shifts in Climate Data Series Using the Penalized Maxi- (1939–2012), J. Geophys. Res.-Atmos., 120, 9555–9569, mal t or F Test, J. Appl. Meteorol. Clim., 47, 2423–2444, https://doi.org/10.1002/2015JD023321, 2015. https://doi.org/10.1175/2008jamc1741.1, 2008a. Sato, M., Hansen, J. E., McCormick, M. P., and Pollack, J. B.: Wang, X. L.: Penalized maximal F test for detecting undocumented Stratospheric aerosol optical depths, 1850–1990, J. Geophys. mean shift without trend change, J. Atmos. Ocean Tech., 25, Res., 98, 22987–22994, https://doi.org/10.1029/93JD02553, 368–384, https://doi.org/10.1175/2007JTECHA982.1, 2008b. 1993. Wang, X. L., Wen, Q. H., and Wu, Y.: Penalized Maximal Shi, G. Y., Hayasaka, T., Ohmura, A., Chen, Z. H., Wang, t Test for Detecting Undocumented Mean Change in Cli- B., Zhao, J. Q., Che, H. Z., and Xu, L.: Data quality as- mate Data Series, J. Appl. Meteorol. Clim., 46, 916–931, sessment and the long-term trend of ground solar radia- https://doi.org/10.1175/jam2504.1, 2007. tion in China, J. Appl. Meteorol. Clim., 47, 1006–1016, Wang, X. L., Chen, H. F., Wu, Y. H., Feng, Y., and Pu, Q. A.: New https://doi.org/10.1175/2007jamc1493.1, 2008. Techniques for the Detection and Adjustment of Shifts in Daily Stanhill, G. and Cohen, S.: Solar Radiation Changes in the Precipitation Data Series, J. Appl. Meteorol. Clim., 49, 2416– United States during the Twentieth Century: Evidence from 2436, https://doi.org/10.1175/2010JAMC2376.1, 2010. Sunshine Duration Measurements, J. Climate, 18, 1503–1512, Wild, M. and Schmucki, E.: Assessment of global dimming and https://doi.org/10.1175/jcli3354.1, 2005. brightening in IPCC-AR4/CMIP3 models and ERA40, Clim. Stanhill, G. and Cohen, S.: Solar Radiation Changes in Japan Dynam., 37, 1671–1688, https://doi.org/10.1007/s00382-010- during the 20th Century: Evidence from Sunshine Duration 0939-3, 2011. Earth Syst. Sci. Data, 14, 463–477, 2022 https://doi.org/10.5194/essd-14-463-2022
You can also read


