Ice-nucleating particles from multiple aerosol sources in the urban environment of Beijing under mixed-phase cloud conditions
←
→
Page content transcription
If your browser does not render page correctly, please read the page content below

Research article
Atmos. Chem. Phys., 22, 7539–7556, 2022
https://doi.org/10.5194/acp-22-7539-2022
© Author(s) 2022. This work is distributed under
the Creative Commons Attribution 4.0 License.

       Ice-nucleating particles from multiple aerosol sources in
                the urban environment of Beijing under
                     mixed-phase cloud conditions
         Cuiqi Zhang1 , Zhijun Wu1,2 , Jingchuan Chen1 , Jie Chen1,a , Lizi Tang1 , Wenfei Zhu1 , Xiangyu Pei4 ,
                 Shiyi Chen1 , Ping Tian5 , Song Guo1 , Limin Zeng1 , Min Hu1 , and Zamin A. Kanji3
         1 State Key Joint Laboratory of Environmental Simulation and Pollution Control, College of Environmental
                              Sciences and Engineering, Peking University, Beijing, 100871, China
      2 Collaborative Innovation Center of Atmospheric Environment and Equipment Technology, Nanjing University

                                 of Information Science and Technology, Nanjing, 210044, China
                   3 Institute for Atmospheric and Climate Science, ETH Zürich, Zurich, 8092, Switzerland
             4 College of Environmental and Resource Sciences, Zhejiang University, Hangzhou, 310058, China
                                  5 Beijing Weather Modification Center, Beijing, 100089, China
               a now at: Institute for Atmospheric and Climate Science, ETH Zürich, Zurich, 8092, Switzerland

                                  Correspondence: Zhijun Wu (zhijunwu@pku.edu.cn)

                                Received: 14 January 2022 – Discussion started: 21 January 2022
                           Revised: 25 April 2022 – Accepted: 14 May 2022 – Published: 10 June 2022

      Abstract. Ice crystals occurring in mixed-phase clouds play a vital role in global precipitation and energy bal-
      ance because of the unstable equilibrium between coexistent liquid droplets and ice crystals, which affects cloud
      lifetime and radiative properties, as well as precipitation formation. Satellite observations proved that immer-
      sion freezing, i.e., ice formation on particles immersed within aqueous droplets, is the dominant ice nucleation
      (IN) pathway in mixed-phase clouds. However, the impact of anthropogenic emissions on atmospheric IN in the
      urban environment remains ambiguous. In this study, we present in situ observations of ambient ice-nucleating
      particle number concentration (NINP ) measured at mixed-phase cloud conditions (−30 ◦ C, relative humidity with
      respect to liquid water RHw = 104 %) and the physicochemical properties of ambient aerosol, including chem-
      ical composition and size distribution, at an urban site in Beijing during the traditional Chinese Spring Festival.
      The impact of multiple aerosol sources such as firework emissions, local traffic emissions, mineral dust, and
      urban secondary aerosols on NINP is investigated. The results show that NINP during the dust event reaches up to
      160 # L−1 (where “#” represents number of particles), with an activation fraction (AF) of 0.0036 % ± 0.0011 %.
      During the rest of the observation, NINP is on the order of 10−1 to 10 # L−1 , with an average AF between
      0.0001 % and 0.0002 %. No obvious dependence of NINP on the number concentration of particles larger than
      500 nm (N500 ) or black carbon (BC) mass concentration (mBC ) is found throughout the field observation. The
      results indicate a substantial NINP increase during the dust event, although the observation took place at an urban
      site with high background aerosol concentration. Meanwhile, the presence of atmospheric BC from firework
      and traffic emissions, along with urban aerosols formed via secondary transformation during heavily polluted
      periods, does not influence the observed INP concentration. Our study corroborates previous laboratory and field
      findings that anthropogenic BC emission has a negligible effect on NINP and that NINP is unaffected by heavy
      pollution in the urban environment under mixed-phase cloud conditions.

Published by Copernicus Publications on behalf of the European Geosciences Union.
7540                                                        C. Zhang et al.: Ice-nucleating particles in the urban environment

1   Introduction                                                   ity below −5 ◦ C and are fully activated below −10 to −20 ◦ C
                                                                   (e.g., Chou, 2011; Conen et al., 2015; Polen et al., 2016;
Ice crystals in clouds can form via homogeneous freezing           Kanji et al., 2017; Conen et al., 2022; Porter et al., 2022).
of aqueous droplets below −38 ◦ C or via heterogeneous ice         The reported atmospheric immersion INP number concentra-
nucleation (IN) with the aid of foreign interfaces offered by      tion (NINP ) values were measured between −5 and −38 ◦ C
atmospheric ice-nucleating particles (INPs) through immer-         and were normally on the order of 10−2 to 103 # L−1 (e.g.,
sion/contact freezing of existing droplets at higher temper-       Rogers et al., 1998; DeMott et al., 2010; Chen et al., 2018;
ature or direct deposition/condensation of water vapor be-         Porter et al., 2022).
low water saturation (Pruppacher and Klett, 1997; Vali et al.,        Among all types of airborne particles, mineral dusts are
2015; Kanji et al., 2017). Mixed-phase clouds occur where          commonly acknowledged as a major source of effective
super-cooled liquid water droplets coexist with ice crystals       atmospheric immersion INPs (e.g., DeMott et al., 2003;
and are normally sustained between −38 and 0 ◦ C in the at-        Archuleta et al., 2005; Kanji and Abbatt, 2006; Welti et al.,
mosphere, with ice melting rapidly at warmer temperature           2009; DeMott et al., 2010; Atkinson et al., 2013; Cziczo et
and droplets freezing homogeneously at colder temperature          al., 2013; DeMott et al., 2015; Chen et al., 2021). It was
(Boucher et al., 2013; Korolev et al., 2017). The Wegener–         also reported that crystalline ammonium sulfate could nu-
Bergeron–Findeisen process in mixed-phase clouds favors            cleate ice heterogeneously below water saturation (Abbatt
ice crystal growth at the cost of liquid droplet evaporation       et al., 2006). But the effectiveness of carbonaceous parti-
(Wegener, 1911; Bergeron, 1935; Findeisen, 1938), leading          cles and inorganic salts acting as INPs under mixed-phase
to ice water content and ice crystal size change, which further    cloud conditions remains elusive (Schill et al., 2016; Chen et
result in changes of mixed-phase cloud lifetime and radiative      al., 2018; Kanji et al., 2020; Schill et al., 2020; Wolf et al.,
properties, as well as global precipitation patterns (Cantrell     2020). Although certain types of black carbon (BC) and or-
and Heymsfield, 2005; Field and Heymsfield, 2015; Mül-             ganic particles exhibited INP activity at temperatures below
menstädt et al., 2015; Korolev et al., 2017; Heymsfield et         −38 ◦ C through deposition IN (Murray et al., 2010; Mahrt et
al., 2020). Satellite observations demonstrate that the pre-       al., 2018; Nichman et al., 2019; C. Zhang et al., 2020), field
dominant ice formation pathway in mixed-phase clouds is            observations (Chen et al., 2018; Adams et al., 2020) and lab-
immersion freezing (e.g., Ansmann et al., 2008; de Boer et         oratory experiments (Schill et al., 2016; Kanji et al., 2020;
al., 2011; Silber et al., 2021). In this mode, INPs immersed       Schill et al., 2020) suggest that carbonaceous particles might
within supercooled aqueous droplets provide an interface           not affect ice crystal formation via immersion mode. Besides,
that decreases the liquid–solid phase transition energy bar-       organic coatings are likely to impede carbonaceous particles
rier and aids droplet freezing (Pruppacher and Klett, 1997;        from acting as effective deposition INPs at temperatures be-
Vali et al., 2015; Kanji et al., 2017).                            low −38 ◦ C (Nichman et al., 2019; C. Zhang et al., 2020).
   Most of the particles in highly populated urban areas              Previous modeling work confirmed that anthropogenic
originate from local emissions, including ground transporta-       INP emission could alter the size of ice crystals in clouds
tion, cooking, coal, and biomass burning, leading to signifi-      and change cloud lifetime and global precipitation pattern
cant production of carbonaceous particles, including organic       (Zhao et al., 2019). Yet, there is limited published direct evi-
compounds and elemental carbon, as well as inorganic salts         dence on the contribution of anthropogenic particles to ice
(e.g., Sun et al., 2016). Apart from local emissions, regional     crystal formation in highly populated areas (Knopf et al.,
transportation, such as transportation of mineral dusts and        2010; Corbin et al., 2012; Chen et al., 2018; Che et al., 2019,
pollutants from adjacent areas, also contributes significantly     2021). Knopf et al. (2010) used filter samples collected from
to urban particle population under appropriate meteorologi-        a highly populated urban area in Mexico City and an op-
cal conditions, during which aging can significantly modify        tical IN microscopy technique to report that anthropogenic
particle physicochemical properties, such as chemical com-         particles dominated by organic components might catalyze
position, morphology, and mixing state (e.g., Lin et al., 2016;    ice formation well below water saturation at temperature be-
Sun et al., 2016; Hua et al., 2018; X. Zhang et al., 2020;         low −38 ◦ C. Such organic-rich anthropogenic particles also
Lei et al., 2021; Li et al., 2021). Previous studies have con-     demonstrated ice formation potential via immersion path-
firmed that several kinds of atmospheric particles, including      way above −38 ◦ C in their study. Corbin et al. (2012) sug-
mineral dusts, carbonaceous particles, and biological species,     gested that coupling atmospheric dust, elemental carbon, and
can act as immersion INPs (Hoose and Möhler, 2012; Murray          biomass burning particle concentration together could pro-
et al., 2012; Kanji et al., 2017, and references therein). When    vide the best estimation for atmospheric INP concentration
present at atmospherically relevant amounts in droplets, min-      in downtown Toronto at −34 ◦ C just below water saturation,
eral dusts mostly catalyze supercooled aqueous droplet freez-      but the share of each particle category remained unclear due
ing below −15 ◦ C (Hoose and Möhler, 2012, and references          to limited data. Chen et al. (2018) quantified offline immer-
therein; Murray et al., 2012; Kanji et al., 2017, and refer-       sion INP concentration between −6 and −25 ◦ C using filter
ences therein), while biological species, such as pollen, fun-     samples collected every 12 h during a heavily polluted 2016
gal spores, and viruses, generally exhibit immersion IN activ-     wintertime in Beijing. Even though a high level PM2.5 with

Atmos. Chem. Phys., 22, 7539–7556, 2022                                             https://doi.org/10.5194/acp-22-7539-2022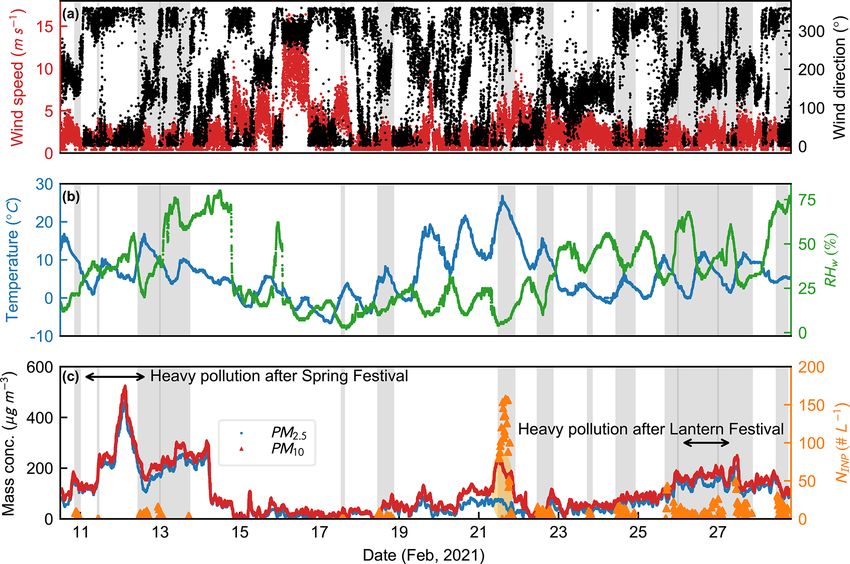
C. Zhang et al.: Ice-nucleating particles in the urban environment                                                           7541

complex chemical composition was sampled during the pol-
lution period in the urban area, these aerosols did not act
as superior INPs, and the highest INP concentration mea-
sured at −25 ◦ C was below 10 # L−1 , similar to what was ob-
served in remote regions such as the Swiss Alps (Boose et al.,
2016a; Lacher et al., 2017). The INP concentration reported
by Chen et al. (2018) was insensitive to particle number con-
centration and particle chemistry in an atmosphere that was
dominated by anthropogenic emissions. The absence of a
correlation between immersion INP concentration and par-
ticle number during a pollution period was further supported
by Bi et al. (2019) in an online immersion INP concentra-
tion field observation at a suburban site in Beijing during
May to June 2018, using a continuous-flow diffusion cham-
ber (CFDC) operated above water saturation between −20
to −30 ◦ C. The lack of online particle chemistry information
impedes aerosol source correlation in these studies (Chen et
al., 2018; Bi et al., 2019). Che et al. (2019) reported a pos-
itive correlation between the total atmospheric INP concen-         Figure 1. Schematic of the sampling and experimental setup (not
                                                                    drawn to scale).
tration and air pollution degree during springtime in Beijing.
INP concentration was measured by a Bigg’s mixing cloud
chamber for 1 month in 2017, and the total atmospheric INP
concentration could reach 1500 # L−1 at −30 ◦ C (Che et al.,        element oscillating microbalance (TEOM) monitor. The tem-
2019, 2021).                                                        poral resolutions of meteorology and PM data were 1 min.
   Currently, a knowledge gap still exists on the magnitude            Ambient air was sampled through a stainless-steel tube
and dominant source of ambient INPs in highly populated             with an inner diameter of 12.7 mm. The tube inlet was arched
urban areas, as well as the dependence of INP concentration         so that it was bent facing downwards (see Fig. 1) to prevent
on anthropogenic particle emission, hampering the estima-           water contamination, with d10 and d50 (the da at which 10 %
tion of global atmospheric INP concentrations (Boucher et           and 50 % particle could be transported to instruments through
al., 2013; Seinfeld and Pandis, 2016). In this paper, we re-        the inlet, respectively) being ∼ 20 and 13.4 µm, respectively
port the in situ INP concentration measured at mixed-phase          (Brockmann, 2011, Eqs. 6-23 to 6-29). The sample flow was
cloud conditions (−30 ◦ C, relative humidity with respect to        then split and pumped into different instruments. The rela-
liquid water of 104 %, i.e., RHw = 104 %) during the tradi-         tive humidity of the sample stream (RHw, sample ) was kept be-
tional Chinese Spring Festival at an urban site in Beijing.         low 2 % by passing samples through two consecutive 47 cm
Urban particle emission sources were distinguished based on         Nafion™ dryers (Perma Pure, LLC.) using 4 L min−1 nitro-
the online chemical characterization using an aerosol chem-         gen as sheath gas during the experiment. A schematic of the
ical speciation monitor (ACSM). The correlations between            setup is shown in Fig. 1.
immersion INP concentration, meteorology condition, and
aerosol physiochemical properties are also explored.
                                                                    2.2     Instrumentation

                                                                    2.2.1    Particle number size distribution
2     Methods
                                                                    Submicron particle number size distribution was measured
2.1    Sampling                                                     by a scanning mobility particle sizer (SMPS, model 3082,
                                                                    comprising a 3082 classifier, a 3081 long DMA,1 and a 3776
The sampling site (39◦ 590 2000 N, 116◦ 180 2600 E) is located on   CPC;2 TSI Inc.). The sampling flow rate of the SMPS was set
the roof of a six-floor building (∼ 30 m a.g.l.) at Peking Uni-     to 0.3 L min−1 with a sheath-to-sample ratio of 10 : 1, result-
versity, which is adjacent to the northwestern 4th Ring Road        ing in an electrical mobility size range from 14.6 to 710.5 nm.
of Beijing. The site lies about 250 m west of a busy street         An impactor was installed at the DMA inlet to remove parti-
with heavy traffic. At the sampling site, meteorological pa-        cles larger than 735 nm. Furthermore, multiple charging cor-
rameters, including wind speed, wind direction, RHw , and           rection was applied when processing the submicron particle
temperature, were measured by a weather station (MetOne             number size distribution.
Inc.). The mass concentrations of particulate matter (PM)
with aerodynamic diameter (da ) smaller than 2.5 and 10 µm             1 Differential mobility analyzer
(PM2.5 and PM10 , respectively) were measured by a tapered-            2 Condensation particle counter

https://doi.org/10.5194/acp-22-7539-2022                                               Atmos. Chem. Phys., 22, 7539–7556, 2022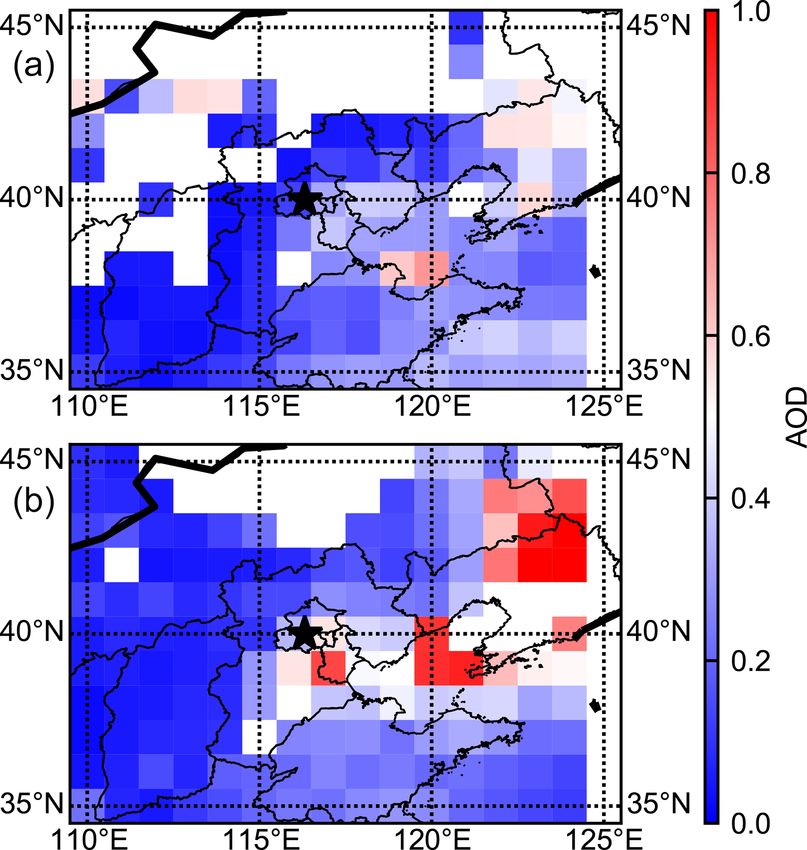
7542                                                           C. Zhang et al.: Ice-nucleating particles in the urban environment

   An aerodynamic particle sizer (APS, model 3021; TSI                41.0 %, respectively (Brockmann, 2011, Eqs. 6-51 to 6-53).
Inc.) was used to provide number size distribution for am-            Such sampling line loss is considered to be negligible, be-
bient aerosols with da ranging from 0.542 to 19.81 µm every           cause particles larger than 1 µm were scarce during the ob-
minute. The aerodynamic particle number size distribution             servation (Table 1).
obtained from the APS could be converted to particle mobil-               In this study, both warm and cold walls of the HINC
ity size (dm ) distribution by assuming the effective density         lined with glass-fiber filter paper were wetted with ∼ 150 mL
of ambient particles to be 1.5 g cm−3 , which is commonly             deionized water each day before the experiment start or after
used for urban atmosphere (Khlystov et al., 2004; Chen et             running the experiment for 4 h. After draining for ∼ 15 min,
al., 2018; Qiao et al., 2018; An et al., 2019). The sampling          the wall temperatures of warm and cold walls would be
flow rate of the APS was 1 L min−1 .                                  set to −21.2 and −38.8 ◦ C, respectively, to achieve desired
                                                                      lamina temperature (−30 ◦ C) and RHw (104 %). The sam-
2.2.2   Particle chemical composition
                                                                      pling flow rate of the HINC was 0.26 L min−1 , surrounded
                                                                      by a 2.57 L min−1 particle-free nitrogen sheath gas. Dur-
Real-time nonrefractory PM1 (da smaller than 1.0 µm) mass             ing the experiment, sampling air would pass through a par-
loading and chemical composition were measured by an                  ticle filter for 5 min after every 15 min of measurement to
ACSM (Aerodyne Inc.) equipped with a quadrupole analyzer              quantify HINC background count detected by the OPC. The
(Ng et al., 2011). The sampling flow rate of the ACSM was             HINC background counts follow a Poisson distribution, on
0.1 L min−1 . A PM2.5 cyclone was installed upstream of the           which the average background count is determined. Aver-
ACSM inlet to prevent inlet clogging by particles with da             age ice crystal concentration (equivalent to NINP ) of the
larger than 2.5 µm. The 50 % transmission efficiency range of         15 min measurement period is calculated by firstly subtract-
the ACSM is ∼ 60–660 nm (Liu et al., 2007). The time reso-            ing the average background particle counts from measure-
lution of an ACSM scan was set to 15 min. Meanwhile, BC               ment counts and secondly converting particle counts to num-
mass concentration was monitored by a multiangle absorp-              ber concentration using HINC sampling flow rate. The sub-
tion photometer (MAAP, model 5012; Thermo, Inc.) with a               traction might produce negative NINP when the signal of
temporal resolution of 1 min.                                         the OPC during the measurement is undistinguishable from
                                                                      background noise. Therefore, this study reports positive NINP
2.2.3   Ice-nucleating particle (INP) concentration
                                                                      as is, and replaces negative NINP with the minimum quan-
                                                                      tifiable concentration of the OPC (0.26 # L−1 ), following the
In situ immersion INP concentration was measured by a hor-            method in Lacher et al. (2017). Ambient particle number
izontal ice nucleation chamber (HINC) at fixed lamina con-            concentration entering the HINC was monitored by a CPC
ditions throughout the observation period, i.e., with a lamina        (model 3775, d50 = 4 nm; TSI Inc.) connected in parallel
temperature (T lam ) of −30 ± 0.2 ◦ C and RHw = 104 ± 2.2 %           with HINC at the aerosol inlet (see Fig. 1).
(equivalent to RHi = 140 ± 3.0 %, where the subscript i de-               Activation fraction (AF) and ice-active surface site den-
notes ice). HINC is a CFDC-type instrument made of two                sity (nS ) were selected as IN activity parameters in this study
flat parallel copper plates. The temperature of each plate is         (Vali et al., 2015; Kanji et al., 2017). AF is the ratio between
controlled independently to create supersaturation along the          ice crystal number concentration at HINC outlet (calculated
chamber centerline lamina. To minimize the impact of con-             from OPC counts, as stated above) and total particle number
vection, the top plate of the HINC is warmer than the bottom          concentration at HINC inlet (measured by CPC). Symbol nS
plate. Ice crystal size and number were measured by a six-            is defined as the number of ice-active surface sites per unit
channel optical particle counter (OPC; MetOne Inc.). The              surface area of INPs, and it allows IN activity intercompar-
injector position (and thus the flow structure of HINC in this        ison between different aerosol species and different studies
study) is identical to the settings by Lacher et al. (2017). Esti-    as a normalized parameter (Hoose and Möhler, 2012; Vali et
mated particle gravitational settling within the HINC is con-         al., 2015). In this study, total surface area S for polydisperse
sistent with the OPC measurement by Lacher et al. (2017),             ambient particles was firstly derived by assuming particles to
i.e., ∼ 23.5 % for 1 µm particle, 46.6 % for 1.5 µm particles,        be spherical and integrating the particle mobility size distri-
and 100 % for particles larger than 5 µm (Brockmann, 2011,            bution (Lacher et al., 2018; Bi et al., 2019; Chen et al., 2021).
Eqs. 6-51 to 6-53). Therefore, only particles larger than 5 µm        Dividing NINP by S yields nS (Connolly et al., 2009; Hoose
that were detected by the HINC OPC are counted as ice crys-           and Möhler, 2012; Niemand et al., 2012; Vali et al., 2015;
tals. The INP concentration measurements in this study are            Lacher et al., 2018; Bi et al., 2019).
representative of ambient particles smaller than 1.5 µm. For
more detailed HINC design and operating principle informa-
tion, please refer to Lacher et al. (2017) and Kanji and Ab-
batt (2009). In addition, the gravitational settling values es-
timated for 1, 2, and 5 µm particles in the tubing upstream
of the HINC inlet are estimated to be ∼ 2.1 %, 7.7 %, and

Atmos. Chem. Phys., 22, 7539–7556, 2022                                                 https://doi.org/10.5194/acp-22-7539-2022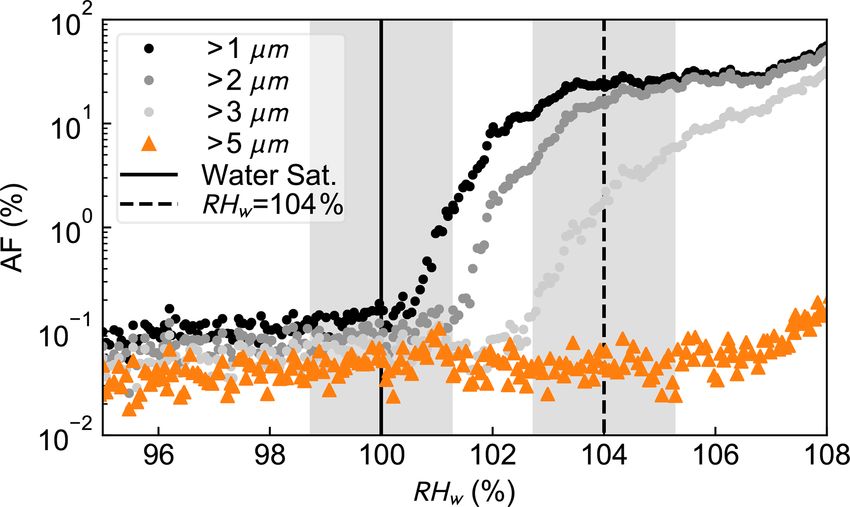
C. Zhang et al.: Ice-nucleating particles in the urban environment                                                         7543

3     Results and discussion                                     which further confirmed the presence of large particles dur-
                                                                 ing the dust event. Aerosol optical depth (AOD) derived from
3.1    Overview                                                  MODIS Aqua Deep Blue Collection 6 dataset at 550 nm
                                                                 (Acker and Leptoukh, 2007) also shows elevated aerosol
The observation lasted from 10 to 28 February, overlap-          loading on 21 February afternoon at the sampling site com-
ping with the traditional Chinese Spring Festival for the year   pared to 20 February (Fig. A2). Based on measured particle
2021. Figure 2 displays (a) the chemical composition of non-     mass concentration level and meteorological conditions, the
refractory PM1 mass concentration and (b) particle number        observation days are categorized into different scenarios, i.e.,
size distribution. Figure 3 shows the ambient meteorological     dust event, clean, and heavy pollution days, as summarized
conditions, including (a) wind speed and wind direction, (b)     in Table 1.
temperature and RHw , and (c) PM2.5 and PM10 mass con-              In the following sections, the data collected in this study
centrations and NINP . Figure 4 presents the BC mass con-        are categorized into aforementioned scenarios. The corre-
centration (mBC ) variation during the observation in addition   lation between NINP and the physiochemical properties of
to NINP . The grey shading in Figs. 2–4 indicates the IN ex-     ambient particles, including particle number concentration
periment time periods.                                           and chemical composition, in each scenario and the potential
   On the nights of 11 and 26 February, fireworks were lit       source of immersion INPs are discussed. We also compare
for celebrations of the Spring Festival and Lantern Festi-       data to NINP measured under similar conditions reported in
val. Large amounts of particles emerged after the celebra-       the literature, with particular attention to the IN activity and
tions due to firework emissions, as indicated by the sharp       INP source attribution.
growth of nonrefractory PM1 mass concentration compris-
ing organic components and chloride salts in Fig. 2a. Up to      3.2   Contribution of mineral dust to NINP during the dust
7 µg m−3 of BC particles mainly originating from firework              event
emissions were also detected during and after the celebra-
tions, as illustrated in Fig. 4. Apart from the firework emis-   In the afternoon of 21 February 2021, a dust event occurred
sions, the mass concentration of nitrate and sulfate also in-    at the sampling site, as indicated clearly by the significant
creased significantly (Fig. 2a) under the relatively stagnant    difference between PM10 and PM2.5 mass concentrations in
and humid meteorological conditions after the nights of 11       Fig. 3c. PM10 mass concentration reached 250 µg m−3 and
and 26 February (Fig. 3b), indicating secondary pollutant        was 3 to 5 times as much as the PM2.5 mass concentration
formation (e.g., Wu et al., 2018). Such secondary pollutant      during the dust event.
transformation processes produce particles in the accumula-         The dust event is characterized with substan-
tion mode, as illustrated by the high level of particle con-     tially higher AF (0.0036 % ± 0.0011 %) and nS
centration peaking between 200–300 nm in Fig. 2b. During         (9.0 × 10⁹ ± 3.0 × 10⁹ # m−2 ) compared to other days,
heavy pollution after the Spring Festival and Lantern Fes-       as listed in Table 1. During the dust event, NINP was 1
tival, PM2.5 mass concentrations, respectively, approached       to 2 orders of magnitude higher than clean days, ranging
∼ 550 and 200 µg m−3 (Fig. 3c). The synergetic heavy pollu-      from 40 to 160 # L−1 . Meanwhile, the ambient particle
tion induced by secondary pollutant formation and firework       number concentration entering HINC (NCPC ) during the
emission is marked with arrows in Figs. 2–4.                     dust event is only half to two-thirds that of the clean-day
   On 18 February, the first workday after the Spring Festival   concentration level (Table 1), leading to the distinguishably
holiday (11 to 17 February), people swarmed into downtown        higher AF and nS . The significant increase of NINP in the
Beijing, and the mass concentrations of nonrefractory PM1        dust event complies with the results by Bi et al. (2019), who
and PM2.5 increased during rush hours, as can be seen in         reported NINP as high as 2800 # L−1 measured at −30 ◦ C
Figs. 2a and 3c, respectively. mBC also increased because of     and RHw = 106.5 % during a desert dust event at a rural
increasing use of passenger vehicles during rush hours on        sampling site in suburban Beijing. nS during the dust event is
workdays after 18 February, as shown in Fig. 4.                  also on the same order of magnitude with Bi et al. (2019) and
   During the whole observation, there was a minor differ-       Lacher et al. (2018), as shown in Fig. 5. However, most of
ence between ambient PM2.5 and PM10 mass concentrations          the parameterizations obtained from laboratory experiments
(PM10–2.5 ) except for 21 February afternoon (Table 1), when     using Asian dust (AD) samples tend to overestimate nS by
there was a significant increase of PM10 mass concentration      1–2 orders of magnitude (Connolly et al., 2009; Niemand et
as highlighted by the orange shading in Fig. 3c, implying        al., 2012; Ullrich et al., 2017), except for the size-segregated
that large particles with da ranging between 2.5 and 10 µm       parameterization proposed by Reicher et al. (2019) that
were present, which were most likely to be mineral dust par-     spans from 1.9 × 10⁹ # m−2 for submicron particles to
ticles (e.g., Park et al., 2004; Hoffmann et al., 2008; Rai et   4.2 × 10¹⁰ # m−2 for supermicron particles. The 24 h back
al., 2021). Besides, aerodynamic particle number size dis-       trajectory analysis at three heights (20, 500, and 1000 m,
tribution exhibited a clear shift towards the larger end dur-    Fig. A3) using the National Oceanic and Atmospheric
ing the dust event (Fig. A1) with a mode size around 1 µm,       Administration (NOAA) HYSPLIT (HYbrid Single-Particle

https://doi.org/10.5194/acp-22-7539-2022                                         Atmos. Chem. Phys., 22, 7539–7556, 2022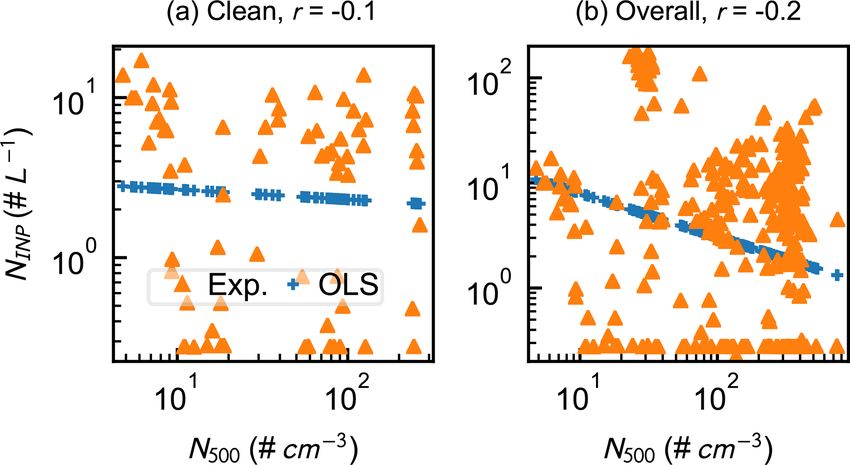
7544                                                             C. Zhang et al.: Ice-nucleating particles in the urban environment

Figure 2. Time series of (a) nonrefractory PM1 mass concentration and (b) particle number size distribution. The grey shading and black
arrows in (a) indicate IN experiment time periods and heavy pollution after celebrations, respectively.

Figure 3. Times series of (a) wind speed and direction, (b) ambient temperature and relative humidity with respect to liquid water (RHw ),
and (c) PM2.5 and PM10 mass concentrations and immersion INP number concentration (NINP ). The grey shading in each panel indicates
IN experiment time periods; the orange shading and arrows in (b) mark the dust event on 21 February 2021 and the heavy pollution after
celebrations, respectively.

Lagrangian Integrated Trajectory) model suggests that the                   Previous laboratory studies have shown that larger parti-
air parcel during the dust event is from the northwestern                cles, especially those larger than 500 or 1000 nm, exhibit su-
direction of Beijing, originating from the Mongolia Gobi                 perior INP activity based on surface active site density the-
Desert. The back trajectory analysis by Bi et al. (2019)                 ory (e.g., Connolly et al., 2009; Welti et al., 2009; Lüönd
also suggested that air parcels from Mongolia Gobi Desert                et al., 2010; Hoose and Möhler, 2012; Ardon-Dryer and
tended to carry loads of desert dust, leading to higher NINP .           Levin, 2014; Chen et al., 2021). Bi et al. (2019) observed

Atmos. Chem. Phys., 22, 7539–7556, 2022                                                     https://doi.org/10.5194/acp-22-7539-2022
C. Zhang et al.: Ice-nucleating particles in the urban environment                                                                                                           7545

Figure 4. Time series of black carbon (BC) particle mass concentration (mBC ) and NINP . The grey shading and black arrows indicate IN
experiment time periods and heavy pollution after celebrations, respectively.

Table 1. The date, number concentrations of immersion INPs (NINP ) and ambient particles (NCPC ), activation fraction (AF), ice-active
surface site density (nS ), number concentrations of particles ranging from 500 nm to 1.5 µm (N500 ) and 1000 nm to 1.5 µm (N1000 ), mass
concentrations of BC particles (mBC ) and ammonium salt (mammo. ), PM2.5 , PM10 , and PM10–2.5 for each scenario. The numbers are average
values, and numbers in parentheses denote 1 standard deviation (σ ) from the average.

  Scenario              Date in February and     NINP         NCPC    AF × 103    nS × 10−8          N500       N1000        mBC      mammo.        PM2.5       PM10     PM10–2.5
                        time periods           (# L−1 )   (# cm−3 )        (%)      (# m−2 )     (# cm−3 )   (# cm−3 )   (µg m−3 )   (µg m−3 )   (µg m−3 )   (µg m−3 )   (µg m−3 )
  Dust event            21                        112        3364           3.6         90.0           26          0.1         0.4         0.6         57        194          137
                        12:00–18:00               (34)       (952)        (1.2)       (30.1)           (2)       (0.1)       (0.1)       (0.1)       (15)        (26)         (14)
  Clean                 10, 17–18, 21–22             4        5205          0.1          2.7           67          0.1         1.1         4.9         48          74           26
                        11:00–23:00                (3)      (1557)        (0.1)        (4.4)         (72)        (0.1)       (1.0)       (5.9)       (36)        (52)         (34)
    Car emission        16:00–20:00 of               3        4647          0.1          1.0           69          0.2         1.2         4.2         54          96           43
                        clean days                 (3)      (1510)        (0.1)        (1.1)         (31)        (0.1)       (0.4)       (2.2)       (13)        (43)         (40)
    Truck emission      21:00–23:00 of               4        4671          0.1          0.6         191          0.1          2.7       15.7        108         132            24
                        clean days                 (3)      (1522)        (0.1)        (0.5)         (89)         (0)        (1.2)       (7.8)       (42)        (20)         (25)
  Pollution             12–13, 24–27                 6       4310           0.1          0.6          279          0.1         2.5         9.7       130         160           30
                        8:00–23:00                 (8)       (964)        (0.2)        (0.9)        (111)        (0.1)       (1.1)       (4.6)       (41)        (45)          (9)
    Firework emission   8:00–22:00 on 26             2        4474          0.1          0.2         324          0.1          2.2       10.0         135        168           34
                                                   (3)       (993)        (0.1)        (0.3)         (40)         (0)        (0.4)       (1.8)       (12)        (12)          (9)
  Overall               10–28                       12        4370          0.4          6.7          209          0.1         1.9         7.5       102          138           35
                        (8:00–23:00)              (28)      (1229)        (0.9)       (22.6)        (141)        (0.1)       (1.2)       (5.4)       (53)        (60)         (34)

                                                                                               NINP and N500 was performed for the dust event using the
                                                                                               ordinary least square (OLS) method, as shown in Fig. 6a.
                                                                                               The triangles denote measured data, and the blue markers
                                                                                               are the predicted data using the fitted linear regression pa-
                                                                                               rameters. The Pearson’s correlation coefficient (r) between
                                                                                               log10 (NINP ) and log10 (N500 ) is −0.3 (Fig. 6a), reflecting that
                                                                                               N500 is slightly correlated with NINP and might have limited
                                                                                               impact on NINP during the dust event. Besides, the signif-
                                                                                               icant difference between PM10 and PM2.5 mass concentra-
                                                                                               tions (Fig. 3c and Table 1) implies that large (dust) particles
                                                                                               (occupies high mass concentration but low number concen-
Figure 5. Ice-active surface site density (nS ) for different scenar-
ios. The median (horizontal orange lines), 25th and 75th percentiles                           tration) with high IN activity appeared during the dust event.
(lower and upper boxes), and 10th and 90th percentiles (lower and                              An earlier study in an eastern Mediterranean urban region
upper whiskers) are shown.                                                                     claimed that immersion IN activity of particles collected dur-
                                                                                               ing dust storms correlated well (R 2 = 0.47) with PM10–2.5
                                                                                               between −10 and −30 ◦ C (Ardon-Dryer and Levin, 2014).
                                                                                               To explore the connection between PM10–2.5 and NINP in the
a significant increase of NINP when ambient particle peak
                                                                                               urban environment, correlation analysis between NINP and
size shifted towards the larger end of size spectra (exceed-
                                                                                               PM10–2.5 data collected during the dust event was also con-
ing 1000 nm) during springtime dust events in rural Beijing.
                                                                                               ducted using OLS linear regression. The correlation between
N500 is generally below 50 # cm−3 during springtime dust
                                                                                               NINP and PM10–2.5 at −30 ◦ C (r = −0.5, Fig. C1) during the
events in Beijing (Bi et al., 2019) and is comparable to the
                                                                                               dust event in this study suggests that PM10–2.5 had a mod-
results presented in Fig. 6a. To quantify the impact of N500
                                                                                               erate negative correlation with NINP in the urban environ-
on NINP , linear regression analysis between logarithms of

https://doi.org/10.5194/acp-22-7539-2022                                                                            Atmos. Chem. Phys., 22, 7539–7556, 2022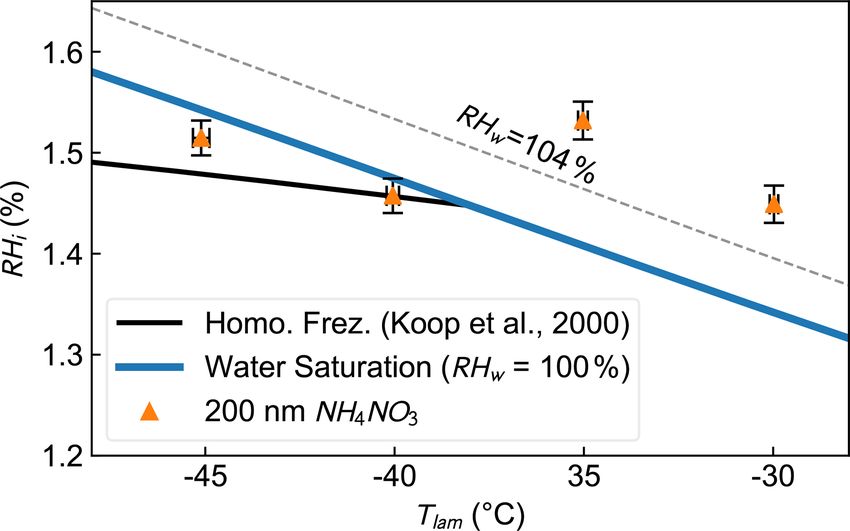
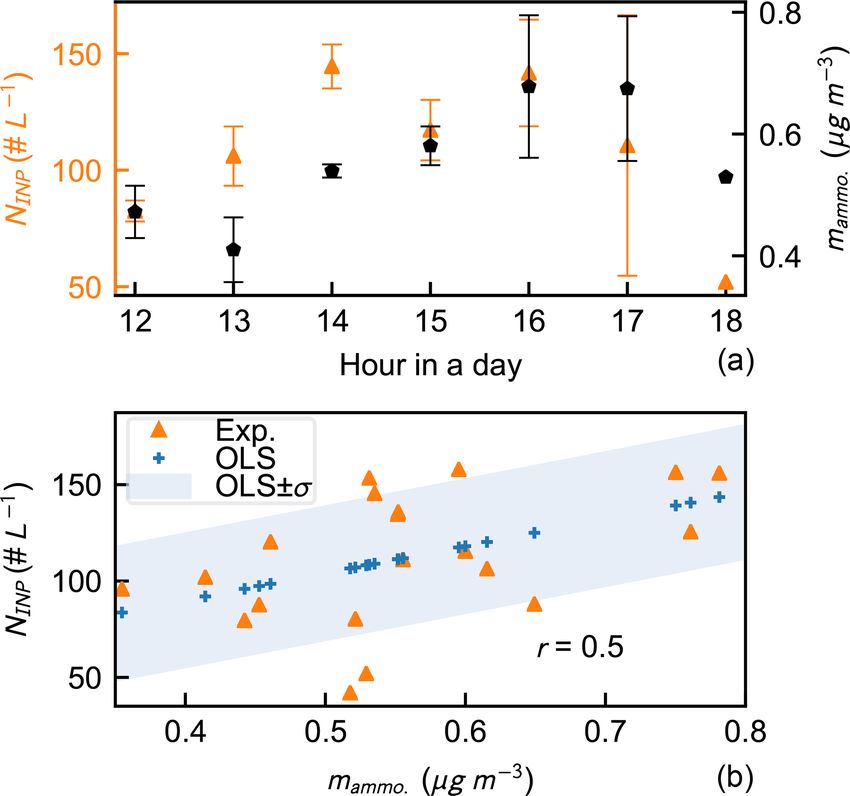
7546                                                                C. Zhang et al.: Ice-nucleating particles in the urban environment

Figure 6. Correlations between N500 and NINP for (a) dust event
and (b) heavy pollution. The r above each panel is the Pearson’s
correlation coefficient for the linear regression fitting of the experi-
ment data using ordinary least square (OLS) method. Blue markers
indicate predicted NINP using fitted linear regression parameters.

ment, which is stronger yet not statistically significant. As
suggested by previous studies (e.g., Atkinson et al., 2013;
Kaufmann et al., 2016; Iwata and Matsuki, 2018), dust min-                 Figure 7. Diurnal profile of (a) and correlation between (b) NINP
eralogy might be a superior immersion IN driving factor in-                and mammo. during the dust event. The blue markers in panel (b) in-
stead of N500 and PM10–2.5 in the urban environment and                    dicate the predicted NINP using fitted linear regression parameters.
worth further exploration.                                                 The blue shading indicates ±1σ of measured NINP from predicted
   The upper panel of Fig. 7 displays the diurnal profile of               NINP .
measured NINP and mass concentration of atmospheric am-
monium (mammo. ) during the dust event. It can be seen that,
except for 13:00 (UTC+8), the NINP profile seems to fol-                   of mineral dusts (e.g., Kumar et al., 2018; Whale et al., 2018;
low the mammo. profile. Wu et al. (2020) reported that am-                 Kumar et al., 2019). More field observations in urban areas,
monium ions could form and accumulate on mineral dust                      as well as systematic laboratory studies using natural mineral
surface in the form of ammonium nitrate in the highly pop-                 dust samples (e.g., Saharan dust and Asian dust, etc.), are re-
ulated urban environment. Previous laboratory studies have                 quired to further investigate the connection between mineral
shown that the ammonium content on mineral dust surface                    dust surface characteristics and IN activity, as well as the un-
might promote their IN activity due to strengthened ammo-                  derlying mechanism.
nium ion surface adsorption followed by the formation of an                   NINP values measured during the dust event are compared
ice-favorable structure on dust particle surfaces (Boose et al.,           with previous empirical parameterizations with a particular
2016b; Kumar et al., 2018; Whale et al., 2018; Kumar et al.,               focus on mineral dusts to link parameterizations with the
2019). To quantify the correlation between atmospheric am-                 observation and gain better insight into the deviation be-
monium content and NINP during the dust event and to inves-                tween measured and predicted NINP . Almost all measured
tigate whether the observed enhancement of mineral dust IN                 NINP data lie within a factor of 2.5 of the predicted NINP us-
activity by ammonium salts in previous studies (Boose et al.,              ing the widely used parameterization proposed by DeMott et
2016b; Kumar et al., 2018; Whale et al., 2018; Kumar et al.,               al. (2010) based on 14-year field observation data, as shown
2019) still holds for the urban environment, linear regression             by the brown squares and shading in Fig. 8. This parameter-
analysis between NINP and mammo. was performed, as shown                   ization links NINP at a specific temperature with the expo-
in the lower panel of Fig. 7. The blue markers are fitted NINP             nential form of N500 and takes not just mineral dusts but all
based on the OLS regression parameters, and the blue shad-                 ambient IN-active aerosol types into consideration. It should
ing refers to the ±1σ range (calculated from measured NINP )               be noted that most measured NINP values lie above the De-
from fitted NINP . The NINP exhibits a moderate positive cor-              Mott et al. (2010) parameterization predicted NINP . Such un-
relation with mammo. (r = 0.5), with more than 60 % of mea-                derestimation by the DeMott et al. (2010) parameterization
sured NINP falling into the shaded area, suggesting that NINP              for ammonium-rich mineral dusts was also reported earlier
might be associated with mammo. during dust events in the                  in a Saharan dust plume observation, and it was attributed
urban environment. It should be noted that NINP also has a                 to not taking the IN activity enhancement of mineral dusts
weak positive correlation with mSO4 (r = 0.4, Table C1) dur-               by trace amount atmospheric ammonium into consideration
ing the dust event, but previous studies have confirmed that               (Boose et al., 2016b). Another empirical NINP parameteri-
ammonium content, instead of anion species, is more likely                 zation proposed by DeMott et al. (2015) is specifically for
to be the driving force in altering the immersion IN activity              mineral dusts based on laboratory measurement. However,

Atmos. Chem. Phys., 22, 7539–7556, 2022                                                      https://doi.org/10.5194/acp-22-7539-2022
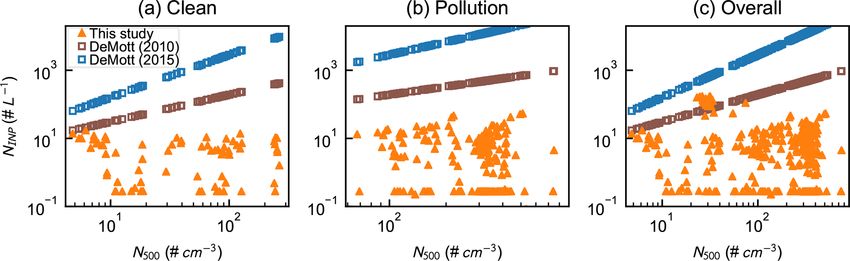
C. Zhang et al.: Ice-nucleating particles in the urban environment                                                               7547

                                                                     Figure 9. Mass concentration of organics (morg. ) and BC (mBC ) on
                                                                     clean days.

                                                                     major particle formation pathway in gasoline passenger ve-
                                                                     hicle exhausts is volatile organic compound (VOC) nucle-
Figure 8. Intercomparison of measured (solid orange triangles) and   ation, producing large numbers of nanoparticles (diameter
predicted (hollow blue and brown squares) NINP during the dust       smaller than 50 nm) with low mass concentration (Raza et al.,
event. The prediction is based on the parameterizations that link
                                                                     2018 and references therein). On the other hand, diesel en-
NINP with the number concentration of particles larger than 500 nm
(N500 ) at a specific temperature (DeMott et al., 2010, 2015).
                                                                     gine particle emission is dominated by BC particles ranging
                                                                     between 80–200 nm (Kittelson, 1998). The increase of mass
                                                                     concentrations of organics (morg. ) and BC between 16:00 to
it tends to systematically overestimate NINP during the dust         20:00 (UTC+8) in Fig. 9 corresponds to the evening rush
event by up to an order of magnitude (3 to 13 times higher           hours, during which the emission of gasoline passenger ve-
than the measured values) as shown by the blue squares in            hicles dominates ambient particle population in the urban
Fig. 8. Such overestimation on NINP during the dust event by         region. There is a further increase of morg. and mBC after
previous parameterizations might be caused by omission of            20:00 (UTC+8) followed by a plateau in Fig. 9. According
mineral dust chemical composition and mixing state change            to Beijing municipal administrative regulation, heavy-duty
during transportation (e.g., Tobo et al., 2010; Wang et al.,         diesel trucks for goods transportation, as well as gasoline
2014; Li et al., 2016; Tang et al., 2016; Wu et al., 2020). Pre-     passenger vehicles with foreign plates (issued by cities other
vious laboratory experiments suggest that even though mix-           than Beijing), are only permitted to enter urban Beijing after
ing with organics might not affect the immersion IN activity         20:00 (UTC+8). Increasing emission from on-road heavy-
of mineral dusts (Tobo et al., 2012; Wex et al., 2014; Kanji         duty diesel trucks and gasoline passenger vehicles with for-
et al., 2019), mixing with sulfuric acids (Cziczo et al., 2009;      eign plates are highly likely to be responsible for the in-
Eastwood et al., 2009; Chernoff and Bertram, 2010; Nieder-           creasing morg. and mBC after 20:00 (UTC+8; e.g., Hua et al.,
meier et al., 2011; Tobo et al., 2012; Augustin-Bauditz et al.,      2018; Zhang et al., 2019).
2014) and ammonium and sulfate salts (Cziczo et al., 2009;              NINP of clean days ranges between 0.3 to 16 # L−1 , which
Iwata and Matsuki, 2018; Kumar et al., 2018; Whale et al.,           is the same order of magnitude as the immersion NINP results
2018; Kumar et al., 2019) could suppress the immersion IN            by Schill et al. (2016), who reported NINP for both freshly
activity of mineral dusts to different degrees. However, cur-        emitted and aged BC on the order of 10−1 to 101 # L−1 mea-
rent parameterizations could represent the upper limit of at-        sured at similar experiment condition (−30 ◦ C and RHw =
mospheric INP number concentration in global models, and             105 %) to this study, using BC generated from an off-
we suggest that future parameterizations should include the          road diesel engine. AF and nS values reported by Schill et
influence of atmospheric processes (such as photo-oxidation          al. (2016) lie in the lower range of measured AF and nS as-
and gaseous species condensation) on mineral dust IN activ-          sociated with vehicle emission periods (Table 1 and Fig. 5).
ity to achieve more realistic prediction.                            To investigate the impact of traffic emission on NINP , linear
                                                                     regression analysis is performed between NINP and mBC , a
                                                                     widely used cursor of traffic emission. As shown in Fig. 10a,
3.3     Contribution of black carbon (BC) to NINP                    the correlation between NINP and mBC is poor (r = 0), im-
3.3.1    Traffic emission                                            plying that NINP is independent of mBC on clean days. Re-
                                                                     cently, Kanji et al. (2020) also reported that BC might not
Clean days, when compared with heavy pollution or dusty              act as effective immersion INPs based on laboratory experi-
days, provide an ideal background to investigate the impact          ments. The absence of a relationship between NINP and mBC
of primary particle emission sources, especially local traffic       on clean days is consistent with previous findings (Schill et
emission (from clean days), on NINP in urban regions. The            al., 2016; Kanji et al., 2020; Schill et al., 2020), which sug-

https://doi.org/10.5194/acp-22-7539-2022                                             Atmos. Chem. Phys., 22, 7539–7556, 2022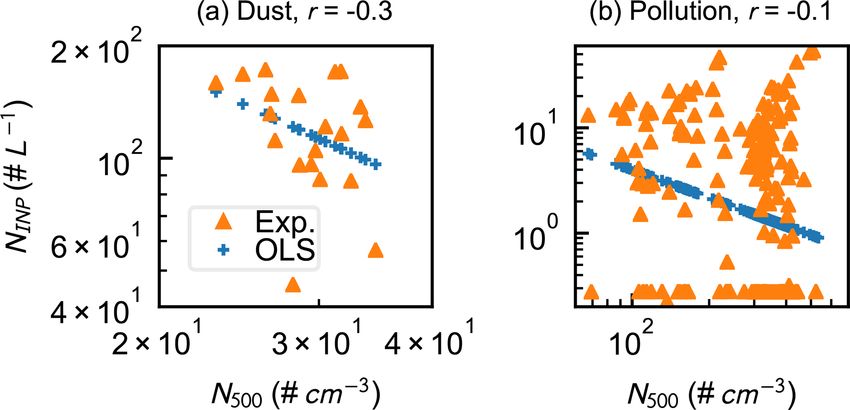
7548                                                             C. Zhang et al.: Ice-nucleating particles in the urban environment

                                                                        celebrations was induced by secondary pollutant formation
                                                                        via liquid-phase reaction (e.g., Wang et al., 2018; Wu et al.,
                                                                        2018) and firework emission. Under the mixed-phase cloud
                                                                        conditions (−30 ◦ C, RHw = 104 %) in this study, such par-
                                                                        ticles are very likely to become aqueous droplets or contain
                                                                        liquid films on solid particles, which might require condi-
                                                                        tions for homogeneous freezing to nucleate ice.

                                                                        4   Conclusion

                                                                        In situ observation of NINP and physiochemical properties,
Figure 10. Correlations between mBC and NINP during (a) clean           including chemical composition and size distribution, of
and (b) heavy pollution periods. The r above each panel is Pearson’s    ambient particles at an urban site in Beijing during the
correlation coefficient. Blue markers indicate the predicted NINP
                                                                        traditional Chinese Spring Festival has been performed
using fitted linear regression parameters.
                                                                        at mixed-phase cloud conditions (−30 ◦ C, RHw = 104 %)
                                                                        for 18 d. The impact of different scenarios, such as the
                                                                        synergetic heavy pollution induced by secondary aerosol
gests that BC associated with vehicle emission might not act
                                                                        formation and firework emissions, a dust event, and local
as active immersion INPs in the urban atmosphere.
                                                                        traffic emissions on NINP , has been explored. NINP was
                                                                        investigated in relation to N500 and mBC . The relationships
3.3.2   Firework emission                                               between mammo. and NINP , as well as between PM10–2.5
                                                                        and NINP , during the dust event are also presented. The
Heavy pollution accompanied by the presence of substan-                 results show that NINP values , as well as AF, of ambient
tially higher mass concentrations of nonrefractory PM1 ,                particles during the dust event are substantially higher
PM2.5 (128 ± 44 µg m−3 ), and BC (up to 6 µg m−3 ) occurred             than all other scenarios. NINP could reach 160 # L−1
during 12–13 and 24–27 February, as shown in Figs. 2–4.                 during the dust event, while it ranges from 10−1 to
The N500 was also substantially higher during heavy pollu-              101 # L−1 on other days. AF and nS during the dust event
tion than other days (Table 1). As stated above, large amounts          (0.0036 % ± 0.0011 % and 9.0 × 10⁹ ± 3.0 × 10⁹ # m−2 )
of particles comprising carbonaceous material and chloride              are 20 to 30 times higher than clean (0.0001 % ± 0.0001 %
emerged after Spring Festival and Lantern Festival celebra-             and 2.7 × 10⁸ ± 4.4 × 10⁸ # m−2 ) and heavily polluted days
tions due to firework emissions which also contain trace                (0.0002 % ± 0.0002 % and 6.5 × 10⁷ ± 9.3 × 10⁷ # m−2 ).
amounts of potassium and other metal elements (Jiang et al.,            During the dust event, NINP values exhibit a moderate
2015; Kong et al., 2015; Cao et al., 2017).                             positive correlation with mammo. (r = 0.5) and a moderate
   With almost 10 times as much N500 as that of the dust                negative correlation with PM10–2.5 (r = −0.5). The pa-
event during heavy pollution, it was expected that a substan-           rameterization proposed by DeMott et al. (2010) predicts
tially higher INP concentration would be observed if these              more than 60 % of measured NINP within a factor of 2.5
large particles are effective INPs. However, the particle pop-          during the dust event. Mass concentration measurements
ulation during heavy pollution did not exhibit superior IN              suggest that large amounts of aerosols containing chloride
activity, with the majority of NINP falling into the range of           and BC appeared after the celebrations on the nights of 11
0 to 25 # L−1 . The log10 (NINP ) exhibits a weak negative cor-         and 26 February due to firework emission. Meanwhile, the
relation with log10 (N500 ) in Fig. 6b (r = −0.2). As shown             stagnant and humid meteorology conditions provide ideal
in Fig. 10b, the OLS linear regression results further sug-             conditions for secondary aerosol formation. But there is no
gest that NINP is likely to be independent of mBC during                significant difference between NINP on heavily polluted and
heavily polluted days (r = 0). The independence of NINP on              clean days, implying that the urban aerosols from multiple
mBC is compliant with the results by Adams et al. (2020),               sources with complex chemistry might not be effective
in which there was a substantial growth (by more than an                INPs. Besides, the diurnal increase of mBC from petrol
order of magnitude) of ambient particle number concentra-               passenger vehicle emissions during rush hours and from
tion and mBC from combustion and firework emissions, but                diesel truck emissions after 20:00 (UTC+8) on clean days
no significant NINP change was observed. Chen et al. (2018)             does not lead to distinguishable higher NINP , implying that
conducted offline NINP measurements using filtered samples              local traffic emission also has a negligible impact on NINP .
collected at the same sampling site as this study during heavy          Our study reveals that immersion INP population in the
pollution, and they found no dependence of NINP on the                  urban environment has increased substantially during the
mass concentrations of PM2.5 or BC nor on N500 . As men-                East Asian dust event. Furthermore, our results agree with
tioned before, the synergetic heavy pollution after festival            previous literature from laboratory and field studies showing

Atmos. Chem. Phys., 22, 7539–7556, 2022                                                  https://doi.org/10.5194/acp-22-7539-2022
C. Zhang et al.: Ice-nucleating particles in the urban environment 7549
that atmospheric BC from both local traffic and firework
emissions has negligible effects on mixed-phase cloud
formation and that NINP is unaffected by heavy pollution.
Appendix A: Ambient aerosol characterization and
back trajectory analysis of the dust event
Figure A3. The 24 h back trajectory of the air parcel at the sampling
site at three different heights (20, 500, and 1000 m a.g.l.).
Figure A1. Aerodynamic diameter (da ) size distribution of particles Appendix B: HINC lamina condition calibration
before (00:00–06:00, 21 February; “BG”) and during the dust event
(11:00–18:00, 21 February; “Dust”). The HINC lamina condition calibration was performed by
injection of 200 nm ammonium nitrate aqueous droplets into
HINC at four lamina temperatures, i.e., −45, −40, −35, and
−30 ◦ C. HINC was operated in RH scan mode during the
calibration, in which HINC lamina temperature was main-
tained constant by varying the wall temperatures simultane-
ously, resulting in a temperature gradient and supersatura-
tion in the chamber (Lacher et al., 2017). The RHi within the
HINC lamina changed continuously from 100 % to 160 % at
each lamina temperature. The concentration of the ammo-
nium nitrate solution was 0.0025 mol L−1 . The solution was
atomized by a nebulizer (TSI Inc.) using 1.5 L min−1 nitro-
gen gas. The flow stream was dried to RHw 1, >2, >3, >5 µm) are marked with dif-
ferent colors. It is worth noting that given the flow structure
of HINC in this study (Sect. 2.2.3), only particles larger than
5 µm detected by the HINC OPC would be recognized as de-
tectable ice crystals (below −38 ◦ C) or water droplets (above
−38 ◦ C). As shown in Fig. B1, the 200 nm ammonium nitrate
aqueous droplets start to grow upon water saturation (black
Figure A2. Aerosol optical depth (AOD) on 20 February (a) and
dots), followed by more rapid growth with increasing RHw
21 February (b) using MODIS Aqua Deep Blue Collection 6 aerosol
(grey dots). However, there is no growth in the >5 µm chan-
data at 550 nm (Acker and Leptoukh, 2007). Sampling site is de-
noted with a black star in each panel. nel until RHw exceeds 106 %, corresponding to the presence
of detectable water droplets larger than 5 µm. Therefore, the
HINC should be operated below 106 % at −30 ◦ C to avoid
https://doi.org/10.5194/acp-22-7539-2022 Atmos. Chem. Phys., 22, 7539–7556, 20227550 C. Zhang et al.: Ice-nucleating particles in the urban environment
erroneous counts of large (>5 µm) water droplets rather than
ice crystals.
Figure B2. Phase diagram of the IN onset (below −38 ◦ C) or wa-
ter droplet detection in the >5 µm OPC channel (above −38 ◦ C) for
freezing or water droplet formation onto 200 nm dry diameter am-
Figure B1. AF as a function of RHw at −30 ◦ C for 200 nm am- monium nitrate particles. The solid blue and black lines represent
monium nitrate aqueous droplets detected in different HINC OPC the water saturation line and the homogeneous freezing threshold
channels. Vertical solid and dash black lines represent water satura- of 200 nm aqueous droplets (Koop et al., 2000), respectively. The
tion (RHw = 100 %) and RHw = 104 %, respectively. Grey shading horizontal and vertical error bars represent the variation of temper-
indicates the average variation of RHw along HINC lamina center- ature and RHi along HINC lamina centerline.
line.
Figure B2 shows the IN onset or water droplet survival Appendix C: Additional information
points for 200 nm ammonium nitrate during the calibration.
The IN onset or water droplet survival points are defined
as the temperature and RH when 0.1 % of aerosols enter-
ing HINC are activated as detectable ice crystals or wa-
ter droplets by the HINC OPC in the >5 µm channel. The
blue and black solid lines represent water saturation (RHw =
100 %) and homogeneous freezing threshold (Koop et al.,
2000), respectively. The error bars in Fig. B2 represent 1
standard deviation of temperature and RHi along HINC lam-
ina centerline for each individual RHi scan. During the cali-
bration, the average variation of lamina RHw was less than
1.2 % (corresponding to a 1.8 % variance of lamina RHi ).
Lamina RHw suffers larger variation as RH increases, re-
sulting in RHw = 108 % ± 2.1 % at −30 ◦ C. The variance of
lamina temperature was below 0.2 K throughout the calibra- Figure C1. Correlations between PM10–2.5 and NINP in the (a)
tion process. As shown in Fig. B2, the IN onset point of dust event and (b) observation. The r above each panel is Pearson’s
200 nm ammonium nitrate at −40 ◦ C lies on the calculated correlation coefficient. Blue markers indicate the predicted NINP
homogeneous freezing threshold. The IN onset at −45 ◦ C using fitted linear regression parameters.
exceeds the homogeneous freezing threshold by 3.5 %, yet
it is still below the water saturation line. When the lamina
temperature is above −38 ◦ C, water drops require RHw sub-
stantially higher than 104 % (dashed line) to be detected in
the >5 µm OPC channel; as such, we are confident that sig-
nals arising in the >5 µm OPC channel at RHw = 104 % are
due to ice crystal formation.
Atmos. Chem. Phys., 22, 7539–7556, 2022 https://doi.org/10.5194/acp-22-7539-2022C. Zhang et al.: Ice-nucleating particles in the urban environment 7551
Figure C2. Correlations between N500 and NINP for (a) clean days and (b) the observation. The r above each panel is Pearson’s correlation
coefficient. Blue markers indicate the predicted NINP using fitted linear regression parameters.
Figure C3. Intercomparison of measured (solid orange triangles) and predicted (hollow blue and brown squares) NINP on clean (a) and
heavy pollution (b) days, as well as during the observation (c). The prediction is based on the parameterizations that link NINP with the
number concentration of particles larger than 500 nm (N500 ) at a specific temperature (DeMott et al., 2010, 2015).
Figure C4. Correlations between mBC and NINP during the (a) dust event and (b) observation. The r above each panel is Pearson’s correla-
tion coefficient. Blue markers indicate the predicted NINP using fitted linear regression parameters.
Table C1. Pearson’s correlation coefficient (r) between NINP and selected measured values.
Measured values N500 N1000 morg. mNH4 mSO4 mNO3 mBC PM1 PM2.5 PM10 PM10–2.5
Dust event −0.36 −0.24 −0.04 0.46 0.36 0.06 −0.09 0.06 0.05 −0.23 −0.49
Overall −0.29 0.01 −0.32 −0.32 −0.34 −0.37 −0.30 −0.37 −0.19 0.22 0.70
https://doi.org/10.5194/acp-22-7539-2022 Atmos. Chem. Phys., 22, 7539–7556, 20227552 C. Zhang et al.: Ice-nucleating particles in the urban environment
Data availability. Data inquires can be directed to the correspond- spheric processes, P. Natl. Acad. Sci. USA, 116, 8657–8666,
ing author (Zhijun Wu, zhijunwu@pku.edu.cn). https://doi.org/10.1073/pnas.1900125116, 2019.
Ansmann, A., Tesche, M., Althausen, D., Müller, D., Seifert, P.,
Freudenthaler, V., Heese, B., Wiegner, M., Pisani, G., Knip-
Author contributions. CZ and ZW designed the experiments and pertz, P., and Dubovik, O.: Influence of Saharan dust on
methodology. CZ and JingC conducted the field observation. CZ, cloud glaciation in southern Morocco during the Saharan Min-
WZ, and LT performed aerosol chemical and size distribution anal- eral Dust Experiment, J. Geophys. Res.-Atmos., 113, D04210,
yses. CZ, JieC, XP, and JingC calibrated the HINC. SC and LZ pro- https://doi.org/10.1029/2007JD008785, 2008.
vided the meteorology data. MH, ZW, ZAK, PT, and SG supervised Archuleta, C. M., DeMott, P. J., and Kreidenweis, S. M.: Ice nu-
the observation. CZ, ZW, and ZAK prepared the article with input cleation by surrogates for atmospheric mineral dust and mineral
from all co-authors. dust/sulfate particles at cirrus temperatures, Atmos. Chem. Phys.,
5, 2617–2634, https://doi.org/10.5194/acp-5-2617-2005, 2005.
Ardon-Dryer, K. and Levin, Z.: Ground-based measurements
Competing interests. The contact author has declared that nei- of immersion freezing in the eastern Mediterranean, Atmos.
ther they nor their co-authors have any competing interests. Chem. Phys., 14, 5217–5231, https://doi.org/10.5194/acp-14-
5217-2014, 2014.
Atkinson, J. D., Murray, B. J., Woodhouse, M. T., Whale, T. F.,
Baustian, K. J., Carslaw, K. S., Dobbie, S., O’Sullivan, D., and
Disclaimer. Publisher’s note: Copernicus Publications remains
Malkin, T. L.: The importance of feldspar for ice nucleation
neutral with regard to jurisdictional claims in published maps and
by mineral dust in mixed-phase clouds, Nature, 498, 355–358,
institutional affiliations.
https://doi.org/10.1038/nature12278, 2013.
Augustin-Bauditz, S., Wex, H., Kanter, S., Ebert, M., Niedermeier,
D., Stolz, F., Prager, A., and Stratmann, F.: The immersion mode
Acknowledgements. Aerosol optical depth data used in this pa- ice nucleation behavior of mineral dusts: A comparison of dif-
per were produced with the Giovanni online data system, developed ferent pure and surface modified dusts, Geophys. Res. Lett., 41,
and maintained by the NASA GES DISC. 7375–7382, https://doi.org/10.1002/2014GL061317, 2014.
Bergeron, T.: On the physics of cloud and precipitation, in: Proceed-
ings of the Fifth Assembly of International Union of Geodesy
Financial support. This work was supported by National Nat- and Geophysics, Lisbon, Portugal, 14 to 23 September 1933,
ural Science Foundation of China (NSFC, grant nos. 41875149, 156–178, 1935.
42011530121). Zamin A. Kanji received funding from the Atmo- Bi, K., McMeeking, G. R., Ding, D. P., Levin, E. J. T., De-
spheric Physics chair, ETH Zürich. Mott, P. J., Zhao, D. L., Wang, F., Liu, Q., Tian, P., Ma,
X. C., Chen, Y. B., Huang, M. Y., Zhang, H. L., Gordon, T.
D., and Chen, P.: Measurements of Ice Nucleating Particles
Review statement. This paper was edited by Anne Perring and in Beijing, China, J. Geophys. Res.-Atmos., 124, 8065–8075,
reviewed by two anonymous referees. https://doi.org/10.1029/2019JD030609, 2019.
Boose, Y., Kanji, Z. A., Kohn, M., Sierau, B., Zipori, A.,
Crawford, I., Lloyd, G., Bukowiecki, N., Herrmann, E.,
Kupiszewski, P., Steinbacher, M., and Lohmann, U.: Ice Nucle-
References ating Particle Measurements at 241 K during Winter Months at
3580 m MSL in the Swiss Alps, J. Atmos. Sci., 73, 2203–2228,
Abbatt, J. P. D., Benz, S., Cziczo, D. J., Kanji, Z., Lohmann, U., and https://doi.org/10.1175/jas-d-15-0236.1, 2016a.
Möhler, O.: Solid Ammonium Sulfate Aerosols as Ice Nuclei: A Boose, Y., Sierau, B., García, M. I., Rodríguez, S., Alastuey,
Pathway for Cirrus Cloud Formation, Science, 313, 1770–1773, A., Linke, C., Schnaiter, M., Kupiszewski, P., Kanji, Z.
https://doi.org/10.1126/science.1129726, 2006. A., and Lohmann, U.: Ice nucleating particles in the Sa-
Acker, J. G. and Leptoukh, G.: Online analysis enhances use of haran Air Layer, Atmos. Chem. Phys., 16, 9067–9087,
NASA Earth science data, Eos, Transactions American Geophys- https://doi.org/10.5194/acp-16-9067-2016, 2016b.
ical Union, 88, 14–17, https://doi.org/10.1029/2007EO020003, Boucher, O., Randall, D., Artaxo, P., Bretherton, C., Feingold, G.,
2007. Forster, P., Kerminen, V.-M., Kondo, Y., Liao, H., Lohmann,
Adams, M. P., Tarn, M. D., Sanchez-Marroquin, A., Porter, G. C. U., Rasch, P., Satheesh, S. K., Sherwood, S., Stevens, B., and
E., O’Sullivan, D., Harrison, A. D., Cui, Z., Vergara-Temprado, Zhang, X. Y.: Clouds and Aerosols, in: Climate Change 2013:
J., Carotenuto, F., Holden, M. A., Daily, M. I., Whale, T. F., The Physical Science Basis. Contribution of Working Group I to
Sikora, S. N. F., Burke, I. T., Shim, J. U., McQuaid, J. B., the Fifth Assessment Report of the Intergovernmental Panel on
and Murray, B. J.: A Major Combustion Aerosol Event Had Climate Change, edited by: Stocker, T. F., Qin, D., Plattner, G.-
a Negligible Impact on the Atmospheric Ice-Nucleating Parti- K., Tignor, M., Allen, S. K., Boschung, J., Nauels, A., Xia, Y.,
cle Population, J. Geophys. Res.-Atmos., 125, e2020JD032938, Bex, V., and Midgley, P. M., Cambridge University Press, Cam-
https://doi.org/10.1029/2020JD032938, 2020. bridge, United Kingdom and New York, NY, USA, 571–658,
An, Z., Huang, R.-J., Zhang, R., Tie, X., Li, G., Cao, J., Zhou, https://doi.org/10.1017/CBO9781107415324.016, 2013.
W., Shi, Z., Han, Y., Gu, Z., and Ji, Y.: Severe haze in north-
ern China: A synergy of anthropogenic emissions and atmo-
Atmos. Chem. Phys., 22, 7539–7556, 2022 https://doi.org/10.5194/acp-22-7539-2022You can also read