Identification of the GlialCAM interactome: the G protein-coupled receptors GPRC5B and GPR37L1 modulate megalencephalic leukoencephalopathy proteins
←
→
Page content transcription
If your browser does not render page correctly, please read the page content below
Human Molecular Genetics, 2021, Vol. 30, No. 17             1649–1665

                                                                             https://doi.org/10.1093/hmg/ddab155
                                                                             Advance Access Publication Date: 7 June 2021
                                                                             General Article

GENERAL ARTICLE

Identification of the GlialCAM interactome:

                                                                                                                                                         Downloaded from https://academic.oup.com/hmg/article/30/17/1649/6294512 by guest on 12 December 2021
the G protein-coupled receptors GPRC5B
and GPR37L1 modulate megalencephalic
leukoencephalopathy proteins
Marta Alonso-Gardón1,2,# , Xabier Elorza-Vidal1,2,# , Aida Castellanos1,2 ,
Gina La Sala3 , Mercedes Armand-Ugon1 , Alice Gilbert4 , Chiara Di Pietro3 ,
Adrià Pla-Casillanis1 , Francisco Ciruela5 , Xavier Gasull6 , Virginia Nunes7 ,
Albert Martínez8 , Uwe Schulte9 , Martine Cohen-Salmon4 ,
Daniela Marazziti3 and Raúl Estévez1,2,*,†
1 Departament    de Ciències Fisiològiques, Genes Disease and Therapy Program IDIBELL - Institute of
Neurosciences, Universitat de Barcelona, Barcelona 08036, Spain, 2 Centro de Investigación Biomédica en Red
sobre Enfermedades Raras (CIBERER), Instituto de Salud Carlos III, Madrid 28029, Spain, 3 Institute of
Biochemistry and Cell Biology, Italian National Research Council (CNR), Monterotondo Scalo, Rome I-00015,
Italy, 4 Physiology and Physiopathology of the Gliovascular Unit Research Group, Center for Interdisciplinary
Research in Biology (CIRB), College de France, CNRS Unité Mixte de Recherche 724, INSERM Unité 1050, Labex
Memolife, PSL Research University, Paris F-75005, France, 5 Pharmacology Unit, Department of Pathology and
Experimental Therapeutics, Faculty of Medicine and Health Sciences, Institute of Neurosciences, University of
Barcelona-IDIBELL, L’Hospitalet de Llobregat, Barcelona 08036, Spain, 6 Neurophysiology Laboratory,
Department of Biomedicine, Medical School, Institute of Neurosciences, University of Barcelona-IDIBAPS,
Casanova 143 Barcelona 08036, Spain, 7 Unitat de Genètica, Departament de Ciències Fisiològiques, Universitat
de Barcelona, Laboratori de Genètica Molecular, Genes Disease and Therapy Program IDIBELL, L’Hospitalet de
Llobregat 08036, Spain, 8 Department of Cell Biology, Physiology and Immunology, Faculty of Biology, University
of Barcelona, Barcelona 08028, Spain and 9 Logopharm GmbH, Freiburg 79104, Germany
*To whom correspondence should be addressed at: Facultat de Medicina, Departament de Ciències Fisiològiques, Universitat de Barcelona-IDIBELL,
C/Feixa Llarga s/n 08907 L’Hospitalet de Llobregat, Barcelona 08028, Spain. Tel: +34 934039781; Fax: +34 934024268; Email: restevez@ub.edu

Abstract
Megalencephalic Leukoencephalopathy with subcortical Cysts (MLC) is a type of vacuolating leukodystrophy, which is
mainly caused by mutations in MLC1 or GLIALCAM. The two MLC-causing genes encode for membrane proteins of yet
unknown function that have been linked to the regulation of different chloride channels such as the ClC-2 and VRAC. To
gain insight into the role of MLC proteins, we have determined the brain GlialCAM interacting proteome. The proteome

† Raúl Estévez, http://orcid.org/0000-0003-1579-650X
# These two authors contributed equally to this study
                                                    and share first authorship.
Received: March 31, 2021. Revised: May 31, 2021. Accepted: June 1, 2021
© The Author(s) 2021. Published by Oxford University Press.
This is an Open Access article distributed under the terms of the Creative Commons Attribution Non-Commercial License (http://creativecommons.org/
licenses/by-nc/4.0/), which permits non-commercial re-use, distribution, and reproduction in any medium, provided the original work is properly cited.
For commercial re-use, please contact journals.permissions@oup.com
                                                                                                                                                 1649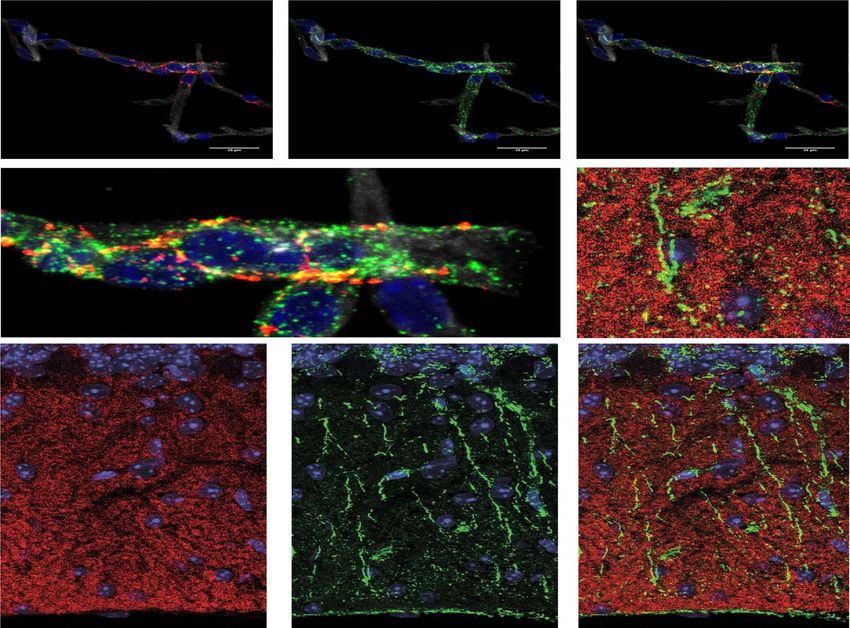
1650      Human Molecular Genetics, 2021, Vol. 30, No. 17

includes different transporters and ion channels known to be involved in the regulation of brain homeostasis, proteins
related to adhesion or signaling as several G protein-coupled receptors (GPCRs), including the orphan GPRC5B and the
proposed prosaposin receptor GPR37L1. Focusing on these two GPCRs, we could validate that they interact directly with MLC
proteins. The inactivation of Gpr37l1 in mice upregulated MLC proteins without altering their localization. Conversely, a
reduction of GPRC5B levels in primary astrocytes downregulated MLC proteins, leading to an impaired activation of ClC-2
and VRAC. The interaction between the GPCRs and MLC1 was dynamically regulated upon changes in the osmolarity or
potassium concentration. We propose that GlialCAM and MLC1 associate with different integral membrane proteins
modulating their functions and acting as a recruitment site for various signaling components as the GPCRs identified here.
We hypothesized that the GlialCAM/MLC1 complex is working as an adhesion molecule coupled to a tetraspanin-like
molecule performing regulatory effects through direct binding or inf luencing signal transduction events.

                                                                     Results

                                                                                                                                          Downloaded from https://academic.oup.com/hmg/article/30/17/1649/6294512 by guest on 12 December 2021
Introduction
                                                                     Identification of the GlialCAM interactome
Megalencephalic Leukoencephalopathy with subcortical Cysts
(MLC) is a rare type of leukodystrophy (1). Patients suffering       For comprehensive identification of the GlialCAM interactome,
from MLC present macrocephaly, subcortical cysts and white           we performed affinity purifications (APs) with four different
matter vacuolation, leading to epilepsy as well as motor and         antibodies specific for GlialCAM on membrane fractions pre-
cognitive impairments (2). MLC is caused by mutations in             pared from whole brains from adult rats, wild-type (WT) mice,
either MLC1 (3) or GLIALCAM (also called HEPACAM) (4). These         and Glialcam knockout (KO) mice (10). Membranes were solubi-
genes encode for membrane proteins that form a complex               lized with the detergent buffer CL-47 plus 1 mm Mg2+ , as earlier
located at cell–cell junctions in brain perivascular astrocytic      experiments indicated that this detergent mixture was able to
processes or in Bergmann glia at the cerebellum (5). A reduced       maintain the interaction of GlialCAM with MLC1 and ClC-2, two
number of patients (2%) do not harbor mutations in MLC1 or           previously validated interactors (4,9). Total eluates of APs with
GLIALCAM, suggesting the existence of other unknown disease          the anti-GlialCAM antibodies or with unspecific immunoglob-
genes (6).                                                           ulins G (IgG) were analyzed by high-resolution nanoflow liquid
    The functional role of the GlialCAM/MLC1 complex is              chromatography-tandem mass spectrometry (LC-MS/MS), which
still unknown. Nevertheless, different proteins and activities       provided data on both the identity and the amount of interacting
related to brain homeostasis are affected in a GlialCAM or           proteins. Two out of the four anti-GlialCAM antibodies purified
MLC1-dependent manner. Therefore, a role for these proteins          their target with high efficiency, allowing for a more detailed
in neuronal ion/water homeostasis has been hypothesized.             analysis of the main target’s primary sequence. MS analyses
For instance, depletion of MLC1 has been shown to reduce             showed that GlialCAM, MLC1 and ClC-2 proteins were retained in
VRAC activity in primary astrocytes (7,8). In addition, GlialCAM     all APs with high efficiency, as reflected by the peak volume (PV)
and MLC1 have been shown to form a ternary complex with              values (see Materials and Methods) and the extensive coverage of
the ClC-2 chloride channel (9). Also, co-expression of human         protein sequences (relative sequence coverage of 72, 53 and 74%,
GlialCAM with ClC-2 changes the channel activity from inwardly       respectively). The other proteins identified by MS were evaluated
rectifying to an ohmic channel (10). Furthermore, the Na+ /K+ -      for both their specifity and consistency of copurification with
ATPase pump has been identified as a MLC1-interacting protein,       the GlialCAM protein based on the quantitative data of pro-
whereas the overexpression of MLC1 was observed to reduce            tein amounts. For each protein, the consistency of enrichment
its activity (11). Finally, Cx43 has been identified as a GlialCAM   was evaluated with the different antibodies and its quantitative
interacting protein (12) and MLC1 might influence Cx43 stability     correlation with the purified GlialCAM protein.
at gap junctions in astrocytoma cells (13).                              Together, these criteria defined a sharp-profiled proteome
    It is not clear how GlialCAM and MLC1 affect the activity of     (Fig. 1A for one GlialCAM antibody and Supplementary Material,
different ion channels and transporters. It has been suggested       Fig. S1 for another GlialCAM antibody), identifying 21 proteins
that they might influence signaling cascades by yet undefined        as high-confidence constituents of the GlialCAM interactome in
mechanisms (14). In this sense, recent work has shown that           the mouse brain. As summarized in (Fig. 1B), these constituents
the overexpression of human MLC1 in astrocytes decreases the         comprise the aforementioned GlialCAM, MLC1 and ClC-2 and
phosphorylation of extracellular signal-regulated kinases (ERK),     previously identified transport/ion channels proteins interacting
whereas primary astrocytes lacking MLC1 show an increase in          with GlialCAM or MLC1. These include the gap junction protein
ERK phosphorylation (15).                                            Cx43 (12,13), the glutamate transporters EAAT1/2 and the sodi-
    In summary, although it is clear that GlialCAM/MLC1 pro-         um/potassium ATPase subunits alpha2 and beta2 (11,18). Other
teins regulate the activity of different ion channels and trans-     proteins that mediate transport or have been related to chloride
porters that play a role in neuronal brain homeostasis, the          channel function such as the bicarbonate transporter (NBCe1),
mechanisms involved in this process remain unclear. Here, we         the glucose transporter (GLUT1), the sodium/calcium exchanger
have determined the GlialCAM interactome from mouse brain            1 (NCX1) or the protein tweety-homolog 1 were also identified.
and analyzed its interaction with GlialCAM and MLC1. Among           In previous APs experiments using MLC1 antibodies, NBCe1 and
the proteins identified as part of this network, we found spe-       tweety-homolog 1 were also specifically co-purified with MLC1
cific G protein-coupled receptors (GPCRs), concretely the orphan     (Fig. 1B).
GPRC5B (16) and the proposed prosaposin receptor GPR37L1 (17),           Apart from transporters and ion channels, we identified pro-
which show a dynamic association with GlialCAM and MLC1              teins related to cell adhesion or trafficking such as tetraspanin-
and regulate their surface levels. Based on the results of this      9 (CD9), Neuronal membrane glycoprotein M6-a/b (GPM6A/B)
work, we propose a functional role for GlialCAM and MLC1             or Syntaxin-1A/1B. Interestingly, CD9 was also identified in a
proteins.                                                            membrane yeast two-hybrid (MYTH) screening using human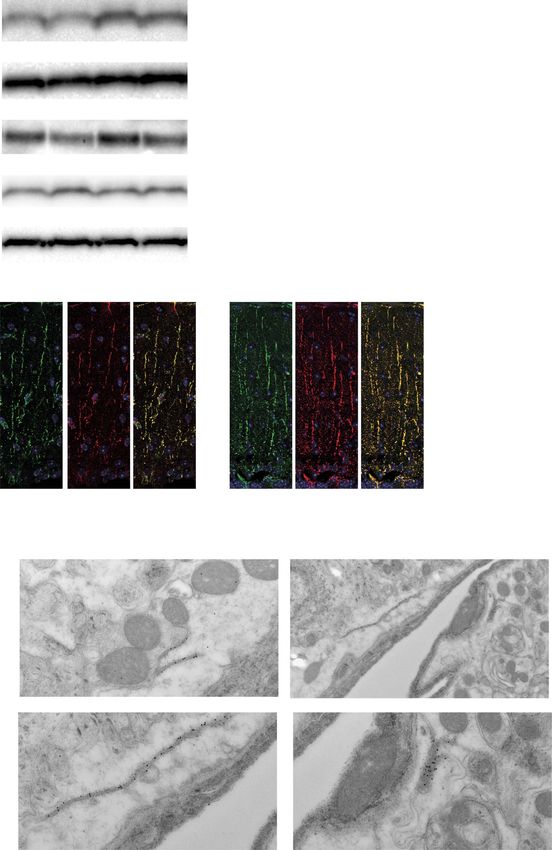
Human Molecular Genetics, 2021, Vol. 30, No. 17        1651

                                                                                    unresolved (14,15). In this regard, we considered the identified
                                                                                    GPCRs as candidates for the signal transduction changes related
                                                                                    to GlialCAM/MLC1 and proceeded to characterize their inter-
                                                                                    action with MLC proteins. As MLC1 is only astrocytic (20), we
                                                                                    focused on GPRC5B and GPR37L1 and not on GPR37, which is
                                                                                    mainly expressed in oligodendrocytes (21).
                                                                                        We developed a polyclonal antibody which was able to
                                                                                    detect specifically GPRC5B by Western blot (Supplemen-
                                                                                    tary Material, Fig. S2A–B) and by immunofluorescence on
                                                                                    primary astrocytes (Supplementary Material, Fig. S2C). The
                                                                                    antibody was validated in siRNA and overexpression experi-
                                                                                    ments. For GPR37L1, we used commercially available antibodies
                                                                                    (see Materials and Methods) previously validated using Gpr37l1
                                                                                    KO animals (22).

                                                                                                                                                           Downloaded from https://academic.oup.com/hmg/article/30/17/1649/6294512 by guest on 12 December 2021
                                                                                        Co-localization was tested and observed between MLC1 and
                                                                                    GPRC5B (Fig. 2A) or GPR37L1 (Fig. 2B) in primary cultures of astro-
                                                                                    cytes. We assessed colocalization with MLC1 and not with Glial-
                                                                                    CAM, as both proteins colocalize perfectly in astrocytes and we
                                                                                    have anti-MLC1 polyclonal and monoclonal antibodies directed
                                                                                    against the same MLC1 intracellular epitopes (23) and therefore,
                                                                                    are suitable for all experiments.
                                                                                        Proximity-ligation assays (PLA) in primary cultures revealed
                                                                                    close proximity between GPRC5B or GPR37L1 and MLC1
                                                                                    (Fig. 2C and D). Control experiments in WT cells without the
                                                                                    primary antibody or in astrocytes obtained from Mlc1 KO
                                                                                    animals (10) demonstrated the specificity of the PLA signal
                                                                                    (Fig. 2C and D).
                                                                                        At a tissular level, we could not detect a specific signal for
                                                                                    GPRC5B with the new antibody or with commercially available
                                                                                    ones. However, in purified gliovascular units (GVUs), a prepara-
                                                                                    tion more accessible to detect astrocytic endfeet proteins (24),
                                                                                    we could detect partial co-localization between GPRC5B and
                                                                                    MLC1 (Fig. 3A). GPR37L1 is mainly expressed in Bergmann glia
                                                                                    (25), where GlialCAM and MLC1 are also expressed. However,
                                                                                    co-localization between GPR37L1 and MLC1 in Bergmann glia
                                                                                    (Fig. 3B) was low. The fact that the co-localization between the
                                                                                    GPCRs and MLC1 was higher in primary cultures could indicate
                                                                                    that the accessibility of the antibodies against the GPCRs might
                                                                                    be limited in brain tissue preparations.
Figure 1. Identification of the GlialCAM interactome. (A) Specificity map of the        The ability of human GPRC5B or GPR37L1 to physically
GlialCAM interactome with one of the rabbit polyclonal anti-GlialCAM antibodies
                                                                                    interact in living cells with human GlialCAM or MLC1 was
used that detects a peptide from the C-terminus. Two-dimensional logarithmic
abundance-ratio plot illustrating the medians of PV ratios (rPV) obtained for any
                                                                                    then assessed in vitro by means of bioluminescence resonance
protein in APs from rat membranes with the second anti-GlialCAM antibody used       energy transfer (BRET) saturation assays. HEK293T cells were
versus IgG (x axis) and in anti-glialCAM APs from mouse membranes of wild-          co-transfected with a constant amount of either the GPRC5B-
type (WT) versus Glialcam KO animals (y axis). Gray bars (rPVs of 10) represent     Rluc or the GPR37L1-Rluc plasmids combined with increasing
the specificity threshold for this AB on either rPV scale and place specifically    concentrations of the MLC1-VFP (Fig. 4A) or GlialCAM-VFP
purified proteins in the upper-right quadrant. Red dots denote finally annotated
                                                                                    (Fig. 4B) plasmids. The interaction between GlialCAM and MLC1
GlialCAM constituents (B); black dots symbolize all other proteins. (B) List of
proteins belonging to the GlialCAM interactome classified according to their
                                                                                    (Fig. 4A) was used as positive control, whereas the lack of
assigned function. We indicate if they have been identified in AP using anti MLC1   interaction between LRRC8A [the main subunit of the VRAC
antibodies and in MYTH screening using human MLC1 as a bait.                        channel (26,27)] and either MLC1 (Fig. 4A) or GlialCAM (Fig. 4B)
                                                                                    was used as a negative control. A positive BRET signal was
                                                                                    detected when GPRC5B or GPR37L1 were co-expressed with
MLC1 as a bait, indicating direct interaction. GPM6A/B were also                    MLC1 (Fig. 4A) or with GlialCAM (Fig. 4B). The determination
identified in MLC1 APs (Fig. 1B).                                                   of the BRET50 signal allowed to compare the strength of
    Finally, three GPCRs were identified as components of the                       interaction between GPR37L1 or GPRC5B with MLC1 versus the
GlialCAM interactome. One of these, the orphan GPRC5B (also                         interaction with GlialCAM. The BRET50 values for the interaction
named RAIG2) was also identified in a MYTH using human MLC1                         of GPR37L1 with MLC1 and GPR37L1 with GlialCAM were 2.9 ±
as a bait and also in APs using MLC1 antibodies. Therefore, it can                  0.9 (n = 5) and 2.6 ± 0.4 (n = 4), respectively, which were not
be considered a bona fide interactor. Interestingly, the two other                  statistically different (P = 0.73). Similarly, the BRET50 values for
identified GPCRs (GPR37 and GPR37l1) belong to the same protein                     the interaction of GPRC5B with MLC1 and GPRC5B with GlialCAM
family (19).                                                                        were 1.2 ± 0.3 (n = 4) and 0.7 ± 0.2 (n = 5), which were also not
                                                                                    statistically different (P = 0.19), indicating that GPCRs interact
Interactions between GPCRs and GlialCAM/MLC1                                        with MLC1 and GlialCAM with similar avidity.
GlialCAM and MLC1 have been related to signal transduction                              These results demonstrated that GPRC5B or GPR37L1 and the
changes, but the mechanisms involved in this process remain                         MLC proteins are in close proximity (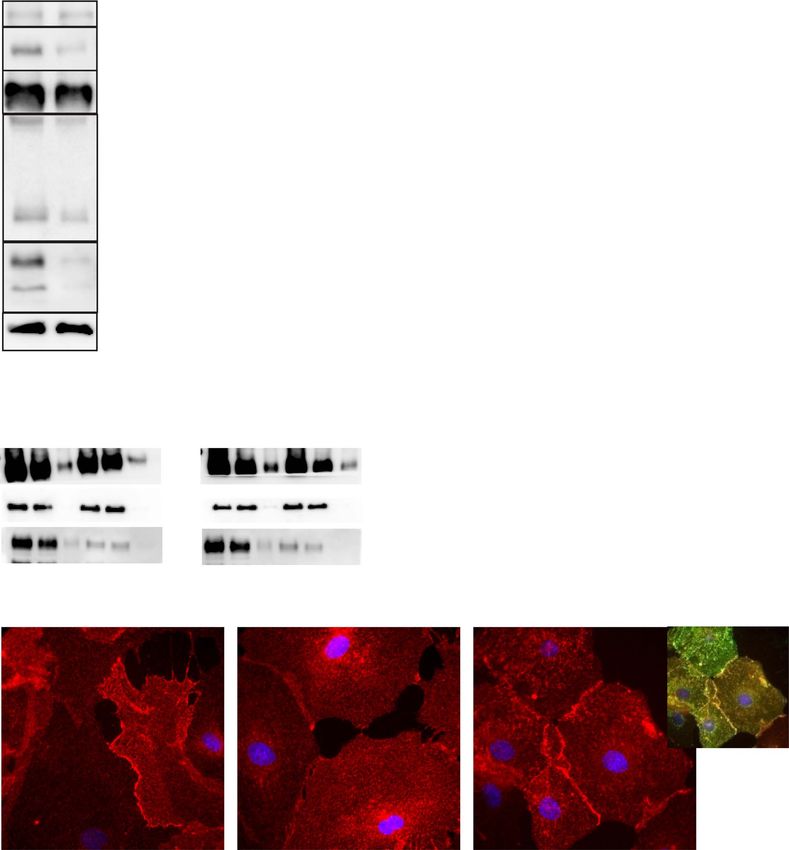
1652 Human Molecular Genetics, 2021, Vol. 30, No. 17
Downloaded from https://academic.oup.com/hmg/article/30/17/1649/6294512 by guest on 12 December 2021
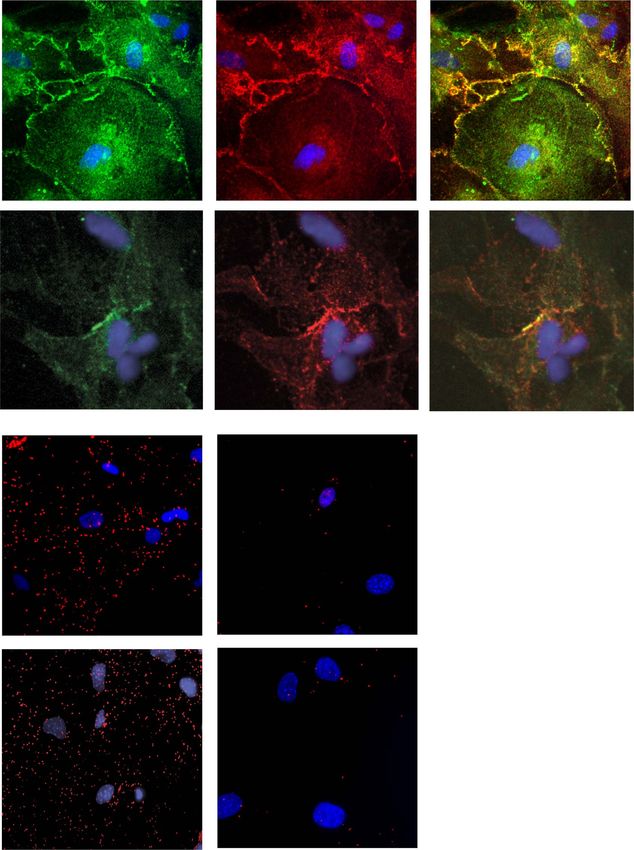
Figure 2. Localization of GPRC5B and GPR37L1 in primary cultures of astrocytes. (A) Representative images of immunostaining of MLC1 in green (left), GPRC5B in red
(middle) and merged stainings where the two proteins show a certain degree of colocalization at the plasma membrane (right, yellow) from cultured mouse astrocytes.
Scale bar, 20 μm (B) Representative confocal images of MLC1 (green), GPR37L1 (red), co-immunofluorescence labeling and DAPI staining (blue) in mouse cerebellar
primary astrocytes from wild-type (WT) pups. Scale bar, 75 μm. (C and D) PLA for protein interactions between MLC1 and GPRC5B (C) or GPR37L1 (D) in WT or Mlc1
KO cultured mouse astrocytes. Cells with only one primary antibody (MLC1 antibody) were used as negative controls. Scale bar, 20 μm. The number of PLA dots was
quantified using Image J. Data are mean ± standard error of the mean of three–four independent experiments. For statistical analyses, we performed a one-way analysis
of variance plus Dunnet multiple comparison’s test versus the negative control. ns, not significant. ∗∗∗ P < 0.001.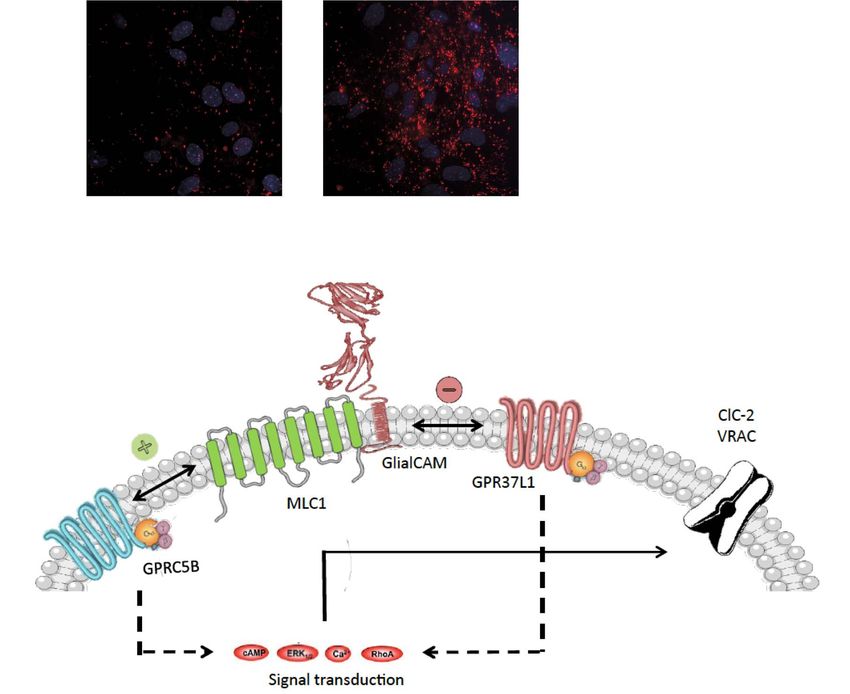
Human Molecular Genetics, 2021, Vol. 30, No. 17                    1653

                                                                                                                                                                              Downloaded from https://academic.oup.com/hmg/article/30/17/1649/6294512 by guest on 12 December 2021
Figure 3. Localization of the identified GPCRs with MLC1 in brain slices. (A) The localization of GPRC5B and MLC1 in GVUs. Projection confocal plan of MLC1 (red) and
GPRC5B (green) immunolabeled GVUs purified from adult wild-type (WT) brain. Nuclei are labeled with Hoechst (blue) and blood vessel wall with Isolectin B4 (white).
Scale bar, 20 μm. (B) The localization of GPR37L1 and MLC1 in Bergmann glia. Representative confocal images of GPR37L1 (red), MLC1 (green) co-immunofluorescence
labeling and DAPI staining (blue), in cerebellar coronal sections of WT adult mice. Higher magnifications of boxed areas (dashed lines) in (A) and (B) are presented. Scale
bar, 20 μm.

our data obtained from slices and cell culture, they support the                        (Fig. 5B). Similarly, the fluorescent signal of MLC proteins was
existence of GPCRs-MLC protein complexes in living cells.                               increased in primary astrocyte cultures from the KO mice (Sup-
                                                                                        plementary Material, Fig. S3B). In contrast, the signal of GPRC5B
                                                                                        in astrocyte cultures from KO animals remained unchanged
Lack of GPR37L1 increases MLC proteins in vivo                                          (Supplementary Material, Fig. S3C).
GPR37L1 is expressed exclusively in astrocytes and immature                                 To determine whether MLC1 subcellular localization was
oligodendrocytes within the brain, also being highly expressed                          altered in Gpr37l1 KO mice as the immunofluorescence stain-
in Bergmann glia of the cerebellum (25). Gpr37l1 KO mice showed                         ing suggested, we detected MLC1 by electron microscopy (EM)
no alteration of adult cerebellar layer cytoanatomy and organi-                         immunogold experiments (Fig. 5C). These experiments showed
zation and no signs of gliosis. At the functional level, animals                        that the localization of MLC1 in Bergmann glia (Fig. 5Ca) or in
presented improved motor functions and advanced cerebellar                              perivascular astrocytic processes was not affected (Fig. 5Cb).
development (22). Based on the similarities of expression pat-                              Similarly, we assessed whether the expression of GPR37L1
terns for GlialCAM, MLC1 and GPR37L1 together with the mild                             and GPRC5B depends on MLC1. Western blot experiments
phenotype of the KO mice, we reasoned that the analysis of                              revealed that the total amount of GPR37L1 and GPRC5B was
MLC proteins in Gpr37l1 KO mice may suggest direct effects of                           the same in the brain and the cerebellum of Mlc1 KO mice
GPR37L1 in MLC protein biology.                                                         (Supplementary Material, Fig. S4A and B). Likewise, there was no
    We first analyzed the consequences of the lack of GPR37L1                           change in the subcellular localization of GPRC5B in the astrocytic
on MLC1 and GlialCAM protein levels. Western blot experiments                           endfeet around blood vessels in Mlc1 KO mice (Supplementary
of cerebellum membranes indicated that both proteins were                               Material, Fig. S4C).
upregulated in the Gpr37l1 KO (Fig. 5A). Because GlialCAM and                               We conclude that the lack of GPR37L1 in mice upregulates
MLC1 stabilize ClC-2 at the plasma membrane (28), we then                               MLC protein levels without altering their localization. Moreover,
measured ClC-2 protein levels. Similarly, ClC-2 protein levels                          no change is observed for GPRC5B protein.
were increased in the KO animals in a significative manner
(Fig. 5A). In contrast, GPRC5B protein levels remained unchanged
                                                                                        Knockdown of GPRC5B in primary astrocytes
(Fig. 5A).
                                                                                        downregulates MLC proteins
    An increased signal was observed in tissue samples from
KO animals when immunofluorescence experiments detecting                                We next studied whether the lack of GPRC5B might influence
MLC1 and GlialCAM at the Bergmann glia were performed. How-                             MLC proteins. GPRC5B has been described to be expressed in
ever, MLC proteins showed a more dotted pattern compared with                           neurons, oligodendrocytes and astrocytes (16). Gprc5b KO mice
WT signal (Fig. 5B). Similar results were observed for ClC-2 (Sup-                      display gliosis and axonal swellings in the cerebellum caused by
plementary Material, Fig. S3A). Quantification of the fluorescent                       increased ROS (29,30). In order to avoid any secondary effect of
signal revealed increased amounts of MLC1 in Gpr37l1 KO mice                            the loss of GPRC5B, experiments addressing the cellular effects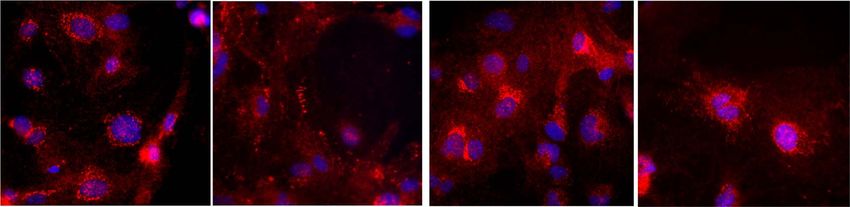
1654       Human Molecular Genetics, 2021, Vol. 30, No. 17

                                                                                                                                                                      Downloaded from https://academic.oup.com/hmg/article/30/17/1649/6294512 by guest on 12 December 2021
Figure 4. Direct interaction of the human GPCRs with human GlialCAM or human MLC1 by bioluminescence resonance energy transfer (BRET) assays. Representative
BRET saturation curve between GPCRs and MLC1 (A) or GlialCAM (B) from 3 to 5 independent experiments. HEK293T cells were co-expressing a constant amount of
GPRC5b-Rluc or GPR37L1-Rluc in presence of increasing concentrations of MLC1-VFP or GlialCAM-VFP. The interaction between GlialCAM-Rluc and MLC1-VFP were
analyzed as positive control, and with human LRRC8A as negative control. Plotted on the x axis is the fluorescence value obtained from the VFP, normalized with the
luminescence value of the Rluc constructs 10 min after coelenterazine h incubation and the y axis the corresponding BRET ratio (x1000). mBU: mBRET units. Results
are expressed as mean ± standard error of mean.

of GPRC5B ablation on MLC proteins were therefore performed                         and thus, it may influence the activity of different chloride
on primary cultured astrocytes. For this purpose, we developed                      channels that have been linked to the presence of Glial-
adenoviral vectors expressing a shRNA against mouse Gprc5b (sh                      CAM and MLC1 in depolarizing (ClC-2) or hypotonic (VRAC)
Gprc5b) that were able to nearly deplete GPRC5B levels (Supple-                     conditions.
mentary Material, Figs S2B and C, and 6A). An adenoviral vector                          In agreement with this hypothesis, the ablation of GPRC5B
expressing a scrambled shRNA was used as control.                                   almost completely abolished the localization of ClC-2 at cell–cell
    In GPRC5B-depleted astrocytes, MLC1 and ClC-2 total protein                     junctions in depolarizing conditions, with a drastic reduction
levels were significantly reduced. In contrast, GlialCAM and                        from 47 ± 2 to 7 ± 3 (n = 3 experiments, 108 cells counted,
LRRC8A protein levels were not altered (Fig. 6A). Because                           ∗∗∗ P < 0.001) in GPRC5B depleted samples (Fig. 7A). Further-

our results have shown that GPRC5B interacts directly with                          more, whole cell patch-clamp experiments in rat astrocytes
MLC1 and GlialCAM, we reasoned that GPRC5B ablation                                 demonstrated that GPRC5B knockdown decreased ClC-2 current
could influence GlialCAM plasma membrane levels in the                              activation and prevented its change in rectification observed
absence of MLC1. GPRC5B depletion reduced GlialCAM levels                           in depolarizing conditions (Fig. 7B and C), as observed in the
at the plasma membrane in Mlc1 KO astrocytes (Fig. 6B).                             measurements of the normalized current (Fig. 7C and D) and
Immunofluorescence experiments indicated that GlialCAM                              the rectification index (Fig. 7E), respectively. Previous studies
was internalized in Mlc1 KO astrocytes depleted of GPRC5B                           using VRAC and ClC-2 inhibitors together with shRNA directed
(Fig. 6C), suggesting that GPRC5B may stabilize GlialCAM at                         against ClC-2 demonstrated that the chloride currents observed
the plasma membrane. In these GPRC5B-depleted astrocytes,                           in depolarizing conditions are mediated by ClC-2 associated with
complementation with an adenovector expressing human                                GlialCAM and MLC1 (23).
MLC1 rescued GlialCAM localization at the plasma membrane                                Next, we measured VRAC activation by hypotonicity in
(Fig. 6C), in agreement with previous studies that indicated                        GPRC5B-depleted astrocytes (Fig. 7F–H). Reduction of GPRC5B
that MLC1 also stabilizes GlialCAM (31). Hence, GPRC5B might                        expression led to a dramatic reduction of VRAC current
stabilize both MLC1 and GlialCAM at the plasma membrane                             measured in hypotonic conditions (Fig. 7F–H).
Human Molecular Genetics, 2021, Vol. 30, No. 17 1655
Downloaded from https://academic.oup.com/hmg/article/30/17/1649/6294512 by guest on 12 December 2021
Figure 5. Expression and localization of MLC proteins in Gpr37l1 KO mice. (A) Representative Western blot analysis and densitometric quantification in whole cerebellar
extracts from wild-type (WT) and Gpr37l1 KO adult mice. Data are expressed in arbitrary units (rel.int.: relative intensity) as a ratio to the mean values obtained from
WT mice (unpaired t-test; ∗ P < 0.035; ∗∗ P < 0.007, n = 6, 7). (B) Representative confocal images of MLC1 (green), GlialCAM (red) co-immunofluorescence labeling and
DAPI staining (blue) in cerebellar sections of WT and adult mice (left). Scale bar, 20 μm. The quantification of MLC1 immunostaining intensity (right). Data are expressed
in arbitrary units as a ratio to the mean values obtained from WT mice (unpaired t-test; ∗∗ P < 0.0070; n = 3). (C) At EM level, MLC1 post-embedding staining in Gpr37l1
KO showed immunoreactivity in the astrocyte–astrocyte junctions of protoplasmic (a) and perivascular (b) astroglial processes. AC, astrocyte; BV, blood vessel. Higher
magnifications of boxed areas (dashed lines) in (b) are presented. Scale bar, a: 0.25 μm; b: 0.5 μm.1656 Human Molecular Genetics, 2021, Vol. 30, No. 17
Downloaded from https://academic.oup.com/hmg/article/30/17/1649/6294512 by guest on 12 December 2021
Figure 6. Characterization of GPRC5B depleted primary astrocytes. (A) Total protein levels of MLC1, GlialCAM, ClC-2 and LRRC8A were assessed by Western blot (left) in
extracts obtained from arrested astrocytes control or infected with shRNA against Gprc5b. β-actin was used as a loading control, and GPRC5B was detected to validate
the effect of the shRNA. The result shown is representative of four independent experiments. The quantification of these different experiments (right) revealed a
decrease in protein levels in the case of ClC-2 and MLC1. ∗ P < 0.05 in the Student t-test of shRNA versus control. (B) Surface levels of GlialCAM in GPRC5B depleted
primary astrocytes from wild-type or Mlc1 KO mice were assessed by biotinylation and subsequent Western blot of the solubilized extract (sol), the supernantant of
the purification (SN) and the purification (P). Quantification of the biotynilated fraction (P) revealed a decrease in GlialCAM membrane protein levels only in Mlc1 KO
astrocytes. ∗ P < 0.05 in the Student t-test of shRNA versus control. Calnexin was detected as a non-plasma membrane (ER) resident protein. (C) The misslocalization of
GlialCAM in GPRC5B depleted astrocytes from Mlc1 KO mice is corrected by complementation with human MLC1 overexpressing adenovirus (right). Scale bar: 20 μm.
ns, not significant.Human Molecular Genetics, 2021, Vol. 30, No. 17 1657
Downloaded from https://academic.oup.com/hmg/article/30/17/1649/6294512 by guest on 12 December 2021
Figure 7. Lack of GPRC5B affects ClC-2 and VRAC activation in depolarizing and hypotonic conditions. (A) Immunostainings of ClC-2 in Control or GPRC5B depleted
astrocytes treated with physiological or depolarizing solutions. GPRC5B depleted astrocytes showed a markedly reduced ClC-2 trafficking to cell–cell junctions in
depolarizing conditions (arrows). ∗∗∗ P < 0.001 in one-way analysis of variance plus Dunnet multiple comparisons’ test versus the depolarizing control. (B–E) Reduced
activation in depolarizing conditions of the ClC-2 chloride channel in GPRC5B depleted astrocytes. (B) Representative whole-cell recordings from control and GPRC5B-
depleted rat astrocytes showing ClC-2 currents evoked by voltage pulses (from −120 to +50 mV) in both physiological and depolarizing conditions. The protocol applied
is depicted on the right. (C–E) Current-voltage relationships show the previously described increase in ClC-2 currents when astrocytes are treated with a depolarizing
solution and a change in the rectification index. In GPRC5B-depleted astrocytes, however, this increase in the current amplitude is much smaller and no changes in
the rectification index can be observed. Quantification of the current measured at −120 mV in both control and GPRC5B-depleted astrocytes can be seen in (D) and
changes in the rectification index are depicted in (E). Whole-cell currents shown in (C) and (D) are normalized by cell capacitance. ∗ P < 0.05, ∗∗ P < 0.01. The number
of experiments is Control phys = 20, Control depolarizing = 14, sh Gprc5b phys = 9, shGprc5b = 11. (F–H). (F) Representative whole-cell recordings from control and
GPRC5B-depleted rat astrocytes showing VRAC currents evoked by voltage pulses (from −80 to +80 mV) before and after 5 min of hypotonic stimulation. The protocol
applied is depicted in the middle. (G and H) Current-voltage relationships showed that current activation upon hypotonicity was not statistically significant in GPRC5B-
depleted astrocytes and VRAC currents from these cells were much smaller when compared with those of control astrocytes. Quantification of the current measured
at +80 mV can be seen in (H). Whole-cell currents shown in (G) and (H) are normalized by cell capacitance. ns, not significant, ∗ P < 0.05, ∗∗ P < 0.01. The number of
experiments is Control = 12, sh Gprc5b = 8.1658 Human Molecular Genetics, 2021, Vol. 30, No. 17
Downloaded from https://academic.oup.com/hmg/article/30/17/1649/6294512 by guest on 12 December 2021
Figure 8. Depolarization and hypotonicity dynamically modulate the interactions between MLC1 and GPCRs. (A) The interaction of MLC1 and the GPCRs in depolarizing
conditions. Astrocytes were treated with physiological or depolarizing solutions for 4 h, and then PLA between MLC1 and GPRC5B (left) or GPR37L1 (right) was assessed.
The number of PLA positive dots was normalized by the negative control and quantified using Image J. Data are mean ± standard error of the mean of three-four
independent experiments. ∗P < 0.05 in the Student t-test of depolarizing versus physiological conditions. (B) The interaction between GPRC5B and MLC1 protein
measured by PLA increased by hypotonicity. Wild-type (WT) or Mlc1 KO mouse cultured astrocytes were treated with physiological or hypotonic solution for 15 min,
and then PLA assay between GPRC5B and MLC1 was performed. Assays were performed with mouse monoclonal anti-MLC1 and rabbit polyclonal anti-GPRC5B. Mlc1
KO mouse astrocytes were used as negative control. Data analyses were from three independent experiments and were corrected subtracting the signal of the negative
control. ∗∗ P < 0.001 in two-tailed Student t-test. (C) Model of the interplay between MLC proteins and two of the GPCRs identified in the GlialCAM interactome. In this
model, GlialCAM and MLC1 are negatively and positively regulated by GPR37L1 and GPRC5B, respectively. The interaction between the GPCRs and MLC proteins might
activate signal transduction cascades previously linked to Mlc1 or these GPCRs (such as cAMP, ERK1/2, Calcium or RhoA), which will regulate different transporters and
channels, as illustrated by the effects seen in this work over the ClC-2 and the VRAC chloride channels.Human Molecular Genetics, 2021, Vol. 30, No. 17 1659
Depolarization and hipotonicity modulates parallel transport of chloride to maintain electroneutrality (39).
GPCRs-MLC1 protein interaction In this case, it has been suggested that chloride might enter
astrocytes through ClC-2 chloride channels in association with
The above results suggested that the lack of GPR37L1 increases
GlialCAM/MLC1 proteins (10). Within other proteins belonging
MLC proteins levels, whereas the opposite was observed for the
to the same group of transporter/ion channels, it is interesting
lack of GPRC5B. This suggests that these GPCRs may interact
to mention the sodium-driven bicarbonate transporter (NBCe1).
with MLC proteins in a dynamic manner. Previous studies
Astrocytes contribute to the reacidification or basification of the
indicated that the interaction between GlialCAM/MLC1 and ClC-
extracellular media during neuronal activity, partly through the
2 in primary cultured astrocytes was dynamically regulated,
activation of NBCe1 (40).
and it was observed on depolarizing conditions (23).
The results presented here suggest that GlialCAM/MLC1 form
Then, we compared the interaction between GPRC5B or
a protein scaffold for different transporters and ion channels
GPR37L1 with MLC1 in physiological versus depolarizing
involved in neuronal homeostasis. Previous work has shown that
conditions in primary astrocyte cultures. PLA indicated that
GlialCAM is able to target ClC-2 to glial junctions and modify
the interaction between MLC1 and GPRC5B was increased
its gating properties (9). It remains unknown if GlialCAM is also
Downloaded from https://academic.oup.com/hmg/article/30/17/1649/6294512 by guest on 12 December 2021
in depolarizing conditions whereas the interaction between
able to modify the functional properties and the localization of
GPR37L1 and MLC1 was decreased (Fig. 8A). Therefore, these
the identified proteins. Hence, MLC disease could be caused by
experiments suggested that in depolarizing conditions GPRC5B
impaired activity of some of the proteins found in the GlialCAM
might be needed for signal transduction responses in a
interactome.
GlialCAM/MLC1-dependent manner.
On the other hand, GlialCAM and MLC1 have been shown to
Subsequently, we assessed whether the interaction between
influence intracellular signaling pathways controlling astrocyte
MLC1 and GPRC5B also varies in hypotonic conditions perform-
activation and proliferation. Several proteins have been identi-
ing PLA. We observed that the interaction between both proteins
fied related to cell signaling within this proteome, such as three
increased under hypotonic conditions (Fig. 8B).
different GPCRs (GPR37, GPR37L1 and GPRC5B), a tetraspanin
(CD9) (41) and the four transmembrane domain proteins Gly-
coprotein M6A and M6B (42,43). Considering the role played by
Discussion GPCRs, we hypothesize that some of the signaling pathways
GlialCAM and MLC1 are two membrane proteins linked to a involving MLC proteins might be caused by the activity of these
human genetic disease (MLC) and whose biological functions are GPCRs.
poorly understood. Previous studies suggested that they might Within the identified GPCRs, GPR37 and GPR37L1 are part of
have a role in astrocyte ion/water homeostasis by influencing the rhodopsin (Class A) family, specifically within the endothelin
different ion channels and transporters. In this respect, a direct B receptor-like peptide family (44–47). Both GPCRs are highly
interaction after astrocyte despolarization has been observed expressed in the central nervous system. GPR37 is mainly
with the chloride channel ClC-2 and it has also been shown expressed in oligodendrocytes, whereas GPR37L1 is mainly
to influence VRAC chloride channels and regulatory volume expressed in astrocytes with higher levels in the Bergmann
decrease after astrocyte osmotic swelling in an indirect man- glia of the cerebellum. Studies with KO mice have shown that
ner. In addition, it has been shown that the overexpression of GPR37 regulates negatively oligodendrocyte differentiation and
MLC1 downregulates intracellular signaling pathways control- myelination (21), and that GPR37L1 participates in regulating
ling astrocyte activation and proliferation. In order to get more the development of neuronal and glial cells in the cerebellum
insights into the biological role of GlialCAM and MLC1, we have (22). Several groups have proposed that prosaposin and derived
identified GlialCAM-interacting proteins and their association prosaptides could bind to these GPCRs and activate them, but
with MLC1 by means of immunoprecipitation and MYTH exper- in vitro studies with induced expression of both proteins have
iments. Our results revealed that GlialCAM forms a network of so far failed to conclusively prove that these are the cognate
∼20 proteins. ligands (17,19,48–50). It has been indicated that GPR37 and
Within this proteome there are different proteins, some of GPR37L1 are coupled to Gα i/o , which will inhibit adenylate
them previously identified (such as ClC-2, Cx43 or Na+ /K+ - cyclase. Thus, the lack of these GPCRs results in increased cAMP
ATPase), which are related to ion or substrate transport and are levels and Epac-dependent activation of MAPK cascade, which
involved in the homeostasis of the extracellular media during leads to an increase in phospho-ERK1/2 (21,51). In this sense,
neuronal activity. Neuronal activity in the central nervous sys- Mlc1 KO cells also show an increase in ERK phosphorylation
tem leads to an increase of potassium in the extracellular space and its expression is also linked to astrocyte differentiation.
(32). This increase is rapidly buffered by neighboring astrocytes GPRC5B belongs to the family C group IV (metabotropic gluta-
through different molecular mechanisms, including the activity mate receptor-like receptor) of GPCRs (16). GPRC5B is expressed
of pumps, transporters and ion channels. One of the most impor- ubiquitously, particularly in the brain, mostly in the cerebellum,
tant processes contributing to potassium clearance is its uptake adipose tissue and placenta (29). It is subcellularly localized at
by astrocytes mediated by the Na+ /K+ -ATPase (33). Moreover, the plasma membrane, Golgi and exosomes (52). GPRC5B has
the ATPase is activated by intracellular increases in sodium, as been implicated in neuronal cell-fate determination, cerebellar
occurs in astrocytes during neuronal activity because sodium- motor learning, obesity and inflammation (53–56). There is not
coupled glutamate transporters, mainly EAAT2 (or GLT-1) and a known ligand neither a G protein coupled for GPRC5B, but
EAAT1 (or GLAST), remove neurotransmitters from the extracel- it seems to recruit the Src-family kinase Fyn through the SH2
lular media. Potassium may also enter into astrocytes through domain during its activation, and the activity of Fyn regulates
potassium channels, mainly Kir4.1 (34). Potassium would diffuse inflammatory responses via NF-kB signaling (53,57). Considering
to neighboring astrocytes through gap junctions [composed by MLC, it has been found that in astrocytoma, the overexpression
connexins 30 and 43 (Cx30 and Cx43)] (35,36) in a process that has of MLC1 inhibit the activation of IL-1β-induced inflammatory
been defined as spatial buffering (37,38). In addition, potassium signals (pERK, pNF-kB) that, conversely, were abnormally upreg-
can be accumulated inside astrocytes, which is balanced by a ulated in Mlc1 KO astrocytes (58).1660 Human Molecular Genetics, 2021, Vol. 30, No. 17
Thus, considering previous data and the present work, we the Multisite Gateway System (Invitrogen). The integrity of all
suggest that these GPCRs could participate in the signaling cloned constructs was confirmed by DNA sequencing.
role previously assigned to GlialCAM and MLC1 (Fig. 8C). First,
we have observed that the lack of GPR37L1 upregulates Glial-
CAM and MLC1 whereas the lack of GPRC5B downregulates
Animal procedures
it, influencing ClC-2 and VRAC activity. As GPRC5B interacts The generation of Glialcam−/− and Mlc1−/− mice has been
more with MLC1 in depolarizing and hypotonic conditions, the previously described (10). Gpr37l1−/− mice has also been
activity of GPRC5B might be important in metabolic processes previously characterized (22). For histological analyses of brains,
related to changes in the ionic composition. In contrast, we mice were perfused with 4% PFA/PBS and organs were postfixed
hypothesize that signaling through GPR37L1 might be related to overnight. Mouse astrocyte cultures were performed from P0
differentiation processes. Although future research is needed to to P2 mouse pups of the corresponding genotype as previously
understand how GlialCAM and MLC1 modulate GPCR-associated described (31).
signaling processes, taking into account that they interact in
vitro, it is possible that they might regulate the activation of the
Downloaded from https://academic.oup.com/hmg/article/30/17/1649/6294512 by guest on 12 December 2021
GPCRs through lateral interactions.
Membrane preparation
Although the exact role played by GlialCAM and MLC1 is still Fresh-frozen brains from mouse WT and Glialcam KO were
unknown, this work has revealed that the role played by MLC1 is homogenized with a glass potter in sucrose buffer (320 mm
very similar to the work performed by tetraspanins. Tetraspanins sucrose, 10 mm Tris, 2 mm MgCl2 , 1 mm EGTA, protease inhibitors
are transmembrane proteins that span the plasma membrane (5×), pH 7.5; ca. 10 ml/g tissue) and centrifuged for 5 min at
four times and that associate with other tetraspanins by homo- 1080 × g. The supernatant (SN) was collected and the procedure
and heterooligomerization (59). It has been described in many was repeated with the pellet using a third of the sucrose buffer
cases that they form a tight complex with a single-pass trans- volume. Both supernatants were combined and ultracentrifuged
membrane protein belonging to the immunoglobulin (Ig) super- (10 min at 200,000 ×g) to collect the crude membrane pellet.
family (60). For instance, the tetraspanin CD81 is associated with The crude membrane pellet was resuspended in hypotonic
CD19 (61) or the tetraspanin CD9 with EWI-2 (62). Moreover, these buffer (50 mm Tris/HCl pH 7.5) and allowed to lyse for 30 min
molecules can simultaneously associate laterally at the plasma on ice (with gentle stirring). The membrane lysate was then
membrane with numerous integral membrane receptors, mod- separated on a sucrose step gradient (10 ml 1.3 M sucrose and
ulating their functions and organizing discrete, dynamic plasma 10 ml 0.5 M sucrose, each in 10 mm Tris–HCl/1 mm Mg2+ /pH
membrane compartments (63). Within these partners, there are 7.5) for 1 h at 200,000 × g. The interface band was collected,
GPCRs (64) or other cytoplasmatic signaling mediators (65). They diluted 3-fold with 20 mm Tris–HCl/1 mm Mg2+ /pH 7.5 and
might also regulate the trafficking and biosynthetic processing pelleted by ultracentrifugation. The pellets were resuspended
of these partners (66). Considering MLC1, although the sequence in a small volume of 10 mm Tris–HCl/1 mm Mg2+ /pH 7.5 and
homology to tetraspanins is very low (∼20%), it passes the mem- the protein concentration was determined by the Bradford
brane eight times, but biochemical studies indicate that each method.
four transmembrane domains can be considered as a duplicate
(6). As tetraspanins, MLC1 also oligomerizes with himself and
forms a tight complex with GlialCAM, a single-pass transmem-
Solubilization and AP
brane domain of the Ig family (4). Here, we have also identified AP was carried out with CL47 supplemented with 1 mm Mg2+ .
the tetraspanin CD9 as a protein forming part of the GlialCAM In addition to mouse WT and Glialcam KO membranes, a rat
interactome and a direct interactor of MLC1. As tetraspanins, brain membrane preparation was used. For each purification
MLC1 influence the trafficking of diferent partners, as it has been experiment, 20 μg of immobilized antibody were incubated with
shown for ClC-2 (9) or Cx43 (12). Finally, here we have shown that 2 mg membrane solubilized with 1.6 ml CL47 (+1 mm Mg2+ and
GlialCAM and MLC1 might be interacting with different GPCRs in 4× protease inhibitors added). Solubilization was carried out at
a dynamic manner. Therefore, we propose that MLC1 biological a protein-detergent ratio of 1:8, incubated for 20 min on ice and
role is that of being a tetraspanin-like molecule. Final proof of cleared by ultracentrifugation at 56,000 rpm/12 min (rotor Sorvall
this hypothesis might need the determination of a 3D structure S80-AT3; corresponding to a 200 S cutoff for solubilized particles).
of the GlialCAM/MLC1 complex. After 2 h of incubation with the solubilisate antibodies were
Understanding the interrelationship between GlialCAM/MLC1 washed with CL47 dilution buffer 1 mm Mg2+ (2 × 1 ml for 5 min)
and the GPCRs found here could be crucial not only to the and eluted with 2 × 7 μl non-reducing Lämmli buffer (100 mm
development of therapies for MLC patients but also to unravel DTT added later).
the mechanisms conducted by astrocytes to control neuronal
homeostasis. In this sense, analyses of the posttranslational
modifications of the interactome proteins identified here in MLC
MS sample preparation and LC-MS/MS analysis
mice models as in the Glialcam KO, could provide novel insights The eluates from APs were shortly run on 10% SDS-PAGE gels
into regulatory mechanisms. It would be interesting to analyze and silver-stained. Lanes were excised and split into two parts (>
if the minor percentage of MLC patients without mutations in andHuman Molecular Genetics, 2021, Vol. 30, No. 17 1661
spectrometer (Thermo Scientific)]. Full spectra (with precursor did not include target KO controls, specificity could not be evalu-
signals used for quantification) were acquired with a target ated with the same degree of stringency. Rather high thresholds
value of 500 000 and a nominal resolution of 60 000 (scan range (factor 20–60) for purification rPVs versus IgG were therefore
370–1700 m/z). applied.
Up to five data-dependent collision-induced dissociation
(CID) fragment spectra per scan cycle were acquired in the
ion trap with a target value of 10 000 with dynamic exclusion,
MYTH screenings
preview mode for full precursor scans, charge state screening, A MYTH screening was performed with the biotech Dualsys-
monoisotopic precursor selection and rejection charge state 1 tems, using the bait vector pBT3-Ste containing human MLC1.
enabled. Activation type was CID with default settings. A second screening was performed using the human brain
LC-MS/MS data were extracted and searched against the DUALmembrane cDNA library in the NubG-x orientation as
UniProt Knowledgebase (mouse, rat, human and release 2013-09) described (69).
using the Mascot search engine (version 2.3.01; Matrix Science)
together with anti-GlialCAM AP datasets from a previous round
Downloaded from https://academic.oup.com/hmg/article/30/17/1649/6294512 by guest on 12 December 2021
of experiments. For preliminary searches peptide mass tolerance
Cell culture and transfection
was set to 15 ppm. After linear shift mass recalibration the Human embryonic kidney HEK-293T cells were grown at 37◦ C
window was narrowed to ± 5 ppm for final searches. Fragment in an atmosphere of 5% CO2 in Dulbecco’s modified Eagle’s
mass tolerance was set to 0.8 Da. One missed trypsin cleavage medium (Sigma-Aldrich, St. Louis, MO, USA) supplemented with
and common variable modifications were accepted for peptide 1 mm sodium pyruvate, 2 mm L-glutamine, 100 U/mL strepto-
identification. Proteins identified by only one specific MS/MS mycin, 100 mg/mL penicillin and 5% (v/v) fetal bovine serum.
spectrum or representing exogenous contaminations such as The cells were seeded into six-well plates containing poly-D-
keratins or Igs were eliminated. lysine-coated glass coverslips at ∼300 000 cells/well. Cells were
transiently transfected with the corresponding cDNA constructs
using TransfectinTM (Bio-Rad, Hercules CA, USA) and following
Analysis of GlialCAM and MLC1 interaction partners
the manufacturer’s instructions.
The set of GlialCAM-APs (total of 14) was quantitatively evalu-
ated together with an AP data set from an older experiment (pre-
vious study, 4 samples). A label-free evaluation pipeline similar
Immunological procedures
to (67) was used. Briefly, m/z features among LC-MS scans were For immunofluorescence staining, primary cells and tissue sec-
detected and their intensitied integrated (as intensity × reten- tions were fixed and processed as previously described (20,70).
tion time × m/z width = PV) using MaxQuant (Cox and Mann The polyclonal rabbit antibodies used were the following: anti-
2008, version 1.3). m/z-corrected features were then aligned GlialCAM (1:100) (4), anti-MLC1 (1:100) (71), anti-ClC-2 (1:100) (9),
between different LC-MS/MS runs and assigned to the peptides anti-LRRC8A (1:100) (A304-175-A, Bethyl antibodies) (15) and the
identified by Mascot using a home-written software tool with antibody developed in this work anti-GPRC5B against the peptide
mass tolerance set to 1.5 ppm and a time shift window of 1 min. (C)TIPTAPPSHTGRHHW, using the services provided by Eurogen-
The resulting assignment showed an even distribution with very tec. We also used a mouse monoclonal antibody that was devel-
high m/z precision and no obvious systematic error (symmetric, oped against the mouse peptide sequence of the N terminus
no offsets from 0 in either dimension). of MLC1 (TREGQFREELGYDRM) (23) and a mouse monoclonal
Based on the accurately assigned PVs, protein abundance specific for GPR37L1 (1:50 in mouse primary astrocytes, 1:100 in
ratios (rPV) in purifications from WT versus control (IgG or mouse tissue sections, Mab Technologies, Cat. N. scB12). GPR37L1
Glialcam KO) were determined using the TopCorr method (68). and MLC1 co-immunostaining was performed in mouse primary
Protein-specific peptide PVs were ranked across the evaluated astrocytes from Gpr37l1 WT and KO pups (51), after fixation with
datasets by their consistency using pair-wise linear correlation 100% methanol at -20◦ C for 20 min, permeabilizing with 0.1%
analysis (Pearson correlation). A maximum of six to a minimum Triton X-100 and incubating for 1 h at room temperature in
of two peptide PVs were then selected from the best correlating blocking buffer containing 0.5% BSA, 0.3 M glycine (Merck, Cat#
PVs to calculate the abundance ratio as median of the respec- 104201) and 0.1% Tween-20.
tive peptide PV ratios (referred to as rPV). To ensure validity, For electron immunogold experiments, small samples of
sequenced peptides with missed PV assignment were omitted Gpr37l1 cerebellum KO mice tissue were obtained and fixed
and a minimum of two peptide ratios with total assigned PVs of in 4% paraformaldehyde and 0.1% glutaraldehyde in 0.12 m
80 000 units were required; if no PV could be assigned to a peptide phosphate buffer, and processed. They were cryoprotected
in the AP controls, the detection limit of the spectrometer (3000 gradually in sucrose and cryofixed by immersion in liquid
PV units with the settings used here) was inserted as a mini- propane. Freeze substitution was performed at −90◦ C during
mum estimate. Distributions of protein rPV values were plotted 3 days in an Automatic Freeze Substitution System (AFS,
for each sample pair to derive specificity thresholds. Proteins Leica); methanol containing 0.5% uranylacetate was used as
were considered specifically co-purified when rPV (vs IgG) > a substitution medium. Infiltration was carried out in Lowicryl
threshold (IgG) in both, rat and mouse, and no cross-reactivity HM20 at −50◦ C and then polymerized with UV light. Ultrathin
was indicated by rPV(vs KO) < threshold (vs KO). For each pro- sections were collected, and when needed, processed for post
tein, the consistency of enrichment was evaluated with the embedding immunostaining. For immunostaining, grids were
different antibodies as well as its quantitative correlation with incubated with rabbit anti-MLC1 (1:10) or antisera. The binding
the purified target GlialCAM_Mouse [based on abundancenorm of the primary antibody was visualized by incubating with a
values, (68)]. secondary antibody conjugated to 18 nm gold particles (British
Finally, the LC-MS/MS data from previous Mlc1 AP experi- BioCell, International).
ments were reprocessed and evaluated according to the same In the western blot studies, astrocyte lysates and cerebellar
improved procedures as described above. Because these datasets extracts were prepared and processed as previously described1662 Human Molecular Genetics, 2021, Vol. 30, No. 17
(20,72). The mouse GPR37L1 protein was detected with a goat presence of the mitotic inhibitor AraC for biochemical studies.
polyclonal antibody (1:500, Santa Cruz, Cat. N. sc-164532). β-actin Dibutyryl-cAMP (dBcAMP) differentiated rat astrocytes obtained
or α-tubulin proteins were used as a loading control. as described elsewhere (73), were used for electrophysiological
To detect surface levels of GlialCAM, WT or Mlc1 KO mouse measurements, because they express higher levels of ClC-
astrocytes were cultured in 6 cm plates. They were washed 3 2 currents and are easier to patch. Immunofluorescence
times with PBS-CM (PBS with 1 mm CaCl2 and 1 mm MgCl2 ). Sub- experiments were performed on both types of cultures, with
sequently, the astrocytes were incubated on ice for 30 min in PBS- similar results. The physiological solution was: (in mm) NaCl
CM containing 2 mg/ml EZ-LinkTM Sulfo-NHS-Biotin (Thermo 122, KCl 3.3, MgSO4 0.4, CaCl2 1.3, KH2 PO4 1.2, HEPES 25, Glucose
Scientific). After three washes with PBS-CM, they were quenched 10 and it had pH 7.4. The osmolarity was 290–300 mOsm and was
for 10 min in PBS Ca/Mg containing 10 mm Lysine. After three adjusted with manitol using a vapor-pressure osmometer (Model
additional washes with PBS-CM, the cells were lysed in RIPA 3320, Advanced Instruments). In the hypoosmolar solution
buffer (50 mm Tris pH 8, 150 mm NaCl, 1% NP-40, 0.5% deoxy- the osmolarity was adjusted to 180 mOsm/kg. Adenovirus
cholate, 0.1% SDS, 2 mm EDTA) containing protease inhibitors, for expressing HA-tagged MLC1, and the transduction of astrocytes
1 h. After centrifugation for 15 min at 14 000 rpm, the lysate was has been described previously (4). RNAi entry-clone (Gateway,
Downloaded from https://academic.oup.com/hmg/article/30/17/1649/6294512 by guest on 12 December 2021
quantified using the BCA protein assay (Thermo Fisher). Then Invitrogen) vectors were prepared using the Block-it PolII
2 mg of the solubilized extract in a total volume of 200 μl was miR RNAi EmGFP or the Block-it PolII miR RNAi expression
incubated with 100 μl of streptavidin agarose (Thermo Fisher) vector kit following the manufacturer’s instructions. Entry
O/N at 4◦ C. After a brief centrifugation, the SN was taken and clones were recombined using LR clonase into the vector
the beads were washed three times with RIPA buffer. Biotinylated pAdVDEST-CMV/V5. Adenoviruses were produced and titrated
proteins were eluted with LSB 1× for 15 min at 60◦ C. Samples of using fluorescence microscopy detecting EmGFP, which is
lysate, SN and eluate were analyzed by western blot. To confirm expressed together with the shRNA, or detecting the viral protein
that only membrane proteins were detected in the eluate, we Ad-Hexon. The sequence of the oligo used to knock down
performed a western blot with antibodies to test for the protein mouse GPRC5B expression was: shRNA Gprc5b (shRNA111): 5
calnexin resident in the endoplasmic reticulum. TGGACTGGACCTTCTTCCTCA 3 .
GVUs purification Proximity-ligation assays
GVUs were isolated from whole WT OF1 brains as previously Mouse cultured astrocytes seeded on 24 well coverslips were
described (24). A selective filtration was performed to enrich treated with physiological, depolarizing (60 mm K+ ) or hypo-
vessels of 20 to 100 am diameter (24). For immunostaining, tonic solutions and then were fixed with PFA 3%. Cells were
GVUs were plated on a glass slide coated with Cell Tak (Corn- blocked with PBS1x/0.1% Triton X-100/10% FBS for 2 h, and then
ing, Corning, NY, USA) and fixed in PBS/PFA 4% for 15 min at incubated with the primary antibodies (Mouse monoclonal or
room temperature. GVUs were immersed in the blocking solu- Rabbit anti-MLC1 antibody 1:100; Rabbit polyclonal anti-GPRC5B
tion (PBS/NGS 5%/Triton X-100 0.5%) for 1 h at room temperature antibody 1:100, Mouse monoclonal anti-GPR37L1 1:100) diluted
and incubated with primary antibodies and Isolectin GS-B4 (IB4) in blocking solution for 1 h. After 3 washes of 10 min with
diluted in the blocking solution 12 h at 4◦ C. After 3 PBS washes, blocking solution, cells were incubated with the anti-rabbit PLA
slices or GVUs were incubated 2 h at room temperature with (+) and the anti-mouse PLA (−) probes (Sigma) diluted 1/5 in
secondary antibodies, rinsed in PBS and finally embedded in blocking solution for 1 h in a 37◦ C humid chamber. Cells were
Fluormount G. GVUs were analyzed using a 63X objective on a washed twice with washing buffer A (Sigma) during 5 min. To
confocal microscope. ligate the PLA probes, cells were incubated in ligation buffer
diluted 1/5 in water containing the ligase diluted 1/40 for 1 h in
a 37◦ C humid chamber. After 2 washes with washing buffer A of
Quantification of immunofluorescence and western
2 min, the amplification reaction was performed in ampli RED
blot labeling
buffer diluted 1/5 in water containing the polymerase diluted
Quantitative analysis of immunofluorescence signals was per- 1/80 for 100 min in a 37◦ C humid chamber. Cells were washed
formed with the Imaris 5.0.2 software (Bitplane). Experiments twice with washing buffer B during 10 min, followed by an
were carried out with tissue samples obtained from three mice additional wash with washing buffer B diluted at 0.01% during 1
per genotype. Sections of similar size in similar regions were min. Finally, coverslips were mounted in DUOLINK DAPI medium
chosen and analyzed. All measurements were performed with and images were acquired using a CellR olympus microscope.
the observer blind to the identity of the slides. To quantify the PLA signal, images were analyzed using
Quantification of western blot immunoreactive bands ImageJ (74). First, nuclei were identified and substracted. Then,
was performed with the Chemidoc XRS+ imager and Image images were transformed to 8 bit and converted to binary
Lab software (Bio-Rad). Experiments were carried out with images using the threshold setup. The number of dots/particles
tissue extracts obtained from six to seven mice per genotype. corresponding to the PLA signal was quantified using the
The intensity of each band was normalized to the intensity of analyse particle command of the ImageJ submenu, considering
the corresponding α-tubulin band. The average values of each that the size (2∧ ) of the particles should be bigger than 5. For
experimental group were expressed in arbitrary units, as a ratio each image, we determined the number of dots divided by the
to the mean values obtained from the WT groups. number of nuclei.
Primary astrocyte culture, adenoviral transduction and BRET experiments
RNA interference HEK293T cells were transfected with a constant amount of
Rat primary quiescent astrocyte cultures were prepared as GPRC5B-Rluc (200 ng), GPR37L1-Rluc, GlialCAM-Rluc or LRRC8A-
described previously (20) and maintained in culture in the Rluc and increasing amounts of MLC1-VFP or GlialCAM-VFP.You can also read


