A case study on the impact of severe convective storms on the water vapor mixing ratio in the lower mid-latitude stratosphere observed in 2019 ...
←
→
Page content transcription
If your browser does not render page correctly, please read the page content below

Research article
Atmos. Chem. Phys., 22, 1059–1079, 2022
https://doi.org/10.5194/acp-22-1059-2022
© Author(s) 2022. This work is distributed under
the Creative Commons Attribution 4.0 License.

       A case study on the impact of severe convective storms
       on the water vapor mixing ratio in the lower mid-latitude
             stratosphere observed in 2019 over Europe
       Dina Khordakova1 , Christian Rolf1 , Jens-Uwe Grooß1 , Rolf Müller1 , Paul Konopka1 , Andreas Wieser2 ,
                                      Martina Krämer1 , and Martin Riese1
              1 Institute   of Energy and Climate Research (IEK-7), Forschungszentrum Jülich, Jülich, Germany
             2 Department      Troposphere Research (IMK-TRO), Institute of Meteorology and Climate Research,
                                      Karlsruhe Institute of Technology, Karlsruhe, Germany
                                     Correspondence: Christian Rolf (c.rolf@fz-juelich.de)

                                Received: 1 September 2021 – Discussion started: 17 September 2021
                       Revised: 29 November 2021 – Accepted: 1 December 2021 – Published: 21 January 2022

      Abstract. Extreme convective events in the troposphere not only have immediate impacts on the surface, but
      they can also influence the dynamics and composition of the lower stratosphere (LS). One major impact is
      the moistening of the LS by overshooting convection. This effect plays a crucial role in climate feedback, as
      small changes of water vapor in the upper troposphere and lower stratosphere (UTLS) have a large impact
      on the radiative budget of the atmosphere. In this case study, we investigate water vapor injections into the
      LS by two consecutive convective events in the European mid-latitudes within the framework of the MOSES
      (Modular Observation Solutions for Earth Systems) measurement campaign during the early summer of 2019.
      Using balloon-borne instruments, measurements of convective water vapor injection into the stratosphere were
      performed. Such measurements with a high vertical resolution are rare. The magnitude of the stratospheric water
      vapor reached up to 12.1 ppmv (parts per million by volume), with an estimated background value of 5 ppmv.
      Hence, the water vapor enhancement reported here is of the same order of magnitude as earlier reports of water
      vapor injection by convective overshooting over North America. However, the overshooting took place in the
      extratropical stratosphere over Europe and has a stronger impact on long-term water vapor mixing ratios in the
      stratosphere compared to the monsoon-influenced region in North America. At the altitude of the measured
      injection, a sharp drop in a local ozone enhancement peak makes the observed composition of air very unique
      with high ozone up to 650 ppbv (parts per billion by volume) and high water vapor up to 12.1 ppmv. ERA-Interim
      does not show any signal of the convective overshoot, the water vapor values measured by the Microwave Limb
      Sounder (MLS) in the LS are lower than the in situ observations, and the ERA5 overestimated water vapor
      mixing ratios. Backward trajectories of the measured injected air masses reveal that the moistening of the LS
      took place several hours before the balloon launch. This is in good agreement with the reanalyses, which shows
      a strong change in the structure of isotherms and a sudden and short-lived increase in potential vorticity at the
      altitude and location of the trajectory. Similarly, satellite data show low cloud-top brightness temperatures during
      the overshooting event, which indicates an elevated cloud top height.

Published by Copernicus Publications on behalf of the European Geosciences Union.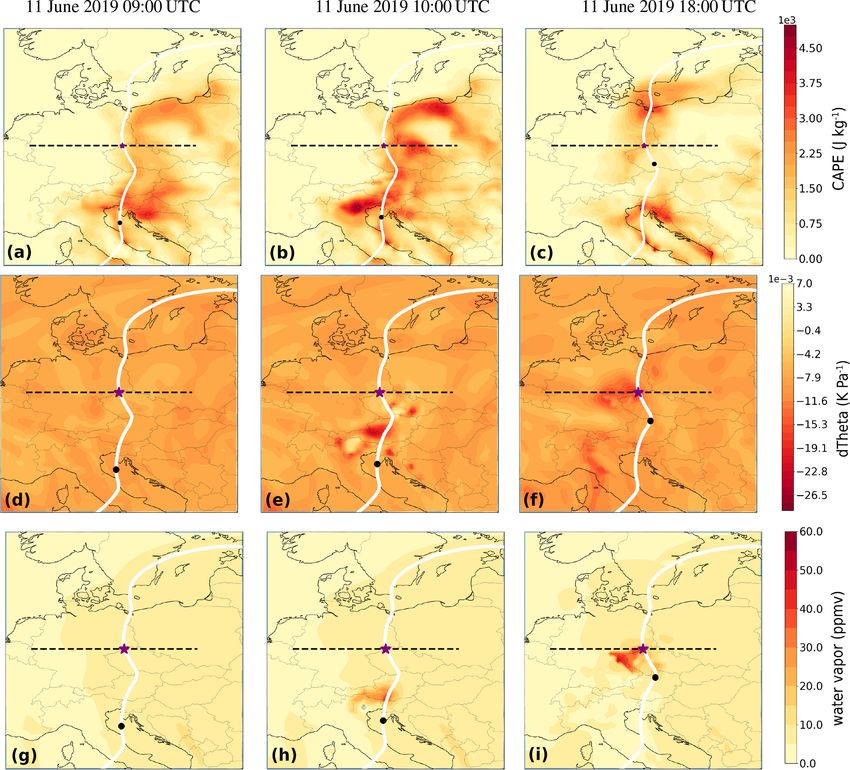
1060                                              D. Khordakova et al.: A case study of mid-latitude overshooting convection

1   Introduction                                                  tial increase of overshooting convection with global warming
                                                                  is still under discussion (Jensen et al., 2020).
                                                                     It was shown in a previous work that deep convective
Extreme weather events tend to not only have immediate            events can penetrate the tropopause and have a significant
consequences on nature and the built environment but also         impact on the water vapor concentration in the lower strato-
greater long-term impacts on climate and ecosystems. Such         sphere (Smith et al., 2017). Jensen et al. (2020) showed
extreme events include long-lasting drought phases, extreme       that the primary region for direct convective hydration of
precipitation, heat and cold waves (periods of extremely          the extratropics is located over North America. These di-
warm or extremely cold air or sea surface temperature), as        rect injections over the North American continent (NA) have
well as unusually strong hurricanes and storms. Events that       been evaluated in several case studies (Weinstock et al.,
have previously been considered extreme and rare are be-          2007; Homeyer and Kumjian, 2015; Homeyer et al., 2017;
coming increasingly frequent and have the tendency to be-         Smith et al., 2017), and the long-term behavior was ana-
come the new routine (Walsh et al., 2020). Extreme con-           lyzed. Phoenix and Homeyer (2021) simulated two kinds
vective events in the troposphere also have an influence on       of convection, namely one representing springtime convec-
the lower stratosphere (LS). One of the impacts on the LS         tive events and one representing convective events typical for
is the in-mixing of tropospheric air masses by overshooting       summertime. The study shows that simulations representing
convection and the coherent transport of moisture into the        the springtime convective event lead to an increase of about
dry lower stratosphere. Stratospheric water vapor is deter-       20 % in the average water vapor mixing ratio in the UTLS,
mined by the entry mixing ratio of H2 O at the tropopause         while the summertime simulation lead to lower increase. Fis-
and a chemical contribution by the oxidation of CH4 to H2 O       cher et al. (2003) show data displaying the troposphere to
(Randel et al., 1998; Rohs et al., 2006). Through the analy-      stratosphere transport of tropospheric tracers caused by con-
sis of multiple data sets, the water vapor background value       vective storms over Italy, and Hegglin et al. (2004) analyze a
in the LS is found to be ≈ 5 ppmv (parts per million by vol-      case study of the injection of tropospheric air into the LS by
ume; Pan et al., 2000; Hegglin et al., 2009); any stronger en-    a large convective system over the Mediterranean area.
hancements of water vapor in the LS are likely caused by             In our case study, we investigate the transport of water va-
the in-mixing of tropospheric air masses (Smith et al., 2017;     por into the extratropical lower stratosphere injected by deep
Wang, 2003). Stratospheric water vapor influences the cli-        convective events over Europe, using observations within
mate and the chemistry of the atmosphere and plays a signif-      the MOSES (Modular Observations Solutions of Earth Sys-
icant role in the positive feedback of global climate warming     tems) measurement campaign. MOSES aims to investigate
(Smith et al., 2017; Dessler et al., 2013). The feedback effect   extreme weather events across the Earth compartments in or-
of water vapor in the stratosphere is about 0.24 W m−2 for        der to understand the short- and long-term influences of such
each 1 ppmv increase, assuming an equal distribution glob-        events (Weber and Schuetze, 2019). In situ measurements
ally (Solomon et al., 2010; Forster and Shine, 1999). Even        were made during early summer in 2019 at a mid-latitude site
small changes in the water vapor mixing ratio in the upper        in the eastern part of Germany. Balloon-borne light-weight
troposphere and lower stratosphere (UTLS) result in large         instruments recorded water vapor, ozone, temperature, and
radiative effects (Solomon et al., 2010; Riese et al., 2012).     pressure immediately before and after a thunderstorm with
However, the magnitude of the impact of stratospheric wa-         strong convection that passed the measurement site. Such ob-
ter vapor, when a coupled global model is used, is still under    servations can be rarely made due to the short-term forecast
discussion. Huang et al. (2020) and Wang and Huang (2020)         of convective events. In total, two cases of overshooting con-
show that the radiative effect of stratospheric water vapor is    vection on 2 consecutive days (10 and 11 June 2019) are dis-
balanced by a decrease in high clouds and an increase in the      cussed in this study. Both cases show that significant amounts
upper tropospheric temperature. A moistening of the lower-        of water vapor can be transported into the lower stratosphere
most stratosphere also has an impact on the chemistry of this     by deep convective events over Central Europe and not just
region. Stratospheric water vapor is a source of HOx radicals     in the North American and Asian monsoon regions. We show
which catalytically destroy ozone and enhance the reactiv-        that water vapor mixing ratios of the same order of magni-
ity of stratospheric sulfate aerosol particles. Anderson et al.   tude as the data recorded over NA can also be found deep
(2012) have hypothesized that the moistening of the lower-        in the extratropics over Central Europe. Using back trajec-
most stratosphere by convective overshooting can lead to se-      tories together with ERA5 reanalysis and Microwave Limb
vere ozone depletion in summer in the mid-latitudes through       Sounder (MLS) data, we analyze the entry point of the tro-
heterogeneous chlorine activation. However, in a detailed         pospheric air masses transported into the stratosphere.
analysis of the relevant chemical processes, Robrecht et al.         Section 2 introduces the instruments and methods used,
(2019, 2021) conclude that convective moistening only has         while Sect. 3.1, 3.2, and 3.3 describe the two events and the
a minor impact on stratospheric ozone and the mid-latitude        results of the balloon profile measurements. In Sect. 3.4, the
ozone column. The contribution of overshooting convection         data are compared to ERA5 reanalysis, while in Sect. 3.5,
to the moisture budget of the lower stratosphere and a poten-     using backward trajectories and satellite data, the time and

Atmos. Chem. Phys., 22, 1059–1079, 2022                                            https://doi.org/10.5194/acp-22-1059-2022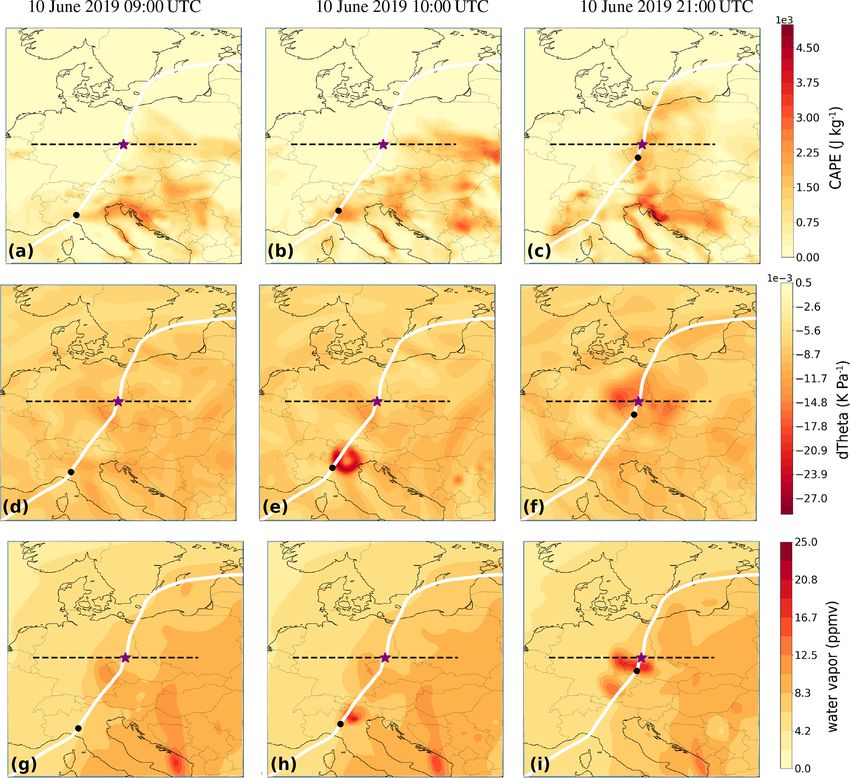
D. Khordakova et al.: A case study of mid-latitude overshooting convection                                                      1061

location of the origin is discussed. In Sect. 4, the results are
discussed, while Sect. 5 concludes the outcome of the study.

2     Data and method

2.1    Balloon measurements within MOSES

In this study, we analyze data collected during a MOSES
measurement campaign in 2019. The campaign took place
from the middle of May to the end of July as part of a col-
laboration of eight Helmholtz Association research centers.
The objective of the measurement campaign was to capture
extreme hydrological events throughout the following differ-
ent Earth compartments: atmosphere, ground, and running
waters. In the Eastern Ore Mountains in Germany, close to
the city of Dresden, a 3-month measurement campaign, with
intense operational phases (IOPs), was performed. During           Figure 1. Schematic of the measurement strategy. A balloon is
these IOPs, the teams operated on demand to capture the            launched right before and immediately after a deep convective event
development and cycle of convective events. Our main mea-          has passed the measurement site. On the right-hand side, the ap-
surement site was located adjacent to the village of Börnchen      proximate ozone (blue) and temperature (yellow) climatological
in the low mountain range at 50.80◦ N and 13.80◦ E. The            profiles are shown. The amount of water vapor transported into the
team from Forschungzentrum Jülich (FZJ) focused on small-          stratosphere is investigated by the difference between the two pro-
scale deep convective events and their impact on the strato-       files above the lapse rate tropopause, according to the WMO (World
sphere. During the campaign period, two of these events oc-        Meteorological Organization) definition.
curred and were observed with balloon-borne measurements.
Figure 1 schematically shows the measurement procedure.
As a convective cell was approaching the measurement site,         as 4 % in the troposphere and below 10 % in the stratosphere.
two weather balloons were launched to measure the state of         The payload also contained a Compact Optical Backscatter
the atmosphere. The first balloon was launched just before         Aerosol Detector (COBALD) to measure backscatter from
the convective cell reached the measurement site; the second       different types of particles during nighttime (Brabec et al.,
balloon was launched immediately after the storm cell passed       2012). This is referred to as a large payload in the following.
the measurement site and as soon as the rain stopped.              However, the measurements taken by the COBALD instru-
   There were two kinds of measurement balloons used. The          ment were not used for the analysis presented here. A picture
first version is a 200 g latex balloon equipped with a Vaisala     of the entire payload with the radiosonde, ECC, CFH, and
radiosonde RS41-SGP, which recorded the location of the            COBALD is shown in Fig. A1. The payload is adapted from
balloon and the altitude, pressure, temperature, and mois-         the setup used by the GRUAN (Global Climate Observing
ture of the atmosphere and transmitted the data to the ground      System (GCOS) Reference Upper-Air Network) setup (Dirk-
station at the measurement site. The temperature sensor of         sen et al., 2014). A more detailed description of the instru-
the radiosonde has an uncertainty of 0.3 K below 16 km and         ments can be found in Appendix A.
0.4 K above. The uncertainty of the humidity sensor is given          Figure 2 displays all available water vapor profiles (18 pro-
as 3 %, and the pressure sensor has an uncertainty of 1.0 hPa      files available) measured in the mid-latitudes by the authors
at ambient pressure above 100 hPa, 0.3 hPa between 10 and          with the RS41 and the CFH as a reference instrument be-
100 hPa, and 0.04 hPa below 10 hPa. Survo et al. (2014) re-        tween 2018 and 2020 (see Appendix A2). When considering
port a temperature dependency of the humidity sensor un-           data up to 20 km, the correlation of the RS41 and CFH data
certainty which does not exceed 3 % RH at temperatures be-         is 0.975, and no general bias is visible. However, the data
low −80 ◦ C and RH below 30 %. The second version is a             spread around the 1-to-1 line in Fig. 2 reveals some time dif-
1500 g balloon also equipped with a payload carrying mul-          ferences of up to around 100 % in the altitude range of the
tiple in situ instruments. An ECC (electrochemical concen-         UTLS (< 20 km), mainly due to the slower time response
tration cell) instrument (Smit et al., 2007) was used to mea-      under cold conditions. But, for the purposes of this analysis,
sure ozone mixing ratios with an uncertainty of ≈ 5 % below        the absolute accuracy of the RS41 sensor is less important
20 km (Smit et al., 2007; Thompson et al., 2019; Tarasick          than its sensitivity to detecting abrupt changes with a magni-
et al., 2021), and a CFH (cryogenic frost point hygrometer;        tude far greater than its measurement uncertainty. The devia-
Vömel et al., 2007) was used to measure the low water vapor        tion between both instruments increases above ≈ 20 km, and
concentration prevailing in the tropopause region and in the       the correlation of the data is reduced to 0.45 for data points
stratosphere. The uncertainty of the CFH instrument is given       measured between 20 and 30 km. In the mid-stratosphere, the

https://doi.org/10.5194/acp-22-1059-2022                                           Atmos. Chem. Phys., 22, 1059–1079, 2022

1062                                               D. Khordakova et al.: A case study of mid-latitude overshooting convection

                                                                    are retrieved from the 118 GHz band, water vapor from the
                                                                    190 GHz band, and ozone and CO from the 240 GHz band
                                                                    (Schoeberl et al., 2006; Waters et al., 2006). In this work,
                                                                    data from the version 4 retrieval algorithm were used to ob-
                                                                    tain the data presented. In this study, we show ozone, water
                                                                    vapor, and CO mixing ratios. MLS version 4 data are pro-
                                                                    vided on 36 different pressure levels, ranging from 316 to
                                                                    0.002 hPa, as described in Livesey et al. (2017), and the data
                                                                    quality is described in Pumphrey et al. (2011). One of the
                                                                    main improvements of version 4 is the improved cloud de-
                                                                    tection, which excluding cloudy radiances causing corrupted
                                                                    profiles. This improvement increases the quality of our data
                                                                    set, as our area of interest is covered with clouds.

                                                                    2.3   ECMWF ERA5
                                                                    The European Centre for Medium-Range Weather Forecasts
                                                                    (ECMWF) produces numerical weather forecasts and pro-
                                                                    vides a meteorological data archive. In this study, we use
                                                                    ERA5, which is a global reanalysis, covering the period from
                                                                    1979 until present (Hersbach et al., 2020). The spatial resolu-
Figure 2. Correlation of water vapor mixing ratios measured si-
                                                                    tion is about 30 km and contains 137 vertical levels from the
multaneously by RS41 and the CFH. The color code represents the
                                                                    surface to an altitude of 80 km. In this work, ERA5 reanal-
altitude of the measurement. All data measured by the authors be-
tween 2018 and 2020 are used.                                       ysis data from May to June 2019 were used with an hourly
                                                                    temporal resolution. The reanalysis data set was interpolated
                                                                    to isentropic levels and potential vorticity (PV) was added to
low humidity in combination with low pressure does not al-          the individual isentropic levels (Ertel, 1942). In the North-
low reliable measurements to be conducted with the RS41.            ern Hemisphere, PV values above 2 PVU are typical for the
Therefore, these astonishingly good results offer reliability       stratosphere, while values below 2 PVU are typical for the
when using accurate RS41 humidity measurements up to a              troposphere, where 1 PVU = 1 × 10⁻⁶ km2 kg−1 s−1 (Kunz
height of 20 km, and these are used in this study in the case       et al., 2011). Additionally, we calculated the vertical gradient
of flights that were performed without the CFH instrument.          of potential temperature, which is part of the PV definition,
   During the first event, on 10 June 2019, we launched one         and defined as follows:
radiosonde and one large payload, while only five radioson-                                ∂θ
des were used during the second event, on 11 June 2019,             PV = −g · (ζ + f ) ·      ,                                 (1)
                                                                                           ∂p
due to logistical reasons. In most cases, the balloons reached
far into the stratosphere, reaching altitudes of up to 22 km        where g is the gravitational acceleration, ζ is the relative
with radiosondes only and up to 35 km with larger balloons,         isentropic vorticity, f is the Coriolis parameter, θ is the po-
which were equipped with the abovementioned instruments             tential temperature, and p is the pressure. The vertical gra-
and captured the entire UTLS region during ascent and de-           dient of potential temperature is ∂p∂θ
                                                                                                           and is hereafter referred
scent. During the first balloon launch of the first convective      to as dTheta. dTheta is negative by definition, as with de-
event, the connection to the radiosonde was lost for about          creasing pressure, the potential temperature increases in a
20 min, and the data between 11 and 18 km altitude were lost        stable atmosphere. In the troposphere, potential temperature
during the ascent, but all other sounding data were complete.       shows only a slight increase and can, thus, be considered as
                                                                    a constant relative to the steep increase that occurs above the
2.2    Aura Microwave Limb Sounder (MLS)                            tropopause.

The Microwave Limb Sounder is an instrument operating
                                                                    2.4   Trajectory calculation
on board the Aura satellite. The Sun-synchronous polar or-
bit satellite has an inclination of 98◦ and an Equator crossing     In order to calculate backward and forward trajectories of
time of 13:45 UTC ±15 min. It was launched on 15 July 2004          the measured air masses the trajectory module of the three-
and has been operating ever since. The measurements are             dimensional chemistry transport model CLaMS (Chemical
in limb-viewing geometry on the A-train orbit and are in            Lagrangian Model of the Stratosphere; McKenna et al.,
the spectral range of thermal emission; thus, day- and night-       2002) was used. The trajectories were initialized at pres-
time measurements are available. Temperature and pressure           sure levels between 135 and 175 hPa in steps of 5 hPa, which

Atmos. Chem. Phys., 22, 1059–1079, 2022                                              https://doi.org/10.5194/acp-22-1059-2022
D. Khordakova et al.: A case study of mid-latitude overshooting convection                                                      1063

encompasses the pressure level of the maximum water va-            veloped over the German–Czech border, starting at around
por enhancement measured for both cases using the same             15:00 UTC. All of these convective cells increased spatially
method as described in Rolf et al. (2018). Each trajectory         throughout the day and unified to an MCS covering the en-
was calculated for both 100 h backward and 100 h forward           tirety of eastern Germany. At around 17:39 UTC, a first cell
in time. The trajectory calculation with CLaMS is based on         developed between Dresden and Bautzen. Hail with parti-
the ERA5 horizontal wind fields and diabatic heating rates         cles reaching a diameter of up to 4 cm was observed. This
with an hourly output. In addition, temperature, pressure,         event, subsequently referred to as case 2, was captured only
PV, water vapor, and ozone mixing ratios, as well as con-          with radiosondes that were launched every 3 h, starting from
vective available potential energy (CAPE), are interpolated        13:00 UTC, until midnight when the last radiosonde was
from ERA5 onto the coordinate of the trajectories.                 launched after the storm had passed the measurement site.

3     Measurement results and analysis                             3.2   Water vapor injection captured by balloon profiles

3.1    Meteorological situation at the time of the case
                                                                   The measurement results of cases 1 and 2 can be seen in
       study
                                                                   Figs. 3 and 4. The measurements before and after the re-
                                                                   spective extreme convective event (hereinafter referred to as
From 10 to 12 June 2019, multiple severe convective storms         “the event”) are displayed with ascending and descending
developed over Germany. During these events, hail with a           profiles, where available. The UTLS intercept is shown with
diameter of up to 6 cm was observed, and heavy rain with           pressure levels between 240 and 90 hPa and potential tem-
a daily amount of 100 mm was measured. Wilhelm et al.              peratures ranging between 320 and 420 K. A sharp transi-
(2020) describe this series of convective storms in detail. In     tion from the characteristics of tropospheric to stratospheric
our study, we define the events that precede the measure-          air masses is clearly discernible in all figures. The lapse rate
ments taken on the evening of 10 June 2019 as case 1 and           tropopause (LRT), as defined by the World Meteorological
the ones preceding the measurements taken in the evening of        Organization (WMO), is at a pressure level of 203 hPa be-
11 June 2019 as case 2. The storm of case 1 passed the mea-        fore and at 196 hPa after the convective event for case 1 (see
surement site at approximately 20:00 UTC on 10 June 2019.          Fig. 3) and at 194 hPa before and at 200 hPa pressure level af-
On the previous day, a low pressure system with warm and           ter the event for case 2 (see Fig. 4). In all cases, the cold point
humid air was brought to Central Europe, while a strong            tropopause (CPT) is slightly (4–20 hPa) above the LRT. For
wind shear caused by a lee depression was located over the         case 1, the sharp transition from the troposphere to the strato-
Czech Republic. A first convective storm developed in the          sphere is discernible by a distinct change in the course of the
northeastern part of Italy and progressed westwards until it       temperature. Additionally, an abrupt increase in ozone and a
started dissipating at around 08:00 UTC over the northwest-        decrease in the water vapor mixing ratio towards the strato-
ern part of Italy. Later in the day, in combination with strong    spheric background level below 5 ppmv show the difference
solar radiation, these storm precursors caused the first signif-   between the two regimes. Between pressure levels of 180 and
icant convective cell over Memmingen (southern Germany)            162.5 hPa, which correspond to potential temperature levels
at around 16:00 UTC. This cell developed into a supercell          of 345 and 357.5 K, the water vapor mixing ratio fluctuates
and caused severe damage in northern Munich at around              between 5 and 7.4 ppmv and between 6 ppmv and 14.5 ppmv,
17:45 UTC. Multiple supercells subsequently formed, com-           as measured by the radiosonde and the CFH, respectively,
bined over eastern Germany, and later moved towards Poland         before it attains the stratospheric background value of ≈ 4–
and the Baltic Sea. The formation of supercells passed the         5 ppmv, which is reached within all case 1 profiles below
measurement site in the Eastern Ore Mountains, and balloon         the 160 hPa or 360 K level. A background value of ≈ 5 ppmv
profiles were taken before and after the storm cell passed.        agrees well with results of previous studies (Pan et al., 2000).
The first balloon was launched at approximately 18:00 UTC          The ascent profile measured after the event shows a strong
(hereinafter referred to as “profile before”) and equipped         increase in water vapor measured by the radiosonde and by
only with a radiosonde. The second balloon launch, with a          the CFH above the level of 155 hPa or 365 K. The maximum
large balloon payload, took place at 01:00 UTC on the next         value measured by the RS41 is 7.0 (± 10 %) ppmv, and the
day, shortly after the thunderstorm passed.                        maximum value measured by the CFH is 8.6 (± 6 %) ppmv.
   On 11 June 2019, the already warm and humid air mass            The lagging response time of the RS41 may explain most of
was heated up to 33 ◦ C at ground level in the afternoon.          the difference between the CFH and the radiosonde obser-
At 12:00 UTC, a first convective cell developed over the           vations as described in Appendix A3. Above the water vapor
Slovenian–Austrian border and further developed over the           enhancement, at 143 hPa or 375 K, the mixing ratio decreases
next 7 h to a mesoscale convective system (MCS) cover-             rapidly again to the background value below 5 ppmv. This
ing almost all of Austria and Slovenia. With an offset of          peak is only apparent in the ascending profile of the mea-
approximately 1 h, another convective cell emerged over            surement. The descending profile shows no peak signatures
the center of northern Italy, and multiple smaller cells de-       in either the CFH or in the RS41 water vapor measurements.

https://doi.org/10.5194/acp-22-1059-2022                                           Atmos. Chem. Phys., 22, 1059–1079, 2022
1064                                              D. Khordakova et al.: A case study of mid-latitude overshooting convection

As the horizontal distance between the location during as-         tion, a second peak is discernible with water vapor mixing
cent and descent at this altitude is only 60 km and about 2 h      ratios of 12.1 ppmv (± 10 %) at 143 hPa or 371 K. As multi-
(00:59/02:49 UTC) time difference, the enhancement in the          ple balloon launches were performed throughout the day, an
water vapor mixing ratio is a localized feature. In Fig. 3a and    increase in background water vapor mixing ratios with pro-
b, the vertical extent of the discussed water vapor peak is        gressing launch time is evident. Balloon profiles launched at
framed with a gray background.                                     19:00 and 22:00 UTC show a slight water vapor enhancement
   A striking peak in the ozone profile is evident at a similar    up to 5.5 ppmv (± 10 %), which is at the same level as the
level to the peak in water vapor. With a lower edge at 162 hPa     main peak measured in the ascending profile after the event.
or 359 K and an upper edge at 145 hPa or 373 K, the ozone          The descending profile also shows an increase in the water
peak starts at a lower level compared to the water vapor en-       vapor mixing ratio at the same pressure altitude as the as-
hancement but is limited by the same upper edge. This ozone        cending profile. However, this peak is wider and only about
peak is not associated with the overshooting event, and the        half the amplitude. Similar to case 1, the temperature mea-
cause is discussed in Sect. 3.3. Within this peak, a steep de-     sured during ascent shows a sharp decrease of 2 K at the
crease in the ozone mixing ratio occurs very sharply at the        potential temperature level of the highest water vapor mix-
same potential temperature level as the sudden appearance          ing ratio value of the peak. In case 2, the water vapor peak
of the water vapor peak, which becomes especially evident          is more spiked compared to the rectangular profile visible in
in Fig. 4b. This is a major indicator of the in-mixing of tro-     case 1 (shown in Fig. 3a and b). It is of further interest that all
pospheric air into this level, which has a low concentration       temperature profiles measured on 11 June 2019 clearly show
of ozone and a high amount of water vapor. Figure 3b clearly       a second tropopause at about 110 hPa, while the temperature
demonstrates that the air mass with increased water vapor          profiles of case 1, measured only a couple of hours before,
also has diluted mixing ratios of ozone as the ozone mixing        do not show such a structure.
ratio decreases sharply at the same level at which the strong
increase in water vapor appears. Further evidence of the tro-      3.3   Source of the ozone peak at 150 hPa
pospheric origin of the air mass can be seen when consid-
ering the temperature profile. The temperatures typically in-      Figure 3a shows the profile measured after the event of
crease with altitude throughout the stratosphere. In the mea-      case 1. A strong ozone peak with values of up to 696 ppbv
sured ascent profile, after the temperature dropped to 207.9 K     (parts per billion by volume) can be seen starting somewhat
at the CPT, it increases until it reaches 220.4 K at a poten-      below the water vapor peak at a pressure level of 150 hPa.
tial temperature level of 365 K, where it declines sharply to      Usually, it is expected to find a negative correlation between
218.63 K. In Fig. 3b, it becomes evident that the larger tem-      water vapor and ozone when tropospheric air masses are in-
perature dip of ≈ 2 K occurs suddenly at 365 K, which is the       jected by overshooting convection into the stratosphere. It is,
same level as the strong decrease within the ozone peak. The       therefore, unexpected to find such a strong increase (about
temperature drop within the water vapor enhancement might          300 ppbv) in ozone at the same level as the water vapor in-
be a result of mixing with the strongly adiabatic cooled tro-      jection. Figure 3b shows a steep decrease in ozone mixing ra-
pospheric air within the overshooting top and the warmer           tios at potential temperature levels between 365 and 375 K.
stratospheric air masses in the surrounding. In addition, the      This indicates a dilution of the ozone-rich stratospheric air
evaporation or sublimation of cloud particles in this warmer       with ozone-poor tropospheric air. However, the origin of the
and drier mixing area around the overshooting top can also         ozone peak between the 160 and 375 K potential tempera-
lead to further cooling.                                           ture level has to be clarified. Multiple possible explanations
   Case 2 presents a slightly different background atmo-           might be considered. One suggestion linked a strong increase
sphere than case 1. The transition from the tropospheric to        in ozone to the injection of increased NOx produced by se-
the stratospheric regime proceeds less abruptly, as depicted       vere lightning (Seinfeld and Pandis, 2016; Bond et al., 2001;
in Fig. 4a and b (the water vapor mixing ratios of the flight      Cooray et al., 2009). NOx is controlling the O3 concentration
launched at 13:14 UTC, with the RS41 corrected for an off-         in the troposphere and is mainly responsible for the develop-
set bias). The CPT is further above the LRT, and the CPT           ment of photochemical smog in the troposphere. However,
temperature minimum is less distinct. For case 2, multiple         the increase of ≈ 300 ppbv cannot be explained by that be-
background profiles exist, launched throughout the day, be-        cause model simulations show that the potential increase due
fore the occurrence of the convective event in the night. To       to NOx would be of the order of 10 ppbv (DeCaria et al.,
simplify the figure, only the tropopause of the last profile be-   2005).
fore the event is shown in Fig. 4a and b. The water vapor             Another ozone source can be direct corona discharge dur-
profile shows a similar feature as case 1. As the water vapor      ing lightning, leading to ozone formation (Minschwaner
mixing ratio converges to the background value, it is first dis-   et al., 2008; Bozem et al., 2014; Kotsakis et al., 2017). How-
rupted by a peak reaching a value of 6.5 ppmv and returning        ever, the enhancement of ozone due to this process is reported
to the background value at a pressure or potential temper-         to be of the order of about 50 ppbv and, thus, cannot explain
ature level of 153 hPa or 365 K, respectively. At this eleva-      the increase in the observed range. Figure 5a shows the ozone

Atmos. Chem. Phys., 22, 1059–1079, 2022                                              https://doi.org/10.5194/acp-22-1059-2022

D. Khordakova et al.: A case study of mid-latitude overshooting convection                                                             1065

Figure 3. Profiles measured immediately before and after the convective event (case 1) at 18:00 UTC, on 10 June 2019, and at 00:00 UTC,
on 11 June 2019, in the UTLS region. The water vapor measurements are shown in reddish colors for the RS41 and in black for the CFH
instrument. Ozone measurements are depicted in blue. Temperature is shown in yellowish colors. (a) Pressure is used as a vertical coordinate.
(b) Potential temperature is used as a vertical coordinate. The different tropopauses (LRT and CPT) are shown as horizontal lines. The gray
regions mark the level between 145 and 165 hPa in panel (a) and between 365 and 370 K in panel (b) at which the water vapor enhancement
is observed.

Figure 4. Same as Fig. 3 but for profiles measured immediately before and after the convective event on 11 June 2019 (case 2) that passed
the measurement site in the UTLS region. The water vapor mixing ratios are shown in red and were measured by the radiosonde before and
after the event. (a) Pressure is used as a vertical coordinate. (b) Potential temperature is used as a vertical coordinate.

https://doi.org/10.5194/acp-22-1059-2022                                                  Atmos. Chem. Phys., 22, 1059–1079, 2022

1066                                              D. Khordakova et al.: A case study of mid-latitude overshooting convection

profile measured after the event during case 1 in compari-            Figure 7a–b show that the air mass measured after the
son to the mean of all ozone profiles (eight available pro-        event of case 1 is located just above a strong maximum in
files) with multiple balloon measurements in Germany dur-          CAPE over north Italy on the morning of 10 June 2019.
ing spring- and summertime measurements between 2018               Throughout the day, the air parcel moves close into regions
and 2020. It is evident that, although the profile of case 1       of enhanced CAPE on multiple occasions along the way to
clearly exceeds the mean ozone profile at this altitude, it is     the measurement site, and finally reaching the center of a re-
not out of our observed range analyzed here. Figure 5b dis-        gion with high CAPE close to the measurement site (Fig. 7c).
plays the H2 O–O3 distribution of the same data as in Fig. 5a.     Figure 8a–c depict the same scenario for case 2. Here, the air
Here, the data from case 1 (red dots), with the high amount of     masses crosses a location with high CAPE for the first time at
ozone and water vapor, diverge prominently from the typical        06:00 UTC on 11 June 2019 over Slovenia. It remains within
L-shaped data set (gray dotted data) which marks the tropo-        the region of high CAPE until 13:00 UTC before it crosses
spheric and stratospheric regimes. It is not unusual that verti-   the measurement site at midnight.
cally thin filaments of ozone-rich stratospheric air masses are       In contrast to the persistent and wide-ranged horizontal
transported horizontally, causing local ozone enhancements         distribution of elevated CAPE values, a different structural
in vertical profiles. A model run with CLaMS, using two dif-       evolution is observed in the PV (not shown) and dTheta.
ferent ECMWF reanalysis sets as input, shows an enhance-           When considering dTheta at the altitude of the measured air
ment of ozone between 100 and 200 hPa (not shown). This            parcel with enhanced water vapor, a strong minimum can be
indicates the horizontal transport of ozone-rich stratospheric     seen, which coincides with the signature of PV for cases 1
air, as the CLaMS model does not account for overshooting          and 2. For case 1, on the day before the measured event,
events. Figure 6 presents the ERA5 reanalysis at the time          no profound signature in the dTheta structure is seen until
and approximate altitude of the observed ozone peak. A nar-        09:00 UTC on the morning of 10 June 2019 (Fig. 7d). How-
row ozone-rich filament extends eastward from air masses           ever, at 10:00 UTC (Fig. 7e), a spot signature in dTheta is
with stratospheric origin towards the measurement location.        apparent, leading to PV values of up to 25 PVU in the region
Hence, there is strong evidence that the ozone-rich strato-        of high CAPE values over northern Italy. This is more than
spheric filament was transported horizontally to the location      twice as high as the surrounding PV values. The air mass
where water vapor was injected by overshooting convection          later sampled is located at the edge of the strong dTheta en-
into the lowermost stratosphere. The location and develop-         hancement with still strong values remaining throughout the
ment of the overshooting convection is discussed in Sect. 3.4      next 10 h. This signature subsequently weakens (Fig. 7e) but
and 3.5.                                                           reappears with increased intensity (Fig. 7f) and moves north-
                                                                   wards until it dissolves at midnight. The trajectory of the air
3.4    Comparison to the ERA5 reanalysis                           parcel moves only slightly westward of this structure but re-
                                                                   mains inside the enhancement of PV over the entire time,
ERA5 is used to place the measured data in a wider con-            although never in the center.
text and to evaluate the events. While ERA-Interim does not           A similar course of events can be observed for case 2, as
show any local signatures of the measured convection, the          shown in Fig. 8. In comparison to case 1, the trajectory of
ERA5 reanalysis reveals the signature of a convective over-        the air mass measured in case 2 approaches further from the
shooting with multiple parameters. Here we consider CAPE,          south. In the early morning hours of 11 June 2019, no sig-
PV, potential temperature, and the water vapor mixing ra-          nificant structure or signal can be seen in the area of inter-
tio, starting at midnight on 10 June 2019 until midnight on        est (Fig. 8d). At 10:00 UTC a dipole structure in dTheta ap-
14 June 2019. CAPE is the integrated amount of energy that         pears, leading to PV values of up to 30 PVU (Fig. 8e). Sim-
the upward buoyancy force would act on a air parcel if it          ilar to case 1, the signal neither develops gradually nor is it
moves vertically. High CAPE values above 1000 J kg−1 show          transported horizontally into the considered area and instead
an increased probability of strong convective storm develop-       emerges on a very short timescale. The anomaly appears over
ment in the case that convection is initiated. Figures 7a–c and    Austria, northern Italy, and over the Czech Republic and,
8a–c display the distribution of CAPE at three chosen points       therefore, has three central points. The enhancement over the
in time across Central Europe for cases 1 and 2 respectively.      Czech Republic dissolves in the following hour, while the
The white line marks the backward and forward trajectories         other two increase in strength over the next few hours. How-
which were initiated at the time and location of the mea-          ever, all three centers dissolve until midnight when the air
sured water vapor peak for case 1 (discussed in Sect. 3.5),        parcel reaches the measurement site. In case 2, the air parcel
and the black dot marks the location of the sampled air mass       is also constantly in the vicinity of at least one of the peaks in
at the given time point, according to the calculated trajec-       dTheta but never enters areas of the extraordinary high val-
tories. Very high CAPE values at the coast of Slovenia and         ues.
Croatia as well, as the east coast of Italy and northern Italy,       This signature in dTheta can be explained with the dis-
are evident in all chosen time frames.                             placement of the isentropes upward by strong updraft winds
                                                                   and local diabatic heating, which cause an increase in the gra-

Atmos. Chem. Phys., 22, 1059–1079, 2022                                              https://doi.org/10.5194/acp-22-1059-2022
D. Khordakova et al.: A case study of mid-latitude overshooting convection                                                           1067

Figure 5. Climatology of eight ozone profiles measured during spring and summer 2018–2020. (a) Ozone profiles, within the UTLS altitude
range from 2018 to 2020, launched in the mid-latitudes in potential temperature coordinates. The shaded area marks the measured range of
the ozone mixing ratios. The blue line shows ascent and descent data from the from case 1. (b) Tracer–tracer correlation of water vapor and
ozone mixing ratios within the UTLS altitude range for the data obtained from 2018 to 2020 in the mid-latitudes. The red dots show the data
from the ascent and descent from case 1.

                                                                        Figure 7g shows the hour before the first appearance of the
                                                                        signature of the convective storm for case 1 at 09:00 UTC on
                                                                        10 June 2019. In total, two peaks can be seen on the map
                                                                        but not close to the path of the air mass. Then, 1 h later, at
                                                                        10:00 UTC, a water vapor peak emerges in the vicinity of the
                                                                        air mass (Fig. 7h) at the same location as the enhancement in
                                                                        PV and dTheta. For case 2, a similar picture is seen. While
                                                                        no local enhancements in water vapor mixing ratios can be
                                                                        seen in the considered area at 09:00 UTC, only 1 h later, at
                                                                        10:00 UTC, a strong enhancement in water vapor is evident
                                                                        in the vicinity of the considered air mass. This signature of
                                                                        the local enhancement is almost twice as high as the peak
                                                                        seen for case 1. Similar to case 1, the enhancement is trans-
                                                                        ported towards the measurement site throughout the day and
                                                                        remains close to the measured air mass.

Figure 6. Horizontal map of ERA5 ozone mixing ratio at a pres-          3.5   Origin and evolution of the water vapor
sure level of 148 hPa on 11 June 2019 at 01:00 UTC (case 1). The              enhancement along the CLaMS trajectories
measurement site is indicated by a purple star.
                                                                        In order to determine the origin and evolution of the mea-
                                                                        sured air masses containing the water vapor enhancement,
dient of potential temperature, as has been shown by Qu et al.          100 h backward and 100 h forward trajectories were calcu-
(2020). In both cases considered here, the map of the dTheta            lated for both cases, as described in Sect. 2.4. The backward
is homogeneous before convection appears until 09:00 UTC                trajectories are not shown before 06:00 UTC on 9 June 2019,
(Fig. 7g–i). However, only 1 h later, a spot signal with values         as the points do not contain any relevant information related
of up to −2.7 K hPa−1 appears, which is more than 3 times               to the measurements. Figure 9a displays the water vapor
higher than the surrounding values. In both cases, the peak in          mixing ratios along the trajectory and the data points mea-
dTheta moves along the PV enhancement and also dissolves                sured by MLS within 5◦ of latitude and longitude and an
at the same time.                                                       hour before or after the trajectory point (star symbols). The
   Furthermore, the specific humidity in ERA5 was analyzed.             ERA5 water vapor mixing ratio shows a sharp increase along
Figure 7g–i show the specific humidity of ERA5 for case 1.              the trajectory, from values around 7 ppmv to values up to

https://doi.org/10.5194/acp-22-1059-2022                                                 Atmos. Chem. Phys., 22, 1059–1079, 2022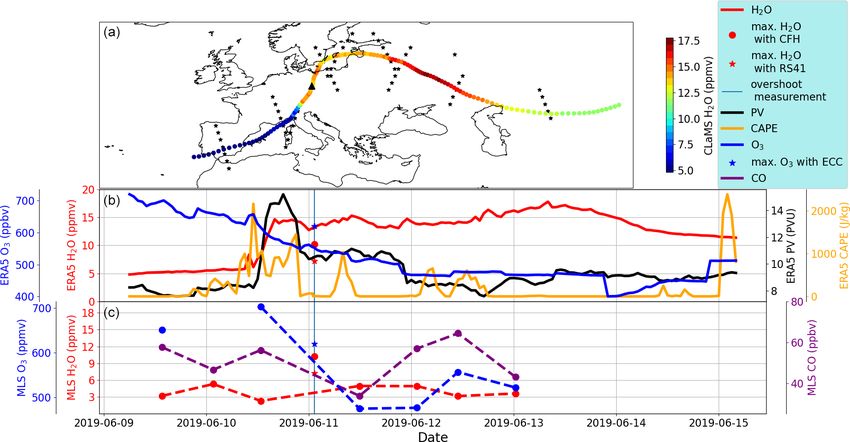
1068                                                  D. Khordakova et al.: A case study of mid-latitude overshooting convection

Figure 7. CAPE from ERA5 (a–c) vertical gradient of potential temperature (dTheta; d–f), and specific humidity (g–i) at three chosen time
points for case 1 (09:00, 10:00, and 21:00 UTC on 10 June 2019). dTheta and specific humidity are displayed at a pressure level of 148 hPa.
The horizontal black dashed line denotes the latitude of the measurement site, and the purple star indicates the exact measurement location.
The white line shows the trajectory of the measured air parcel, as described in Sect. 2.4. The black dot on the trajectory line represents the
calculated location of the air mass at the given point in time.

15 ppmv, ≈ 10 h before the balloon measurement took place.               Although multiple MLS data points were available, a clear
Figure 9b shows the mixing ratios of ozone and water vapor,              increase in water vapor cannot be seen in the available data.
as well as PV and CAPE values from ERA5, along the tra-                  Overall, the values measured by MLS are much lower com-
jectory. The trajectory encounters high CAPE values shortly              pared to the ERA5 water vapor values, which range from 2
before a steep increase in water vapor and PV appears on                 to 6 ppmv along the calculated trajectory, while the ERA5
10 June 2019 at around 10:00 UTC. The peak in CAPE is                    values vary between 5 and 18 ppmv. CO and water vapor
followed by a peak in PV almost doubling the preceding val-              act as a tropospheric tracer, with sources at the surface and
ues of around 8 PVU. This peak is in good agreement with                 background values in the stratosphere (Ricaud et al., 2007),
an increase in water vapor mixing ratios by 10 ppmv, which               and were considered here as a potential additional tracer for
remains at the level between 12.3 and 17.5 ppmv through-                 convective overshooting. The nearest values of the individ-
out the following 4 d of the trajectory (in contrast to the              ual data sets do not show any increase in relation to the pro-
PV enhancement which decreases shortly before the balloon                posed convective event. This emphasizes the small scale of
observations to a background value of 8 PVU). With a wa-                 the overshooting event and the local scale of the water vapor
ter vapor mixing ratio of 10 ppmv measured by the CFH at                 enhancement, as MLS only has a very coarse spatial resolu-
the peak, the values obtained with the balloon payload are               tion in the LS. While the vertical extent of the water vapor
lower than the ERA5 values. The ozone mixing ratios do not               peak is 800 m (600 m for case 2), the vertical resolution of
show an impact by the convective event but steadily decrease             MLS H2 O measurement is 1.5 km.
throughout the trajectory. Figure 9c shows MLS water vapor,                 A similar picture appears for case 2, as shown in Fig. 10. It
ozone, and CO mean mixing ratios for the nearest MLS point               must be noted that the scales differ in comparison to Fig. 9.
for each time step within 300 km along the trajectory. Only              In case 2, at midday on 10 June 2019, a series of peaks in
seven measurement points were found to match the criteria.               CAPE emerge and persist throughout the next 4 d. Shortly

Atmos. Chem. Phys., 22, 1059–1079, 2022                                                     https://doi.org/10.5194/acp-22-1059-2022
D. Khordakova et al.: A case study of mid-latitude overshooting convection                                                         1069

Figure 8. The same as in Fig. 7 but for case 2 with three chosen points in time (09:00, 10:00, and 18:00 UTC on 11 June 2019).

before the start of these variations in CAPE, a slight increase        decreasing ozone values along the trajectory seem to be un-
in PV is evident, and PV values subsequently show enhanced             related to the changes in the other trace gases, in case 2, an in-
values, although not exceeding 9.5 PVU at a background of              crease in ozone mixing ratios by 150 ppbv occurs at the same
7.5 PVU. Water vapor along the trajectory remains constant             time as the increase in the PV values. In contrast to case 1,
until midday on 11 June 2019, when it is slightly enhanced             where the peak in PV initially decreases shortly before reach-
from approximately 6 to 10 ppmv shortly after CAPE and                 ing the measurement site and returns to background values
PV reach maximum values ≈ 11 h before the measurement                  1 d later, in case 2 the PV values keep increasing but never
took place. Similar to case 1, the water vapor continuously            reach the high values of case 1. In both cases, the water vapor
remained at the elevated mixing ratios throughout the end              mixing ratios remain enhanced after the overshooting con-
of the trajectory. For case 2, only four MLS measurement               vection in the model and shortly before reaching the mea-
points were found within 300 km of the trajectory. A slight            surement site. However, case 2 shows lower values at around
enhancement of 1 ppmv in the water vapor mixing ratio in the           10 ppmv in comparison to 15 ppmv for case 1. With these
MLS data after the overshooting convection and a 30 ppmv               values, the ERA5 water vapor value is greater than the mea-
increase in CO, which remains enhanced between 55 and                  sured value in case 1 but is slightly below the values mea-
65 ppmv, together with a slight decrease in ozone mixing ra-           sured in case 2.
tio by 20 ppbv can be seen. Here it is emphasized that the
overshooting event of case 2 likely has a wider horizontal ex-
tent, which makes it more suitable for detection by the MLS            3.6   Overshooting events in satellite data
instrument. This is supported by the fact that, in contrast to         The satellite measurements of brightness temperature (BT)
case 1, both the ascending and descending profiles show en-            from geostationary Meteosat-10 rapid scan data support the
hancements of tropospheric air in the lower stratosphere. The          above-indicated tropospheric origin of the measured water
trajectories for the two cases show an increase in the water           vapor enhancement in the lower stratosphere. Figure 11a–d
vapor before the air parcel arrived at the measurement site.           show Meteosat-10 BT data for two chosen times in case 1.
The increase in water vapor is accompanied by an increase              Figure 11a shows the data at 05:29 UTC on 10 June 2019. A
in PV and high CAPE values. While in case 1 the steadily               cloud structure reaching a BT as low as 205 K surrounds the

https://doi.org/10.5194/acp-22-1059-2022                                                Atmos. Chem. Phys., 22, 1059–1079, 2022
1070                                                   D. Khordakova et al.: A case study of mid-latitude overshooting convection

Figure 9. Trajectory of the measured air mass for case 1, with MLS data taken within 5◦ of latitude and longitude of the trajectory. Panel (a)
shows the trajectory on a map, with the color-coded water vapor mixing ratios along the trajectory. Additionally, all MLS data points within
a longitude and latitude of 5◦ , as well as within 1 h before and after the individual trajectory points, are shown as star symbols. In panel (b),
the water vapor from ERA5 along the trajectory is displayed in red, ozone in blue, PV in black, and CAPE in orange. The time of the
measurement and the observed maximum water vapor mixing ratio from CFH and RS41 within the pressure levels of 145 and 165 hPa are
shown at the vertical blue line and with blue and red symbols, respectively. Panel (c) displays the same time frame, with the nearest MLS
measurements of ozone in blue, water vapor in red, and CO in purple, within a radius of 300 km of each trajectory point and 1 h before or
after the trajectory point.

Figure 10. Same as in Fig. 9 but for case 2. The time of the measurement is marked with a vertical blue line, and the observed maximum
water vapor mixing ratio from RS41, within the pressure levels of 139 and 155 hPa, is shown with red star in each panel.

Atmos. Chem. Phys., 22, 1059–1079, 2022                                                        https://doi.org/10.5194/acp-22-1059-2022
D. Khordakova et al.: A case study of mid-latitude overshooting convection                                                  1071

air mass along the trajectory at this time. For case 1, a CPT      comparable to a study by Smith et al. (2017), where wa-
of 208 K was measured and confirmed by the surrounding             ter vapor mixing ratio enhancements were measured during
cloud-top BT between 210 and 216 K. It is, therefore, most         multiple airborne missions above the North American conti-
likely that areas with a BT below 205 K resemble areas of          nent. Smith et al. (2017) use 370 K as a typical tropopause
overshooting tops. These areas are circled in pink in Fig. 11.     altitude and discuss water vapor enhancements at a level be-
In addition to the trajectories discussed in Sect. 3.5, further    tween 400 and 410 K, with values up to 6 ppmv above the
trajectories were calculated starting at the same location but     background values. Similarly, the water vapor values mea-
at lower pressure levels, as both balloon profiles not only ex-    sured in case 2 are of the same order of magnitude. The maxi-
hibited a main peak at a pressure level of 149 or 144 hPa but      mum of the peak is approximately 40 K above the tropopause
also covered an underlying water vapor enhancement at 165          potential temperature and reaches 7.5 ppmv above the back-
or 155 hPa, respectively, for cases 1 and 2 (Figs. 3 and 4).       ground value. The same order of magnitude was observed
Trajectories initialized at 149, 155, and 165 hPa and at 144,      during the SEAC4RS aircraft measurement campaign, with
153, and 155 hPa, respectively, for case 1 and case 2 were cal-    elevated water vapor mixing ratios of up to 10.6 ppmv in the
culated and added to the satellite image. The air mass on the      lowermost stratosphere at ≈ 100 hPa (Robrecht et al., 2019).
trajectory starting at 149 hPa is located closest (only 50 km         The local injection of water vapor was detected within a
northeast) to the coldest and, therefore, highest point of the     larger-scale peak in ozone for case 1. This peak results from a
convective cloud, as can be seen in detail in Fig. 11a. Con-       horizontal transport of stratospheric air masses with a strong
sidering the slight uncertainties in the trajectory calculation    stratospheric signature from west to east. An edge of a fil-
and in the meteorological fields, this point in time is most       ament from a front with high ozone values is stretched over
likely responsible for the water vapor enhancement detected        the measurement location. A map of ERA5 ozone at 145 hPa,
later. However, the satellite images display the coinciding of     as given in Fig. 6, shows that the balloon measurement was
the air mass and the convective event 4 h earlier compared to      at the edge of a front with higher ozone mixing ratios. This
ERA5 and, therefore, further southwest. Later in the day, the      explains the lower ozone values at the same pressure or po-
air mass location coincides with another overshooting cloud        tential temperature level in the descending profile which was
at around 21:09 UTC (see Fig. 11b). Multiple areas exceed          located further north. This is also supported by the sparse
the tropopause height in the convective clouds but none of         data from MLS, which show higher ozone mixing ratio val-
the air masses on the trajectories seem to be very close to        ues westward of the measurement site and lower values of
these areas.                                                       about 200 ppbv east of the measurement site (see Fig. 9).
   The trajectories for case 2 pass by near to the convec-         The ERA5 ozone values along the calculated trajectory of
tive events as well; however, these are at a greater distance      the measured air mass further support this assessment. The
from the overshooting tops (Fig. 12a and b). For case 2,           moistening of the ozone-rich air mass lead to an unusual fea-
Fig. 4b shows a temperature of 214 K at the tropopause             ture in the tracer–tracer correlation, as shown in Fig. 5b.
height. Trajectories initialized at pressure levels of 145, 150,      Case 1 not only shows a strong enhancement of water va-
and 155 hPa can be seen in Fig. 12 and encounter the cloud-        por mixing ratios in the ascending profile of the balloon-
top height with temperatures 6 K below the tropopause tem-         borne measurement, but further expected indications of a tro-
perature. Similar to case 1, in case 2, an additional convec-      pospheric air injection were also recorded. A sharp decrease
tive storm develops over eastern Germany with overshooting         in ozone mixing ratios occurs at the same potential temper-
tops. However, the air masses along the trajectories do not        ature level as the rise in water vapor. The drop in tempera-
encounter this convective cloud (see Fig. 12a and b). Thus, it     ture is equally sharp and aligned with the change in water
is very likely that the observed water vapor enhancement re-       vapor and ozone, albeit less prominent. The elevated water
sulted from the overshooting event that occurred over Austria      vapor, decrease in ozone mixing ratios, and lower temper-
on 11 June 2019 at around 14:24 or 15:49 UTC.                      atures all indicate the tropospheric origin of the measured
                                                                   air mass between the potential temperature levels of 365 and
                                                                   375 K. The air mass is clearly different from the air masses
4   Discussion                                                     above and below to a degree that the profile of the water va-
                                                                   por peak appears to be square shaped (see Fig. 3b). The fresh
The measurements presented here show a strong enhance-             in-mixing and the tropospheric origin of the air masses is
ment in water vapor above the tropopause on 2 consecutive          also underlined by the small spatial extent of the enhance-
days, i.e., 10 and 11 June 2019. Both cases originate from         ment. This is derived from the following two observations:
gravity waves breaking behind the overshooting top, leading        first, the balloon measurement does not show any enhance-
to in-mixing of tropospheric air into the lower stratosphere       ment of water vapor in the descending profile, and second,
several hours before the balloon launch.                           no clear trace of the event can be found in the MLS mea-
   The water vapor mixing ratio enhancement measured in            surements due to the low vertical and horizontal (cross-track)
case 1 is located 40 K above the thermal tropopause when           resolution at the limb tangent point of 1.5 and 3 km, respec-
using potential temperature as a vertical coordinate. This is      tively. The tropospheric source of the water vapor injection

https://doi.org/10.5194/acp-22-1059-2022                                          Atmos. Chem. Phys., 22, 1059–1079, 2022
1072 D. Khordakova et al.: A case study of mid-latitude overshooting convection Figure 11. Brightness temperatures from geostationary Meteosat-10 satellite using the IR 10.8 µm channel along trajectories for case 1 during two different times (a at 05:59 UTC and b at 21:09 UTC on 10 June 2019). Air mass trajectories initiated at different pressure levels (149, 155, and 165 hPa) are shown with gray to black lines. Air masses with BT < 205 K are depicted with pink contours. for case 1 is supported by satellite BT measurements of over- stratospheric air, which has a lower water vapor mixing ratio shooting tops and by ERA5 displaying a local disturbance and a higher potential temperature. The hydrometeors from in PV and dTheta along the trajectory of the discussed air the injection sublimate and are mixed into the stratospheric mass. The dTheta anomaly is in good agreement with the air mass on very small timescales under these strongly sub- local enhanced water vapor mixing ratio in ERA5 (Fig. 7d– saturated conditions. It is, therefore, consistent that the ad- f). The BT satellite data suggest that this coinciding of the ditional COBALD measurement (not shown) did not detect measured air mass and the convective overshooting event oc- any cloud particles in the measured profile. Additionally, the curs ≈ 4 h earlier at 05:29:18 UTC further southwest, but oth- sublimating hydrometeors cool the air mass. It is very likely erwise both the reanalysis and the observational data show that the air mass descended slightly due to the decreased a convective storm moving northwards, with high-reaching potential temperature after the mixing of tropospheric and cloud tops and BTs reaching as low as 205 K. Until this con- stratospheric air and, therefore, reached neutral buoyancy at vective event dissolves after 22:00 UTC, the measured air a lower level than was later found in the balloon profiles. This parcel remains close to its center. The air mass along the tra- process would not be evident in the calculated trajectories jectory starting at 149 hPa encounters a second, stronger, and and, thus, slightly increases the inaccuracy of the presented more spatially distributed convective event over the northeast trajectories. However, the descent of the air mass due to the of Munich (southeastern Germany), in the evening at 18:19 adjustment of potential temperature is expected to be rather and 19:39 UTC, where it also passes close to a cloud-top low due to the very humid conditions of the LS mixed-in tro- height reaching 202 K BT (see Fig. A2). The air masses con- pospheric air mass. Furthermore, the existence of sublimated tinue to remain in this growing convective cloud, which even- hydrometeors in the entrained air masses result in a relatively tually covers the entirety of eastern Germany, until the mea- low amount of air that is ultimately irreversibly mixed within surement site is reached. As described in Smith et al. (2017), the LS. Qu et al. (2020), and Dauhut et al. (2018), the in-mixing of Case 2 shows a similar signature but differs in several as- tropospheric air masses is caused by gravity waves break- pects. First, the balloon profile measurements in Fig. 4a and b ing closely behind an overshooting top into the surrounding show that the water vapor enhancement is stronger and is lo- Atmos. Chem. Phys., 22, 1059–1079, 2022 https://doi.org/10.5194/acp-22-1059-2022
You can also read