Identified GNGT1 and NMU as Combined Diagnosis Biomarker of Non-Small-Cell Lung Cancer Utilizing Bioinformatics and Logistic Regression
←
→
Page content transcription
If your browser does not render page correctly, please read the page content below

Hindawi
Disease Markers
Volume 2021, Article ID 6696198, 14 pages
https://doi.org/10.1155/2021/6696198

Research Article
Identified GNGT1 and NMU as Combined Diagnosis Biomarker of
Non-Small-Cell Lung Cancer Utilizing Bioinformatics and
Logistic Regression

          Jia-Jia Zhang ,1 Jiang Hong ,2 Yu-Shui Ma ,3,4 Yi Shi ,4 Dan-Dan Zhang ,4
          Xiao-Li Yang ,4 Cheng-You Jia ,1 Yu-Zhen Yin ,1 Geng-Xi Jiang ,2 Da Fu ,4
          and Fei Yu 1
          1
            Department of Nuclear Medicine, Shanghai Tenth People’s Hospital, Tongji University School of Medicine, Shanghai 200072, China
          2
            Department of Thoracic Surgery, Navy Military Medical University Affiliated Changhai Hospital, Shanghai 200433, China
          3
            Department of Pancreatic and Hepatobiliary Surgery, Cancer Hospital, Fudan University Shanghai Cancer Center,
            Shanghai 200032, China
          4
            Central Laboratory for Medical Research, Shanghai Tenth People’s Hospital, Tongji University School of Medicine,
            Shanghai 200072, China

          Correspondence should be addressed to Geng-Xi Jiang; jiang9909@hotmail.com, Da Fu; fu800da900@126.com,
          and Fei Yu; yufei021@sina.com

          Received 3 November 2020; Revised 1 December 2020; Accepted 18 December 2020; Published 6 January 2021

          Academic Editor: Andrea Maugeri

          Copyright © 2021 Jia-Jia Zhang et al. This is an open access article distributed under the Creative Commons Attribution License,
          which permits unrestricted use, distribution, and reproduction in any medium, provided the original work is properly cited.

          Non-small-cell lung cancer (NSCLC) is one of the most devastating diseases worldwide. The study is aimed at identifying reliable
          prognostic biomarkers and to improve understanding of cancer initiation and progression mechanisms. RNA-Seq data were
          downloaded from The Cancer Genome Atlas (TCGA) database. Subsequently, comprehensive bioinformatics analysis
          incorporating gene ontology (GO), Kyoto Encyclopedia of Genes and Genomes (KEGG), and the protein-protein interaction
          (PPI) network was conducted to identify differentially expressed genes (DEGs) closely associated with NSCLC. Eight hub genes
          were screened out using Molecular Complex Detection (MCODE) and cytoHubba. The prognostic and diagnostic values of the
          hub genes were further confirmed by survival analysis and receiver operating characteristic (ROC) curve analysis. Hub genes
          were validated by other datasets, such as the Oncomine, Human Protein Atlas, and cBioPortal databases. Ultimately, logistic
          regression analysis was conducted to evaluate the diagnostic potential of the two identified biomarkers. Screening removed 1,411
          DEGs, including 1,362 upregulated and 49 downregulated genes. Pathway enrichment analysis of the DEGs examined the Ras
          signaling pathway, alcoholism, and other factors. Ultimately, eight prioritized genes (GNGT1, GNG4, NMU, GCG, TAC1,
          GAST, GCGR1, and NPSR1) were identified as hub genes. High hub gene expression was significantly associated with worse
          overall survival in patients with NSCLC. The ROC curves showed that these hub genes had diagnostic value. The mRNA
          expressions of GNGT1 and NMU were low in the Oncomine database. Their protein expressions and genetic alterations were
          also revealed. Finally, logistic regression analysis indicated that combining the two biomarkers substantially improved the ability
          to discriminate NSCLC. GNGT1 and NMU identified in the current study may empower further discovery of the molecular
          mechanisms underlying NSCLC’s initiation and progression.

1. Introduction                                                         non-small-cell lung cancer (NSCLC) [4–6], which is typically
                                                                        classified into two subtypes, squamous cell carcinoma (SCC)
As one of the most devastating diseases worldwide, lung can-            and adenocarcinoma (AD), using standard pathology
cer causes nearly 1.6 million mortalities each year [1–3].              methods [7–10]. Tobacco smoking is the most common risk
Approximately 85% of lung cancers are characterized as                  factor for lung cancer. Smoking is also associated with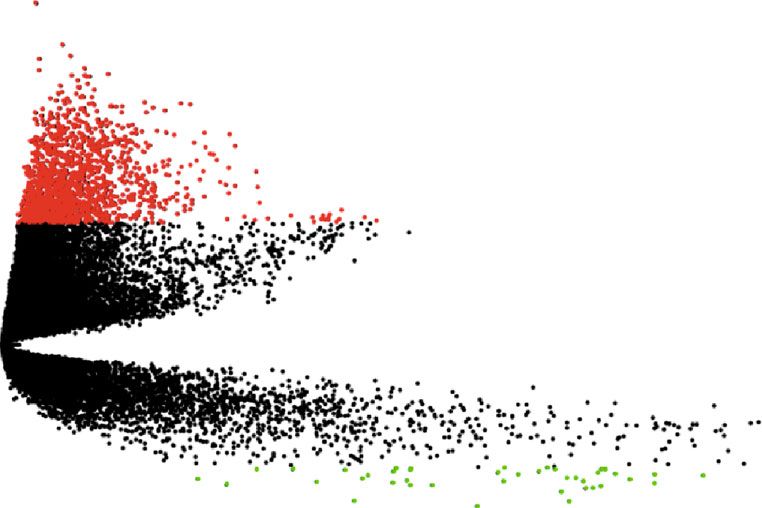
2                                                                                                                 Disease Markers

multiple risks, including worse tolerance of treatment, higher      from the TCGA database (https://cancergenome.nih.gov/)
risk of failure and second primary tumors, and poorer quality       [48]. The criteria used were as follows: primary site (lung),
of life. Indeed, it has become clear that the significant reduc-     data category (Transcriptome Profiling), project ID
tion in tobacco consumption would result in the prevention          (TCGA-LUAD and TCGA-LUSC), experimental strategy
of a large fraction of lung cancer cases and other smoking-         (RNA-Seq), and workflow type (HTSeq-counts). The other
related diseases [11–13].                                           filters were kept as default. Practical Extraction and Report-
     In addition, other factors such as air pollution, poor diet,   ing Language (Perl) was utilized to extract the sample infor-
occupational exposure, and hereditary factors have been             mation, generate the mRNA expression matrix, and
reported in association with NSCLC in nonsmokers [14–16].           annotate gene symbols. Finally, data from a cohort contain-
Over the past few years, newly developed cytotoxic agents,          ing 1,145 samples were obtained from TCGA. Of these
including paclitaxel, gemcitabine, and vinorelbine, have            1,145 samples, there were 108 normal tissue and 1,037
emerged to offer multiple therapeutic choices for patients with      NSCLC samples, respectively. The EdgeR package from Bio-
LUAD [17–20]. However, chemotherapy for advanced NSCLC              conductor was used to screen the DEGs between normal tis-
is often considered ineffective or excessively toxic [21–23].        sue and NSCLC [49–51]. The adjusted P < 0:001, and
     In an attempt to improve treatments for NSCLC, new             fold change ðFCÞ > 4 were set as the cutoff criteria.
therapeutic strategies, such as the development of noncyto-
toxic targeted agents, have emerged [24–27]. Moreover, the          2.2. DEG Functional Enrichment Analysis. Gene ontology
targeted therapies have significantly improved clinical out-         (GO) analysis provides a standardized description of gene
comes in a subset of lung cancer patients whose tumors har-         products in terms of molecular function (MF), biological
bor EGFR [28], ALK [29, 30], and HER2 alterations [31–33].          process (BP), and cellular component (CC) [52]. The Kyoto
     Despite recent advances in cancer treatment, unfortu-          Encyclopedia of Genes and Genomes (KEGG) is a database
nately, the current five-year survival rate of NSCLC remains         offering gene functional meanings and expressed proteins
unsatisfactory [34–37]. Thus, it is imperative to identify          [53]. GO and KEGG enrichment analyses were conducted
potential biomarkers and explore NSCLC’s underlying bio-            using the powerful online tool DAVID (DAVID, https://
logical mechanisms.                                                 david.ncifcrf.gov/) and visualized by the R package “ggplot2”
     In recent years, bioinformatics analysis has been utilized     [54]. In addition, P < 0:05 was considered to indicate statisti-
as a powerful tool to explore novel prognostic and therapeu-        cal significance.
tic biomarkers and to unveil the potential mechanisms of
NSCLC [38–41]. For instance, a novel model including seven          2.3. Constructing the Protein-Protein Interaction Network.
genes was reported to indicate a promising prognostic bio-          The Search Tool for the Retrieval of Interacting Genes
marker for lung SCC patients using integrated bioinformatics        (STRING, https://string-db.org/) database, a database that
methods [41–43]. In addition, studies used comprehensive            integrates all functional interactions between proteins, was
bioinformatics analysis to show that the cell cycle pathway         used to build the PPI network [55]. An interaction score of
may play a significant role in NSCLC in nonsmokers [44–47].          ≥0.4 was considered statistically significant.
     In the present study, RNA-Seq data were downloaded             2.4. Hub Gene Selection and Analysis. A Cytoscape plugin,
from The Cancer Genome Atlas (TCGA) database. Then,                 Molecular Complex Detection (MCODE), was utilized to
the EdgeR package was applied to uncover differentially              screen modules of PPI networks with a node score cutoff of
expressed genes (DEGs) between NSCLC tissues and normal             0.2, degree cutoff of 2, k-core of 2, and max depth of 100. A
tissues. Using the resulting data, this study is aimed at unveil-   P value of
Disease Markers                                                                                                             3

under the curve (AUC) and P value were calculated. P < 0:05      3.3. PPI Network Construction, Module Analysis, and Hub
was considered to denote statistical significance.                Gene Selection. The PPI network was constructed using the
                                                                 STRING database and visualized in Cytoscape. The PPI net-
2.7. Validation of Hub Genes. The expression level of hub        work consisted of 787 nodes and 2,104 edges, including 1,362
genes in LUAD was validated by Oncomine (https://www             upregulated genes and 49 downregulated genes. The overlap-
.oncomine.org/resource/login.html) [57]. The threshold was       ping genes of different algorithms selected by cytoHubba
set as the following: P < 1E − 4, fold change > 2, and gene      were GNGT1, GNG4, NMU, GCG, TAC1, GAST, NPSR1,
ranking in the top 10%.                                          and GCGR (Figure 2(b)). The top modules were then
                                                                 extracted from the PPI network (Figure 2(c)).
2.8. Human Protein Atlas. The Human Protein Atlas (https://
www.proteinatlas.org) is an online website that includes         3.4. Survival Analysis. The Kaplan–Meier plotter was used to
immunohistochemical data of nearly 20 types of tumors            predict the prognostic value of the six identified hub genes.
[58]. In our study, immunohistochemical images were used         The results demonstrated that high expressions of GNGT1
to directly compare the expression of biomarkers in normal       (HR = 1:17 ð1:03 – 1:33Þ,        logrank P = 0:017),  GNG4
and NSCLC tissues. The intensity of antibody staining indi-      (HR = 1:42 ð1:2 – 1:67Þ,     logrank P = 4:4e − 05),  NMU
cated the protein expression of hub genes.                       (HR = 1:48 ð1:3 – 1:68Þ,      logrank P = 2:5e − 09),  GCG
                                                                 (HR = 1:15 ð1:01 – 1:31Þ,        logrank P = 0:031),  TAC1
2.9. Genetic Alteration of Hub Genes. The cBio Cancer Geno-      (HR = 1:23 ð1:08 – 1:39Þ,       logrank P = 0:0017),  GAST
mics Portal (http://www.cbioportal.org/) is an open platform     (HR = 1:27 ð1:12 – 1:44Þ, logrank P = 0:00025), GCGR
that provides visualization, analysis, and downloads of large-   (HR = 0:79 ð0:69 – 0:89Þ, logrank P = 0:00022), and NPSR1
scale cancer genomic datasets for various cancer types [59].     (HR = 1:21 ð1:02 – 1:42Þ, logrank P = 0:024) were associated
Complex cancer genomic profiles can be easily obtained            with worse overall survival for NSCLC patients (Figure 3).
using the portal’s query interface, enabling researchers to
explore and compare genetic alterations across samples.          3.5. ROC Curve. According to ROC curve analysis, the AUCs
cBioPortal was used to explore genetic alterations, coexpres-    of GNGT1, GNG4, NMU, GCG, TAC1, GAST, GCGR1, and
sion, and overall survival of two hub genes, GNGT1 and           NPSR1 were 0.9027 (P < 0:0001), 0.8729 (P < 0:0001), 0.9323
NMU.                                                             (P < 0:0001), 0.559 (P < 0:0432), 0.6822 (P < 0:0001), 0.7426
                                                                 (P < 0:0001), 0.816 (P < 0:0001), and NPSR1 0.8949
2.10. Statistical Analysis. SPSS version 23.0 (SPSS Inc., Chi-   (P < 0:0001), respectively (Figure 4(a)).
cago, IL, USA) was used to perform logistic regression anal-
ysis. ROC curves were generated to evaluate the diagnostic       3.6. Validating Hub Gene Expression. The Oncomine data-
accuracy of GNGT1 and NMU, and AUC was used to evalu-            base was used to validate the expression of hub genes. The
ate sensitivity and specificity.                                  results demonstrated that GNGT1 had high expression in
                                                                 LUAD (P: 0.024, FC: 1.877) and LUSC (P: 9.77E-6, FC:
3. Results                                                       3.358). In Bhattacharjee’s study, NMU showed high expres-
                                                                 sion in LUAD (P: 0.007, FC: 5.186) and LUSC (P: 0.012,
3.1. Identification of DEGs in NSCLC. The workflow is shown        FC: 2.378) (Figure 4(b)).
in Figure 1(a). DEGs were identified using the criteria of
P < 0:001 and FC > 4. A total of 1,411 DEGs were                 3.7. Human Protein Atlas. After studying the mRNA expres-
screened out between NSCLC and normal samples, includ-           sion of hub genes in NSCLC, we tried to explore the protein
ing 1,362 upregulated genes and 49 downregulated genes           expression of hub genes using the Human Protein Atlas. The
(Figures 1(b) and 1(c)).                                         results revealed that NMU protein was not expressed in nor-
                                                                 mal lung tissues, whereas medium expression of NMU pro-
3.2. Functional and Pathway Analysis of DEGs. To further         tein was observed in the NSCLC tissues. However, GNGT1
investigate the specific function of these genes, all DEGs were   was not detected in either normal lung tissues or NSCLC tis-
uploaded to the online tool DAVID. GO analysis revealed          sues (Figure 4(c)).
that in terms of BP, the DEGs were associated with nucleo-
some assembly, transcription from RNA polymerase II pro-         3.8. Genetic Alteration of Hub Genes. The two hub genes
moter, telomere organization, flavonoid glucuronidation,          altered in 22 (4%) of the 584 patients, and the frequency of
and DNA replication-dependent nucleosome assembly.               alteration of each hub gene, are shown in Figure 5(a).
    When examined in terms of MF, DEGs were enriched in          GNGT1 and NMU were altered most often (2.7% and 1.7%,
protein heterodimerization activity, retinoic acid-binding,      respectively), with mutation, amplification, and mRNA
hormone activity, glucuronosyltransferase activity, and          upregulation as the main types of alterations observed
extracellular ligand-gated ion channel activity. Regarding       (Figure 5(b)). The expression of GNGTA was correlated with
CC, the DEGs were mainly enriched in the extracellular           NMU (Spearman: 0.13, P = 2:415e − 3; Pearson = 0:13, P =
region, cornified envelope, nucleosome, extracellular space,      4:821e − 3) (Figure 5(c)). Patients with CYP1A2 and GSTA3
and intermediate filament. KEGG analysis found that the           alteration had worse overall survival than patients without
DEGs were predominantly involved in the Ras signaling            CYP1A2 and GSTA3 alteration (P = 0:465) (Figure 5(d)).
pathway, nicotine addiction, steroid hormone biosynthesis,           Notably, according to the ROC curve analysis, the AUC
alcoholism, and systemic lupus erythematosus (Figure 2(a)).      of GNGT1 was 0.903 (P < 0:0001). For NMU, the AUC was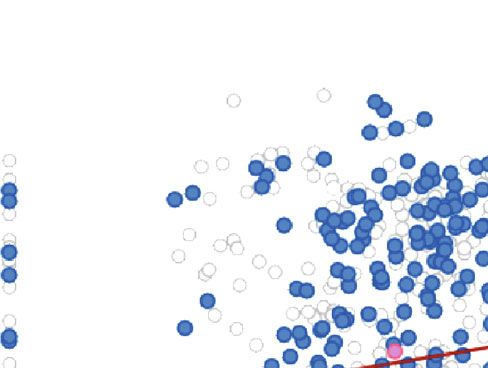
4                                                                                                                             Disease Markers

                                     NSCLC in TCGA
                                                                              10

                                   1411 DEGs in NSCLC
                                                                               5

                      GO and KEGG                  Construction of

                                                                     logFC
                    enrichment analysis             PPI network                0

                         Eight significant genes in KEGG and PPI             –5

                              Survival analysis by KM plotter                –10

                                                                                   0      50   100        150     200   250      300
                                                                                                     –log10 (FDR)
                                Validation with Oncomine
                                                                                   Up
                                                                                   Down
                                          cBioPortal

                                     Combined analysis

                                           (a)                                                       (b)

                                                                                                                                   0.21

                                                                                                                                   0.61
     0.03
            0.51
                   1.0

                                                                                                                                   1.0
                                                                                                                                  UNC93A
                                                                                                                                  NHLH2
                                                                                                                                  QRFP
                                                                                                                                  TAC1
                                                                                                                                  HMGA1
                                                                                                                                  HMG20B
                                                                                                                                  RAD23A
                                                                                                                                  GNG4
                                                                                                                                  NMU
                                                                                                                                  ZUP1
                                                                                                                                  TRIM24
                                                                                                                                  GNGT1
                                                                                                                                  GAST
                                                                                                                                  GCG
                                                                                                                                  USP19
                                                                                                                                  VAC14
                                                                                                                                  ABCB9
                                                                                                                                  NHLRC1
                                                                                                                                  QRFPR
                                                                                                                                  RAD21L1

                                                                       (c)

Figure 1: Identification of DEGs in NSCLC. (a) Workflow for the identification of key pathways and genes between non-small-cell lung
cancer and normal samples. (b) DEGs between LUAD tissue and normal tissue. The volcano plot showed 1,411 DEGs. The red dots
represented the upregulated genes, while the green dots represented downregulated genes. DEGs: differentially expressed genes. (c)
Heatmap of the 20 upregulated and downregulated DEGs. The red color represents high expression, and the blue color represents low
expression.
Disease Markers 5
MF –log10 (P value)
BP –log10 (P value)
20 Protein heterodimerization activity 16
Flavonoid glucuronidation
Sequence-specific DNA binding
Telomere organization
Keratinization Chromatin DNA binding
Keratinocyte differentiation Glucuronosyltransferase activity
Peptide cross-linking Chloride channel activity
15 12
Flavonoid biosynthetic process - Extracellular ligand-gated ion channel activity
Epidermis development Structural molecule activity
Digestion Hormone activity
Nucleosome assembly Cysteine-type endopeptidase inhibitor activity
Chromatin silencing at rDNA 10 Retinoic acid binding 8
0e+00 5e–07 1e–06 0e+00 5.0e-05 1.0e-04
P-value P-value
Count Count
10 25 10 40
15 30 20 50
20 30 60
CC –log10 (P value) KEGG –log10 (P value)
Extracellular exosome Systemic lupus erythematosus 10
Keratin filament Chemical carcinogenesis
Chloride channel complex 10 Alcoholism
Intermediate filament Nicotine addiction 15
Extracellular space Morphine addiction
Ras signaling pathway -
Extracellular region
Cornified envelope Drug metabolism-other enzymes 20
Nuclear nucleosome 20 Drug metabolism cytochrome P450
Nucleosome Retinol metabolism
Steroid hormone biosynthesis 25
Nuclear chromosome
0.000 0.004 0.008
0.000 0.005 0.010
P-value
P-value
Count Count
40 120 10 5
80 160 7.5 2.5
(a)
NTS
GAST
EPC Closeness
1 0
Ra
F2
CC 0
di
M 0 0
ali
ty
0 0
0 0
0 8 0
GCGR
1 0
0
NMU GCGR GNGT1 GCG GAST
TAC1 GNG4 NPSR1
(b) (c)
Figure 2: Functional and pathway analysis of DEGs. (a) GO and KEGG analysis of DEGs. P value is displayed on the x-axis, and GO function
enrichment and KEGG pathway are shown on the y-axis. GO: gene ontology. KEGG: Kyoto Encyclopedia of Genes and Genomes. (b) The
overlapping genes of different algorithms selected by cytoHubba. (c) The most significant modules obtained from the PPI network. PPI:
protein-protein interaction.
6 Disease Markers
GNGT1 GNG4
1.0 1.0
HR = 1.17 (1.03–1.33) HR = 1.42 (1.2–1.67)
Logrank P = 0.017 Logrank P = 4.4E–05
0.8 0.8
Overall survival
Overall survival
0.6 0.6
0.4 0.4
0.2 0.2
0.0 0.0
0 20 40 60 80 100 120 0 20 40 60 80 100 120
Time (months) Time (months)
NMU GCG TAC1
1.0 1.0 1.0
HR = 1.48 (1.3–1.68) HR = 1.15 (1.01–1.31) HR = 1.23 (1.08–1.39)
Logrank P = 2.5E-09 Logrank P = 0.031 Logrank P = 0.0017
0.8 0.8 0.8
Overall survival
Overall survival
Overall survival
0.6 0.6 0.6
0.4 0.4 0.4
0.2 0.2 0.2
0.0 0.0 0.0
0 20 40 60 80 100 120 0 20 40 60 80 100 120 0 20 40 60 80 100 120
Time (months) Time (months) Time (months)
GAST GCGR1 NPSR1
1.0 1.0 1.0
HR = 1.27 (1.12–1.44) HR = 0.79 (0.69–0.89) HR = 1.21 (1.02-1.42)
Logrank P = 0.00025 Logrank P = 0.00022 Logrank P = 0.024
0.8 0.8 0.8
Overall survival
Overall survival
Overall survival
0.6 0.6 0.6
0.4 0.4 0.4
0.2 0.2 0.2
0.0 0.0 0.0
0 20 40 60 80 100 0 20 40 60 80 100 0 20 40 60 80 100
Time (months) Time (months) Time (months)
Expression
Low
High
Figure 3: The prognostic value of hub genes in NSCLC patients. Kaplan–Meier curve analysis between hub gene expression and prognosis in
NSCLC patients from the KM plotter database.
0.932 (P < 0:0001). The AUC was largest when GNGT1 and selected GNGT1, GNG4, NMU, GCG, TAC1, GAST
was combined with NMU (AUC = 0:969, P < 0:0001) NPSR1, and GCGR as hub genes using Molecular Complex
(Figure 5(e)). Detection (MCODE) and cytoHubba. These genes were
primarily enriched in terms of the Ras signaling pathway,
4. Discussion steroid hormone biosynthesis, nicotine addiction, alcohol-
ism, steroid hormone biosynthesis, and systemic lupus
Elucidating the molecular mechanisms of the initiation and erythematosus.
development of NSCLC would benefit the early diagnosis The Ras signaling pathway is closely related to the occur-
and targeted therapy efforts [60–63]. In this study, we identi- rence and progression of most human tumors [64–67]. The
fied 1,362 upregulated genes and 49 downregulated genes activation of RAS-RAF-MEK-MAPK in gene transcription
Disease Markers 7
GNGT1 GNG4 NMU GCG
1.0 1.0 1.0
1.0
0.8 0.8 0.8
0.8
0.6 0.6 0.6
0.6
0.4 0.4 0.4 0.4 AUC = 0.559
AUC = 0.903 AUC = 0.873 AUC = 0.933
(0.845–0.986) (0.423–0.625)
(0.812–0.956) 0.2 (0.742–0.965) 0.2 0.2
0.2
P value < 0.0001 P value < 0.0001
P value < 0.0001 P value < 0.0001
0.0 0.0 0.0 0.0
0.0 0.2 0.4 0.6 0.8 1.0 0.0 0.2 0.4 0.6 0.8 1.0 0.0 0.2 0.4 0.6 0.8 1.0 0.0 0.2 0.4 0.6 0.8 1.0
TAC1 GAST GCGR1 NPSR1
1.0 1.0 1.0 1.0
0.8 0.8 0.8 0.8
0.6 0.6 0.6 0.6
0.4 0.4 0.4 0.4
AUC = 0.682 AUC = 0.743
0.2 (0.532–0.784) AUC = 0.816 AUC = 0.895
0.2 (0.656–0.824) 0.2 (0.725–0.922) 0.2 (0.801–0.963)
P value < 0.0001 P value < 0.0001
0.0 P value < 0.0001 P value < 0.0001
0.0 0.0 0.0
0.0 0.2 0.4 0.6 0.8 1.0 0.0 0.2 0.4 0.6 0.8 1.0 0.0 0.2 0.4 0.6 0.8 1.0 0.0 0.2 0.4 0.6 0.8 1.0
(a)
GNGT1 GNGT1 NMU NMU
P value: 0.024 P value: 9.77E-6 P value: 0.007 P value: 0.012
FC: 1.877 FC: 3.358 FC: 5.186 FC: 2.378
3.0 8.0 8.0
–1.0 2.0
1.0 6.0 6.0
–2.0
0.0
Bhattacharjee lung
Bhattacharjee lung
–3.0 4.0
Okayama lung
–1.0 4.0
Su lung
–4.0 –2.0
2.0 2.0
–3.0
–5.0 –4.0 0.0 0.0
–6.0 –5.0
–6.0 –2.0 –2.0
–7.0
–7.0
–8.0 –8.0 –4.0 –4.0
Normal LUAD Normal LUSC Normal LUAD Normal LUSC
(b)
Normal Normal
Staining: not detected Staining: not detected
25 12
20 10
15 8
GNGT1
NMU
6
10
NSCLC 4 NSCLC
5 Staining: not detected Staining: medium
2
0
0
Not detected
High
Medium
Low
Not detected
High
Medium
Low
(c)
Figure 4: The expression and prognostic value of four hub genes in NSCLC patients. (a) The ROC curves of hub genes. AUC and P values of
each hub gene are displayed in the plot. ROC: receiver operating characteristic. AUC: area under the curve. (b) Expression levels of significant
genes compared between different types of NSCLC and normal tissues from the Oncomine platform. Fold changes and P values of each hub
gene are displayed in the plot. (c) Immunohistochemical analysis of GNGT1 and NMU in normal tissues and NSCLC tissues from the Human
Protein Atlas.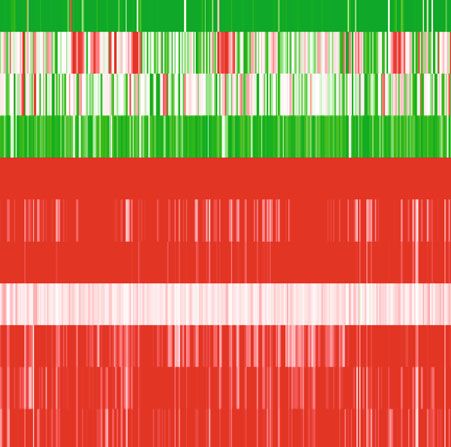
8 Disease Markers
GNGT1 vs. NMU
GNGT1 ⁎
2.7%
NMU 1.7%⁎
Genetic alteration Missense mutation (unknown significance) mRNA high
Amplification No alterations
Deep deletion
(a)
10
2.5% 8
1.5%
6
mRNA expression (GNGT1)
2%
Alteration frequency
4
1.5% 1% 2
0
1%
–2
0.5%
0.5% –4
–6
GNGT1 NMU –8
mRNA high –8 –6 –4 –2 0 2 4 6 8 10 12
mRNA expression (NMU)
Deep deletion
Mutation GNGT1 mutated Spearman: 0.13 P = 2.415e–3
Amplification Neither mutated Pearson = 0.13 P = 4.821e–3
Not profile for mutated Y = 0.14X+–1.33
(b) (c)
Overall survival Kaplan-Meier estimated 1.0
Logrank P value = 0.465
100%
90%
0.8
80%
70%
0.6
Sensitivity
Overall survival
60%
50%
0.4
40%
30% GNGT1 AUC = 0.903 (81.2–96.5)
0.2
20% NMU AUC = 0.932 (83.1–98.9)
Combined AUC = 0.969 (89.8–99.6)
10%
0.0
0% 0.0 0.2 0.4 0.6 0.8 1.0
0 40 80 120 160 180 1 – specificity
Months survival
GNGT1 Combined
Case with alteration in query genes NMU Reference line
Case without alteration in query genes
(d) (e)
Figure 5: The expression and prognostic value of GNGT1 and NMU in NSCLC patients. (a) Genetic alteration of GNGT1 and NMU genes in
NSCLC patients. (b) Illustration of the alteration frequency of GNGT1 and NMU genes in NSCLC patients. (c) Coexpression between
GNGT1 and NMU. (d) Overall survival analysis for GNGT1 and NMU genes in NSCLC patients. (e) Combined diagnosis of GNGT1 and
NMU genes in NSCLC patients.
Disease Markers                                                                                                                  9

regulation can promote proliferation, migration, and angio-        cer and endometrial cancer [122–124]. The protein encoded
genesis of cancer cells [68–70]. RAS-PI3K interaction is an        by NMU can amplify ILC2 to drive allergic lung inflamma-
important signaling node and potential therapeutic target          tion [125]. NMU is regulated by RhoGDI2, a metastasis
in EGFR-mutant lung cancer [71–73]. In addition, steroid           inhibitor, which can be used as a target for lung metastasis.
hormones were not previously considered to be involved             The expression of NMU is negatively correlated with progno-
with lung function [74–76]. However, numerous studies have         sis in most types of cancer [126–128]. In the present study,
reported that steroid hormones are important in normal lung        the higher mRNA and protein expression of NMU were neg-
development and function [77], as well as in the pathogenesis      atively correlated with overall survival. Therefore, our results
of pulmonary diseases, including lung cancer [78–81].              are in line with these previous studies, which indicated that
    Cigarette smoking is a well-known risk factor for the          NMU may be directly or indirectly important in NSCLC
occurrence and progression of malignant diseases [82–85].          development.
Nicotine, the major constituent in cigarette smoke, plays               Moreover, to explore the predictive ability of GNGT1
key roles in cancer progression [86–89]. Nicotine likely pro-      and NMU, logistic regression analysis was performed. The
motes lung cancer cell proliferation by upregulating HIF-1α        logistic regression analysis showed a probabilistic nonlinear
and SOCC components [90–93]. It was demonstrated that              regression, which has functions in discrimination and pre-
nicotine increased NSCLC cell proliferation through nico-          diction. Notably, according to logistic regression analysis,
tinic acetylcholine receptor-mediated signals [94–97]. Nico-       the AUC of the ROC curve of GNGT1 was 0.903
tine can also induce the expression of embryonic stem cell         (P < 0:0001), and the AUC of NMU was 0.932 (P < 0:0001).
factor Sox2, which is indispensable for self-renewal and the       Combining the two biomarkers enabled a relatively high
maintenance of stem cell properties in NSCLC cells [98–100].       capacity for discrimination between NSCLC and normal
    Several studies have been conducted to investigate the         patients, with an AUC of 0.969, indicating that the combined
association between alcohol and lung cancer. Some studies          test of GNGT1 combined with NMU was superior to testing
have reported that alcohol is linked to a number of human          for either gene individually, with better clinical accuracy and
diseases, including cancers [101–103]. Interestingly, another      higher diagnostic value. Therefore, it is of high scientific
report shows that alcohol has nothing to do with lung cancer       value to use a logistic regression model as a diagnostic model
[104]. Thus, conducting further experiments is necessary to        for NSCLC.
confirm whether lung cancer is attributable to alcohol abuse.            In conclusion, our results identified two hub genes,
All in all, the findings of these studies are consistent with our   GNGT1 and NMU, as prognostic target genes, and
results.                                                           highlighted their probable role in NSCLC. Nevertheless, a
    In the current study, the expressions of GNGT1 and             few limitations to this study should be acknowledged.
NMU were low both in the Oncomine and TCGA databases,              Because all the data analyzed in the current study were
indicating that GNGT1 and NMU may play a role as onco-             retrieved from the online databases, further independent
genes. The transducin γ-subunit gene (GNGT1) has been              experiments are required to validate our findings and to
localized to human chromosome 7 [104] and is associated            explore the molecular mechanism of the hub genes in
with various forms of cancer [105–108]. GNGT1 exerts               NSCLC development and progression.
effects in different tissues regulating cell proliferation, migra-
tion, adhesion, and apoptosis [109–111]. One study showed          Data Availability
that GNGT1 could serve as a marker of medulloblastoma
[112]. GNGT1 can be utilized to differentiate gastrointestinal      All data generated or analyzed during this study are included
stromal tumor and leiomyosarcoma, two cancers that have            in this article.
very similar histopathology, but require very different treat-
ments [113–115]. In the current study, GNGT1 was signifi-           Additional Points
cantly upregulated and high mRNA expression of GNGT1
was associated with poor overall survival in NSCLC patients.       Impact Statement. GNGT1 and NMU identified in the cur-
Furthermore, KEGG analysis showed that GNGT1 was                   rent study may empower further discovery of the molecular
involved in the Ras signaling pathway. Therefore, it is reason-    mechanisms underlying NSCLC’s initiation and progression.
able to regard GNGT1 as a hub gene of NSCLC. Further
studies are needed to better understand GNGT1’s association        Conflicts of Interest
with NSCLC.
    Neuromedin U (NMU) has been reported to exhibit early          The authors declared no potential conflicts of interest with
alterations associated with cancer, including lung cancer,         respect to the research, authorship, and/or publication of this
pancreatic cancer, breast cancer, renal cancer, and endome-        article.
trioid endometrial carcinoma, through promoting migration,
invasion, glycolysis, a mesenchymal phenotype, a stem cell         Authors’ Contributions
phenotype of cancer cells, and resistance to the antitumor
immune response [116–118]. It is overexpressed in pancre-          Y.-S.M., D.F., and F.Y. designed the study. All authors col-
atic cancer and increases the cancer invasiveness through          lected data, performed the statistical analyses, and inter-
the hepatocyte growth factor c-Met pathway [119–121]. A            preted the data. J.-J.Z., D.F., and F.Y. wrote the manuscript.
role has also been implicated for NMU in human breast can-         J.-J.Z., J.H., and Y.-S.M. contributed equally to this work.
10                                                                                                                         Disease Markers

All authors contributed to the final version of the manuscript                  small cell lung cancer (NSCLC) with EGFR mutations,”
and approved the final manuscript. Jia-Jia Zhang, Jiang                         Molecular Cancer, vol. 18, p. 139, 2019.
Hong, and Yu-Shui Ma contributed equally to this work.                  [11]   J. Zhu, W. C. Huang, B. Huang et al., “Clinical characteristics
                                                                               and prognosis of COVID-19 patients with initial presentation
                                                                               of lung lesions confined to a single pulmonary lobe,” Ameri-
Acknowledgments                                                                can Journal of Translational Research, vol. 12, no. 11,
                                                                               pp. 7501–7509, 2020.
This study was supported partly by grants from the National             [12]   M. Reda, W. Ngamcherdtrakul, S. Gu et al., “PLK1 and EGFR
Natural Science Foundation of China (81972214, 81772932,                       targeted nanoparticle as a radiation sensitizer for non-small
82071956, 81472202, and 81302065), Shanghai Talents                            cell lung cancer,” Cancer Letters, vol. 467, pp. 9–18, 2019.
Development Foundation (2017103), Shanghai Science and                  [13]   J. Gasparello, M. Lomazzi, C. Papi et al., “Efficient delivery of
Technology Commission (18441903500, 14DZ1940606),                              microRNA and antimiRNA molecules using an argininocalix
Shanghai     Academic/Technology       Research     Leader                     [4] arene macrocycle,” Molecular Therapy-Nucleic Acids,
(18XD1403000), and National Key R&D Program of China                           vol. 18, pp. 748–763, 2019.
(2016YFC0104303).                                                       [14]   J. Nong, Y. Gong, Y. Guan et al., “Circulating tumor DNA
                                                                               analysis depicts subclonal architecture and genomic evolu-
                                                                               tion of small cell lung cancer,” Nature Communications,
References                                                                     vol. 9, no. 1, p. 3114, 2018.
                                                                        [15]   C. M. Dowling, H. Zhang, T. N. Chonghaile, and K.-
  [1] F. Yu, J. B. Liu, Z. J. Wu et al., “Tumor suppressive                    K. Wong, “Shining a light on metabolic vulnerabilities in
      microRNA-124a inhibits stemness and enhances gefitinib                    non-small cell lung cancer,” Biochimica et Biophysica Acta
      sensitivity of non-small cell lung cancer cells by targeting             (BBA)-Reviews on Cancer, vol. 1875, no. 1, Article ID
      ubiquitin-specific protease 14,” Cancer Letters, vol. 427,                188462, 2021.
      pp. 74–84, 2018.
                                                                        [16]   Z. Hu, X. Zheng, D. Jiao et al., “LunX-CAR T cells as targeted
  [2] L. Guo, Y. Zhang, R. Wei, C. Wang, and M. Feng, “Lipopoly-               therapy for non-small cell lung cancer,” Molecular Therapy-
      saccharide-anchored macrophages hijack tumor microtube                   Oncolytics, vol. 17, pp. 361–370, 2020.
      networks for selective drug transport and augmentation of
                                                                        [17]   Y. Hu, J. Yu, Q. Wang et al., “Tartrate-resistant acid phospha-
      antitumor effects in orthotopic lung cancer,” Theranostics,
                                                                               tase 5/ACP5 interacts with p53 to control the expression of
      vol. 9, pp. 6936–6948, 2019.
                                                                               SMAD3 in lung adenocarcinoma,” Molecular Therapy-Onco-
  [3] J. Ferlay, M. Colombet, I. Soerjomataram et al., “Cancer inci-           lytics, vol. 16, pp. 272–288, 2020.
      dence and mortality patterns in Europe: estimates for 40
      countries and 25 major cancers in 2018,” European Journal         [18]   M. V. Giulietti, A. Vespa, M. Ottaviani et al., “Personality (at
      of Cancer, vol. 103, pp. 356–387, 2018.                                  intrapsychic and interpersonal level) associated with quality
                                                                               of life in patients with cancer (lung and colon),” Cancer Con-
  [4] Z. Wang, S. Fu, J. Zhao et al., “Transbronchoscopic patient
                                                                               trol, vol. 26, 2019.
      biopsy-derived xenografts as a preclinical model to explore
      chemorefractory-associated pathways and biomarkers for            [19]   Y. Li, Z. Yin, J. Fan, S. Zhang, and W. Yang, “The roles of exo-
      small-cell lung cancer,” Cancer letters, vol. 440, pp. 180–              somal miRNAs and lncRNAs in lung diseases,” Signal trans-
      188, 2019.                                                               duction and targeted therapy, vol. 4, p. 47, 2019.
  [5] Y. Han, W. Guo, T. Ren et al., “Tumor-associated macro-           [20]   A. Taschauer, W. Polzer, F. Alioglu et al., “Peptide-targeted
      phages promote lung metastasis and induce epithelial-                    polyplexes for aerosol-mediated gene delivery to CD49f-
      mesenchymal transition in osteosarcoma by activating the                 overexpressing tumor lesions in lung,” Molecular Therapy-
      COX-2/STAT3 axis,” Cancer letters, vol. 440, pp. 116–125,                Nucleic Acids, vol. 18, pp. 774–786, 2019.
      2019.                                                             [21]   W. J. Christian, N. L. Vanderford, J. McDowell et al., “Spatio-
  [6] S. K. Hong, H. Lee, O. S. Kwon et al., “Large-scale pharmaco-            temporal analysis of lung cancer histological types in Ken-
      genomics based drug discovery for ITGB3 dependent che-                   tucky, 1995-2014,” Cancer Control, vol. 26, article
      moresistance in mesenchymal lung cancer,” Molecular                      1073274819845873, 2019.
      Cancer, vol. 17, no. 1, p. 175, 2018.                             [22]   J. M. Matés, J. A. Campos-Sandoval, J. L. Santos-Jiménez, and
  [7] C. Bouclier, M. Simon, G. Laconde et al., “Stapled peptide tar-          J. Márquez, “Dysregulation of glutaminase and glutamine
      geting the CDK4/Cyclin D interface combined with Abema-                  synthetase in cancer,” Cancer Letters, vol. 467, pp. 29–39,
      ciclib inhibits KRAS mutant lung cancer growth,”                         2019.
      Theranostics, vol. 10, pp. 2008–2028, 2020.                       [23]   R. K. Dutta, S. Chinnapaiyan, and H. Unwalla, “Aberrant
  [8] O. B. Garbuzenko, A. Kuzmov, O. Taratula, S. R. Pine, and                microRNAomics in pulmonary complications:implications
      T. Minko, “Strategy to enhance lung cancer treatment by five              in lung health and diseases,” Molecular Therapy-Nucleic
      essential elements: inhalation delivery, nanotechnology,                 Acids, vol. 18, pp. 413–431, 2019.
      tumor-receptor targeting, chemo- and gene therapy,” Thera-        [24]   H. R. Choi, I. A. Song, and T. K. Oh, “Association of opioid
      nostics, vol. 9, no. 26, pp. 8362–8376, 2019.                            use in the week before death among patients with advanced
  [9] M. Shen, X. Zhao, L. Zhao et al., “Met is involved in TIGAR-             lung cancer having sepsis,” Cancer Control, vol. 26, article
      regulated metastasis of non-small-cell lung cancer,” Molecu-             1073274819871326, 2019.
      lar Cancer, vol. 17, p. 88, 2018.                                 [25]   C. P. Santiago, C. J. Keuthan, S. L. Boye, S. E. Boye, A. A.
 [10] A. Lin, T. Wei, H. Meng, P. Luo, and J. Zhang, “Role of the              Imam, and J. D. Ash, “A drug-tunable gene therapy for
      dynamic tumor microenvironment in controversies regard-                  broad-spectrum protection against retinal degeneration,”
      ing immune checkpoint inhibitors for the treatment of non-               Molecular Therapy, vol. 26, pp. 2407–2417, 2018.
Disease Markers 11
[26] F. Bianchini, E. Portioli, F. Ferlenghi et al., “Cell-targeted to target FOSL2 by sponging miR-143 in non-small cell lung
c(AmpRGD)-sunitinib molecular conjugates impair tumor cancer,” Molecular Therapy-Nucleic Acids, vol. 19, pp. 643–
growth of melanoma,” Cancer Letters, vol. 446, pp. 25–37, 653, 2020.
2019. [41] M. Zhang, L. Zhang, Y. Li et al., “Exome sequencing identifies
[27] M. Caine, T. Chung, H. Kilpatrick et al., “Evaluation of novel somatic mutations in novel driver genes in non-small cell
formulations for transarterial chemoembolization: combin- lung cancer,” Aging (Albany NY), vol. 12, no. 13,
ing elements of Lipiodol emulsions with drug-eluting beads,” pp. 13701–13715, 2020.
Theranostics, vol. 9, no. 19, pp. 5626–5641, 2019. [42] X. H. Huang, X. Yan, Q. H. Zhang et al., “Direct targeting of
[28] C. Zhou, C. Yi, Y. Yi et al., “lncRNA PVT1 promotes tumor- HSP90 with daurisoline destabilizes β-catenin to suppress
igenesis of colorectal cancer by stabilizing miR-16-5p and lung cancer tumorigenesis,” Cancer Letters, vol. 489, pp. 66–
interacting with the VEGFA/VEGFR1/AKT axis,” Molecular 78, 2020.
Therapy-Nucleic Acids, vol. 20, pp. 438–450, 2020. [43] Y. de Man, F. Atsma, M. G. Oosterveld-Vlug et al., “The
[29] N. Zhang, A. Nan, L. Chen et al., “Circular RNA circSATB2 intensity of hospital care utilization by Dutch patients with
promotes progression of non-small cell lung cancer cells,” lung or colorectal cancer in their final months of life,” Cancer
Molecular Cancer, vol. 19, no. 1, p. 101, 2020. Control, vol. 26, article 1073274819846574, 2019.
[30] M. Chen, Y. Xu, J. Zhao et al., “Concurrent driver gene muta- [44] G. Yang, Q. Chen, J. Xiao, H. Zhang, Z. Wang, and X. Lin,
tions as negative predictive factors in epidermal growth factor “Identification of genes and analysis of prognostic values in
receptor-positive non-small cell lung Cancer. EBioMedicine nonsmoking females with non-small cell lung carcinoma by
2019;42:304-310. Nicot C. RNA-Seq reveal the circular RNAs bioinformatics analyses,” Cancer Management and Research,
landscape of lung cancer,” Molecular Cancer, vol. 18, p. 183, vol. Volume 10, pp. 4287–4295, 2018.
2019. [45] H. Wang, B. Lu, S. Ren et al., “Long Noncoding RNA
[31] S. H. Vellanki, R. G. B. Cruz, H. Jahns et al., “Natural com- LINC01116 contributes to gefitinib resistance in non-small
pound Tetrocarcin-A downregulates Junctional Adhesion cell lung cancer through regulating IFI44,” Molecular
Molecule-A inconjunction with HER2 and inhibitor of apo- Therapy-Nucleic Acids, vol. 19, pp. 218–227, 2020.
ptosis proteins and inhibits tumorcell growth,” Cancer Let- [46] Z. Wu, Z. Liu, X. Jiang et al., “Depleting PTOV1 sensitizes
ters, vol. 440, pp. 23–34, 2019. non-small cell lung cancer cells to chemotherapy through
[32] S. Yu, J. Zhang, Y. Yan et al., “A novel asymmetrical anti- attenuating cancer stem cell traits,” Journal of Experimental
HER2/CD3 bispecific antibody exhibits potent cytotoxicity & Clinical Cancer Research, vol. 38, p. 341, 2019.
for HER2-positive tumor cells,” Journal of Experimental & [47] Cancer Genome Atlas Research Network, “Comprehensive
Clinical Cancer Research, vol. 38, p. 355, 2019. molecular profiling of lung adenocarcinoma,” Nature,
[33] B. Yuan, J. Zhao, C. Zhou et al., “Co-occurring alterations of vol. 511, no. 7511, pp. 543–550, 2014.
ERBB2 exon 20 insertion in non-small cell lung cancer [48] H. G. Xiong, H. Li, Y. Xiao et al., “Long noncoding RNA
(NSCLC) and the potential indicator of response to afatinib,” MYOSLID promotes invasion and metastasis by modulating
Frontiers in Oncology, vol. 10, p. 729, 2020. the partial epithelial-mesenchymal transition program in
[34] Y. He, D. Chen, Y. Yi et al., “Histone deacetylase inhibitor head and neck squamous cell carcinoma,” Journal of Experi-
sensitizes ERCC1-high non-small-cell lung cancer cells to cis- mental & Clinical Cancer Research, vol. 38, p. 278, 2019.
platin via regulating miR-149,” Molecular Therapy-Oncoly- [49] Z. Gao, P. Fu, Z. Yu, F. X. Zhen, and Y. H. Yanhong Gu,
tics, vol. 17, pp. 448–459, 2020. “Comprehensive analysis of lncRNA-miRNA- mRNA net-
[35] W. Zhou, J. Yang, G. Saren et al., “HDAC6-specific inhibitor work ascertains prognostic factors in patients with colon can-
suppresses Th17 cell function via the HIF-1α pathway in cer,” Technology in Cancer Research & Treatment, vol. 18,
acute lung allograft rejection in mice,” Theranostics, vol. 10, article 1533033819853237, 2019.
no. 15, pp. 6790–6805, 2020. [50] M. D. Robinson, D. J. McCarthy, and G. K. Smyth, “edgeR: a
[36] P. Chen, Q. Wu, J. Feng et al., “Erianin, a novel dibenzyl com- bioconductor package for differential expression analysis of
pound in Dendrobium extract, inhibits lung cancer cell digital gene expression data,” Bioinformatics, vol. 26,
growth and migration via calcium/calmodulin-dependent pp. 139-140, 2010.
ferroptosis,” Signal Transduction and Targeted Therapy, [51] M. Ashburner, C. A. Ball, J. A. Blake et al., “Gene ontology:
vol. 5, p. 51, 2020. tool for the unification of biology,” Nature genetics, vol. 25,
[37] T. Li, Y. Liu, W. Zhang et al., “A rapid liquid biopsy of lung pp. 25–29, 2000.
cancer by separation and detection of exfoliated tumor cells [52] H. Ogata, S. Goto, K. Sato, W. Fujibuchi, H. Bono, and
from bronchoalveolar lavage fluid with a dual-layer "PER- M. Kanehisa, “KEGG: Kyoto Encyclopedia of Genes and
FECT" filter system,” Theranostics, vol. 10, pp. 6517–6529, Genomes,” Nucleic Acids Research, vol. 27, pp. 29–34, 1999.
2020. [53] X. Sun, K. Wu, and D. Cook, “PKgraph:an R package for
[38] H. Wang, Q. Deng, Z. Lv et al., “N6-methyladenosine graphically diagnosing population pharmacokinetic models,”
induced miR-143-3p promotes the brain metastasis of lung Computer Methods and Programs in Biomedicine, vol. 104,
cancer via regulation of VASH1,” Molecular Cancer, vol. 18, no. 3, pp. 461–471, 2011.
p. 181, 2019. [54] C. Perez-Iratxeta, P. Bork, and M. A. Andrade-Navarro,
[39] Z. Hu, X. Zheng, D. Jiao et al., “LunX-CAR T Cells as a tar- “Update of the G2D tool for prioritization of gene candidates
geted therapy for non-small cell lung cancer,” Molecular to inherited diseases,” Nucleic Acids Research, vol. 35,
Therapy-Oncolytics, vol. 17, pp. 361–370, 2020. pp. W212–W216, 2007.
[40] X. Chen, Z. Wang, F. Tong, X. Dong, G. Wu, and R. Zhang, [55] C. H. Chin, S. H. Chen, H. H. Wu, C. W. Ho, M. T. Ko, and
“lncRNA UCA1 promotes gefitinib resistance as a ceRNA C. Y. Lin, “cytoHubba: identifying hub objects and sub-12 Disease Markers
networks from complex interactome,” BMC systems biology, antibody therapy in KRAS-mutant non-small cell lung can-
vol. 8, p. S11, 2014. cer,” Cancer Letters, vol. 466, pp. 23–34, 2019.
[56] D. R. Rhodes, J. Yu, K. Shanker et al., “ONCOMINE: a cancer [72] A. Casal-Mouriño, A. Ruano-Ravina, M. Torres-Durán et al.,
microarray database and integrated data-mining platform,” “Lung cancer survival in never-smokers and exposure to res-
Neoplasia, vol. 6, no. 1, pp. 1–6, 2004. idential radon: results of the LCRINS study,” Cancer Letters,
[57] X. Q. Xie, M. J. Wang, Y. Li et al., “miR-124 intensified vol. 487, pp. 21–26, 2020.
oxaliplatin-based chemotherapy by targeting CAPN2 in colo- [73] F. Xu, J. X. Chen, X. B. Yang et al., “Analysis of lung adeno-
rectal cancer,” Molecular Therapy-Oncolytics, vol. 17, carcinoma subtypes based on immune signatures identifies
pp. 320–331, 2020. clinical implications for cancer therapy,” Molecular Ther-
[58] N. Hoshikawa, A. Sakai, S. Takai, and H. Suzuki, “Targeting apy-Oncolytics, vol. 17, pp. 241–249, 2020.
extracellular miR-21-TLR7 signaling provides long-lasting [74] W. Lin, Y. Xu, X. Chen et al., “Radiation-induced small extra-
analgesia in osteoarthritis,” Molecular Therapy-Nucleic Acids, cellular vesicles as "carriages" promote tumor antigen release
vol. 19, pp. 199–207, 2020. and trigger antitumor immunity,” Theranostics, vol. 10,
[59] C. Gao, X. Sun, Z. Wu et al., “A novel benzofuran derivative no. 11, pp. 4871–4884, 2020.
Moracin N induces autophagy and apoptosis through ROS [75] J. Xie, W. Zhang, X. Liang et al., “RPL32 promotes lung can-
generation in lung cancer,” Frontiers in Pharmacology, cer progression by facilitating p53 degradation,” Molecular
vol. 11, p. 391, 2020. Therapy-Nucleic Acids, vol. 21, pp. 75–85, 2020.
[60] N. C. Demircan, T. Akın Telli, T. Başoğlu Tüylü et al., “QT [76] M. Keller, F. Dubois, S. Teulier et al., “NDR2 kinase contrib-
interval prolongation related to afatinib treatment in a utes to cell invasion and cytokinesis defects induced by the
patient with metastatic non-small-cell lung cancer,” Current inactivation of RASSF1A tumor-suppressor gene in lung can-
Problems in Cancer, vol. 27, p. 100594, 2020. cer cells,” Journal of Experimental & Clinical Cancer
[61] A. Malinina, D. Dikeman, R. Westbrook et al., “IL10 defi- Research, vol. 38, p. 158, 2019.
ciency promotes alveolar enlargement and lymphoid dys- [77] A. van Waarde, A. A. Rybczynska, N. K. Ramakrishnan,
morphogenesis in the aged murine lung,” Aging Cell, K. Ishiwata, P. H. Elsinga, and R. A. Dierckx, “Potential appli-
vol. 19, article e13130, 2020. cations for sigma receptor ligands in cancer diagnosis and
[62] S. Xiong, Z. Hong, L. S. Huang et al., “IL-1β suppression of therapy,” Biochimica et Biophysica Acta, vol. 1848,
VE-cadherin transcription underlies sepsis-induced inflam- pp. 2703–2714, 2015.
matory lung injury,” The Journal of Clinical Investigation, [78] L. Jiang, R. Wang, L. Fang et al., “HCP5 is a SMAD3-
vol. 8, p. 136908, 2020. responsive long non-coding RNA that promotes lung adeno-
[63] K. Xu, D. Park, A. T. Magis et al., “Small molecule KRAS ago- carcinoma metastasis via miR-203/SNAI axis,” Theranostics,
nist for mutant KRAS cancer therapy,” Molecular Cancer, vol. 9, no. 9, pp. 2460–2474, 2019.
vol. 18, p. 85, 2019. [79] C. Chen, W. R. Liu, B. Zhang et al., “LncRNA H19 downreg-
[64] P. Chen, X. Li, R. Zhang et al., “Combinative treatment of β- ulation confers erlotinib resistance through upregulation of
elemene and cetuximab is sensitive to KRAS mutant colorec- PKM2 andphosphorylation of AKT in EGFR-mutant lung
tal cancer cells by inducing ferroptosis and inhibiting cancers,” Cancer Letters, vol. 486, pp. 58–70, 2020.
epithelial-mesenchymal transformation,” Theranostics, [80] E. Fernandes, J. Sores, S. Cotton et al., “Esophageal, gastric
vol. 10, no. 11, pp. 5107–5119, 2020. and colorectal cancers: looking beyond classical serological
[65] G. Shan, B. Shao, Q. Liu et al., “circFMN2 sponges miR-1238 biomarkers towards glycoproteomics-assisted precision
to promote the expression of LIM-homeobox gene 2 in pros- oncology,” Theranostics, vol. 10, pp. 4903–4928, 2020.
tate cancer cells,” Molecular Therapy-Nucleic Acids, vol. 21, [81] M. Shen, Z. Xu, W. Xu et al., “Inhibition of ATM reverses
pp. 133–146, 2020. EMT and decreases metastatic potential of cisplatin-
[66] H. Jin, Y. Jang, N. Cheng et al., “Restoration of mutant K-Ras resistant lung cancer cells through JAK/STAT3/PD-L1 path-
repressed miR-199b inhibits K-Ras mutant non-small cell way,” Journal of Experimental & Clinical Cancer Research,
lung cancer progression,” Journal of Experimental & Clinical vol. 38, p. 149, 2019.
Cancer Research, vol. 38, no. 1, p. 165, 2019. [82] J. Kang, S. H. Jeong, K. Lee et al., “Exacerbation of symptom-
[67] Y. Jin, M. Liu, R. Sa, H. Fu, L. Cheng, and L. Chen, “Mouse atic arthritis by cigarette smoke in experimental arthritis,”
models of thyroid cancer: bridging pathogenesis and novel PLoS One, vol. 15, no. 3, article e0230719, 2020.
therapeutics,” Cancer Letters, vol. 469, pp. 35–53, 2020. [83] S. Galland, P. Martin, G. Fregni, I. Letovanec, and
[68] C. Wu, E. Guo, J. Ming et al., “Radiation-induced DNMT3B I. Stamenkovic, “Attenuation of the pro-inflammatory signa-
promotes radioresistance in nasopharyngeal carcinoma ture of lung cancer-derived mesenchymal stromal cells by
through methylation of p53 and p21,” Molecular Therapy- statins,” Cancer Letters, vol. 484, pp. 50–64, 2020.
Oncolytics, vol. 17, pp. 306–319, 2020. [84] H. Liu, Y. C. Xue, H. Deng et al., “MicroRNA modification of
[69] R. Hu, Q. Han, and J. Zhang, “STAT3: a key signaling mole- Coxsackievirus B3 decreases its toxicity, while retaining
cule for converting cold to hot tumors,” Cancer Letters, oncolytic potency against lung cancer,” Molecular Therapy-
vol. 489, pp. 29–40, 2020. Oncolytics, vol. 16, pp. 207–218, 2020.
[70] C. Han, B. K. Choi, S. H. Kim et al., “Polymorphic region- [85] Y. Qiao, Z. Wang, F. Tan et al., “Enhancer reprogramming
specific antibody for evaluation of affinity-associated profile within pre-existing topologically associated domains pro-
of chimeric antigen receptor,” Molecular Therapy-Oncolytics, motes TGF-β-induced EMT and cancer metastasis,” Molecu-
vol. 17, pp. 293–305, 2020. lar Therapy, vol. 28, pp. 2083–2095, 2020.
[71] Y. J. Kim, D. S. Baek, S. Lee et al., “Dual-targeting of EGFR [86] Q. Huang, Q. Wang, D. Li et al., “Co-administration of 20(S)-
and Neuropilin-1 attenuates resistance to EGFR-targeted protopanaxatriol (g-PPT) and EGFR-TKI overcomes EGFR-Disease Markers 13
TKI resistance by decreasing SCD1 induced lipid accumula- [101] M. Tian, X. Wu, T. Lu et al., “Phytochemical analysis, antiox-
tion in non-small cell lung cancer,” Journal of Experimental idant, antibacterial, cytotoxic, and enzyme inhibitory activi-
& Clinical Cancer Research, vol. 38, p. 129, 2019. ties of Hedychium flavum rhizome,” Frontiers in
[87] M. Fan, Y. Han, S. Gao et al., “Ultrasmall gold nanoparticles Pharmacology, vol. 11, p. 572659, 2020.
in cancer diagnosis and therapy,” Theranostics, vol. 10, [102] H. Lee, Y. S. Son, M. O. Lee et al., “Low-dose interleukin-2
no. 11, pp. 4944–4957, 2020. alleviates dextran sodium sulfate-induced colitis in mice by
[88] S. Duan, J. Li, J. Tian et al., “Crosstalk between let-7a-5p and recovering intestinal integrity and inhibiting AKT-
BCL-xL in the initiation of toxic autophagy in lung cancer,” dependent pathways,” Theranostics, vol. 10, no. 11,
Molecular Therapy-Oncolytics, vol. 15, pp. 69–78, 2019. pp. 5048–5063, 2020.
[89] Q. Ben, W. An, Y. Sun et al., “A nicotine-induced positive [103] X. Luo, N. Li, X. Zhao et al., “DHRS2 mediates cell growth
feedback loop between HIF1A and YAP1 contributes to inhibition induced by Trichothecin in nasopharyngeal carci-
epithelial-to-mesenchymal transition in pancreatic ductal noma,” Journal of Experimental & Clinical Cancer Research,
adenocarcinoma,” Journal of Experimental & Clinical Cancer vol. 38, p. 300, 2019.
Research, vol. 39, no. 1, p. 181, 2020. [104] S. W. Scherer, D. S. Feinstein, L. Oliveira, L. C. Tsui, and S. J.
[90] Y. Xiong, L. He, C. Shay et al., “Nck-associated protein 1 asso- Pittler, “Gene structure and chromosome localization to
ciates with HSP90 to drive metastasis in human non-small- 7q21.3 of the human rod photoreceptor transducin gamma-
cell lung cancer,” Journal of Experimental & Clinical Cancer subunit gene (GNGT1),” Genomics, vol. 35, no. 1, pp. 241–
Research, vol. 38, no. 1, p. 122, 2019. 243, 1996.
[91] J. Chen, A. Liu, Z. Lin et al., “Downregulation of the circadian [105] O. C. Ong, K. Hu, H. Rong, R. H. Lee, and B. K. Fung, “Gene
rhythm regulator HLF promotes multiple-organ distant structure and chromosome localization of the GγcSubunit of
metastases in non-small cell lung cancer through human cone G-protein (GNGT2),” Genomics, vol. 44, no. 1,
PPAR/NF-κb signaling,” Cancer Letters, vol. 482, pp. 56–71, pp. 101–109, 1997.
2020. [106] H. Chen, T. Leung, K. E. Giger et al., “Expression of the G
[92] Z. Li, C. Zeng, Q. Nong et al., “Exosomal leucine-rich- protein gammaT1 subunit during zebrafish development,”
Alpha2-glycoprotein 1 derived from non-small-cell lung can- Gene Expression Patterns, vol. 7, pp. 574–583, 2007.
cer cells promotes angiogenesis via TGF-β signal pathway,” [107] D. Lagman, A. Callado-Pérez, I. E. Franzén, D. Larhammar,
Molecular Therapy-Oncolytics, vol. 4, pp. 313–322, 2019. and X. M. Abalo, “Transducin duplicates in the zebrafish ret-
[93] L. Zhou, Y. Jiang, Q. Luo, L. Li, and L. Jia, “Neddylation: a ina and pineal complex:differential specialisation after the tel-
novel modulator of the tumor microenvironment,” Molecular eost tetraploidisation,” PLoS One, vol. 10, article e0121330,
Cancer, vol. 18, no. 1, p. 77, 2019. 2015.
[94] Z. Zhao, N. Zhang, A. Li et al., “Insulin-like growth factor-1 [108] L. E. Sucheston-Campbell, A. I. Clay-Gilmour, W. E. Barlow
receptor induces immunosuppression in lung cancer by et al., “Genome-wide meta-analyses identifies novel taxane-
upregulating B7-H4 expression through the MEK/ERK sig- induced peripheral neuropathy-associated loci,” Pharmaco-
naling pathway,” Cancer Letters, vol. 485, pp. 14–26, 2020. genetics and Genomics, vol. 28, no. 2, pp. 49–55, 2018.
[95] S. Kim, J. Y. Maeng, S. J. Hyun et al., “Extracellular vesicles [109] T. Mulligan and S. A. Farber, “Central and C-terminal
from human umbilical cord blood plasma modulate domains of heterotrimeric G protein gamma subunits differ-
interleukin-2 signaling of T cells to ameliorate experimental entially influence the signaling necessary for primordial germ
autoimmune encephalomyelitis,” Theranostics, vol. 10, cell migration,” Cellular Signalling, vol. 23, no. 10, pp. 1617–
pp. 5011–5028, 2020. 1624, 2011.
[96] X. Chen, Y. Jia, Y. Zhang, D. Zhou, H. Sun, and X. Ma, “α5- [110] J. L. Zhang, M. Liu, C. N. Zhang, E. C. Li, M. Z. Fan, and M. X.
nAChR contributes to epithelial-mesenchymal transition Huang, “Transcriptomic analyses of tributyltin-induced sex-
and metastasis by regulating Jab1/Csn5 signalling in lung ual dimorphisms in rare minnow (Gobiocypris rarus)
cancer,” Journal of Cellular and Molecular Medicine, vol. 24, brains,” Ecotoxicology and Environmental Safety, vol. 156,
no. 4, pp. 2497–2506, 2020. pp. 18–24, 2018.
[97] L. Fang, D. Ly, S. S. Wang et al., “Targeting late-stage non- [111] E. J. Mucaki, J. Z. L. Zhao, D. J. Lizotte, and P. K. Rogan, “Pre-
small cell lung cancer with a combination of DNT cellular dicting responses to platin chemotherapy agents with
therapy and PD-1 checkpoint blockade,” Journal of Experi- biochemically-inspired machine learning,” Signal Transduc-
mental & Clinical Cancer Research, vol. 38, p. 123, 2019. tion and Targeted Therapy, vol. 4, no. 1, p. 1, 2019.
[98] W. Zhou, Y. Liu, Y. Gao et al., “MICAL2 is a novel nucleocy- [112] R. Zou, D. Zhang, L. Lv et al., “Bioinformatic gene analysis for
toplasmic shuttling protein promoting cancer invasion and potential biomarkers and therapeutic targets of atrial
growth of lung adenocarcinoma,” Cancer Letters, vol. 483, fibrillation-related stroke,” Journal of Translational Medicine,
pp. 75–86, 2020. vol. 17, no. 1, p. 45, 2019.
[99] C. Wei, X. Dong, H. Lu et al., “LPCAT1 promotes brain [113] B. X. Liu, G. J. Huang, and H. B. Cheng, “Comprehensive
metastasis of lung adenocarcinoma by up-regulating analysis of core genes and potential mechanisms in rectal
PI3K/AKT/MYC pathway,” Journal of Experimental & Clini- cancer,” Journal of Computational Biology, vol. 26, no. 11,
cal Cancer Research, vol. 38, p. 95, 2019. pp. 1262–1277, 2019.
[100] C. Wei, X. Dong, H. Lu et al., “Novel lncRNA-IUR suppresses [114] A. de-la-Torre, C. T. Silva-Aldana, J. Muñoz-Ortiz et al.,
Bcr-Abl-induced tumorigenesis through regulation of “Uveitis and multiple sclerosis: potential common causal
STAT5-CD71 pathway,” Molecular Cancer, vol. 18, p. 84, mutations,” Molecular Neurobiology, vol. 56, pp. 8008–8017,
2019. 2019.14 Disease Markers
[115] S. K. Harten, M. A. Esteban, D. Shukla, M. Ashcroft, and P. H.
Maxwell, “Inactivation of the von Hippel-Lindau tumour
suppressor gene induces Neuromedin U expression in renal
cancer cells,” Molecular Cancer, vol. 10, p. 89, 2011.
[116] M. Fruzangohar, E. Ebrahimie, and D. L. Adelson, “A novel
hypothesis-unbiased method for Gene Ontology enrichment
based on transcriptome data,” PLoS One, vol. 12, article
e0170486, 2017.
[117] J. Lee, E. R. Snyder, Y. Liu et al., “Reconstituting development
of pancreatic intraepithelial neoplasia from primary human
pancreas duct cells,” Nature Communications, vol. 8,
p. 14686, 2017.
[118] V. G. Martinez, J. Crown, R. K. Porter, and L. O'Driscoll,
“Neuromedin U alters bioenergetics and expands the cancer
stem cell phenotype in HER2-positive breast cancer,” Inter-
national Journal of Cancer, vol. 140, pp. 2771–2784, 2017.
[119] T. Ensho, K. Maruyama, K. Mori et al., “Neuromedin U
precursor-related peptide (NURP) exerts neuromedin U-
like sympathetic nerve action in the rat,” Biochemical and
Biophysical Research Communications, vol. 492, no. 3,
pp. 412–418, 2017.
[120] X. Yang, C. C. Wang, W. Y. W. Lee, J. Trovik, T. K. H. Chung,
and J. Kwong, “Long non-coding RNA HAND2-AS1 inhibits
invasion and metastasis in endometrioid endometrial carci-
noma through inactivating neuromedin U,” Cancer Letters,
vol. 413, pp. 23–34, 2018.
[121] X. G. Chen, L. Ma, and J. X. Xu, “Abnormal DNA methyla-
tion may contribute to the progression of osteosarcoma,”
Molecular Medicine Reports, vol. 17, pp. 193–199, 2018.
[122] J. Watteyne, K. Peymen, P. Van der Auwera et al., “Neurome-
din U signaling regulates retrieval of learned salt avoidance in
a C. elegans gustatory circuit,” Nature Communications,
vol. 11, p. 2076, 2020.
[123] A. C. Kaushik, A. Mehmood, D. Q. Wei, and X. Dai, “Systems
biology integration and screening of reliable prognostic
markers to create synergies in the control of lung cancer
patients,” Frontiers in Molecular Biosciences, vol. 7, p. 47,
2020.
[124] G. M. Jowett and J. F. Neves, “Commentary: neuronal regula-
tion of type 2 innate lymphoid cells via neuromedin U,” Fron-
tiers in Pharmacology, vol. 9, p. 230, 2018.
[125] S. Peng, Y. Lu, P. Li et al., “The short interference RNA
(siRNA) targeting NMUR2 relieves nociception in a bone
cancer pain model of rat through PKC-ERK and PI3K-AKT
pathways,” Biochemical and Biophysical Research Communi-
cations, vol. 512, pp. 616–622, 2019.
[126] L. Lu, R. Wang, and M. Luo, “An optical brain-to-brain inter-
face supports rapid information transmission for precise
locomotion control,” Science China. Life Sciences, vol. 63,
pp. 875–885, 2020.
[127] K. Maruyama, H. Kaiya, M. Miyazato, N. Murakami,
K. Nakahara, and K. Matsuda, “Purification and identifica-
tion of native forms of goldfish neuromedin U from brain
and gut,” Biochemical and Biophysical Research Communica-
tions, vol. 517, no. 3, pp. 433–438, 2019.
[128] L. Lu, Y. Ren, T. Yu et al., “Control of locomotor speed,
arousal, and hippocampal theta rhythms by the nucleus
incertus,” Nature Communications, vol. 11, no. 1, p. 262,
2020.You can also read