Initial Field Testing Results from Building-Integrated Solar Energy Harvesting Windows Installation in Perth, Australia - ClearVue PV
←
→
Page content transcription
If your browser does not render page correctly, please read the page content below
applied
           sciences
Article
Initial Field Testing Results from Building-Integrated
Solar Energy Harvesting Windows Installation in
Perth, Australia
Mikhail Vasiliev * , Mohammad Nur-E-Alam               and Kamal Alameh
 Electron Science Research Institute (ESRI), School of Science, Edith Cowan University, 270 Joondalup Dr,
 WA 6027, Australia; m.nur-e-alam@ecu.edu.au (M.N.E.-A.); k.alameh@ecu.edu.au (K.A.)
 * Correspondence: m.vasiliev@ecu.edu.au
                                                                                                       !"#!$%&'(!
 Received: 9 August 2019; Accepted: 23 September 2019; Published: 24 September 2019                    !"#$%&'

 Featured Application: Unconventional, highly transparent building integrated photovoltaics.

 Abstract: We report on the field testing datasets and performance evaluation results obtained
 from a commercial property-based visually-clear solar window installation site in Perth-Australia.
 This installation was fitted into a refurbished shopping center entrance porch and showcases the
 potential of glass curtain wall-based solar energy harvesting in built environments. In particular,
 we focus on photovoltaic (PV) performance characteristics such as the electric power output, specific
 yield, day-to-day consistency of peak output power, and the amounts of energy generated and stored
 daily. The dependencies of the generated electric power and stored energy on multiple environmental
 and geometric parameters are also studied. An overview of the current and future application
 potential of high-transparency, visually-clear solar window-based curtain wall installations suitable
 for practical building integration is provided.

 Keywords: renewables; energy saving and generation; built environments; solar windows; advanced
 glazings; photovoltaics

1. Introduction
      The global building integrated photovoltaics (BIPV) market is likely to expand from USD 6.7
billion to USD 32.2 billion by 2024, witnessing a compound annual growth rate (CAGR) of 23.4%
over the forecast period [1]. This growth trend is due to both the increasing availability of new
and innovative BIPV products, and the growing attention of the architects, city planners, property
developers, and governments towards the sustainable construction practices and the integration
of renewable energy generators into urban landscapes. At the same time, the worldwide annual
energy consumption continues to grow, and is projected to exceed 0.74 billion TJ by 2040, with the
generation contributions from fuels other than coal (mainly renewables) being on the increase [2].
Global warming-related concerns and environmental protection trends and policies also continue
to favor the development of renewable energy generation and storage facilities [3–6]. At present,
the BIPV technologies and products are only beginning to experience their expected widespread
adoption, and a range of di↵erent novel technologies are being introduced into the well-established
market of construction materials [7–12]. The benefits of distributed energy generation (an approach
based on employing a combination of small-scale technologies to produce electricity close to the end
users of power) include the avoidance of significant transmission-line losses and the provision of
blackout resistance. Generating electricity at the point of its use can also lead to making the urban
built environments potentially grid-independent, even if this energy supply independency is provided

Appl. Sci. 2019, 9, 4002; doi:10.3390/app9194002                                  www.mdpi.com/journal/applsci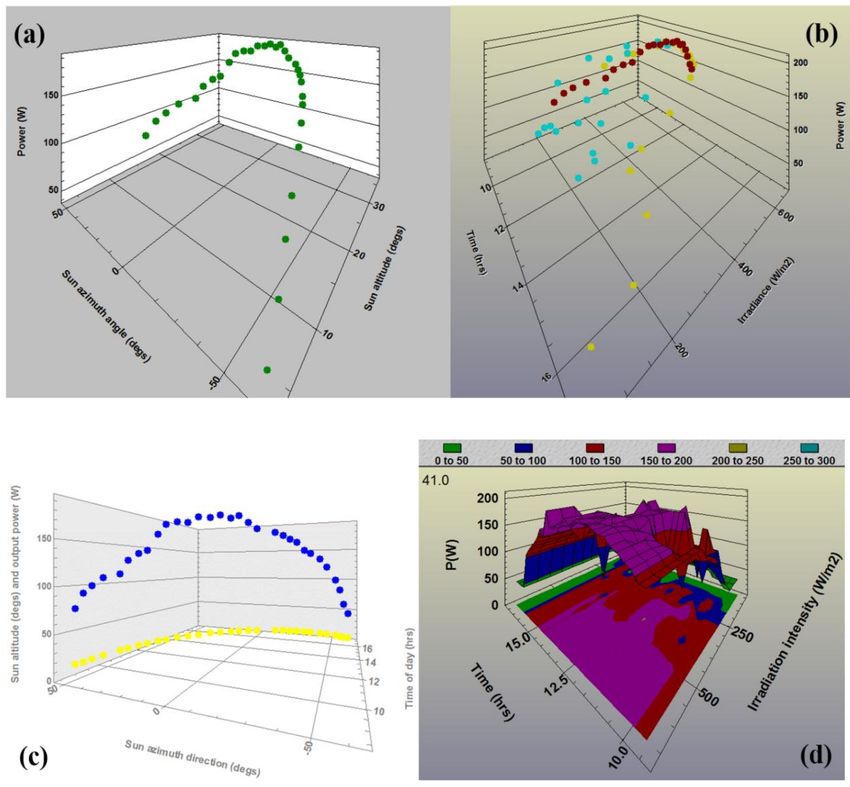
Appl. Sci. 2019, 9, 4002                                                                              2 of 18

only on limited time-scales. Multiple recent literature sources emphasize the importance of distributed
generation networks and the development of sustainable microgrids [13–15]. Advanced building-scale
integration of renewable energy generators utilizing most of the available deployment areas, including
walls and windows, can lead towards future city-scale distributed generation networks in “smart
cities”. Additionally, the emergent concept of “smart facades” that provide locally window-embedded
self-powering environmental sensor systems integrated with window-powered equipment, such as
motorized blinds, is gaining increasing attention in commercial engineering circles [16]. The most
desired attributes of building wall-integrated PV are either the highly-transparent, perfectly-clear visual
appearance, or a possibility of significant (active or passive) control over their transparency, appearance,
and color. A number of recent and detailed reviews of the current trends in BIPV are available [17–20],
with the most recent sources underscoring the importance of transparent photovoltaics and solar
windows, which have just started to appear on the market at present, packaged as installation-ready
framed systems suitable for long-term environmental exposure.
      The importance of energy-efficient construction practices is currently gaining substantial attention
from multiple governments and research groups worldwide, leading to the emergence of a large range of
principally new construction materials and their components, such as advanced coatings which ensure
improved thermal insulation and/or change transparency in response to external conditions [21]. It is
the combination of the energy saving and energy generation functionalities possible to be engineered
in modern windows that is of primary interest for leading architects and property developers. In early
2019, Vicinity Centres (a real estate investment trust company based in Melbourne, Australia) has
installed 18 transparent solar windows supplied by Clearvue Technologies Ltd. (Perth, Australia),
into a refurbished entrance porch of Warwick Grove Shopping Centre in Warwick (a northern suburb of
Perth), in order to evaluate their suitability and practical application potential in commercial property
settings. The installation site is illustrated in Figure 1.
      The solar window design type was derived from the previous transparent solar window designs,
multiple prototype models of which have been developed by Edith Cowan University (ECU) and
Clearvue Technologies over several recent years and were trialed in 2017 at a grid-independent
bus stop in Melbourne [22]. Several engineering features related to the glazing system structure,
window size, system packaging-related details, and solar modules circuitry implementation have
changed since these were reported originally [22], improving the peak-rated electric power output
of transparent solar windows towards 30 Wp /m2 , measured at standard test conditions (STC)
using the manufacturer-sourced large-scale flash-lamp PV testing equipment. The core design and
assembly-related features of solar windows remained almost the same, and included the triple-glazed
structure, low-iron glass plates, low-emissivity heat-mirror coating, and particles of high Stokes-shift
inorganic luminescent materials embedded into a lamination interlayer. More technical details
are available from [23–26], whist the general system design philosophy has been derived from
the approaches reported throughout the last several decades in [27–30], and in references therein.
This present study represents, to the best of our knowledge, a world-first report on the field performance
characteristics and practical application potential of high-transparency, clear glass-based solar windows
built using all-inorganic functional materials, in built environments where the windows are mounted
in multiple geometric orientations.
      The following sections of this article provide the installation-specific microgrid configuration
details, the results of preliminary microgrid modelling, and the results of a case study of the energy
harvesting efficiency conducted over May–June 2019. Additional datasets extending the system
monitoring results until early September 2019 are presented within the Supplementary data file (Table
S1 and multiple additional Worksheets within the file). We then summarize the data and main results,
providing an outlook for the future application potential of transparent solar windows, and propose
some new future application areas.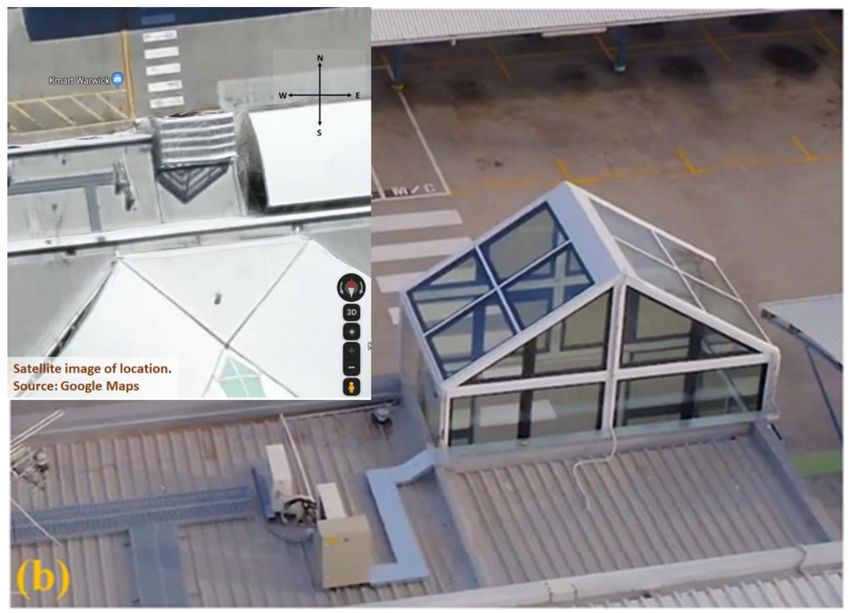
Appl. Sci. 2019, 9, 4002                                                                                      3 of 18

      Figure 1. Entrance porch (atrium) of Warwick Grove Shopping Centre in Warwick (Perth, WA, Australia)
      constructed using 18 solar windows supplied by Clearvue Technologies Ltd. (Perth, WA, Australia).
      (a) front view and (b) top view, with the inset showing satellite image of the same entrance atrium
      structure prior to solar windows installation. The site orientation-related data are also shown; the roof
      sides are tilted at ⇡ 37 from horizontal plane.

2. System Design Features, Methodologies of Energy Harvesting Performance Assessment,
and Principal Results
     Each of the 18 solar windows, factory-assembled at Qingdao Rocky Technical Glass Co., Ltd.
(Qingdao, China) have been re-tested following their shipment to Perth, in outdoor morning sunlight
conditions, confirming stable operation and the expected power outputs. Approximately (27 ±
1) W of electric output has been obtained from each window at close to their optimal geometric
orientation and tilt angles towards the incoming natural sunlight, and at solar module surfaces being at
> 37 C. The weather conditions in mid-April in Perth (at the time of testing) were typical for autumn,
and without strong UV irradiation background (likely at UV index near 5, out of the yearly maximum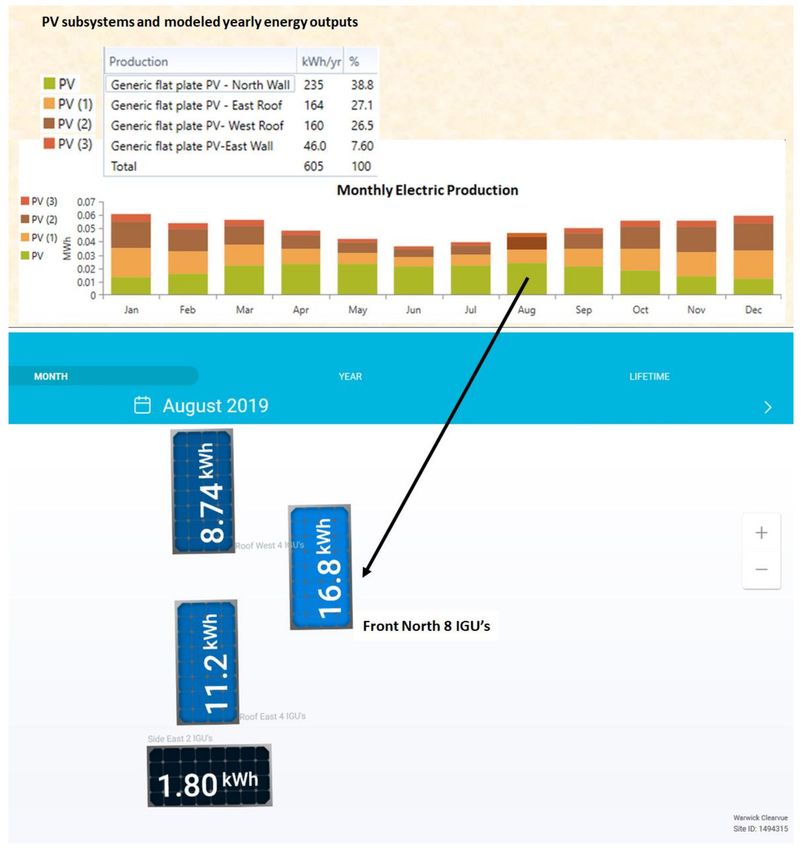
Appl. Sci. 2019, 9, 4002 4 of 18
of 12 [31]). The typical measured output parameters from each window were as follows: Open-circuit
voltage Voc = 58.85V, short-circuit current Isc = 0.723 A, and Fill Factor FF = 0.639. The maximum
power point (MPP) parameters corresponded to VMPP = 49.5 V and IMPP = 0.55 A. The same windows
of area size near 1.3 m2 (1.087m ⇥ 1.2m) have been tested at STC previously, resulting in electric outputs
being in excess of 36 W; the di↵erences with the outdoor test results were due to both the solar cell
temperature e↵ects, and also the weather-dependent solar irradiation power density. The strip-shaped
PV modules used in solar windows at and near their glass panel edges were custom-fabricated by China
Solar Ltd. (Shenzhen, China), by way of encapsulating multiple series-connected monocrystalline
silicon cells of nominal efficiency near 20%, using a proprietary process.
2.1. System Configuration Features and Preliminary Modeling Results
Three principal deployment areas were available on-site for the installation of 16 unshaded
solar window units: (i) An East-facing tilted roof section, with 4 parallel-connected windows;
(ii) a North-facing vertical wall section, containing 8 windows, and (iii) a West-facing tilted roof section
with 4 windows. An additional deployment area on the east-facing vertical wall housed 2 more
window units, which were strongly shaded by the nearby car-park roofing during most of the daylight
hours. The shopping center atrium installation at Warwick Grove Shopping Centre (Figure 1) was
completed in early 2019 [32], and a systematic study of its energy harvesting performance commenced
in May 2019, following a short period of initial configuration tests and some reconfiguration of the
microgrid equipment and circuitry used. Vicinity Centres has stated their commitment to achieving
Net Zero carbon emissions by 2030 [33], and solar energy harvesting can be expected to play a major
role in reaching this objective. Vicinity Centres’ giant solar energy program and roadmap of renewable
energy installations have led to winning the “People’s Choice” award at the Property Council of
Australia/Rider Levett Bucknall Innovation and Excellence Awards 2019 [34].
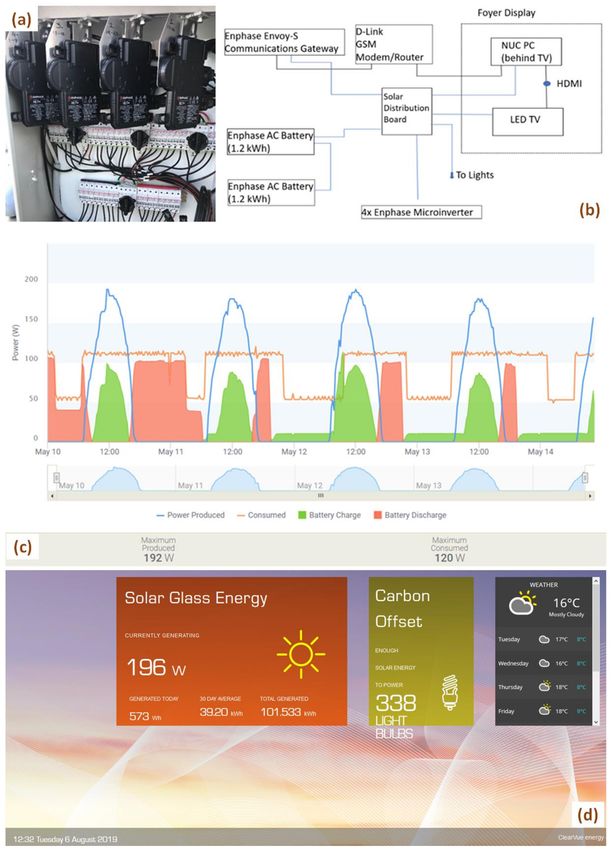
Figure 2 shows a graphical summary of the microgrid circuitry details and equipment configuration
installed, as well as sample plots of the daily power generation and use waveforms recorded by
Enphase Energy’s Enlighten Systems applications programming interface (API) over several days in
May 2019. Four Enphase microinverters (Enphase Energy Inc., Fremont, CA, USA) were installed
to service the four separate solar window installation areas described above; each microinverter
collected the combiner-box bundled parallel-connected electric output from the windows placed into
each installation area. A LED TV panel (powered by the generated energy stored in batteries) was
installed in the shopping center entrance foyer and was configured to display a graphic summary of
the system operation state (also shown in Figure 2). The main system parameters displayed, related
to the generation of energy and carbon o↵set capacity, were also configured for online live internet
broadcasting at http://tcp.iotstream.io/vicinity-warwickgrove/index.php. The live power generation
data are being refreshed every 15-20 minutes, and the amounts of daily and total generated energy
(since May 14, 2019) are also shown. Electric loads other than LED TV included a computer system
(Intel NUC small-form mini PC), modem (D-Link GSM), and two 30 W LED ceiling lamps within the
foyer area, used continually for about 12 h daily. The energy storage was enabled by installing twin
LiFePO4 Enphase AC batteries providing 1.2 kWh capacity each. The Enphase Envoy-S Metered™
communications gateway system delivered the real-time solar production and energy consumption
data to Enphase Enlighten™ monitoring and analysis software for comprehensive, remote maintenance
and management of the complete microgrid system. Fuses were installed into each window’s output
cabling lines to safeguard against any possible issues related to the accidental (however unlikely)
electric faults leading to the high reverse-current loading of any individual modules. These protective
components were necessary, considering the high maximum Isc (~0.75 A) generated by individual
PV windows, and the numbers (up to 8) of the parallel-connected window modules installed into
bundles. Parallel electric connection of the individual windows placed into the same deployment areas
(presumed uniformly lit in clear weather conditions) has been selected to improve the stability of the
combined electric output to di↵erential shading e↵ects, originating from the possible glass surface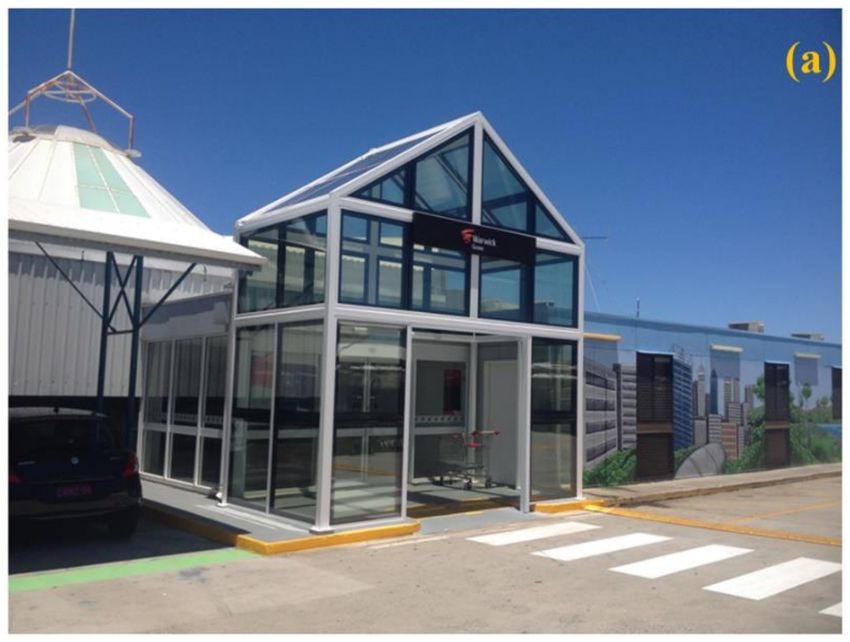
Appl. Sci. 2019, 9, 4002                                                                                    5 of 18

contamination and variable cloud-related shading. Additionally, this allowed minimization of the
system output voltage to safe levels, and the selection of a suitable low-power microinverter model with
matched electric input characteristics and having maximum power point tracking (MPPT) capabilities.
The benefits of using the parallel and also the massively-parallel electric circuit configurations of PV
modules installed into low-power solar energy harvesters have been well documented and reported
previously [35].

      Figure 2. A graphical summary of the microgrid configuration details (a,b), sample data logs for the
      daily energy generation and use (c), and a photo of TV screen data showing a summary of system
      state (d), which is also available through live Internet broadcast at http://tcp.iotstream.io/vicinity-
      warwickgrove/index.php with 15-minute data sampling intervals.

     Predictive modelling of the electric energy outputs expected to be generated by the atrium
installation and each of its parts annually (and also monthly) has been performed using HOMER Pro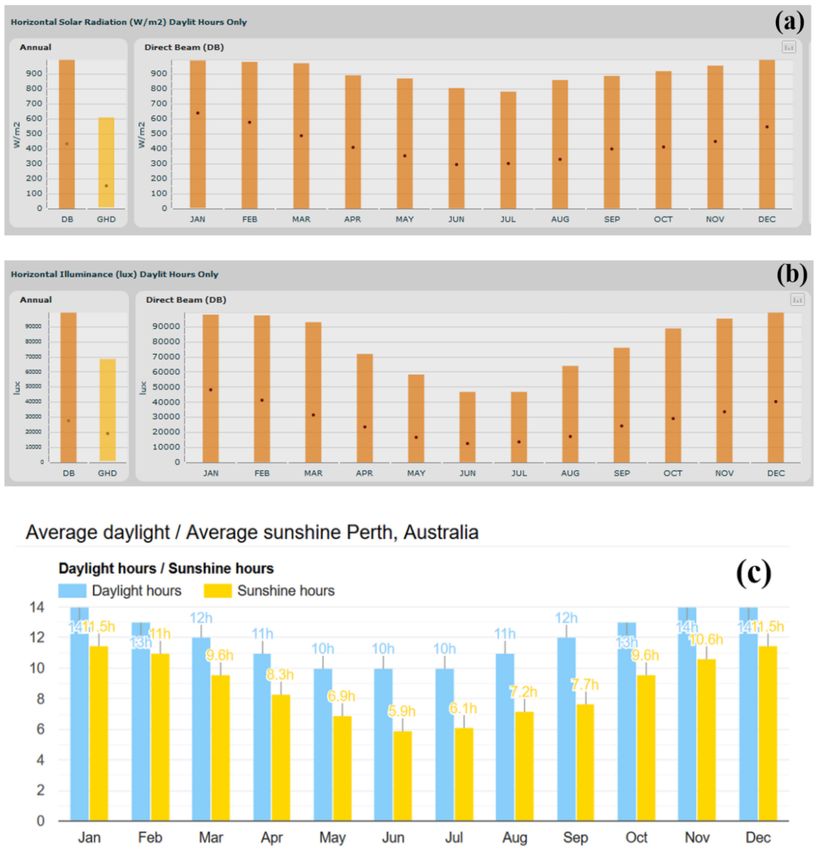
Appl. Sci. 2019, 9, 4002                                                                            6 of 18

microgrid analysis software package (HOMER Energy Inc., Boulder, CO, USA). The unconventional
PV generators (solar windows) have been approximated in the software-assisted microgrid model as
“generic flat plate PV” outputting 30 W per window at peak irradiation conditions, at the nominal
operating cell temperature (NOCT). This power rating per window closely approximates their expected
performance at the peak orientation and peak-weather conditions, when the temperature of solar
cell surfaces is near 40 C. The model has also fully accounted for the local monthly and yearly
climate-related solar irradiation datasets corresponding to the exact geographic location of installation.
The geometric orientation (tilt) and also the azimuth orientation angles of all system parts were fully
accounted for in the software model. Figure 3 shows a graphical summary of the energy generation
modeling results, obtained for each PV windows subsystem and for the overall atrium installation.

      Figure 3. A summary of the predicted monthly and yearly microgrid energy output results modeled
      using HOMER Pro software package; the measured electric energy generation amounts during the
      month of August 2019 are also shown (data obtained from the Enphase Enlighten™ monitoring
      software records).

     The modeling results indicated that the annual energy output in excess of 0.6 MWh can be
expected, composed mainly of the roof sections contribution over the warmer months, and dominated
by the contributions from the North Wall section between April and August. The atrium’s measured
monthly energy production during August 2019 (from the data logged by the Enphase Enlighten™
monitoring system) was 38.54 kWh, which was about 10% less than the corresponding monthly output
predicted by the software model, not accounting for the small extra contributions from the strongly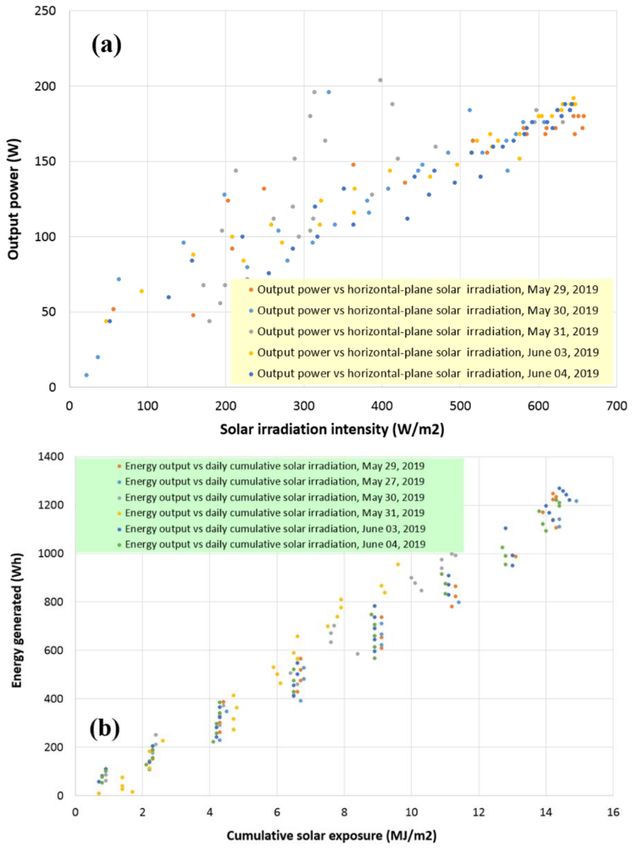
Appl. Sci. 2019, 9, 4002                                                                           7 of 18

shaded East Wall window units (which were nevertheless modeled as two 30W east-facing generators
placed vertically). The measured monthly electric energy output from the North Wall units in August
was 16.8 kWh (or 43.6% of the total generated energy), which also corresponded closely to the model
predicting about 50% energy contribution from these units. The north-oriented front entrance windows
have frequently been subjected to the intermittent shading conditions from the people traffic, reducing
the power generation. Considering the local annual sun-path geometry, strong contributions from
the vertically-mounted North Wall windows were also expected during the colder months, when the
mid-day Sun altitude angles are low, and with the Sun azimuth direction shifting towards north,
even at sunrise times. In addition, the Supplementary data file (Table S1) contains multiple daily
generation data records obtained during this study from the installation measurement systems and
other system observation datasets.

2.2. Detailed System Performance Observations, Evaluation, and Analysis
     After configuring the microgrid connections, electric loads, storage system, and system
management software in May 2019, a detailed case study of the system performance started,
and the electric characteristics were monitored almost daily, at regular time intervals, and in varying
weather conditions. The amounts of storage-ready electric energy generated by all four individual
(di↵erently-oriented) bundles of solar windows were monitored in di↵erent conditions. Energy losses
at the microinverters and inside cabling would have amounted to several percent of the total generated
energy, yet these were ignored and not monitored specifically. Regular system performance and electric
output observations continued until the end of June 2019, resulting in obtaining a large dataset suitable
for system performance characterization. Weather-dependent solar irradiation and cumulative daily
solar exposure data were also collected (at the same times as the electric outputs) from the online live
data broadcasts of nearby Wanneroo Weather Station operated by the Department of Primary Industries
and Regional Development, Government of Western Australia [36]. Additional solar geometry-related
data for the current (and local) Sun azimuth and Sun altitude angles at the times of data logging were
recorded from SunCalc.org online solar astronomy calculator [37].
     Figure 4 shows the dependencies of the generated electric power and stored energy on the time
of day, measured over several sunny days in May and June of 2019. It is interesting to note the high
consistency of the power generation on di↵erent sunny days, even measured weeks apart. The e↵ects
of variable weather conditions such as cloud cover are also seen in the graphs.

                                             Figure 4. Cont.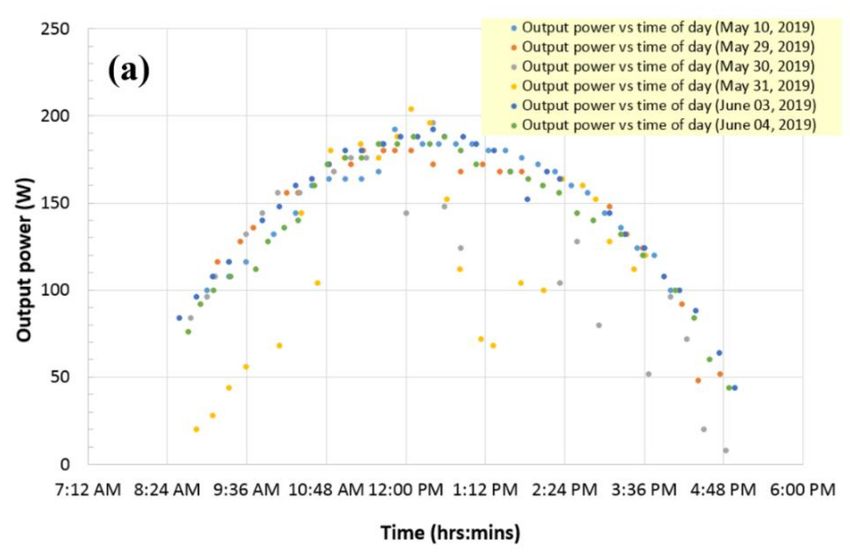
Appl. Sci. 2019, 9, 4002                                                                                  8 of 18

      Figure 4. Energy harvesting performance of 18-window solar atrium versus time of day. (a) Electric
      power output readings recorded over several days in May-June 2019; (b) the amounts of stored electric
      energy vs time of day; the data points used are from the same dataset of system-state records as in
      part (a).

      It can also be noted from the data of Figure 4 that the time distribution of the power generation
follows the “bell curve” shape well-known in conventional roof-based PV installations. This is
despite the fact that this installation does not include any optimally-tilted, north-oriented roof sections,
but rather is composed of an unequal number of PV generators placed into four deployment areas of
substantially di↵erent geometric orientations, tilts, and shading exposure conditions. Also notable is
the almost-linear time dependency of the stored electric energy, observed until late afternoons on sunny
days. Considering that the sun-path geometry over the course of day involves large changes in both
the azimuth and sun altitude angles, all occurring simultaneously with weather- and time-dependent
irradiation intensity variations across all planes, these data confirm that all four main parts of this
solar-window atrium provided important contributions to the daily energy generation function.
      Figure 5 shows the solar irradiation intensity dependencies of the output power (recorded on
di↵erent sunny days during the study), and the dependency of stored electric energy on the total
cumulative amount of incoming solar energy received during the day by each 1m2 of horizontal (land)
surface area. Both datasets are notable in terms of the data points clustering around nearly-linear
function shapes. Since only the horizontal-plane solar irradiation intensity was measured by the weather
station, and because most of the daily total energy was being generated by the eight vertically-mounted
north-facing windows, the data trends seen in Figure 5a,b (and also in Figure 4b) confirm the relative
insensitivity of the electric power output and energy storage rate on the geometry of sunlight incidence.
This is because the transparent solar windows are of solar concentrator design type, which improves
the angular stability of power generation compared to conventional PV panels.
      It can be noted from Figure 5a that the maximum output power readings have been recorded
for moderate horizontal-plane solar irradiance values between 300-400 W/m2 . These irradiances
correspond to the smaller Sun altitude angles during the morning hours, when a stronger UV
irradiation background is usually present (compared to the afternoon hours), and colder ambient
air temperatures. A combination of incidence angles (in both the horizontal and vertical planes)
thus exists, favoring the power generation from the east-tilted roof and also the north-facing wall
sections. A maximum electric power output registered so far was 232 W, recorded on May 08,
2019, shortly after 11 am. Since this data point was acquired outside a systematic study conducted
later, it hasn’t been included in the dataset of Figure 5. For sunny Australian autumn days in May,
each 1 kWh (3.6 MJ) of harvested electric energy corresponded to approximately 11 MJ/m2 of daily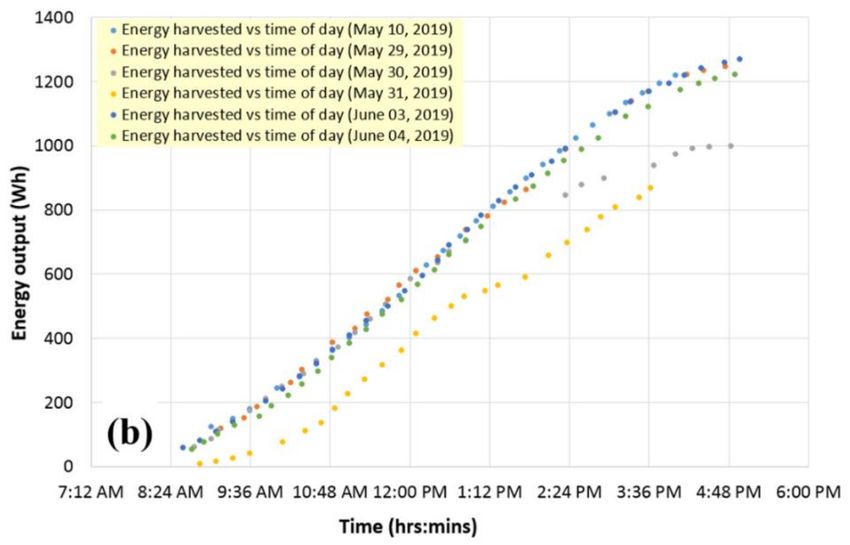
Appl. Sci. 2019, 9, 4002                                                                                      9 of 18

land-area cumulative solar exposure. Considering the land-area footprint of this atrium structure
being approx. 12.5 m2 (5m ⇥ 2.5 m), the combined (installation-scale) direct estimate of its actual
solar energy harvesting efficiency is then approximately 2.6%. This figure is only marginally smaller
than the rated efficiency of individual solar windows at standard test conditions (~3.0%), despite the
absence of any optimally-tilted deployment areas and seasonal weather conditions without strong UV
irradiation background. Interestingly, these field-measured performance data show some contrast
with the recently reported figures for the “real” (field-measured) energy harvesting efficiencies of
conventional PV generator types (solar panels) evaluated in major Australian cities [38]. In particular,
these field-evaluated (”real”) efficiencies of most conventional solar panel types stood at only about
one-half of their rated energy conversion efficiency specifications. Environmental factors such as partial
shading and soiling of solar panels, and installation-related geometric factors such as panel orientation
and tilt angles, all a↵ect the energy harvesting performance characteristics significantly [39–42].

      Figure 5. Energy harvesting performance vs solar exposure parameters. (a) Output power vs solar
      irradiation intensity measured in the horizontal plane by a local weather station; (b) generated electric
      energy vs daily land-area cumulative solar exposure (measured by the same weather station since
      midnight of the same day).

     Table 1 shows an example of a typical daily system-related and environmental data-related dataset
obtained during the study. It is important to note, that Enphase data interface has always rounded the
output power readings to the nearest even number of Watts; this is possibly related to the fact that
Appl. Sci. 2019, 9, 4002 10 of 18
the live data were sampled in 3-minute intervals, followed by the data averaging occurring every 15
minutes prior to internet broadcasting. Also, the cumulative solar exposure figures have apparently
been adjusted by the weather station (however infrequently), to sometimes correct the sensor readings
towards smaller values (compared to the data published at previous data sampling intervals) during
the course of day.
Table 1. Example of the daily dataset collected from the installation data interface and online data
sources on June 4th , 2019.
Energy Power Solar exposure Horiz. Irradiance Sun Altitude Sun Azimuth
Time
stored (Wh) (W) (MJ/m2 ) (W/m2 ) (degs) (degs)
8:43 54 76 0.8 255 15.8 50.09
8:54 77 92 0.8 286 17.56 48.17
9:06 102 100 0.9 317 19.41 46.01
9:21 129 108 2.1 363 21.64 43.18
9:44 157 112 2.3 432 24.83 38.55
9:55 189 128 2.3 460 26.24 36.21
10:10 223 136 4.1 493 28.04 32.88
10:22 258 140 4.2 526 29.37 30.11
10:37 298 160 4.2 554 30.88 26.5
10:49 341 172 4.3 585 31.95 23.51
11:05 385 176 4.3 592 33.19 19.37
11:20 429 176 6.5 611 34.14 15.37
11:35 475 184 6.5 624 34.87 11.25
11:52 521 184 6.5 640 35.42 6.5
12:07 568 188 8.9 642 35.67 2.25
12:22 614 184 8.9 640 35.67 357.98
12:35 661 188 8.9 634 35.48 354.3
12:50 706 180 8.9 629 35.05 350.08
13:04 749 172 8.8 618 34.44 346.22
13:35 834 168 11 582 32.42 337.98
13:51 875 164 11 568 31.03 333.95
14:04 915 160 10.9 542 29.76 330.8
14:19 954 156 12.8 514 28.12 327.31
14:35 990 144 12.8 467 26.2 323.76
14:50 1025 140 12.7 441 24.25 320.6
15:15 1093 132 14 351 20.71 315.66
15:35 1123 120 13.9 314 17.66 311.99
16:04 1175 100 13.8 221 12.93 307.09
16:21 1196 84 14.4 157 10.02 304.42
16:35 1211 60 14.4 127 7.57 302.32
16:53 1222 44 14.3 52 4.36 299.74
The datasets shown in Figure 6 illustrate the details of the atrium’s power generation trends with
respect to the variables such as the solar path-related angles, instantaneous irradiance intensity, time of
day, and weather conditions. During this study conducted over autumn and winter months, the Sun
altitude angle reached a maximum of only about 36 near mid-day, and therefore the solar atmospheric
path-length always exceeded its standardized value (air-mass 1.5, corresponding to the AM1.5 NREL
standard for solar spectrum measurements). Solar azimuth angles, on the other hand, varied across
a wide range between about 40 (NNE) and 60 (WNW) between 9:00 and 17:00. The electric output
power correlated well with both the Sun altitude angle and horizontal-plane irradiance, despite most
of the power generation obtained consistently (throughout the days) from the north-oriented vertical
wall of windows. It is important to note (Figure 6d) that the output power readings exceeding 150 W
(out of the typical maximum-recorded output powers near 200 W) have been obtained consistently
on di↵erent days, in a range of solar exposure conditions, between 10:00 and 15:00, and at a large
range of horizontal-plane solar irradiance variations (between about 250–650 W/m2 ). This confirms the
capability of this solar window atrium to collect energy efficiently in a wide range of solar incidenceAppl. Sci. 2019, 9, 4002 11 of 18
geometry conditions, at least during clear and sunny weather conditions. The dataset of Figure 6d
has only been collected over several weeks (and therefore, not all possible independent time/solar
irradiation variable combinations could be evaluated); it also contains some weather-related “noise”
a↵ecting the low-power readings. This dataset is, however, quite representative of the system power
generation capabilities seen during most winter conditions on sunny, cloudless days. We included this
additional two-dimensional surface-plot representation as “a guide for the eye” only, to demonstrate
and visualize the time- and weather-related correlations of the output power. The irradiation data
used for plotting Figure 6d have been grouped, so that all data points for the horizontal irradiation
values measured inside small intervals between eg 150–200 W/m2 were all assigned a 200 W/m2 value
for plotting. For all “missing” output power data points (due to the limited duration of study not
covering all possible weather conditions) corresponding to some locations across the time-irradiance
data grid used, these points were approximated to correspond to the minimum actually measured
power values observed at boundaries of the corresponding data intervals.
The amounts of electric energy generated by each individual sub-section of the atrium installation
have also been monitored. During the daylight hours of May 28, the daily total energy generation by the
two shaded east-wall windows was only 54 Wh, while the four east-roof windows produced 268 Wh,
and the 8 windows on northern wall contributed 743 Wh; the 4 west-roof windows generated 191 Wh.
On a di↵erent day (June 03, 2019, which was slightly sunnier than May 28), the 8 front-wall windows
produced a total of 794 Wh of energy during the daylight hours. Therefore, the vertically-mounted
north-oriented wall windows, which were often shaded temporarily by the people traffic near the
shopping center entrance, contributed daily, on average, almost 100 Wh per window unit, in late-autumn
conditions. Per unit window module, the daily energy generation from shaded windows (on eastern
wall) was a factor of 3.4 smaller compared to the north-facing vertically-mounted units. Increased
energy collection efficiencies are expected to be observed during the spring and summer months,
due to both the stronger solar irradiation intensity levels, and (most importantly) the substantially
longer daily sunshine durations. The Supplementary data file (Table S1) contains daily-total energy
generation data for all window groups, as measured by the system after sunset each day, for the
period between May-early September 2019. The angle-dependent solar illumination flux-cross-section
di↵erences between the vertically-mounted and peak-tilted window orientations (eg if placed onto
optimally-tilted North-facing roof section) are also significant. These geometric factors correspond
to approximately a factor of (1/cos45 ) in peak-power output di↵erence, which allows predicting
the orientation-related increases in the energy outputs per window by up to several tens of percent,
in future optimally-mounted units. In conventional southern-hemisphere PV installations, the preferred
geometric orientation of PV panels corresponds to mounting them on building roof sections facing
the North direction (with the horizontal projection of the normal to the solar-cell area aligned with
azimuth 0 ) and tilted to the horizontal plane at an angle equaling the local latitude. This optimizes
the daily (for most seasons), and also the yearly energy production by ensuring a close-to-normal
incidence angle of the solar radiation onto cells at times around midday. Other factors which may
a↵ect the precise PV panel orientation preferences include the site-specific shading conditions, and the
preferences of system owners in relation to their peak energy production requirements being shifted
towards either the morning or evening hours. A common way to approximate the expected daily
energy production per orientation-optimized panel is by multiplying the rated nominal (peak) power
(measured at standard testing conditions) by the number of peak-equivalent sunshine hours. The latter
depend significantly on the geographic location and the day of year, but the data are often available
from industry publications reliant on the local weather bureau data. The panel orientation-dependent
solar irradiation flux intercepted by the PV panels is also modified according to the cosine function of
the angle between the panel normal and the Sun direction. Therefore, if at noon the Sun altitude is
at 45 , a vertically-positioned north-facing PV panel will generate about 0.7 of the amount of energy
(produced per unit time) by an optimally-tilted, north-oriented roof panel.Appl. Sci. 2019, 9, 4002 12 of 18
Figure 6. Electric output power trends observed with respect to the solar geometry and
irradiation-related parameters. (a) 3D scatter plot of the output power vs the Sun azimuth and
Sun altitude angles; (b) 3D scatter plot of the output power vs the time of day and the horizontal-plane
solar irradiation intensity; (c) 3D scatter plot of the output power shown in correlation with the
Sun altitude angle, vs the Sun azimuth direction and the time of day; (d) 3D surface plot (and
its corresponding 2D contour plot shown in the X-Y plane underneath) illustrating the variations
in the electric output power with both the time of day, and the instantaneous weather-dependent
(horizontal-plane) solar irradiation intensity. The data were collected over the entire period of study
(about 2 months) covering a wide range of weather conditions observed at regular intervals at most
times of day.
A yearly-averaged estimate for the daily energy output per 1m2 of solar window area can therefore
be made, based on the observed data, being near 0.1 kWh/m2 , presuming that installation sites are
configured favoring the north-facing, azimuth-optimized window orientations. For future dome-type
installations, the average daily energy outputs per window can be predicted, by averaging the data
from the three main (unshaded) parts of Warwick Grove atrium installation, leading to estimates near
70 Wh/m2 . These estimates can be considered conservative, since only the seasonal increases in the
daily sunshine durations were factored in to produce these year-scale averages. In other geographic
locations, where stronger yearly insolations are typically measured (eg, Middle East, or the north-west
of Australia), higher energy yields will be obtained.Appl. Sci. 2019, 9, 4002 13 of 18
3. Discussion and Assessment of Future Application Areas
In order to assess the practical applications potential of this emergent class of transparent solar
window-based PV, it is necessary to refer to the industry-standard system-level performance indicators,
the most common of which is Specific Yield. Specific yield (SY) quantifies the amounts of electric energy
(in kWh) harvested annually (per typical calendar year, in each installation location), per each 1 kWp of
installed PV generation capacity [43]. SY values are commonly used in industry to directly compare the
performance of di↵erent PV system configurations installed at di↵erent locations. Typically, measured
SY values in the United States reach up to about 1500 kWh/kWp , according to the data reported in [43]
for conventional solar PV module installations. For conventional (silicon modules-based) rooftop PV
installations in Perth, Australia, average daily energy generation outputs of about 4.4 kWh/kWp have
been reported [44], which translates into the estimated approx. SY values of near 1320 kWh/kWp ,
based on 300 sunny days per year in this location. Accounting for the PV generation amounts during the
other 65 days showing at least about a third of maximum generation (compared to the stable-sunshine
days, from our observations of Warwick Grove Atrium energy outputs measured on rainy days in
winter), a more detailed estimate for the SY figure for typical Perth-based PV systems is then also close
to 1500 kWh/kWp . These data sets are only valid, however, for the optimally-oriented, optimally-tilted
roof-based, completely unshaded silicon PV module installations.
In order to evaluate the expected annual energy generation and specific yield of Warwick Grove
Atrium, local meteorological datasets for the monthly and yearly cumulative solar exposure values can
be used, in conjunction with the data of Figure 5b for the energy yield per each MJ/m2 of solar exposure.
Quantified during sunny days in May, a conservative estimate (due to the weather being more suitable
for PV generation over many other months over the year) for this energy yield per unit solar exposure,
is near 1/11 kWh/(MJ/m2 ). According to the yearly solar exposure data summaries available from
a local weather station [36], the annual cumulative solar exposure figures were consistently at near
7400 MJ/m2 /year, in several recent years. Therefore, a conservative annual energy output estimate can
be obtained, being at least 673 kWh. This figure will likely be exceeded by up to several hundred
kWh, due to weather conditions being much more conducive to PV energy harvesting in spring and
summer, when both the UV and near-IR irradiation levels are much higher, due to drier atmospheric
conditions. Substantially stronger di↵used and reflected solar irradiation backgrounds are also present
during the warmer months, leading (in our group’s experience) to improved energy capture rates in
solar windows.
It is possible to evaluate the (over-conservative) lower limit for the expected specific yield of
Warwick Grove Atrium installation, by using a nominal, sum-total-based installed generation capacity
of 18 solar windows (~0.54 kWp ). Then, a standardized expected SY figure of ~1246 kWh/kWp
is obtained, which is still quite competitive to the typical conventional (even optimally tilted) PV
installations in sunny locations like Perth, especially if shading considerations are taking into account,
which strongly a↵ected 2 out of 18 windows. Accounting for the real measured peak output powers,
and the local site-specifics of windows deployment at Warwick Grove, particularly the geometric
orientations of most modules being far from optimal, the actual electric output-related installed capacity
rating cannot exceed about 300 Wp . Using this figure, an adjusted (however non-standard) estimate
for the SY can be re-calculated, now exceeding 2240 kWh/kWp . This SY figure estimate confirms the
relative strengths of the energy harvesting approach using solar windows, compared to many common
types of PV systems. These strengths are due to the improved efficiency of solar energy collection
for light rays incident onto harvesting surfaces at large angles, which is a known characteristic of
luminescent concentrator-type devices, including transparent energy-generating window systems.
Significant seasonal variations in the daily amounts of generated energy are expected, due to
local climate-related variables. A graphical summary of seasonal climate-related solar irradiation
parameter variations for Perth, Australia is presented in Figure 7. It can be noted from Figure 7 that very
strong monthly variations exist between the monthly-averaged direct-beam solar irradiation intensities,
the horizontal-plane illuminance, and also the mean daily total sunshine hours. The local-basedAppl. Sci. 2019, 9, 4002 14 of 18
monthly distribution of peak output-equivalent sunshine hours for many Australian locations is also
known from specialized PV industry sources (eg [45]), and generally scales in correlation with the
mean daily total sunshine hours shown in Figure 7c. All of the above parameters are directly relevant
to the expected daily energy generation from all PV module types; further, longer-term studies are
necessary to generate the expected energy generation data per each calendar month.
Figure 7. Seasonal yearly climate-related solar irradiation parameter variations for Perth, Australia.
(a) Monthly averaged and maximum-recorded direct-beam solar irradiation intensities measured across
horizontal plane; (b) monthly averaged and maximum-recorded direct-beam solar illuminance values
measured across horizontal plane; (c) monthly distributions of the total daylight hours and the daily
sunshine durations. The datasets shown in parts (a) and (b) have been obtained using COMFEN 5
software [46]; the dataset of part (c) has been published online by [31], using the publicly-available
Australian Bureau of Meteorology data.
The results of this initial pilot-trial study of shopping center entrance-based solar windows
installation lead to a preliminary conclusion regarding the generally expected suitability (and relevance)
of transparent solar windows in commercial property-based settings. It is particularly important to
note that the amounts (and usefulness) of the generated electric power and renewable energy bothAppl. Sci. 2019, 9, 4002 15 of 18
scale favorably with the installation size, presuming that the geographic location is suitable, and the
architectural design features are adjusted to maximizing the generated energy. For example, considering
a semi-spherical dome-type installation housing 2000 m2 of solar window surfaces, the diameter of
this dome-shaped roof-based installation area will be near 35 m, a size not uncommon in shopping
center properties. Based on 70 Wh/m2 estimate for the system-averaged, seasonally-averaged daily
energy generation, about 140 kWh of daily energy production can be expected. This corresponds to the
total daily electric energy consumption requirements of about 10 3-bedroom Australian households.
The area under the modelled solar-window dome and its surrounds will be approximately 40 m ⇥ 40 m
in footprint, requiring a square 21 ⇥ 21 grid of 441 LED lamps separated by about 2 m. Presuming 30W
LED lamps and using the calculated daily-average energy production figure, this area-lighting circuit
of lamps can be run for approximately 10.5 hours. Accounting for the high visual transparency of
windows, with >65% of total (direct and di↵used) visible-range transparency, significant reduction in the
lighting-related energy consumption can be predicted. Additionally, a large degree of electricity supply
blackout resistance provided by on-site distributed generation using these building-material-integrated
PV can be expected, provided that suitable battery storage systems are installed. Other expected future
application areas of highly transparent energy-generating construction materials and solar windows
will likely include roof-top canopies, balcony glazings, skylights, and airport roofs.
4. Conclusions
A case study of a small-scale transparent solar windows installation in Perth (Australia) over the
period of May-September 2019 has been reported. The photovoltaic power and energy outputs have
been characterized during varying weather conditions and times of day. The results reported elucidate
the practical application potential of the described type of solar window products in various public
infrastructure and commercial property-based applications. In particular, a small-scale (18 windows,
with none installed at optimum orientation) solar window microgrid generated about 1 kWh of stored
electric energy per 11 MJ/m2 of land-area cumulative solar exposure, as measured by a local weather
station, in variable weather conditions. Each vertically-placed, north-facing window unit of area
near 1.3 m2 harvested approximately 0.1 kWh on each sunny winter day of total sunshine duration
~6–7 h. It can be expected that multiple new commercial and residential building-based installations
of the latest transparent BIPV products and technologies will continue to be constructed and trialed,
broadening the acceptance of transparent energy-generating construction materials.
Supplementary Materials: The following are available online at http://www.mdpi.com/2076-3417/9/19/4002/s1,
Table S1: Data summaries.
Author Contributions: All authors (M.V., M.N.A. and K.A.) have contributed to the design features of test
installation at Warwick Grove Shopping Centre (Perth, Australia), the design features of solar window modules,
the conceptualization of this article, and data collection; M.V. collected and analyzed the electric output and
weather-related datasets and prepared the manuscript. All authors discussed the data, graphics, and the
presentation; M.N.A. contributed substantially to the data curation and the original draft preparation; M.V. and
K.A. further reviewed and edited the manuscript.
Funding: This research was funded by the Australian Research Council (ARC grant LP160101589) and Edith
Cowan University. Clearvue Technologies Ltd is Industry Partner Organization co-operating in ARC-funded
research with Edith Cowan University, and have also funded the solar windows manufacture and construction
works at Warwick Grove Shopping Center.
Acknowledgments: The authors would like to acknowledge the contributions of Gemtek Automation Pty. Ltd.
(Malaga, WA, Australia) and Steve Coonen (independent PV Consultant Engineer, California, USA) to the
microgrid configuration design and electrical installation works.
Conflicts of Interest: The authors declare no conflict of interest. The funders had no role in the design of the
study; in the collection, analyses, or interpretation of data; in the writing of the manuscript, or in the decision to
publish the results.Appl. Sci. 2019, 9, 4002 16 of 18
References
1. Global Building Integrated Photovoltaics (BIPV) Market to Witness a CAGR of 23.4% during
2018–2024. Available online: https://www.bloomberg.com/press-releases/2019-04-25/global-building-
integrated-photovoltaics-bipv-market-to-witness-a-cagr-of-23-4-during-2018-2024 (accessed on 23 July
2019).
2. Capuano, L. International Energy Outlook 2018 (IEO2018); US Energy Information Administration: Washington,
DC, USA, 2018.
3. Ho↵ert, M.I.; Caldeira, K.; Benford, G.; Criswell, D.R.; Green, C.; Herzog, H.; Jain, A.K.; Kheshgi, H.S.;
Lackner, K.S.; Lewis, J.S.; et al. Advanced technology paths to global climate stability: Energy for a greenhouse
planet. Science 2002, 298, 981. [CrossRef] [PubMed]
4. Chu, S.; Majumdar, A. Opportunities and challenges for a sustainable energy future. Nature 2012, 488,
294–303. [CrossRef] [PubMed]
5. Hernandez, R.R.; Armstrong, A.; Burney, J.; Ryan, G.; Moore-O’Leary, K.; Diédhiou, I.; Grodsky, S.M.;
Saul-Gershenz, L.; Davis, R.; Macknick, J.; et al. Techno–ecological synergies of solar energy for global
sustainability. Nat. Sustain. 2019, 2, 560–568. [CrossRef]
6. 20 Overlooked Benefits of Distributed Solar Energy. Available online: https://techxplore.com/news/2019-07-
overlooked-benefits-solar-energy.html (accessed on 26 July 2019).
7. Wang, W.; Shi, Y.; Zhang, C.; Hong, S.; Shi, L.; Chang, J.; Li, R.; Jin, Y.; Ong, C.; Zhuo, S.; et al. Simultaneous
production of fresh water and electricity via multistage solar photovoltaic membrane distillation. Nat.
Commun. 2019, 10, 3012. [CrossRef] [PubMed]
8. Ravyts, S.; Dalla Vecchia, M.; Van den Broeck, G.; Driesen, J. Review on Building-Integrated Photovoltaics
Electrical System Requirements and Module-Integrated Converter Recommendations. Energies 2019, 12,
1532. [CrossRef]
9. Attoye, D.E.; Aoul, K.A.T.; Hassan, A. A Review on Building Integrated Photovoltaic Façade Customization
Potentials. Sustainability 2017, 9, 2287. [CrossRef]
10. Rezaei, S.D.; Shannigrahi, S.; Ramakrishna, S. A review of conventional, advanced, and smart glazing
technologies and materials for improving indoor environment. Sol. Energy Mater. Sol. Cells 2017, 159, 26–51.
[CrossRef]
11. Barman, S.; Chowdhury, A.; Mathur, S.; Mathur, J. Assessment of the efficiency of window integrated CdTe
based semitransparent photovoltaic module. Sustain. Cities Soc. 2018, 37, 250–262. [CrossRef]
12. Balin, I.; Garmider, V.; Long, Y.; Abdulhalim, I. Training artificial neural network for optimization of
nanostructured VO2 -based smart window performance. Opt. Express 2019, 27, A1030–A1040. [CrossRef]
13. United States Environmental Protection Agency. Distributed Generation of Electricity and Its Environmental
Impacts; United States Environmental Protection Agency: Washington, DC, USA, 2018. Available online:
https://www.epa.gov/energy/distributed-generation-electricity-and-its-environmental-impacts (accessed on
15 July 2019).
14. Ramalingam, K.; Indulkar, C. Distributed Generation Systems-Design, Operation and Grid Integration, Chapter
3-Solar Energy and Photovoltaic Technology; Butterworth Heinemann: Oxford, UK, 2017; pp. 69–147.
15. Gao, D.W. Energy Storage for Sustainable Microgrid; Academic Press: Cambridge, MA, USA, 2015;
ISBN 978-0-12-803374-6.
16. Online Video Presentation by Arup Group and Clearvue Technologies Ltd. 2019. Available online: http://www.
clearvuepv.com/wp-content/uploads/2019/05/Arup-ClearVue-Smart-Facade-v2-900x506.mp4 (accessed on
26 July 2019).
17. Biyik, E.; Araz, M.; Hepbasli, A.; Shahrestani, M.; Yao, R.; Shao, L.; Essah, E.; Oliveira, A.C.; del Caño, T.;
Rico, E.; et al. A key review of building integrated photovoltaic (BIPV) systems. Eng. Sci. Technol. Int. J.
2017, 20, 833–858. [CrossRef]
18. Cornaro, C.; Basciano, G.; Puggioni, V.A.; Pierro, M. Energy Saving Assessment of Semi-Transparent
Photovoltaic Modules Integrated into NZEB. Buildings 2017, 7, 9. [CrossRef]
19. Husain, A.A.F.; Hasan, W.Z.W.; Shafie, S.; Hamidon, M.N.; Pandey, S.S. A review of transparent solar
photovoltaic technologies. Renew. Sustain. Energy Rev. 2018, 94, 779–791. [CrossRef]
20. Vasiliev, M.; Nur-E-Alam, M.; Alameh, K. Recent Developments in Solar Energy-Harvesting Technologies for
Building Integration and Distributed Energy Generation. Energies 2019, 12, 1080. [CrossRef]Appl. Sci. 2019, 9, 4002 17 of 18
21. Dalapati, G.K.; Kushwaha, A.K.; Sharma, M.; Suresh, V.; Shannigrahi, S.; Zhuk, S.; Masudy-Panah, S.
Transparent heat regulating (THR) materials and coatings for energy saving window applications: Impact of
materials design, micro-structural, and interface quality on the THR performance. Prog. Mater. Sci. 2018, 95,
42–131. [CrossRef]
22. Vasiliev, M.; Alameh, K.; Nur-E-Alam, M. Spectrally-Selective Energy-Harvesting Solar Windows for Public
Infrastructure Applications. Appl. Sci. 2018, 8, 849. [CrossRef]
23. Alghamedi, R.; Vasiliev, M.; Nur-E-Alam, M.; Alameh, K. Spectrally-Selective All-Inorganic Scattering
Luminophores For Solar Energy-Harvesting Clear Glass Windows. Sci. Rep. 2014, 4, 6632. [CrossRef]
24. Vasiliev, M.; Alghamedi, R.; Nur-E-Alam, M.; Alameh, K. Photonic microstructures for energy-generating
clear glass and net-zero energy buildings. Sci. Rep. 2016, 6, 31831. [CrossRef]
25. Rosenberg, V.; Vasiliev, M.; Alameh, K. A Spectrally Selective Luminescence Concentrator Panel with
a Photovoltaic Cell. EP Patent No. 2 726 920 B1, 23 August 2017.
26. Vasiliev, M.; Alameh, K.; Rosenberg, V. A Device for Generating Electric Energy. U.S. Patent No.
20160204297A1, 14 July 2016.
27. Goetzberger, A.; Greube, W. Solar-energy conversion with fluorescent collectors. Appl. Phys. 1977, 14,
123–139. [CrossRef]
28. Debije, M.G.; Verbunt, P.P.C. Thirty Years of Luminescent Solar Concentrator Research: Solar Energy for the
Built Environment. Adv. Energy Mater. 2012, 2, 12–35. [CrossRef]
29. Mazzaro, R.; Vomiero, A. The Renaissance of Luminescent Solar Concentrators: The Role of Inorganic
Nanomaterials. Adv. Energy Mater. 2018, 1801903. [CrossRef]
30. Liu, H.; Li, S.; Chen, W.; Wang, D.; Li, C.; Wu, D.; Hao, J.; Zhou, Z.; Wang, X.; Wang, K. Scattering enhanced
quantum dots based luminescent solar concentrators by silica microparticles. Sol. Energy Mater. Sol. Cells
2018, 179, 380–385. [CrossRef]
31. Monthly Weather Forecast and Climate in Perth, Australia. Available online: https://www.weather-atlas.
com/en/australia/perth-climate#uv_index (accessed on 31 July 2019).
32. Global-First Trial of a Clear Solar Glass Structure at Vicinity Centres; Shopping Centre News: Sydney, Australia,
2019. Available online: https://www.shoppingcentrenews.com.au/shopping-centre-news/industry-news/
global-first-trial-of-a-clear-solar-glass-structure-at-vicinity-centres/ (accessed on 24 September 2019).
33. Vicinity Centres Publication. Vicinity to Reach Net Zero Carbon Emissions by 2030. Available online: https:
//www.vicinity.com.au/media-centre/media-and-news/190807_net-zero-carbon-emissions-by-2030 (accessed
on 26 July 2019).
34. Vicinity Centres and Mirvac Celebrated for Sustainability Achievements; The Fifth Estate: Sydney, Australia, 2019.
Available online: https://www.thefifthestate.com.au/events-tfeevents/awards-event-news/vicinity-centres-
and-mirvac-celebrated-for-sustainability-achievements/ (accessed on 24 September 2019).
35. Gao, L.; Dougal, R.A.; Liu, S.; Iotova, A.P. Parallel-connected solar PV system to address partial and rapidly
fluctuating shadow conditions. IEEE Trans. Indust. Electron. 2009, 56, 1548–1556.
36. Wanneroo Weather Station. Live Internet Broadcasts of the Local Weather-Related Data; Wanneroo Weather
Station: Wanneroo, Western Australia, 2019. Available online: https://weather.agric.wa.gov.au/station/WN
(accessed on 1 August 2019).
37. SunCalc.org Solar Astronomy Online Data Calculator. Available online: https://www.suncalc.org/#/-31.9452,
115.8816,15/2019.06.01/14:34/1/3 (accessed on 1 August 2019).
38. Imteaz, M.A.; Ahsan, A. Solar panels: Real efficiencies, potential productions and payback periods for major
Australian cities. Sust. Energy Technol. Assessm. 2018, 25, 119–125. [CrossRef]
39. Maghami, M.R.; Hizam, H.; Gomes, C.; Radzi, M.A.; Rezadad, M.I.; Hajighorbani, S. Power loss due to
soiling on solar panel: A review. Ren. Sust. Energy Rev. 2016, 59, 1307–1316. [CrossRef]
40. Mousazadeh, H.; Keyhani, A.; Javadi, A.; Hossein Mobli, H.; Abrinia, K.; Sharifi, A. A review of principle
and sun-tracking methods for maximizing solar systems output. Ren. Sust. Energy Rev. 2009, 13, 1800–1818.
[CrossRef]
41. Meggers, F.; Aviv, D.; Charpentier, V.; Teitelbaum, E.; Ainslie, A.; Adriaenssens, S. Co-optimization of solar
tracking for shading and photovoltaic energy conversion. In Proceedings of the 15th IBPSA Conference,
San Francisco, CA, USA, 7–9 August 2017; pp. 2224–2231. [CrossRef]
42. Nfaoui, M.; El-Hami, K. Extracting the maximum energy from solar panels. Energy Rep. 2018, 4, 536–545.
[CrossRef]Appl. Sci. 2019, 9, 4002 18 of 18
43. Zhang, T. What’s a Good Value for kWh/kWp? An Overview of Specific Yield; Solar Power World: Cleveland, OH,
USA, 2017. Available online: https://www.solarpowerworldonline.com/2017/08/specific-yield-overview/
(accessed on 5 August 2019).
44. Solar Calculator Ltd. Photovoltaic Output of Solar Panels; Solar Calculator Ltd.: Melbourne, VIC, Australia,
2018. Available online: https://solarcalculator.com.au/solar-panel-output/ (accessed on 5 August 2019).
45. Australian Solar Radiation Figures, Data Reproduced from the Australian Solar Radiation Handbook; Energy
Research and Development Corporation: Nimbin, NSW, Australia, 1995. Available online: https://www.rpc.
com.au/pdf/Solar_Radiation_Figures.pdf (accessed on 6 August 2019).
46. COMFEN5 Software; Berkeley Lab: Berkeley, CA, USA, 2019. Available online: https://windows.lbl.gov/
software/comfen (accessed on 24 September 2019).
© 2019 by the authors. Licensee MDPI, Basel, Switzerland. This article is an open access
article distributed under the terms and conditions of the Creative Commons Attribution
(CC BY) license (http://creativecommons.org/licenses/by/4.0/).You can also read