Integration of multi omics approaches for functional characterization of muscle related selective sweep genes in Nanchukmacdon
←
→
Page content transcription
If your browser does not render page correctly, please read the page content below
www.nature.com/scientificreports
OPEN Integration of multi‑omics
approaches for functional
characterization of muscle
related selective sweep genes
in Nanchukmacdon
Devender Arora1, Krishnamoorthy Srikanth1,4, Jongin Lee3, Daehwan Lee3, Nayoung Park3,
Suyeon Wy3, Hyeonji Kim3, Jong‑Eun Park1, Han‑Ha Chai1, Dajeong Lim1, In‑Cheol Cho2,
Jaebum Kim3* & Woncheoul Park1*
Pig as a food source serves daily dietary demand to a wide population around the world. Preference of
meat depends on various factors with muscle play the central role. In this regards, selective breeding
abled us to develop “Nanchukmacdon” a pig breeds with an enhanced variety of meat and high
fertility rate. To identify genomic regions under selection we performed whole-genome resequencing,
transcriptome, and whole-genome bisulfite sequencing from Nanchukmacdon muscles samples and
used published data for three other breeds such as Landrace, Duroc, Jeju native pig and analyzed the
functional characterization of candidate genes. In this study, we present a comprehensive approach
to identify candidate genes by using multi-omics approaches. We performed two different methods
XP-EHH, XP-CLR to identify traces of artificial selection for traits of economic importance. Moreover,
RNAseq analysis was done to identify differentially expressed genes in the crossed breed population.
Several genes (UGT8, ZGRF1, NDUFA10, EBF3, ELN, UBE2L6, NCALD, MELK, SERP2, GDPD5, and
FHL2) were identified as selective sweep and differentially expressed in muscles related pathways.
Furthermore, nucleotide diversity analysis revealed low genetic diversity in Nanchukmacdon for
identified genes in comparison to related breeds and whole-genome bisulfite sequencing data shows
the critical role of DNA methylation pattern in identified genes that leads to enhanced variety of meat.
This work demonstrates a way to identify the molecular signature and lays a foundation for future
genomic enabled pig breeding.
Pig is the most studied animal model to date with Mitochondrial DNA (mtDNA) analysis tracked down its ori-
gin from Eurasian wild-boar1. Among other animals, pig share a deep connection with human civilization and
emands2. Estimates for the consumption of animal food suggest that
played a critical role in fulfilling the feed d
pork demand will rise to 36% of the overall meat consumption by 2025 and hence require attention to sustain
and improve meat quality with its production to secure global food demand3.
The Korean peninsula is one of the largest pig consuming country with its Jeju native black pig (JNP) is an
indigenous variety of Korean pig with high-quality meat content, redness and nutrition v alue4,5. Superior taste
leads to an increase in JNP demand with every passing day but less productivity and fertility made it difficult to
sustain the demand6,7. Due to huge demand but less productivity intrusion of different breeds leads to diversion
of industry focus on alternative economic viable options8,9. These imported pig breeds possessed the excellent
genetic potential for high production and their growth have been reported to more than 0.5 kg of weight per day
but limited with meat quality c ontent10,11. This ultimately threatened the indigenous variety of pig with almost
1
Animal Genomics and Bioinformatics Division, National Institute of Animal Science, RDA, Wanju 55365, Republic
of Korea. 2Subtropical Livestock Research Institute, National Institute of Animal Science, RDA, Jeju 63242,
Korea. 3Department of Biomedical Science and Engineering, Konkuk University, Seoul 05029, Republic of
Korea. 4Department of Animal Science, Cornell University, Ithaca, NY 14853, USA. *email: jbkim@konkuk.ac.kr;
wcpark1982@korea.kr
Scientific Reports | (2021) 11:7219 | https://doi.org/10.1038/s41598-021-86683-4 1
Vol.:(0123456789)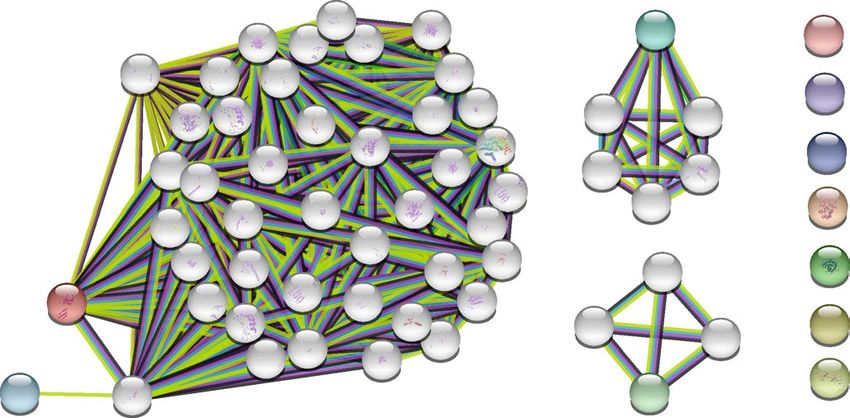
www.nature.com/scientificreports/
reached extinction until the government put serious effort and involved in saving the native pig breed by close
monitoring the growth and use.
To address the issue and sustain the demand of JNP in the entire region with food security for the long run,
the emphasis has been given to developing a breed with high productivity and meat quality. An in-house breeding
program was started to develop a breed with indigenous pig features and have a high fertility rate. Marker-based
multiple inter-crosses using a strict selection of breeding pigs (Jeju Native black pig, Duroc, Landrace) acceler-
ated the generation of outstanding progeny containing high meat-quality breed. In the course of continuously
close monitoring and breeding program using modern biological methods, Nanchukmacdon a mixed breed was
developed which maintained superior characteristics features in generations. A blind test for sensory reflexes to
Nanchukmacdon was performed for meat quality and it was voted similar or better values than those for bacon
meats. The carcasses of these newly developed black pigs (Nanchukmacdon) showed the significantly higher
levels of intramuscular fat deposition (p < 0.05), the redness and the yellowness (p < 0.05) but not in the lightness
(p > 0.05) in meat color c ontents12.
Identification of genomic regions undergone positive selection is a potent approach to delineate genes that
help in adaptation to environmental factors and responsible for the phenotypic diversity. In the last decade, many
GWAS studies have been conducted in this regards and supported by statistical advancement analysis to pin
down significant results from the driven data. These approaches already helped in the identification of different
genomic regions with selection signals, suggesting the contribution of the region in influencing certain charac-
teristics related to phenotypic or genotypic composition in different breeds. To further extent, genes identified
from whole-genome sequencing (WGS) may have evolved to adapt to the conditions but identifying the one
expressing and controlling the trait features ideally govern these characteristics and identifying such differentially
expressed genes for different trait could help us in identifying markers of interest to develop breeds with such
high potential. In this search, RNAseq and whole-genome bisulfite sequencing (WGBS) analysis approaches are
the attractive approach for the identification of differentially expressed genes and analysis of methylation role
and have been used in various studies regarding such a nalysis13–15.
In this study, we have evaluated the genetic closeness of Nanchukmacdon with the related species and identi-
fied the selective sweep genes that allow the enhancement in the characteristics features possessed by the breed.
We presented an unbiased approach combining WGS from different breeds of pig, RNAseq data from muscles
of closely related species amongst them. We used statistically established methods such as cross-population
extended haplotype homozygosity (XP-EHH)16 and cross-population composite likelihood ratio (XP-CLR)17
statistics to detect selection signatures from closely related breeds and Nucleotide Diversity analysis was per-
formed in Nanchukmacdon using v cftools18. Finally, WGBS data analyzed for Nanchukmacdon to observe the
methylation pattern in identified genes.
Results
Population structure analyses. PCA plot analysis describes the separation of species in 2 dimensional
view. From the present analysis on 43 resequencing and RNA-seq sample analysis, we observed the clear associa-
tion of 4 species. Nanchukmacdon is a breed between duroc, Landrace, and JNP and from the plot, it is conclu-
sive that the genetic constituent is closer to duroc and with a certain contribution of JNP (Fig. 1a,b).
Positive selective signature in Nanchukmacdon population. In total, we have obtained 1154, 1296,
and 1666 putative selection regions with p-values < 0.05 in XP-EHH and top 1% score limited to 574, 745, and
675 in XP-CLR putative positively selected genes test statistics in Nanchukmacdon from the three breeds Duroc,
JNP, and Landrace respectively (Additional_data 1). Based on the analysis, we further narrow down the obtained
results by overlapping XP-EHH and XP-CLR results and limited to 37, 41, and 39 genes in the statistical analysis.
Identification and analysis of differentially expressed genes (DEGs) in muscle tissue. DESeq
was used to identify statistically significant differences in gene expression obtained by featurecounts18. A cutoff
value of fold change ≥ 1 and adjusted FDR correction p-value < 0.05 was selected to obtain DEGs between differ-
ent breeds NC_JNP_Muscles, NC_DU_Muscles, and NC_LR_Muscles (Additional_data 2). Amongst identified
DEGs 1655 were found common in all the breeds (Fig. 2a). The overall relationship between different breed was
depicted by Volcano Plot (Fig. 2b).
Gene ontology and functional profiling studies. Separate analysis was performed for identified posi-
tive selective sweep genes identified from XP-EHH and XP-CLR score and DEGs in Nanchukmacdon from Duroc,
JNP, and landrace. The functional annotations of genes were categorized into three groups such as molecular
function, cellular component, and biological process. Most significant (corrected p-value < 0.05) GO terms such
as regulation of synaptic plasticity (GO:0048167), Lipid catabolism (GO:0016042), and post-chaperonin tubulin
folding pathway (GO:0007023) were identified in the biological process of XP-EHH. Likewise, in the case of XP-
CLR positive regulation of neuron differentiation (GO:0045666), cytoskeleton organization (GO:0007010), and
brown fat cell differentiation (GO:0050873) were identified in biological processes. Similarly, molecular and cel-
lular function ontology was also performed and observed the involvement in kainate selective glutamate recep-
tor activity (GO:0015277), neuromuscular junction (GO:0031594), ruffle membrane (GO:0032587) are some.
Similarly, Gene Ontology (GO) of DEGs reveals that the significantly expressed genes related protein ubiquitina-
tion involved in ubiquitin-dependent protein catabolic process (GO:0042787), cytoskeleton-dependent intracel-
lular transport (GO:0030705), angiogenesis, extracellular matrix organization, negative regulation of inflam-
matory response are some in biological processes. Likewise, we have seen critical involvement of extracellular
exomes, membrane, proteinaceous extracellular matrix enrichment in cellular compartment (Supplementary
Scientific Reports | (2021) 11:7219 | https://doi.org/10.1038/s41598-021-86683-4 2
Vol:.(1234567890)
www.nature.com/scientificreports/
a) b)
20
0.1
10
PC2: 24% variance
0.0
0
PC2
Duroc
−0.1
−10
Jeju native pig
Landrace
−0.2
−20
Nanchukmacdon
0 20 40 60
−0.4 −0.2 0.0 0.2
PC1 PC1: 57% variance
c) d)
Phylogenetic−Tree
120
D6
0.3
100
D7 80
D5 60
0.2
D6
40
D
N11
D8
D8
D4
D9
J44
N
D2
D7
D7
20
D1
D5
N2
D3
D10
D10
D
L144
D
D
D
L1
L1
L11
J1
N1
L3
L12 0
L4
L9
J22
J3
J3
J
L13
0.1
L
L2
L2
J8
J10
J11
N2
N3
N4
J12
J12 2
J
J
L7
L8
J66
J99
N9
L5
N
L10
0
N8
N8
L
L1
N3
N5
N7
N6
N10
L
0.0
Duroc Jeju native pig Landrace Nanchukmacdon N4
N5
L1
D6 L2
D3
D1 D10
D5 D8 L5
D2 D9
L8
D7 D4
D
N4
L7
10
J10 N3
N2 L4
J8 N1
L3
J11 N
N6
N
N10
J12 N9 L6
J66 N7
N5
J99
L N8
L5 J2
J4 L10
J1 L13
J2 J3 L11
L3 J1
L122 L9 L14
L2 L7 L8 L1 L4
J3
e) 1.0
0.8
0.6
0.4
0.2
0.0
D10
D3
D1
D7
D8
D9
D2
D5
D6
D4
kb4
kb3
kb2
kb1
KB6
KB8
KB9
KB10
KB11
LAN_1
KB12
LAN_2
LAN_3
LAN_4
LAN_5
LAN_7
LAN_8
LAN_9
LAN_10
LAN_11
LAN_12
LAN_13
LAN_14
NCMD_sample7
NCMD_sample1
NCMD_sample8
NCMD_sample9
NCMD_sample2
NCMD_sample3
NCMD_sample4
NCMD_sample5
NCMD_sample6
NCMD_sample10
k=4
Landrace Nanchukmacdon Jeju native pig Duroc
Figure 1. Population structure analyses for all pig individuals. (a) First and second principal components from
a principal component analysis of all populations WGS data. (b) PCA for muscles RNA-seq data distinct the
population group. (c) Rooted and un-rooted tree representation of related closeness amongst different pig breed.
(d) Heat-map visualization of common DEGs: column represent DEGs from muscle and row represent assemble
method from 20 pig samples. (e) Population structure plots for all pig populations at K = 4.
Scientific Reports | (2021) 11:7219 | https://doi.org/10.1038/s41598-021-86683-4 3
Vol.:(0123456789)www.nature.com/scientificreports/
a) c) KEGG Pathways
Jeju native pig p53 signaling pathway
Nanchukmacdon cGMP−PKG signaling pathway
Thyroid hormone signaling pathway
Steroid biosynthesis
vs Spliceosome
Signaling pathways regulating pluripotency of stem cells
795 Salivary secretion
Rap1 signaling pathway
Proteoglycans in cancer
Protein digestion and absorption
Prostate cancer
Propanoate metabolism
538 789 Pathways in cancer
GeneRatio Parkinson's disease
Pancreatic secretion
1655 2 PI3K−Akt signaling pathway
Oxytocin signaling pathway
4
Oxidative phosphorylation
6 Nicotinate and nicotinamide metabolism
2353 2398 Metabolic pathways
1206 8
MAPK signaling pathway
Long−term potentiation
Duroc Landrace Pvalue Leukocyte transendothelial migration
Jak−STAT signaling pathway
Insulin signaling pathway
0.0075 Insulin resistance
Inositol phosphate metabolism
b) 0.0050 Hepatitis B
HTLV−I infection
|log2FC| > 2 0.0025 Glucagon signaling pathway
100 FoxO signaling pathway
300 Both Focal adhesion
200 None Fatty acid biosynthesis
ErbB signaling pathway
Significant ECM−receptor interaction
75 DNA replication
-log10(adjusted P-value)
200 150 Cytokine−cytokine receptor interaction
Complement and coagulation cascades
Circadian rhythm
50 Circadian entrainment
100 Cell cycle
Carbon metabolism
100 Calcium signaling pathway
Bladder cancer
25 50 Biosynthesis of antibiotics
Biosynthesis of amino acids
Axon guidance
Arrhythmogenic right ventricular cardiomyopathy (ARVC)
0 0 0 Amoebiasis
Aldosterone synthesis and secretion
−10 0 10 −20 −10 0 10 20 0 10 20 Adipocytokine signaling pathway
log2(Fold Change) log2(Fold Change) log2(Fold Change) AMPK signaling pathway
Up Down Up Down Up Down
Duroc Jeju native pig Landrace Duroc Jeju native pig Landrace
vs vs
Nanchukmacdon Nanchukmacdon
Figure 2. Result of RNAseq analysis of Nanchukmacdon with Duroc, Jeju native pig and Landrace. (a)
Commonly identified differentially expressed genes. (b) Volcano-Plot for distribution of adjusted p-value with
log2foldchange for DEGs analysis in muscles against Duroc, Black pig and landrace with Nanchukmacdon
respectively and (c) KEGG pathway enrichment analysis after functional annotation with p < 0.01. Enriched
pathway in Nanchukmacdon from the different breed was performed by dot-plot analysis.
Fig S1a). KEGG pathway analysis reveals the involvement of major pathways varies from Metabolic pathway,
Fatty acid biosynthesis, ErbB signalling pathway, Adipocytokine signalling pathway, Calcium signalling pathway
and Oxidative phosphorylation are some (Fig. 2c, Supplementary Fig. S2). Manhattan plot for muscles WGS data
analysis was generated for NC with DU, JNP, and LR by XP-EHH and XP-CLR score and annotated with com-
monly identified differentially expressed genes with CMplot19. XP-EHH and XP-CLR score was plotted against
the genomic position with the autosomal chromosomes in different colors (Fig. 3a).
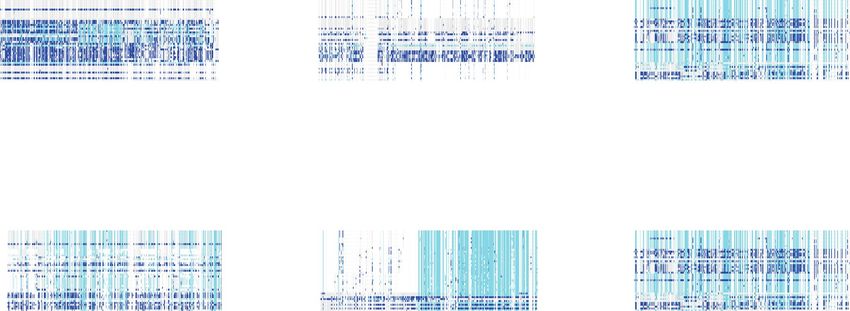
Validation of identified genes. All the identified genes were incorporated in the string database for pro-
tein–protein interaction analysis and it was observed that they share different modules of networks in governing
important characteristics features (Fig. 4a)20.
The muscle tissue from Nanchukmacdon was collected and used for expression analysis for seven randomly
selected genes. The transcripts selected for validation are SERP2, UGT8, MELK, ZGRF1, FHL2, NCALD, UBE2L6
as mentioned in Additional_table 3. The RT-PCR experiment for selected samples was executed with three rep-
licates for each sample. GAPDH and Beta-actin were used as an endogenous control for normalizing the quan-
tification cycle (Cq) value. The contrast is depicted in (Fig. 4b). Results indicate that the expression of selected
genes to control is significantly correlated with high confidence p-value = 0.00232 and R = 0.931.
WGBS data analysis was performed for Nanchukmacdon to analyze the methylation in identified genes. As
expected from the observed pattern, DNA methylation level sharply decreased near 5 kb upstream region of TSSs
and dropped to the lowest outside the region (Fig. 4c), methylation level remains stable after promoter region
contributing to structural stability and regulation of gene expression. CpG Island was less expressed inside than
outside of 5 kb CpG Island (Fig. 4d)21. Individual methylation pattern for all the identified genes confirms the
pattern of no methylation corresponding with the distribution of gene promoters, usually prone to transcription
(Supplementary Fig. S3).
Scientific Reports | (2021) 11:7219 | https://doi.org/10.1038/s41598-021-86683-4 4
Vol:.(1234567890)www.nature.com/scientificreports/
a) 6
6 6
4
4 4
XP−EHH
2 2 2
0 0 0
-2 -2 -2
-4 -4
-4
-6 -6
MELK FHL2 GDPD5 SERP2 UGT8 ZGRF1 EBF3 NDUFA10 UBE2L6 ELN NCALD UGT8
200
200 150
̻
150
150
XP−CLR
100
100 ̻
̻
100
̻
̻
̻
̻ ̻
̻
̻
50
50
̻
̻
50
̻
̻
̻
0 0 0
Chr 1 2 3 4 5 6 7 8 9 10 11 12 13 14 15 16 1718 Chr 1 2 3 4 5 6 7 8 9 10 11 12 13 14 15 16 1718 Chr 1 2 3 4 5 6 7 8 9 10 11 12 13 14 15 16 1718
Nanchukmacdon VS Jeju native pig Nanchukmacdon VS Duroc Nanchukmacdon VS Landrace
b)
0.6
0.6
0.6
Nucleotide Diversity
0.4
0.4
0.4
0.2
0.2
0.2
0.0
0.0
0.0
49363558 FHL2 49467004 237317203 MELK 237430139 108233198 UGT8 108313718
Nanchukmacdon
Landrace
Jeju native pig
Duroc
Nucleotide Diversity
0.6
0.6
0.6
0.4
0.4
0.4
0.2
0.2
0.2
0.0
0.0
0.0
NDUFA10 ZGRF1 108233198 UGT8 108313718
138999238 139031814 110090433 110168351
Nanchukmacdon
Landrace
Jeju native pig
Duroc
Nanchukmacdon Jeju native pig Duroc Landrace
Figure 3. (a) Candidate selective sweep analysis for NC. A window size of 10k with the binning size of 10 was
chosen and top 1% XP-CLR scores were extracted and a cutoff of -2 with significant p-value ≤ 0.05 were selected
for XP-EHH scores. Commonly identified genes were subsequently mapped with differentially expressed genes.
Positively expressed DEGs were indicated in red color. Nuclear diversity plot for the identified candidate genes
(b) represent the nuclear diversity at each point of location and their respective haplotype distribution with
genomic position biallelic alleles are shown in sky-blue (homozygous variant) and blue (Heterozygous variant).
Discussion
Genomic selection has been the main tool supported by statistical analysis in genetic improvement of economi-
cally important traits22. Selective signature ideally helps in stabilizing traits that make a breed unique with its
features. Studying these traits allows a better understanding of breed and help in developing enhanced breed with
high economic values. In this regards, Nanchukmacdon, a mixed breed was developed that exhibits exceptional
meat quality with a high fertility rate and performed selective sweep analysis to understand the genes that trig-
gered the meat characteristics. WGS data has been used for various GWAS related studies23–26, Incorporation
of RNAseq analysis approach to WGS data provide us with a more detailed and better understanding to the
identified genes and how they behave in the present system which makes specific trait different than the parental
generations. Recently, various studies have been published reporting selective genes in different breeds over a
period of time with main focus on identifying selective signature associated with the breeds and how these genes
expressing in the system27–29. As meat quality is accessed in terms of the carcass, feed conversion efficacy, color,
taste, juiciness and majorly consist of 75% of the muscles t issue30. In this regards, to identify selective sweep genes
in closely related breeds we used statistically established methods such as cross-population extended haplotype
homozygosity (XP-EHH)16 and cross population composite likelihood ratio (XP-CLR)17 statistics in order to
detect selection signatures from closely related breeds; two approaches were used as each has its own advantages.
XP-EHH compares haplotype lengths of populations to detect selective sweeps when the allele has approached
or achieved fixation in one population but remains polymorphic in the other population. XP-CLR is a statistic
based on allele frequency differentiation across populations providing an advantage to detect older signals and
selection on standing variation. Subsequently, we integrated RNAseq analysis data of muscles to identify the
muscles associated genes in the mixed breed with their closed associated pig varieties.
Scientific Reports | (2021) 11:7219 | https://doi.org/10.1038/s41598-021-86683-4 5
Vol.:(0123456789)www.nature.com/scientificreports/
a) c) Lion65_CpG - All Probes
Lion67_CpG - All Probes
NDUFA12
50 Lion69_CpG - All Probes
NDUFB8 UBE2L6
ND5 NDUFB9 NDUFS2 GDPD5 Lion71_CpG - All Probes
ENSSSCG00000000047 48 Lion72-CpG - All Probes
NDUFV2 NDUFS6 NDUFV1
ZGRF1
NDUFA8 HERC5
NDUFA9NDUFA2 NDUFA13 NDUFB11 46
UBA7
NDUFA11
MT-ND2 MELK
NDUFS5 HERC6 44
ENSSSCG00000024947 NDUFA3
NDUFB4 NDUFAB1 RPS27A
ND4
NDUFS4 NCALD 42
NDUFC2
NDUFC1 LOC733605 ISG15
NDUFS7
NDUFA7 NDUFB7 NDUFA1 40
NDUFB10 LOX EBF3
NDUFA10 ND3
NDUFS3 ND6 NDUFB3 NDUFA5 38
MFAP2
ENSSSCG00000027246 FBLN5 SERP2
NDUFS1
NDUFB1 36
NDUFV3
NDUFB5
UGT8 FHL2
34
ELN
NDUFB2
32
-4500 -3500 -2500 -1500 Relative distance over gene 500 1500 2500 3500 4500
b) d)
0.6
p−value = 0.00232 65
UBE2l6
R = 0.931
60
0.4
FHL2
55
ZGRF1
y
0.2 NCALD
50
UGT8
SERP2
45
0.0
MELK
40
0.0 0.4 0.8 1.2
x -4500 -3500 -2500 -1500 Relative distance over CpG islands 500 1500 2500 3500 4500
Figure 4. Related protein association and validation was performed. (a) All the identified genes were visualized
using string database. (b) RT-PCR result for randomly selected genes showing high correlation and significant
p-value or r = 0.931 and p-value = 0.00232. (c,d) Methylation pattern where a relative degree of gene stabilization
can be seen and (d) sharply decreasing at TSS region of CpG island and stabilizing afterwards.
After identifying common genes amongst different varieties exhibiting positive selective signature identi-
fied using XP-EHH and XPCLR statistical test, identification of common genes expressing in muscles tissue of
Nanchukmacdon limited the total number of genes amongst different breeds to 11 genes with 4 each in JNP,
DU, and LR respectively. Amongst UGT8 was identified in DU and LR. Here, JNP 4 (MELK, SERP2, GDPD5,
FHL2) genes, DU (UGT8, ZGRF1, NDUFA10, EBF3) genes and in LR (UGT8, ELN, UBE2L6, NCALD) genes
were identified [Table 1]. Similarly, identification of negatively expressed genes in Nanchukmacdon has been
performed and common genes amongst JNP, DU, and LR with the cutoff parameter for log2fold change > 1 were
identified to be limited with 13 genes, Additional_table 1.
Our findings on the genetic relationship amongst different breeds agree with the previously reported studies
on different pig breeds using WGS d ata31, signifying the grouping of Nanchukmacdon with Duroc, Jeju native
pig, and Landrace (Fig. 1a–c) with visualization of DEGs were performed using heatmap analysis (Fig. 1d). The
individuals from the Nanchukmacdon, landrace, duroc and JNP population were grouped according to their
origin as identified by PCA (Fig. 1a,b). Our results indicate that Nanchukmacdon is phylogenetically closer
to landrace (Fig. 1c). To estimate individual ancestry, admixture proportions were assessed without defined
population information using ADMIXTURE with The individual population was grouped into separate clusters
at K = 4 with the lowest cross validation error (Fig. 1e and Supplementary Fig. S4) and these results were also
confirmed from unrooted tree (Fig. 1c). In selection signature analysis, we further performed a comparative
analysis with closely related breeds. Our study reveals a series of well-known and novel genes reported in muscles
related to biological processes and their high expression pattern after getting positively selected in the mixed
breed. RNAseq methodology allowed us to further understand the changes held in selective sweep genes during
the evolution. We have seen major expression alteration in mineral content or related pathways by the different
expression pattern of selective sweep genes specifically muscles related (FHL2, EBF3), calcium ion channel route
(NCALD, UBE2l6), metabolism, and fatty acid metabolism pathways (UGT8, GDPD5, MELK) when it compares
to their closely related breeds. The genes under selection were further investigated using Nucleotide diversity
approach for the selective sweep genes. Low nucleotide diversity signifies the stabilization and activation of genes
under specific circumstances32,33 and in Nanchukmacdon with their respective paired breed and identified the
low diversity reported over the genomic coordinates and haplotype diversity in comparison to all other breeds
(Fig. 3b, Supplementary Figs. S5 and S6).
Amongst identified genes, UDP Glycosyltransferase 8 (UGT8) was found to be highly expressed in Nan-
chukmacdon w.r.t. Duroc and Landrace variety of pig. Although there is limited understanding of UGT8 role
with meat quality previous studies relates its involvement in either lipid metabolism, sphingolipid metabolism,
Scientific Reports | (2021) 11:7219 | https://doi.org/10.1038/s41598-021-86683-4 6
Vol:.(1234567890)www.nature.com/scientificreports/
Compare Chr Gene symbol ENS_ID XP-CLR XP-EHH log2FC FDR
ENS-
1 MELK 50.31517901 − 2.312935631 − 2.18 0.000124034
SSCG00000005344
ENS-
11 SERP2 67.168271 − 2.485311147 − 2.15 0.008392278
Nanchukmacdon vs. SSCG00000040405
Jeju Native Pig ENS-
9 GDPD5 163.2458645 − 2.364323658 − 1.63 0.00000212
SSCG00000014853
ENS-
3 FHL2 78.45288699 − 2.696124665 −1 0.000516892
SSCG00000008147
ENS-
8 UGT8 44.70694034 − 2.024535069 − 3.64 0.003195103
SSCG00000031904
ENS-
8 ZGRF1 56.23853217 − 2.164609468 − 1.52 0.003773682
Nanchukmacdon vs. SSCG00000009120
Duroc ENS-
15 NDUFA10 55.03739176 − 2.714584707 − 1.24 0.00000000000000181
SSCG00000016349
ENS-
14 EBF3 86.87865636 − 2.505302829 − 1.09 0.0000000000063
SSCG00000010757
ENS-
8 UGT8 57.77182778 − 2.738613817 − 2.34 0.000178915
SSCG00000031904
ENS-
3 ELN 85.97446047 − 2.080438144 − 1.94 0.0000000000000772
Nanchukmacdon vs. SSCG00000025858
Landrace ENS-
4 NCALD 58.25052636 − 2.861748569 − 1.05 0.0000000314
SSCG00000006059
ENS-
2 UBE2L6 80.85200729 − 2.939038774 − 1.14 0.000000515
SSCG00000023379
Table 1. Commonly identified selective signature genes with top 1% of XP-CLR and -2 cutoff for XP-EHH
score with log2fold change of < − 1 and FDR of 0.05 against JNP, Duroc and Landrace.
or in metabolic pathways and majorly reported as over-expressed and in a study by Meech et al. suggested the
role in bile acid as Galactosidation of Bile Acids34. Bile acid plays a crucial role in controlling lipid and glu-
cose metabolism and play central role in energy metabolism which directly have direct involvement with fatty
acid pathway35. Since various finding suggests UGT8 involvement in modulating bile acid signaling our results
concludes a strong relation of UGT8 expression in enhancing meat quality specifically to fat-related pathways.
DAVID annotation36 also confirmed the functional association of MELK in various biological processes. MELK
a kinase family protein found to be positively expressed in NC_JNP analysis is located in various part of the cell
such nucleus, cytoplasm, plasma membrane and cell cortex involved in various processes such intrinsic apop-
totic signaling pathway in response to oxidative stress, peptidyl-tyrosine phosphorylation, intracellular signal
transduction, positive regulation of the apoptotic process, protein auto-phosphorylation, neural precursor cell
proliferation. Interestingly, earlier studies reported the absence of MELK expression in muscles in a different
animal model37 and in contrast, we have reported a log fold change of -2.18 change w.r.t JNP. MELK expression
was strongly correlated with genes that play role in mitosis (M) phase of the cell cycle38 and reported in selective
sweep study fat rump of s heep39. Whereas, FHL-2 (The-four-and-a-half-lim) a selective sweep gene identified
after XP-EHH and XP-CLR studies and differentially expressed in Nanchukmacdon and reported to have a role
in the assembly of extracellular membrane and regulator of fatty acid metabolism and control energy homeostasis
in pig40. Predicted functional partner from string database also confirmed a close association with epidermal
growth factor receptor that could affect the morphology of the m uscles41. Expression of muscles related genes
significantly influenced by the expression pattern of FHL2 and found to control various genes such as MyoD1,
MyH3 and MyoG that play a central role in the development of muscles. Similarly, NCALD positively selected
gene from NC_LR presents in intracellular cellular component and observed for their role in calcium medi-
ated signaling. It is a calcium sensor which directly interacts regulates actin and clathrin. Similarly, UBE2L6
was reported in molecular functions related to ATP-binding, energy metabolism and nucleotide-binding. It is
athways44. GDPD5
involved in ubiquitination of multiple s ubstrates42,43 and direct involvement in obese related p
or glycerophosphodiester phosphodiesterase 2 (GDE2) was identified as positively selective sweep genes whose
functional annotation and string database information for protein–protein interaction analysis resulted in the
limited lead for direct involvement in any pathway or function but suggested a close association with ACSL3
gene which play a central role in fatty acid o xidation45. ELN identified as the positively expressed selective gene
found in the extracellular matrix that provides structural support, biochemical or biomechanical cues for cells or
tissues by structure lying external to one or more cells46,47. ZGRF1 is not well characterized and function is not
known in Sscrofa but the gene is reported to be associated with translation, transcription, nonsense-mediated
mRNA decay, RNA decay, miRNA processing, RISC assembly, and pre-mRNA splicing. EBF3: Positive selection
of EBF3 leads to an up-regulation of myogenic regulatory factors including MyoD and Myf5 required for muscles
development48. The function of Ebf3 outside of the neuronal system, however, has limited understanding. EBF3
play role in muscles specific transcription and have critical role in relaxation by directly regulating the expres-
sion of a Ca2+ pump49. SERP2 (stress associated endoplasmic reticulum protein family member 2), a positively
selected differentially expressed gene with limited understanding of any direct role in muscles related pathway
or any process in pig is reported to be differentially expressed in splay leg piglets50.
Scientific Reports | (2021) 11:7219 | https://doi.org/10.1038/s41598-021-86683-4 7
Vol.:(0123456789)www.nature.com/scientificreports/
Figure 5. Overview of the pipeline followed to identify selective sweep genes.
Conclusion
It is a well-established fact that artificial selection has greatly shaped pig genomic variability during the process
of domestication. The variation developed during the event helps the local industry to proliferate and fulfil the
local meat demands efficiently. Our primary objective of this study was to identify selective sweep genes that
were expressed in muscles and we were able to limit 13 potent genes with their important role in the muscles
building process. GO analysis showed various pathways vary from regulation of synaptic plasticity, clathrin-
dependent endocytosis, and positive regulation of neuron differentiation were significantly enriched. Similarly,
KEGG pathway showed that Metabolic pathways, Calcium signaling pathway, and Endocytosis were significantly
enriched in selective sweep genes. These results provide a better understanding of the role of identified genes
in regulating muscles related pathways and further information to genomic evolution and selective mechanism
which could help develop an enhanced breed with high muscles content.
Methods
To identify selective sweep genes in Nanchukmacdon we have performed multiple analysis and a flowchart has
been developed for better understanding of the work (Fig. 5).
Sampling and data collection. This study aimed to find selection signatures of selective sweep genes
using WGS data and integrating RNAseq analysis approaches in Nanchukmacdon, and other pig breeds (JNP,
Landrace, and Duroc) to identify differentially expressed selective sweep genes and their role in the biological
process. Samples were taken from healthy Male pigs belong to the same farm in Jeju Island with an average
age of 2 years for (N = 1–6), and 3 years for (N = 7–10) (Additional_Table 4). All the experimental procedures
were verified and approved by the National Institute of Animal Science, and carried out in compliance with the
ARRIVE guidelines51. Whole-genome re-sequencing was performed from the blood sample taken from post-
harvest Nanchukmacdon (N = 10), RNAseq data was generated for Nanchukmacdon (N = 5) pair-end data after
isolation of muscle tissue using TRIzol method following the manufacturer guideline and reported e arlier15.
Similarly, gDNA from Nanchukmacdon muscles was subjected to bisulfite conversion using the fragment size
(250 bp ± 25 bp), WGBS was performed with MethylMiner Methylated DNA Enrichment kit, and then a sequenc-
ing library was constructed using the Illumina Paired-end sequencing on an Illumina, NovaSeq, 150bpX2.
Whole genome bisulfite sequencing (N = 5) was performed from the taken sample. The sequencing library was
constructed using Illumina NovaSeq RNA sample preparation kit (Illumina, San Diego, CA, USA). Resequenc-
ing data for duroc [N = 10], landrace [N = 13], and JNP [N = 10] were retrieved from NCBI and RNAseq data for
duroc [N = 4], landrace [N = 8], were retrieved from NCBI and JNP data [N = 3] was collected from the a uthor52.
Sequence mapping and SNP calling. Using Burrows-wheeler aligner tool53, depth and genome coordi-
nates were identified after aligning to (Sus sucrofa 11.1) reference genome downloaded from NCBI at the default
setting. BAM file further cleaned using SAMTOOLS54 for low-quality mapping reads and specify permissive
quality cutoffs [flag-sat –bS and –bF 4]. The pipeline employs the Genome Analysis Toolkit 4.0 (GATK) to
perform variant calling and is based on the best practices for variant discovery analysis outlined by the Broad
Institute55,56. We used open-source software packages of Picard tools (http://broadinstitute.github.io/picard).
Picard tool was used to filter potential PCR duplicates. SAMtools was used to create index files for reference and
bam files. Genome analysis toolkit 4.1.4.0 performed local realignment of reads to correct misalignments due
to the presence of indels. Further, the HaplotypeCaller, CombineGVCF and “SelectVariant” argument of GATK
was used for identifying candidate SNPs57,58.
To filter variants and avoid possible false positives, the “VariantFiltration” argument of GATK was adopted with
the following options: SNPs with MQ (mapping quality) > 40.0, MQRankSum < − 12.5, ReadPosRankSum < − 8.0
Scientific Reports | (2021) 11:7219 | https://doi.org/10.1038/s41598-021-86683-4 8
Vol:.(1234567890)www.nature.com/scientificreports/
and quality depth (unfiltered depth of non-reference samples; low scores are indicative of false positives and
artifacts) < 2.0 were filtered59. BEAGLE version 4.160 was used to infer the haplotype phase and impute missing
alleles for the entire set of swine populations simultaneously. After all the filtering processes, a total of ~ 26 mil-
lion SNPs were retained and used for further analysis.
Phylogenetic tree, admixture and principal component analysis. To accurately describe the
population of the crossbred pig, we used SNP data from different breeds and employed SNPRelate R package
to perform principal component analysis61. Subsequently, Newick file was prepared and viewed in ggtree62,63.
Results were further analyzed for the distribution of breeds in different coordinates. Similarly, the input file was
implemented using unsupervised based clustering method by a program ADMIXTURE to estimate the breed
composition of individual animals64. The analysis was run with K (number of breeds ‘4’) ranging from 2 to 4
to depict the genetic background of Nanchukmacdon and graphical display of the output was performed in R.
Detection of genomic regions with putative signals of selection. Using the whole SNP sets defined
from NC, DU, LR and JNP, the method cross-population extended haplotype homozygosity (XP-EHH)16 and
cross-population composite likelihood ratio method (XP-CLR)17 was used to detect genome-wide selective
sweep regions. XP-EHH assesses haplotype differences between two populations and is designed to detect alleles
that have increased in frequency to the point of fixation or near fixation in one of the two populations being
compared65. Whereas, XP-CLR is based on the linked allele frequency difference between two populations and
is a unidirectional method to find the pattern with regional allelic frequency difference in-between population66.
Developments in RNA-seq technology enable more comprehensive investigation of the transcriptome for gene
expression studies67. The statistical analysis is also critical in transcriptomic studies using RNA-seq; specifically,
for the normalization of quantitative measurements of expression68,69 and detection of D EGs70.
The PE reads were checked for the quality assessment using F astQC56 and removed low quality reads by
Trimmomatic71 using parameters leading:3 trailing:3 slidingwindow:4:15 headcrop:13 minlen:36 before pro-
ceeding sequence alignment. All quality-filtered PE reads were aligned to Sscrofa genome (Sscrofa11.1) from
the University of California Santa Cruz (UCSC)72 using Hisat273 and reads were counted using FeatureCount 18.
DESeq2 was used to identify differentially expressed genes74.
Gene ontology analysis detection and annotation of candidate genes. Lists of differentially
expressed genes with FDR < 0.05 in Nanchukmacdon w.r.t. Duroc, JNP, and Landrace were compiled and sub-
mitted to DAVID v6.8 s erver36 for functional annotation and enrichment analysis. For each list, enriched Gene
Ontology (GO)75 Biological Processes, Molecular functions and Cellular Compartments. These terms were then
clustered semantically using the ReviGO server76. Enriched functions throughout the whole transcriptome of
Nanchukmacdon with elevated GO-term function and the clustered lower-level GO-terms. The letter corre-
sponds to letters found in the treemap for Biological process, Molecular function and Cellular compartment
(Additional_data 3, Additional_table 2, Supplementary Fig. S1b). The functional annotation of commonly iden-
tified selective sweep genes with differentially expressed genes was performed with the Database for Annotation,
Visualization and Integrated Discovery (DAVID) and Kyoto Encyclopedia of Genes and Genomes (KEGG). The
genomic coordinates of the regions with high XP-EHH and XP-LCR score for 10k window with 10k bin size
were used as input data and used R package BiomaRt77,78 to fetch the coordinates against sscrofa11.1 database
for getting the gene_id information of the respective regions with highly significant results78. Subsequently, the
Database for Annotation, Visualization, and Integrated Discovery (DAVID) (https://david.ncifcrf.gov/36,79 was
used for Kyoto Encyclopedia of Genes and Genomes (KEGG) p athway80 and Gene Ontology (GO)75 enrich-
ment analyses. The GO terms and KEGG pathways with corrected p-value < 0.05 were considered significant.
REVIGO76 and Clusterprofiler R package81 were used for summarizing the GO terms.
WGBS data analysis. The analysis for WGBS data was performed using reproducible genomics analysis
pipeline PiGx-bsseq to understand methylation patterns in identified genes82. Where sequence was initially per-
formed for a quality check using t rim_galore83 and alignment were subjected to the filtration of duplicate reads
with sam_blaster and sorted using S AMtools54 afterwards mapped to the reference genome of sscrofa11.1 using
Bismark84. Bismark methyl extractor was performed to measure the methylation in CpG context.
Validation. WGBS was performed for Nanchukmacdon muscles tissue to see methylation pattern in the
identified genes and gene wise methylation visualization was performed to observe methylation level at CpG
island by importing the CpG methylation file extracted from bismark methylation extract into SeqMonk visu-
alization tool. The coordinates for identified genes were fetched from Ensembl and each gene was visualized for
methylation and found correlating results (Supplementary Fig. S3).
Trizol method (Invitrogen, UK) was used for the total RNA isolation. Qubit fluorometer (Invitrogen, UK),
NanoDrop (Thermo Scientific, USA) and Bioanalyzer (Agilent, UK) were used for analyzing the quality of the
isolated total RNA. High Capacity cDNA Reverse Transcription Kit (Applied Biosystems™, 4368814) was used
for synthesizing the cDNA and RT-PCR was performed by SYBR Green Realtime PCR Master Mix (TOYOBO,
QPK-201T).
Ethics approval and consent to participate. In this study, N refers to number of animals and All the
experimental procedures were verified and approved by the Ethics committee of National Institute of Animal
with ethical approval no: NIAS20181295.
Scientific Reports | (2021) 11:7219 | https://doi.org/10.1038/s41598-021-86683-4 9
Vol.:(0123456789)www.nature.com/scientificreports/
Data availability
The re-sequencing and RNA sequencing was performed on an Illumina Novaseq- sequencer. The raw reads are
available for download from sequence read archive (SRA), NCBI under the accession number PRJNA670579. A
total of 33 resequencing data and 15 RNAseq data of 3 pigs breed Duroc, JNP and Landrace were retrieved from
NCBI with accession number PRJNA260763 and RNAseq data were retrieved from PRJNA392949, Landrace
PRJNA488993, and JNP data from Ghosh et al.52.
Received: 18 December 2020; Accepted: 12 March 2021
References
1. Crabtree, P. J., Campana, D. V. & Ryan, K. Early Animal Domestication and Its Cultural Context Vol. 6 (UPenn Museum of Archae-
ology, 1989).
2. Larson, G. et al. Ancient DNA, pig domestication, and the spread of the Neolithic into Europe. Proc. Natl. Acad. Sci. 104(39),
15276–15281 (2007).
3. Szűcs, I. & Vida, V. Global tendencies in pork meat-production, trade and consumption. Appl. Stud. Agribusiness Commerce
11(3–4), 105–111 (2017).
4. Kim, J., Cho, S., Caetano-Anolles, K., Kim, H. & Ryu, Y.-C. Genome-wide detection and characterization of positive selection in
Korean Native Black Pig from Jeju Island. BMC Genet. 16(1), 3 (2015).
5. Lee, Y.-S. et al. Genome-wide scans for detecting the selection signature of the Jeju-island native pig in Korea. Asian Australas. J.
Anim. Sci. 33(4), 539 (2020).
6. Choi, Y.-S., Park, B.-Y., Lee, J.-M. & Lee, S.-K. Comparison of carcass and meat quality characteristics between Korean native black
pigs and commercial crossbred pigs. Food Sci. Anim. Resour. 25(3), 322–327 (2005).
7. Cho, I.-C. et al. A functional regulatory variant of MYH3 influences muscle fiber-type composition and intramuscular fat content
in pigs. PLoS Genet. 15(10), e1008279 (2019).
8. Cho, S. et al. Carcass yields and meat quality by live weight of Korean native black pigs. J. Anim. Sci. Technol. 49(4), 523–530 (2007).
9. Hur, S. et al. Comparison of live performance and meat quality parameter of cross bred (Korean native black pig and landrace)
pigs with different coat colors. Asian Australas. J. Anim. Sci. 26(7), 1047 (2013).
10. Ballweg, I. C., Frölich, K., Fandrey, E., Meyer, H. H. & Kliem, H. Comparison of the meat quality of Turopolje, German Landrace
× Turopolje and German Landrace × Pietrain pigs. Agric. Conspec. Sci. 79(4), 253–259 (2014).
11. Wu, F. et al. A review of heavy weight market pigs: Status of knowledge and future needs assessment. Transl. Anim. Sci. 1(1), 1
(2017).
12. Incheol Jo, B. K. et al. A study on the ability improvement of ’Nanchuk Matdon’, a high meat breeding herd based on Jeju native
pigs (2017).
13. Canovas, S. et al. DNA methylation and gene expression changes derived from assisted reproductive technologies can be decreased
by reproductive fluids. Elife 6, e23670 (2017).
14. Plassais, J. et al. Whole genome sequencing of canids reveals genomic regions under selection and variants influencing morphol-
ogy. Nat. Commun. 10(1), 1–14 (2019).
15. Srikanth, K. et al. Comprehensive genome and transcriptome analyses reveal genetic relationship, selection signature, and tran-
scriptome landscape of small-sized Korean native Jeju horse. Sci. Rep. 9(1), 1–16 (2019).
16. Sabeti, P. C. et al. Genome-wide detection and characterization of positive selection in human populations. Nature 449(7164),
913–918 (2007).
17. Chen, H., Patterson, N. & Reich, D. Population differentiation as a test for selective sweeps. Genome Res. 20(3), 393–402 (2010).
18. Liao, Y., Smyth, G. K. & Shi, W. featureCounts: An efficient general purpose program for assigning sequence reads to genomic
features. Bioinformatics 30(7), 923–930 (2014).
19. Yin, L. et al. rMVP: A memory-efficient, visualization-enhanced, and parallel-accelerated tool for genome-wide association study.
Genomics Proteomics Bioinform. https://doi.org/10.1016/j.gpb.2020.10.007 (2021).
20. Szklarczyk, D. et al. STRING v11: Protein–protein association networks with increased coverage, supporting functional discovery
in genome-wide experimental datasets. Nucleic Acids Res. 47(D1), D607–D613 (2018).
21. Bird, A. DNA methylation patterns and epigenetic memory. Genes Dev. 16(1), 6–21 (2002).
22. Hayes, B. J., Bowman, P. J., Chamberlain, A. C., Verbyla, K. & Goddard, M. E. Accuracy of genomic breeding values in multi-breed
dairy cattle populations. Genet. Sel. Evol. 41(1), 1–9 (2009).
23. Zhuang, Z. et al. Meta-analysis of genome-wide association studies for loin muscle area and loin muscle depth in two Duroc pig
populations. PLoS ONE 14(6), e0218263 (2019).
24. Cordero, A. I. H. et al. Genome-wide associations reveal human-mouse genetic convergence and modifiers of myogenesis, CPNE1
and STC2. Am. J. Hum. Genet. 105(6), 1222–1236 (2019).
25. Willems, S. M. et al. Large-scale GWAS identifies multiple loci for hand grip strength providing biological insights into muscular
fitness. Nat. Commun. 8(1), 1–12 (2017).
26. Ponsuksili, S., Murani, E., Trakooljul, N., Schwerin, M. & Wimmers, K. Discovery of candidate genes for muscle traits based on
GWAS supported by eQTL-analysis. Int. J. Biol. Sci. 10(3), 327 (2014).
27. Park, W. et al. Investigation of de novo unique differentially expressed genes related to evolution in exercise response during
domestication in Thoroughbred race horses. PLoS ONE 9(3), e91418 (2014).
28. Zhao, P. et al. Evidence of evolutionary history and selective sweeps in the genome of Meishan pig reveals its genetic and phenotypic
characterization. GigaScience 7(5), giy058 (2018).
29. Wang, K. et al. Detection of selection signatures in Chinese Landrace and Yorkshire pigs based on genotyping-by-sequencing data.
Front. Genet. 9, 119 (2018).
30. Listrat, A. et al. How muscle structure and composition influence meat and flesh quality. Sci. World J. 2016, 3182746 (2016).
31. Kim, H. et al. Exploring the genetic signature of body size in Yucatan miniature pig. PLoS ONE 10(4), e0121732 (2015).
32. Bakker, E. G., Traw, M. B., Toomajian, C., Kreitman, M. & Bergelson, J. Low levels of polymorphism in genes that control the
activation of defense response in Arabidopsisthaliana. Genetics 178(4), 2031–2043 (2008).
33. VanBuren, R. et al. Extremely low nucleotide diversity in the X-linked region of papaya caused by a strong selective sweep. Genome
Biol. 17(1), 230 (2016).
34. Meech, R. et al. A novel function for UDP glycosyltransferase 8: Galactosidation of bile acids. Mol. Pharmacol. 87(3), 442–450
(2015).
35. Chiang, J. Y. & Ferrell, J. M. Bile acid metabolism in liver pathobiology. Gene Expr. J. Liver Res. 18(2), 71–87 (2018).
36. Huang, D. W., Sherman, B. T. & Lempicki, R. A. Bioinformatics enrichment tools: Paths toward the comprehensive functional
analysis of large gene lists. Nucleic Acids Res. 37(1), 1–13 (2009).
37. Ganguly, R. et al. MELK—A conserved kinase: Functions, signaling, cancer, and controversy. Clin. Transl. Med. 4(1), 1–8 (2015).
Scientific Reports | (2021) 11:7219 | https://doi.org/10.1038/s41598-021-86683-4 10
Vol:.(1234567890)www.nature.com/scientificreports/
38. Nakano, I. et al. Maternal embryonic leucine zipper kinase (MELK) regulates multipotent neural progenitor proliferation. J. Cell
Biol. 170(3), 413–427 (2005).
39. Ahbara, A. et al. Genome-wide variation, candidate regions and genes associated with fat deposition and tail morphology in
Ethiopian indigenous sheep. Front. Genet. 9, 699 (2019).
40. Ramayo-Caldas, Y. et al. From SNP co-association to RNA co-expression: Novel insights into gene networks for intramuscular
fatty acid composition in porcine. BMC Genomics 15(1), 1–15 (2014).
41. Khan, I. & Steeg, P. S. The relationship of NM23 (NME) metastasis suppressor histidine phosphorylation to its nucleoside diphos-
phate kinase, histidine protein kinase and motility suppression activities. Oncotarget 9(12), 10185 (2018).
42. Shibata, E., Abbas, T., Huang, X., Wohlschlegel, J. A. & Dutta, A. Selective ubiquitylation of p21 and Cdt1 by UBCH8 and UBE2G
ubiquitin-conjugating enzymes via the CRL4Cdt2 ubiquitin ligase complex. Mol. Cell. Biol. 31(15), 3136–3145 (2011).
43. Buchwald, M. et al. Ubiquitin conjugase UBCH8 targets active FMS-like tyrosine kinase 3 for proteasomal degradation. Leukemia
24(8), 1412 (2010).
44. Marcelin, G., Liu, S.-M., Schwartz, G. J. & Chua, S. C. Identification of a loss-of-function mutation in Ube2l6 associated with
obesity resistance. Diabetes 62(8), 2784–2795 (2013).
45. Padanad, M. S. et al. Fatty acid oxidation mediated by Acyl-CoA synthetase long chain 3 is required for mutant KRAS lung tumo-
rigenesis. Cell Rep. 16(6), 1614–1628 (2016).
46. Dragoš, A. & Kovács, Á. T. The peculiar functions of the bacterial extracellular matrix. Trends Microbiol. 25(4), 257–266 (2017).
47. Frantz, C., Stewart, K. M. & Weaver, V. M. The extracellular matrix at a glance. J. Cell Sci. 123(24), 4195–4200 (2010).
48. Green, Y. S. & Vetter, M. L. EBF factors drive expression of multiple classes of target genes governing neuronal development. Neural
Dev. 6(1), 19 (2011).
49. Jin, S. et al. Ebf factors and MyoD cooperate to regulate muscle relaxation via Atp2a1. Nat. Commun. 5(1), 1–16 (2014).
50. Wu, T. et al. Transcriptome analysis reveals candidate genes involved in splay leg syndrome in piglets. J. Appl. Genet. 59(4), 475–483
(2018).
51. Percie du Sert, N. et al. The ARRIVE guidelines 2.0: Updated guidelines for reporting animal research. J. Cereb. Blood Flow Metab.
40(9), 1769–1777 (2020).
52. Ghosh, M. et al. An integrated in silico approach for functional and structural impact of non-synonymous SNPs in the MYH1
gene in Jeju Native Pigs. BMC Genet. 17(1), 35 (2016).
53. Li, H. & Durbin, R. Fast and accurate short read alignment with Burrows-Wheeler transform. Bioinformatics 25(14), 1754–1760
(2009).
54. Li, H. et al. The sequence alignment/map format and SAMtools. Bioinformatics 25(16), 2078–2079 (2009).
55. De Summa, S. et al. GATK hard filtering: Tunable parameters to improve variant calling for next generation sequencing targeted
gene panel data. BMC Bioinform 18(5), 119 (2017).
56. Andrews, S. F., Krueger, F., Seconds-Pichon, A., Biggins, F. & Wingett. S. F. A quality control tool for high throughput sequence
data. Babraham Bioinformatics (2014).
57. Poplin, R. et al. Scaling accurate genetic variant discovery to tens of thousands of samples. bioRxiv 2017, 201178 (2017).
58. Ren, S., Bertels, K. & Al-Ars, Z. Efficient acceleration of the pair-hmms forward algorithm for gatk haplotypecaller on graphics
processing units. Evol. Bioinform. 14, 1176934318760543 (2018).
59. Matika, O. et al. Balancing selection at a premature stop mutation in the myostatin gene underlies a recessive leg weakness syn-
drome in pigs. PLoS Genet. 15(1), e1007759 (2019).
60. Browning, S. R. & Browning, B. L. Rapid and accurate haplotype phasing and missing-data inference for whole-genome association
studies by use of localized haplotype clustering. Am. J. Hum. Genet. 81(5), 1084–1097 (2007).
61. Zheng, X. A Tutorial for the R Package SNPRelate (University of Washington, 2013).
62. Zheng, X. et al. A high-performance computing toolset for relatedness and principal component analysis of SNP data. Bioinformat-
ics 28(24), 3326–3328 (2012).
63. Yu, G. Using ggtree to visualize data on tree-like structures. Curr. Protoc. Bioinform. 69(1), e96 (2020).
64. Patterson, N. et al. Ancient admixture in human history. Genetics 192(3), 1065–1093 (2012).
65. Liu, X. et al. Detecting and characterizing genomic signatures of positive selection in global populations. Am. J. Hum. Genet. 92(6),
866–881 (2013).
66. Fu, W., Lee, W. R. & Abasht, B. Detection of genomic signatures of recent selection in commercial broiler chickens. BMC Genet.
17(1), 122 (2016).
67. Hrdlickova, R., Toloue, M. & Tian, B. RNA-Seq methods for transcriptome analysis. Wiley Interdiscip. Rev. RNA 8(1), e1364 (2017).
68. Kukurba, K. R. & Montgomery, S. B. RNA sequencing and analysis. Cold Spring Harbor Protoc. 2015(11), 951–969 (2015).
69. Lowe, R., Shirley, N., Bleackley, M., Dolan, S. & Shafee, T. Transcriptomics technologies. PLoS Comput. Biol. 13(5), e1005457
(2017).
70. Costa-Silva, J., Domingues, D. & Lopes, F. M. RNA-Seq differential expression analysis: An extended review and a software tool.
PLoS ONE 12(12), e0190152 (2017).
71. Bolger, A. M. & Lohse, M. Usadel BJB: Trimmomatic: A flexible trimmer for Illumina sequence data. Bioinformatics 30(15),
2114–2120 (2014).
72. Fujita, P. A. et al. The UCSC genome browser database: Update 2011. Nucleic Acids Res. 39(Suppl 1), D876–D882 (2010).
73. Kim, D., Langmead, B. & Salzberg, S. L. HISAT: A fast spliced aligner with low memory requirements. Nat. Methods 12(4), 357–360
(2015).
74. Love, M. I., Huber, W. & Anders, S. Moderated estimation of fold change and dispersion for RNA-seq data with DESeq2. Genome
Biol. 15(12), 550 (2014).
75. Ashburner, M. et al. Gene ontology: Tool for the unification of biology. Nat. Genet. 25(1), 25–29 (2000).
76. Supek, F., Bošnjak, M., Škunca, N. & Šmuc, T. REVIGO summarizes and visualizes long lists of gene ontology terms. PLoS ONE
6(7), e21800 (2011).
77. Durinck, S. et al. BioMart and Bioconductor: A powerful link between biological databases and microarray data analysis. Bioin-
formatics 21(16), 3439–3440 (2005).
78. Smedley, D. et al. BioMart—biological queries made easy. BMC Genomics 10(1), 22 (2009).
79. Sherman, B. T. & Lempicki, R. A. Systematic and integrative analysis of large gene lists using DAVID bioinformatics resources.
Nat. Protoc. 4(1), 44 (2009).
80. Kanehisa, M., Sato, Y., Kawashima, M., Furumichi, M. & Tanabe, M. KEGG as a reference resource for gene and protein annota-
tion. Nucleic Acids Res. 44(D1), D457–D462 (2016).
81. Yu, G., Wang, L.-G., Han, Y. & He, Q.-Y. clusterProfiler: An R package for comparing biological themes among gene clusters.
OMICS 16(5), 284–287 (2012).
82. Wurmus, R. et al. PiGx: Reproducible genomics analysis pipelines with GNU Guix. Gigascience 7(12), giy123 (2018).
83. Krueger, F. Trim galore. A wrapper tool around Cutadapt and FastQC to consistently apply quality and adapter trimming to FastQ
files 516, 517 (2015).
84. Krueger, F. & Andrews, S. R. Bismark: A flexible aligner and methylation caller for Bisulfite-Seq applications. Bioinformatics 27(11),
1571–1572 (2011).
Scientific Reports | (2021) 11:7219 | https://doi.org/10.1038/s41598-021-86683-4 11
Vol.:(0123456789)www.nature.com/scientificreports/
Acknowledgements
This study was supported by 2020 the RDA Fellowship Program of National Institute of Animal Science, Rural
Development Administration, Republic of Korea.
Author contributions
D.A., J.K., and W.C.P. designed and performed the research, analyzed the data, and wrote the manuscript. S.K.,
J.L., JE.P., D.L., S.W., D.L., and H.K. performed the research and analyzed the data. N.P., H.C., I.C. interpreted
the results and finalized the manuscript. All authors read and approved the final manuscript.
Funding
This work was supported by Korea Post-Genome Project (Project title: Deciphering the reference genome and
the discovery of trait-associated genes in Nanchukmacdon and mini pigs). Project No. PJ013343 of the National
Institute of Animal Science, Rural Development Administration, Republic of Korea.
Competing interests
The authors declare no competing interests.
Additional information
Supplementary Information The online version contains supplementary material available at https://doi.org/
10.1038/s41598-021-86683-4.
Correspondence and requests for materials should be addressed to J.K. or W.P.
Reprints and permissions information is available at www.nature.com/reprints.
Publisher’s note Springer Nature remains neutral with regard to jurisdictional claims in published maps and
institutional affiliations.
Open Access This article is licensed under a Creative Commons Attribution 4.0 International
License, which permits use, sharing, adaptation, distribution and reproduction in any medium or
format, as long as you give appropriate credit to the original author(s) and the source, provide a link to the
Creative Commons licence, and indicate if changes were made. The images or other third party material in this
article are included in the article’s Creative Commons licence, unless indicated otherwise in a credit line to the
material. If material is not included in the article’s Creative Commons licence and your intended use is not
permitted by statutory regulation or exceeds the permitted use, you will need to obtain permission directly from
the copyright holder. To view a copy of this licence, visit http://creativecommons.org/licenses/by/4.0/.
© The Author(s) 2021
Scientific Reports | (2021) 11:7219 | https://doi.org/10.1038/s41598-021-86683-4 12
Vol:.(1234567890)You can also read