MultiMAP: Dimensionality Reduction and Integration of Multimodal Data
←
→
Page content transcription
If your browser does not render page correctly, please read the page content below
MultiMAP: Dimensionality Reduction and Integration of Multimodal Data

       Mika Sarkin Jain* 1 2 Krzysztof Polanski 2 Cecilia Dominguez Conde 2 Xi Chen 2 3 Jongeun Park 2 4
       Lira Mamanova 2 Andrew Knights 2 Rachel A. Botting 5 Emily Stephenson 5 Muzlifah Haniffa 2 5
                       Austen Lamacraft 1 Mirjana Efremova 2 6 Sarah A. Teichmann 1 2

                          Abstract                                  ing single-cell technologies are providing high-resolution
                                                                    measurements of different features of cellular identity, in-
     Multimodal data is rapidly growing in single-cell              cluding single-cell assays for gene expression, protein abun-
     biology and other fields of science and engineer-              dance[2,3], chromatin accessibility[4], DNA methylation[5],
     ing. We introduce MultiMAP, an approach for                    and spatial resolution[6]. Large scale collaborations includ-
     dimensionality reduction and integration of multi-             ing the Human Cell Atlas international consortium[7],[8]
     ple datasets. MultiMAP is a nonlinear manifold                 are generating an exponentially increasing amount of data
     learning technique that recovers a single manifold             of many biological tissues, using a myriad of technologies.
     on which all datasets reside and then projects the             Each technology provides a unique view of cellular biol-
     data into a single low-dimensional space so as to              ogy and has different strengths and weaknesses. Integrating
     preserve the manifold structure. MultiMAP has                  these measurements in the study of a single biological sys-
     several advantages over existing integration strate-           tem will open avenues for more comprehensive study of
     gies for single-cell data, including that it can inte-         cellular identity, cell-cell interactions, developmental dy-
     grate any number of datasets, leverages features               namics, and tissue structure[9].
     that are not present in all datasets (i.e. datasets can
     be of different dimensionalities), is not restricted           The integration of multi-omic data poses several chal-
     to a linear mapping, allows the user to specify                lenges[10]. Different omics technologies measure distinct
     the influence of each dataset on the embedding,                unmatched features with different underlying distributions
     and is extremely scalable to large datasets. We                and properties and hence produce data of different dimen-
     apply MultiMAP to the integration of a variety                 sionality. This makes it difficult to place data from differ-
     of single-cell transcriptomics, chromatin acces-               ent omics in the same feature space. Additionally, omics
     sibility, methylation, and spatial data, and show              technologies can also have different noise and batch char-
     that it outperforms current approaches in preser-              acteristics which are challenging to identify and correct.
     vation of high-dimensional structure, alignment                Further, as multi-omic data grows along two axes, the num-
     of datasets, visual separation of clusters, transfer           ber of cells per omic and the number of omics per study,
     learning, and runtime. The MultiMAP codebase                   integration strategies need to be extremely scalable.
     is available at this https url.                                Most data integration methods project multiple measure-
                                                                    ments of information into a common low-dimensional rep-
                                                                    resentation to assemble multiple modalities into an inte-
1. Introduction                                                     grated embedding space. Recently published methods em-
                                                                    ploy different algorithms to project multiple datasets into an
Multimodal data is rapidly growing in single-cell biology
                                                                    embedding space, including canonical correlation analysis
and many other fields of science and engineering. Emerg-
                                                                    (CCA)[11], nonnegative matrix factorization (NMF)[]12]
   *
     Equal contribution 1 Theory of Condensed Matter, Dept          or neural network models[13]. While these methods can be
Physics, Cavendish Laboratory, University of Cambridge              tremendously powerful, they suffer from several shortcom-
2
  Wellcome Sanger Institute, Wellcome Genome Campus, Cam-           ings. Current methods require correspondence between the
bridge 3 Southern University of Science and Technology 4 KAIST,     features profiled across omics technologies. A further draw-
South Korea 5 Biosciences Institute, Newcastle University 6 Barts
Cancer Institute, Queen Mary University of London. Corre-           back is that methods that use linear models, such as CCA
spondence to: Mika Sarkin Jain ,          and NMF, are not able to capture non-linear differences
Mirjana Efremova , Sarah A. Teichmann             between datasets. Another limitation of these methods is
.                                                 they cannot scale to large datasets, failing on datasets of
                                                                    hundreds of thousands to millions of cells.
The 2021 ICML Workshop on Computational Biology. Copyright
2021 by the author(s).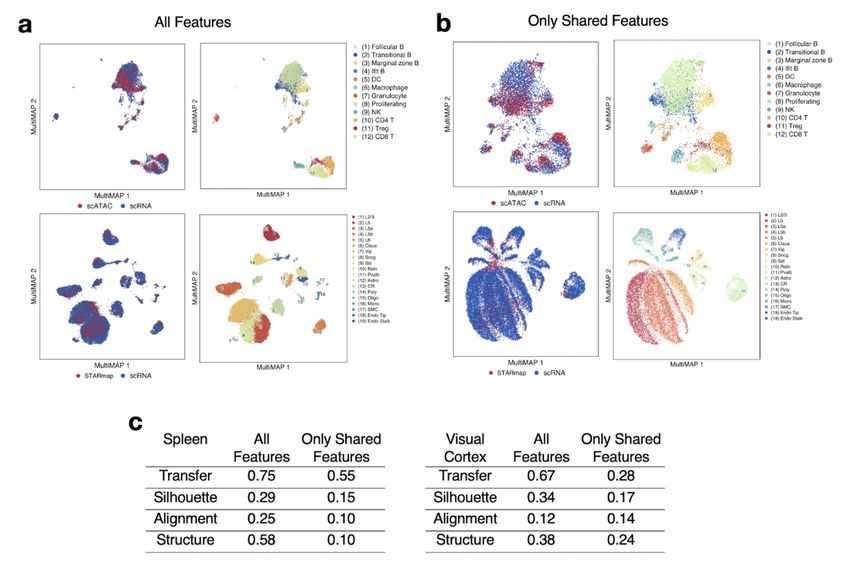
Submission and Formatting Instructions for ICML 2021

Figure 1. Schematic of MultiMAP. a. MultiMAP takes any number of datasets, including those of differing dimensions, recovers
geodesic distances on a single latent manifold on which all data lie, constructs a neighborhood graph (MultiGraph) on the manifold, and
then projects the data into a single low-dimensional embedding. Integrated analysis and visualisation can be performed on the embedding
or graph. Variables are discussed in Methods. Xi is dataset i, xji is a point in Xi , M is the shared manifold, B(x2i ) is a ball on M
centered at x2i , Xij is the ambient space of M in the coordinate space with data containing points from datasets i and j, gij is the metric of
M in the space Xij , µ is the membership function of the fuzzy simplicial set on the manifold, ν is the membership function of the fuzzy
simplicial set in the low-dimensional space. The mathematical formulation of MultiMAP is elaborated in Supplementary Methods. b. In
the field of cell atlas technologies, encompassing single cell genomics and spatial technologies, MultiMAP can be applied to integrate
across different omics modalities, species, individuals, batches, and normal/perturbed states.

Here we introduce a method that overcomes all these lim-                  and integrative analysis of multiple datasets. With respect to
itations: MultiMAP, an approach for the dimensionality                    single cell genomics data, this allows for standard analysis
reduction and integration of multiple datasets. MultiMAP                  on the integrated data, such as cluster label transfer, joint
integrates data by constructing a non-linear manifold on                  clustering, and trajectory analysis.
which diverse high-dimensional data reside and then pro-
jecting the manifold and data into a shared low-dimensional               2. Results
space. In contrast to other integration strategies for single-
cell data, MultiMAP can integrate any number of datasets, is              2.1. The MultiMAP Framework
not restricted to a linear mapping, leverages features that are
                                                                          We introduce MultiMAP, an approach for integration and
not present in all datasets (i.e. datasets can be of different
                                                                          dimensionality reduction of multimodal data based on a
dimensionalities), allows the user to specify the influence
                                                                          framework of Riemannian geometry and algebraic topology.
of each dataset on the embedding, and is effortlessly scal-
                                                                          MultiMAP takes as input any number of datasets of poten-
able to large datasets. The ability of MultiMAP to integrate
                                                                          tially differing dimensions. MultiMAP recovers geodesic
datasets of different dimensionalities allows the strategy
                                                                          distances on a single latent manifold on which all of the
to leverage information that is not considered by methods
                                                                          data is uniformly distributed. The distances are calculated
that operate in a shared feature space. (e.g. MultiMAP can
                                                                          between data points of the same dataset by normalizing dis-
integrate the 20,000-feature gene space of scRNAseq data
                                                                          tances with respect to a neighborhood distance specific to
together with a 100,000-feature peak space of scATACseq
                                                                          the dataset, and between data points of different datasets by
data).
                                                                          normalizing distances between the data in a shared feature
We apply MultiMAP to challenging synthetic multimodal                     space with respect to a neighborhood parameter specific to
data, and demonstrate its ability to integrate a wide range of            the shared feature space. These distances are then used to
single-cell omics datasets. We show that MultiMAP can co-                 construct a neighborhood graph (MultiGraph) on the man-
embed datasets across different technologies and modalities,              ifold. Finally, the data and manifold space are projected
while at the same time preserving the structure of the data,              into a low-dimensional embedding space by minimizing the
even with extensive biological and technical differences.                 cross entropy of the graph in the embedding space with re-
The resulting embedding and shared neighborhood graph                     spect to the graph in the manifold space. MultiMAP allows
(MultiGraph) can be used for simultaneous visualisation                   the user to modify the weight of each dataset in the cross
                                                                          entropy loss, allowing the user to modulate the contribution
Submission and Formatting Instructions for ICML 2021

of each dataset to the layout. Integrated analysis can be per-    These integration approaches differ in key regards, sum-
formed on the embedding or the graph, and the embedding           marized in Figure 3c. We used a diversity of performance
also provides an integrated visualization. The mathematical       metrics to comprehensively compare MultiMAP with other
formulation of MultiMAP is elaborated in Supplementary            approaches, including transfer accuracy, silhouette score,
Methods.                                                          alignment, preservation of the structure, and runtime. With
                                                                  these metrics, we quantified the separation of the joint clus-
In order to study MultiMAP in a controlled setting, we first
                                                                  ters, how well mixed the datasets were after integration
applied it to two synthetic examples of multimodal data
                                                                  and how well they preserved the structure in the original
(Methods). The first synthetic data consists of points sam-
                                                                  datasets to investigate whether the methods integrate popu-
pled randomly from the canonical 3D “Swiss Roll” surface
                                                                  lations across datasets without blending distinct populations
and the 2D rectangle (Figure 2a). The dataset is considered
                                                                  together.
multimodal data, because samples are drawn from different
feature spaces but describe the same rectangular manifold.        We benchmarked MultiMAP using a variety of multi-omic
In addition, we are given the position along the manifold of      data with both newly generated and published cell type
1% of the data. This synthetic setting illustrates that Mul-      annotations. This includes scATAC-seq and scRNA-seq
tiMAP can integrate data in a nonlinear fashion and operate       data of the mouse spleen (n=1) [15], scATAC-seq and
on datasets of different dimensionality, because data points      scRNA-seq data data of human bone marrow and periph-
along a similar position on the manifold are near each other      eral blood mononuclear cells [16], and scRNA-seq and spa-
in the embedding (Figure 2b). The MultiMAP embedding              tial STARmap (n=2) data of the mouse brain [18]. For all
properly unrolls the Swiss Roll dataset, indicating that the      datasets, MultiMAP achieves top or near top performance
projection is nonlinear. The embedding also appears to pre-       on all metrics (Figure 3a). The embeddings produced by
serve aspects of both datasets; the data is curved and at the     MultiMAP prove superior for transferring cell type anno-
same time unrolled.                                               tations between datasets, separating clusters of different
                                                                  cell populations, integrating datasets in a well-mixed man-
To determine if MultiMAP can effectively leverage features
                                                                  ner, and capturing the high-dimensional structure of each
unique to certain datasets, we used the MNIST database[14],
                                                                  dataset.
where handwritten images were split horizontally with thin
overlap (Figure 2c; see Methods for details). The two             Critically, MultiMAP is significantly faster and more scal-
datasets can be considered multimodal because they have           able than all other benchmarked methods, and significantly
different feature spaces but describe the same set of digit       faster than LIGER and Seurat 3 (Figure 3b). Seurat 3 and
images. The thin overlapping region of the two halves is          LIGER were not able to scale to the primary cortex data
not enough information to create a good embedding of the          of 600k, producing out-of-memory errors despite access to
data (Figure 2c). Many distinct digits are similar in this thin   218 GB of RAM.
central sliver, and hence they cluster together in the feature
space of this sliver. Indeed, in a UMAP projection of the         3. Discussion
data in the shared feature space of this overlap, the clusters
of different digits are not as well separated as in the UMAP      Here we present a novel approach for dimensionality re-
projections of each half (Figure 2c).                             duction and integration of multimodal data. MultiMAP
                                                                  estimates a non-linear manifold on which all data reside and
A multimodal integration strategy that effectively leverages
                                                                  then projects this manifold space into a low dimensional
all features would use the features unique to each half to
                                                                  embedding. This enables both visualization and integrated
separate different digits, and the shared space to bring the
                                                                  downstream analyses of all datasets simultaneously. Cru-
same digits from each dataset close together (Figure 2d).
                                                                  cially, our method takes into account the full data, even
We show that with MultiMAP the different modalities are
                                                                  when they have different feature spaces, and thus takes ad-
well mixed in the embedding space and the digits cluster
                                                                  vantage of the full power of multi-omics data. Ignoring
separately, despite mostly different feature spaces and noise
                                                                  the features unique to one dataset (as in existing methods),
being added to only the second dataset. This indicates that
                                                                  may omit important information, for instance distinguish-
MultiMAP is leveraging the features unique to each dataset
                                                                  ing features of certain subpopulations of cells and yield
and is also robust to datasets with different noise.
                                                                  an integrated embedding that does not distinctly cluster all
                                                                  subpopulations. Comparison with existing methods for inte-
2.2. Benchmarking                                                 gration shows that MultiMAP outperforms or has close to
We assessed and benchmarked the performance of Mul-               best performance in every performance metric studied. In
tiMAP against several popular approaches for integrating          particular, MultiMAP far more fast and scalable than current
single-cell multi-omics, including Seurat 3[11], LIGER[12],       approaches.
Conos[22] and GLUER[23].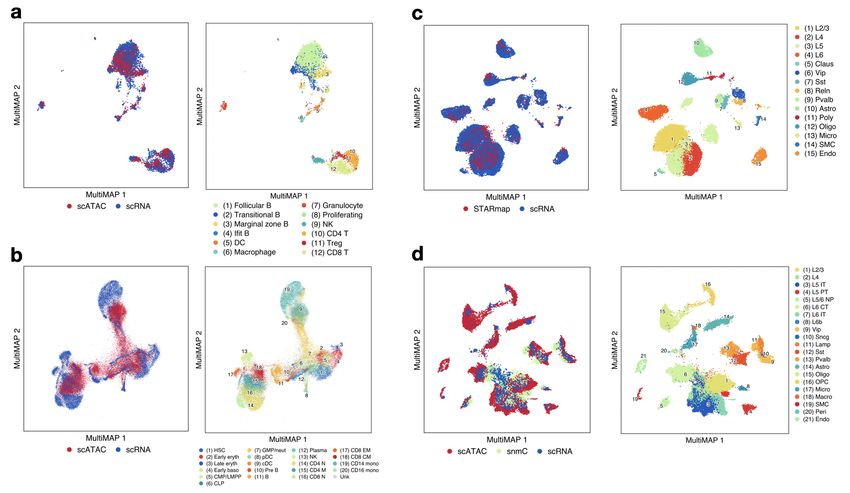
Submission and Formatting Instructions for ICML 2021

Figure 2. MultiMAP applied to synthetic data. a. Data sampled from the 3D Swiss Roll (X1) and a 2D rectangle (X2). b. Shared
embedding of both datasets produced by MultiMAP. Color indicates position along the manifold (a,b). c. Left (X1) and right (X2) halves
of MNIST handwritten digit images with a 2 pixel wide shared region. Gaussian noise is added to the left half. UMAP projections of each
half and the shared region. d. Shared embedding of both MNIST halves (including Gaussian noise introduced for the left half) produced
by MultiMAP. Each color is a different handwritten digit (0-9 as shown in the key). This illustrates that MultiMAP leverages both shared
and unshared features to integrate multimodal datasets.

Using synthetic examples to illustrate the power of the               examples include the integration of data across species to
method, we show that MultiMAP leverages the features                  enable studying the evolution of cell states and identifying
unique to each dataset, is capable of discovering non-linear          conserved cell types and regulatory programs. Along sim-
transformations, and is robust to data with noise. Through-           ilar lines, the integration of in vivo with in vitro models
out our applications of MultiMAP to diverse single-cell               such as organoids will reveal the quality or faithfulness of
multi-omic data, we demonstrate that our method can fa-               cells in a dish relative to their native counterparts. Finally,
cilitate integration across transcriptomic, epigenomic, and           given the rapid development of joint multimodal single cell
spatially resolved datasets, and derive biological insights           genomics methods (e.g. CITEseq for protein and RNA,
jointly from multi-omic single-cell data. This demonstrates           joint snRNA- and ATACseq), it is relevant to emphasize that
that MultiMAP can align datasets across different technolo-           MultiMAP can be applied to multi-omic data acquired both
gies and modalities even with extensive biological and tech-          from different cells as well as from the same cells.
nical differences. The ability of MultiMAP scale to massive
                                                                      In summary, given the broad appeal of dimensionality reduc-
datasets and integrate more than two omics technologies
                                                                      tion methods (e.g. PCA, tSNE, UMAP), and the growth of
opens many opportunities for the comprehensive study of tis-
                                                                      multimodal data in many areas of science and engineering,
sues. Crucially, we show that MultiMAP is flexible enough
                                                                      we anticipate that MultiMAP will find wide and diverse use.
to integrate datasets with different clusters and cell popula-
tions, illustrating that MultiMAP is applicable even when
datasets contain some different cell type populations.                4. References
Perhaps the greatest potential lies in applying MultiMAP              1. Becht, E. et al. Dimensionality reduction for visualiz-
to datasets beyond those considered here. Integrative anal-           ing single-cell data using UMAP. Nat. Biotechnol. (2018)
ysis with MultiMAP can be used to compare healthy and                 doi:10.1038/nbt.4314.
diseased states, and identify pathologic features, or to un-
                                                                      2. Stoeckius, M. et al. Simultaneous epitope and transcrip-
cover cell-type specific responses to perturbations. Other
                                                                      tome measurement in single cells. Nature Methods vol. 14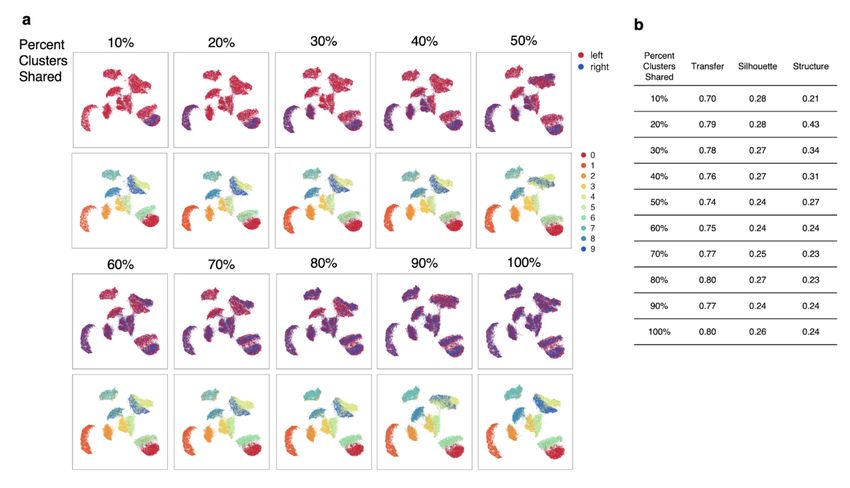
Submission and Formatting Instructions for ICML 2021

Figure 3. MultiMAP applied to single-cell data. a. MultiMAP embedding of the integration of published scATAC-seq15 and newly
generated scRNA-seq data of the mouse spleen (n=1), colored by omic technology and independent cell type annotations of each omic
technology. b. MultiMAP embedding of the integration of single-cell transcriptomics and chromatin accessibility of human bone marrow
and peripheral blood mononuclear cells[16] colored by omic technology and by the published cell type annotation. c. MultiMAP
embedding of scRNA-seq17 (n=2) and spatial STARmap[18] (n=2) data of the mouse brain, colored by omic technology and joint clusters
identified with the MultiGraph. d. MultiMAP embedding of the integration of single-cell transcriptomics, chromatin accessibility, and
DNA methylation of the mouse primary cortex, colored by omic technology and the published cell type annotation[20].

865–868 (2017).                                                     cell data science. Genome Biol. 21, 31 (2020).
3. Peterson, V. M. et al. Multiplexed quantification of pro-        11. Stuart, T. et al. Comprehensive Integration of Single-
teins and transcripts in single cells. Nature Biotechnology         Cell Data. Cell vol. 177 1888–1902.e21 (2019).
vol. 35 936–939 (2017).
                                                                    12. Welch, J. D. et al. Single-Cell Multi-omic Integration
4. Klemm, S. L., Shipony, Z. Greenleaf, W. J. Chromatin             Compares and Contrasts Features of Brain Cell Identity.
accessibility and the regulatory epigenome. Nat. Rev. Genet.        Cell vol. 177 1873–1887.e17 (2019).
20, 207–220 (2019).
                                                                    13. Lopez, R. et al. A joint model of unpaired data from
5. Karemaker, I. D. Vermeulen, M. Single-Cell DNA                   scRNA-seq and spatial transcriptomics for imputing missing
Methylation Profiling: Technologies and Biological Ap-              gene expression measurements. arXiv [cs.LG] (2019).
plications. Trends Biotechnol. 36, 952–965 (2018).
                                                                    14.    GradientBased Learning Applied to Document
6. Mayr, U., Serra, D. Liberali, P. Exploring single cells in       Recognition.    Intelligent Signal Processing (2009)
space and time during tissue development, homeostasis and           doi:10.1109/9780470544976.ch9.
regeneration. Development 146, (2019).
                                                                    15. Chen, X., Miragaia, R. J., Natarajan, K. N. Teichmann,
7. Regev, A. et al. The Human Cell Atlas. Elife 6, (2017).          S. A. A rapid and robust method for single cell chromatin
                                                                    accessibility profiling. Nat. Commun. 9, 5345 (2018).
8. HuBMAP Consortium. The human body at cellular
resolution: the NIH Human Biomolecular Atlas Program.               16. Granja, J. M. et al. Single-cell multiomic analysis
Nature 574, 187–192 (2019).                                         identifies regulatory programs in mixed-phenotype acute
                                                                    leukemia. Nat. Biotechnol. 37, 1458–1465 (2019).
9. Efremova, M. Teichmann, S. A. Computational methods
for single-cell omics across modalities. Nat. Methods 17,           17. Saunders, A. et al. Molecular Diversity and Specializa-
14–17 (2020).                                                       tions among the Cells of the Adult Mouse Brain. Cell 174,
                                                                    1015–1030.e16 (2018).
10. Lähnemann, D. et al. Eleven grand challenges in single-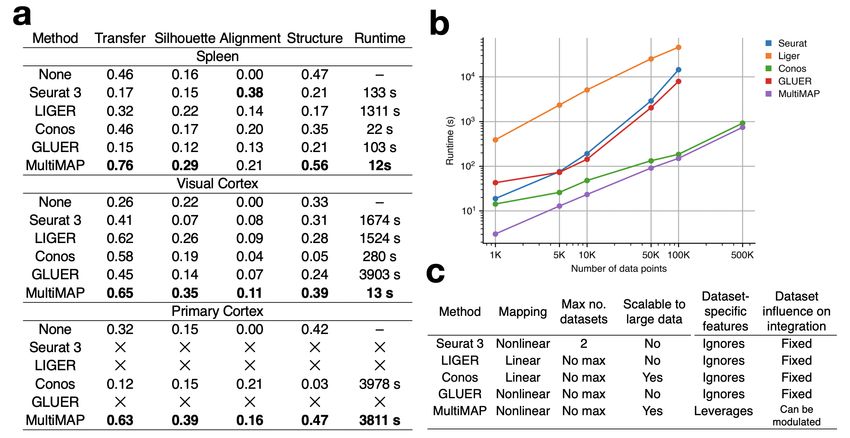
Submission and Formatting Instructions for ICML 2021

Figure 4. Benchmarking MultiMAP against existing approaches. a. Comparison of each method in terms of transfer learning accuracy
(“Transfer”), separation of cell type clusters as quantified by Silhouette coefficient (“Silhouette”), mixing of different datasets as measured
by fraction of nearest neighbours that belong to a different dataset (“Alignment”), preservation of high-dimensional structure as measured
by the Pearson correlation between distances in the high- and low-dimensional spaces (“Structure”), and runtime. b. Wall-clock time of
multi-omic integration methods on different sized datasets. Seurat 3 and LIGER produced out-of-memory errors when run on 500,000
data points (218 GB RAM). To produce these datasets we subsampled the mouse primary cortex scRNA-seq and scATAC-seq data[20]
using geometric sketching[33]. The datasets were subsampled so that there are equal number of cells in the scRNA-seq and scATAC-seq
data until 100,000 cells. Since the scATAC-seq data had 81,196 cells in total, for the 500,000 cells comparison, we used an scRNA-seq of
418,804 cells. c. Comparison of capabilities and properties of each method. “Mapping” refers to the nature of the mapping employed by
the method; “Max no. datasets” refers to the upper limit in terms of numbers of datasets accepted by the method; “Scalable to large data”
refers to allowing a total of over 500,000 cells; “Data-set specific features” is whether the integration method allows information that
is not shared across datasets; and “Dataset influence on integration” is whether the user can modulate the weighting of a given dataset
relative to the others during the integration.

18. Wang, X. et al. Three-dimensional intact-tissue se-                  24. Muraro, M. J. et al. A Single-Cell Transcriptome Atlas
quencing of single-cell transcriptional states. Science 361,             of the Human Pancreas. Cell Syst 3, 385–394.e3 (2016).
(2018).
                                                                         25. Segerstolpe, Å. et al. Single-Cell Transcriptome Pro-
19. Brodmann, K. Brodmann’s: Localisation in the Cerebral                filing of Human Pancreatic Islets in Health and Type 2
Cortex. (Springer Science Business Media, 2007).                         Diabetes. Cell Metab. 24, 593–607 (2016).
20. Yao, Z. et al. An integrated transcriptomic and epige-               26. Baron, M. et al. A Single-Cell Transcriptomic Map of
nomic atlas of mouse primary motor cortex cell types.                    the Human and Mouse Pancreas Reveals Inter- and Intra-cell
2020.02.29.970558 (2020) doi:10.1101/2020.02.29.970558.                  Population Structure. Cell Syst 3, 346–360.e4 (2016).
21. Yamawaki, N., Borges, K., Suter, B. A., Harris, K. D.                27. Chazarra-Gil, R., van Dongen, S., Kiselev, V. Y. Hem-
Shepherd, G. M. G. A genuine layer 4 in motor cortex with                berg, M. Flexible comparison of batch correction methods
prototypical synaptic circuit connectivity. Elife 3, e05422              for single-cell RNA-seq using BatchBench. Nucleic Acids
(2014).                                                                  Res. (2021) doi:10.1093/nar/gkab004.
22. Barkas, N. et al. Joint analysis of heterogeneous                    28. Roels, J. et al. Distinct and temporary-restricted epige-
single-cell RNA-seq dataset collections. Nat. Methods                    netic mechanisms regulate human and T cell development.
16, 695–698 (2019).                                                      Nat. Immunol. 21, 1280–1292 (2020).
23. Peng, T., Chen, G. M. Tan, K. GLUER: integrative anal-               29. Jia, G. et al. Single cell RNA-seq and ATAC-seq anal-
ysis of single-cell omics and imaging data by deep neural                ysis of cardiac progenitor cell transition states and lineage
network. doi:10.1101/2021.01.25.427845.                                  settlement. Nat. Commun. 9, 4877 (2018).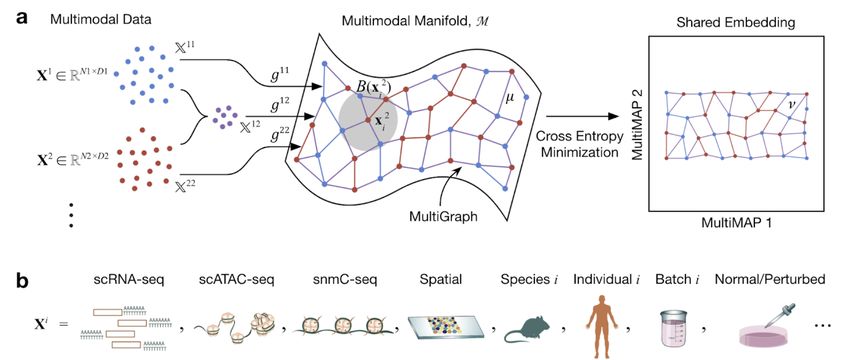
Submission and Formatting Instructions for ICML 2021

30. Chen, H. et al. Single-cell trajectories reconstruction,     Biol. 15, e1006731 (2019).
exploration and mapping of omics data with STREAM. Nat.
                                                                 45. Zhu, X., Ghahramani, Z. Lafferty, J. D. Semi-supervised
Commun. 10, 1903 (2019).
                                                                 learning using gaussian fields and harmonic functions. in
31. Park, J.-E. et al. A cell atlas of human thymic devel-       Proceedings of the 20th International conference on Ma-
opment defines T cell repertoire formation. Science 367,         chine learning (ICML-03) 912–919 (2003).
(2020).
                                                                 46. Pliner, H. A. et al. Cicero Predicts cis-Regulatory DNA
32. Hosokawa, H. Rothenberg, E. V. How transcription             Interactions from Single-Cell Chromatin Accessibility Data.
factors drive choice of the T cell fate. Nature Reviews          Mol. Cell 71, 858–871.e8 (2018).
Immunology (2020) doi:10.1038/s41577-020-00426-6.
                                                                 47. Kozareva, V. et al. A transcriptomic atlas of the mouse
33. Hie, B., Cho, H., DeMeo, B., Bryson, B. Berger, B.           cerebellum reveals regional specializations and novel cell
Geometric Sketching Compactly Summarizes the Single-             types. doi:10.1101/2020.03.04.976407.
Cell Transcriptomic Landscape. Cell Syst 8, 483–493.e7
                                                                 48. Rousseeuw, P. J. Silhouettes: A graphical aid to the
(2019).
                                                                 interpretation and validation of cluster analysis. Journal of
34. Lecun, Y., Bottou, L., Bengio, Y. Haffner, P. Gradient-      Computational and Applied Mathematics vol. 20 53–65
based learning applied to document recognition. Proceed-         (1987).
ings of the IEEE vol. 86 2278–2324 (1998).
35. Hern, W. M. Correlation of fetal age and measurements
between 10 and 26 weeks of gestation. Obstet. Gynecol. 63,
26–32 (1984).
36. van den Brink, S. C. et al. Single-cell sequencing reveals
dissociation-induced gene expression in tissue subpopula-
tions. Nat. Methods 14, 935 (2017).
37. Fang, R. et al. Fast and Accurate Clustering of Single
Cell Epigenomes Reveals Cis-Regulatory Elements in Rare
Cell Types. doi:10.1101/615179.
38. Schep, A. N., Wu, B., Buenrostro, J. D. Greenleaf, W.
J. chromVAR: inferring transcription-factor-associated ac-
cessibility from single-cell epigenomic data. Nat. Methods
14, 975–978 (2017).
39. Blondel, V. D., Guillaume, J.-L., Lambiotte, R. Lefeb-
vre, E. Fast unfolding of communities in large networks.
Journal of Statistical Mechanics: Theory and Experiment
vol. 2008 P10008 (2008).
40. Haghverdi, L., Büttner, M., Wolf, F. A., Buettner, F.
Theis, F. J. Diffusion pseudotime robustly reconstructs lin-
eage branching. Nat. Methods 13, 845 (2016).
41. Wolf, F. A., Angerer, P. Theis, F. J. SCANPY: large-
scale single-cell gene expression data analysis. Genome
Biol. 19, 15 (2018).
42. Van den Berge, K. et al. Trajectory-based differential
expression analysis for single-cell sequencing data. Nat.
Commun. 11, 1201 (2020).
43. Wolock, S. L., Lopez, R. Klein, A. M. Scrublet: Com-
putational Identification of Cell Doublets in Single-Cell
Transcriptomic Data. Cell Syst 8, 281–291.e9 (2019).
44. Grytten, I. et al. Graph Peak Caller: Calling ChIP-seq
peaks on graph-based reference genomes. PLoS Comput.
Submission and Formatting Instructions for ICML 2021 5. Supplemental Figure S1. MultiMAP’s weight parameter. a. UMAP projections of the two halves of the MNIST handwritten digit images. b. MultiMAP embeddings as the weight parameters are varied. Each color is a different handwritten digit (0-9). When ω 1 is larger than ω 2 , the embedding more closely resembles the projection of only X1 ; when ω 2 is larger than ω 1 , the embedding more closely resembles the projection of only X2 . For different choices of ω v , the datasets are well integrated in the embedding space. c. MultiMAP integration with varied weight parameters of published scATAC-seq and newly generated scRNA-seq data of the mouse spleen (n=1) [15]. d. Comparison of the MultiMAP integration of the spleen data as the weight parameter is varied – in terms of transfer learning accuracy (“Transfer”), separation of cell type clusters as quantified by Silhouette coefficient (“Silhouette”), and preservation of high-dimensional structure as measured by the Pearson correlation between distances in the high- and low-dimensional spaces (“Structure”)
Submission and Formatting Instructions for ICML 2021

Figure S2. MultiMAP integration with non-shared clusters. a. MultiMAP integration of the left and right halves of MNIST handwritten
digit images with a 2 pixel wide shared region. Gaussian noise is added to the left half. MultiMAP integration is performed with a varying
number of digit clusters removed from the right dataset, so that the integration ranges from one shared cluster (10%) to all clusters shared
(100%). b. Comparison of the MultiMAP integration of the modified MNIST dataset as the percent of clusters shared is varied – in
terms of transfer learning accuracy (“Transfer”), separation of cell type clusters as quantified by Silhouette coefficient (“Silhouette”), and
preservation of high-dimensional structure as measured by the Pearson correlation between distances in the high- and low-dimensional
spaces (“Structure”).
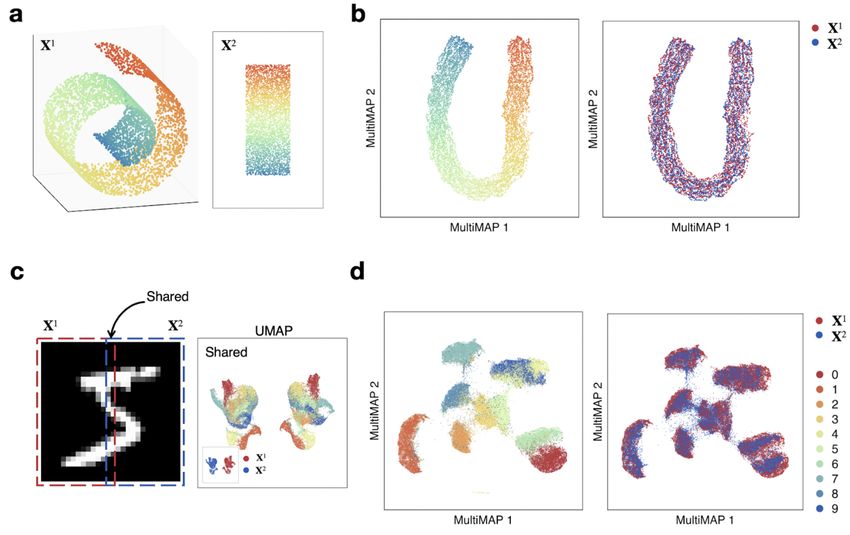
Submission and Formatting Instructions for ICML 2021

Figure S3. MultiMAP integration with all features vs. only shared features in the spleen scRNA-seq + scATACseq, and visual
cortex STARmap + scRNAseq datasets. a. MultiMAP embeddings using all genes present in each dataset (intended use of MultiMAP).
b. MultiMAP embeddings using only genes shared by all datasets in each integration. c. Comparison of the MultiMAP integration with
all features vs. only shared features – in terms of transfer learning accuracy (“Transfer”), separation of cell type clusters as quantified by
Silhouette coefficient (“Silhouette”), mixing of different datasets as measured by fraction of nearest neighbours that belong to a different
dataset (“Alignment”), and preservation of high-dimensional structure as measured by the Pearson correlation between distances in the
high- and low-dimensional spaces (“Structure”).
You can also read