Natural variation in the consequences of gene overexpression and its implications for evolutionary trajectories - eLife
←
→
Page content transcription
If your browser does not render page correctly, please read the page content below
RESEARCH ARTICLE

                                    Natural variation in the consequences of
                                    gene overexpression and its implications
                                    for evolutionary trajectories
                                    DeElegant Robinson1, Michael Place2, James Hose3, Adam Jochem3,
                                    Audrey P Gasch2,3,4*
                                    1
                                     Microbiology Doctoral Training Program, University of Wisconsin-Madison,
                                    Madison, United States; 2Great Lakes Bioenergy Research Center, University of
                                    Wisconsin-Madison, Madison, United States; 3Center for Genomic Science
                                    Innovation, University of Wisconsin-Madison, Madison, United States; 4Department
                                    of Medical Genetics, University of Wisconsin-Madison, Madison, United States

                                    Abstract Copy number variation through gene or chromosome amplification provides a route
                                    for rapid phenotypic variation and supports the long-term evolution of gene functions. Although
                                    the evolutionary importance of copy-number variation is known, little is understood about how
                                    genetic background influences its tolerance. Here, we measured fitness costs of over 4000
                                    overexpressed genes in 15 Saccharomyces cerevisiae strains representing different lineages, to
                                    explore natural variation in tolerating gene overexpression (OE). Strain-specific effects dominated
                                    the fitness costs of gene OE. We report global differences in the consequences of gene OE,
                                    independent of the amplified gene, as well as gene-specific effects that were dependent on the
                                    genetic background. Natural variation in the response to gene OE could be explained by several
                                    models, including strain-specific physiological differences, resource limitations, and regulatory
                                    sensitivities. This work provides new insight on how genetic background influences tolerance to
                                    gene amplification and the evolutionary trajectories accessible to different backgrounds.
*For correspondence:
agasch@wisc.edu

Competing interests: The
authors declare that no             Introduction
competing interests exist.
                                    Genetic variation that underlies phenotypic differences provides the material on which evolutionary
Funding: See page 17                selection acts. This variation includes single-nucleotide polymorphisms (SNPs), insertions and small
Preprinted: 19 May 2021             deletions, and other structural rearrangements. DNA copy number variants (CNVs) can also serve as
Received: 21 May 2021               a powerful source of variation. CNVs span small tandem duplication of one or few genes to large
Accepted: 30 July 2021              segmental duplication and even chromosomal aneuploidy that amplifies many genes together
Published: 02 August 2021           (Hastings et al., 2009; Levasseur and Pontarotti, 2011). Although most duplications are likely lost
                                    shortly after creation (Ohno, 1970; Lynch and Conery, 2000; Voordeckers and Verstrepen, 2015),
Reviewing editor: Kevin J
                                    the functional redundancy afforded by gene duplication can support the long-term evolution of new
Verstrepen, VIB-KU Leuven
Center for Microbiology,
                                    functions (neofunctionalization) or a division of functional labor among the duplicated genes (sub-
Belgium                             functionalization) (Graur and Wh, 2000). Neutral or nearly neutral variants can accumulate over time
                                    in a population, and this standing variation can accelerate evolution when organisms encounter a
   Copyright Robinson et al. This
                                    new environment (Hermisson and Pennings, 2005; Przeworski et al., 2005; Barrett and Schluter,
article is distributed under the
                                    2008; Zheng et al., 2020). But CNVs can also produce immediate changes in cellular fitness due to
terms of the Creative Commons
Attribution License, which          the effective increase in gene expression, at least for some genes (Kondrashov, 2012). For example,
permits unrestricted use and        yeast cultures challenged by low glucose, sulfate, or nitrogen levels benefit from amplifying genes
redistribution provided that the    encoding transporters of glucose (HXT6/7), sulfate (SUL1), and amino acids (GAP1) (Brown et al.,
original author and source are      1998; Gresham et al., 2008; Gresham et al., 2010; Sanchez et al., 2017). A genome-wide study in
credited.                           Escherichia coli showed that 115 amplified genes, including efflux pumps/transporters, regulatory

Robinson et al. eLife 2021;10:e70564. DOI: https://doi.org/10.7554/eLife.70564                                                    1 of 23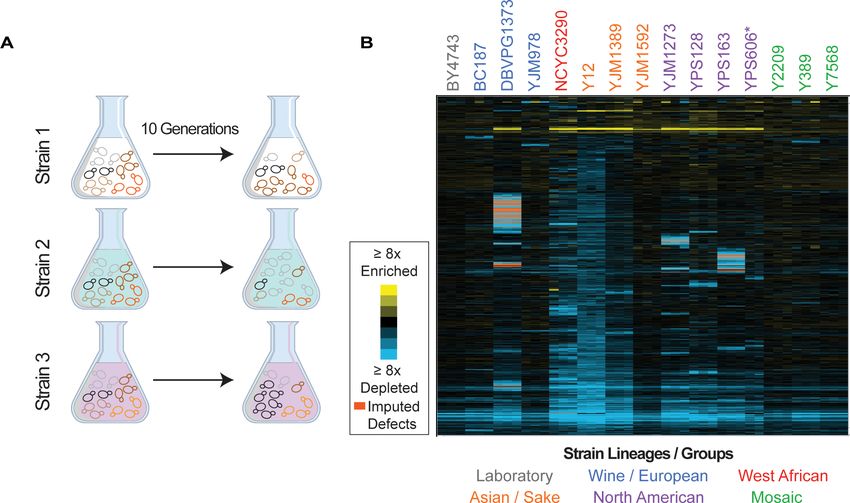
Research article                                                                                           Genetics and Genomics

                                   genes, and prophage genes, increased tolerance to numerous antibiotics and toxins when overex-
                                   pressed (Soo et al., 2011). Consistently, amplification of transporters and resistance genes is an
                                   early event in the bacterial evolution of antibiotic resistance (Sandegren and Andersson, 2009). Fur-
                                   thermore, whole-chromosome duplication in human fungal pathogens can produce immediate resis-
                                   tance to anti-fungal agents, due to overexpression (OE) of drug efflux pumps and their regulators
                                   (Selmecki et al., 2006; Sionov et al., 2010; Ni et al., 2013; Berman and Krysan, 2020), and gene
                                   amplifications often underlies chemoresistance in cancer cells (Yasui et al., 2004; Mishra and
                                   Whetstine, 2016). These examples illustrate the importance of gene duplication in rapid phenotypic
                                   change, especially in response to drugs and environmental stresses where tolerant individuals can
                                   rapidly emerge.
                                       While the potential evolutionary benefits afforded by gene amplification are well known, there is
                                   also a significant fitness cost (Adler et al., 2014; Moriya, 2015). The costs and consequences of
                                   gene OE are perhaps best studied in Saccharomyces cerevisiae. Protein overproduction can cause a
                                   shortage of resources, including nucleotides required for additional DNA synthesis, nucleosides con-
                                   sumed by transcriptional burden, and amino acids and ATP required for translation (Wagner, 2007).
                                   Which resources become limiting can depend on the environment: for example, transcription was
                                   shown to be limiting in yeast grown during phosphate starvation, whereas translation is likely limiting
                                   when cells are grown in minimal media with low amino acid availability (Kafri et al., 2016; Metzl-
                                   Raz et al., 2017; Metzl-Raz et al., 2020). Other cellular processes can become taxed as well. Sev-
                                   eral studies used the yeast gene-deletion library to investigate genes and processes required to
                                   accommodate OE of specific proteins such as GFP (Farkas et al., 2018; Kintaka et al., 2020).
                                   Although results varied somewhat by which protein was overproduced, collectively these studies
                                   showed that gene OE can put a burden on mRNA and protein export systems, protein folding chap-
                                   erones, and protein degradation machinery.
                                       Cells are also impacted by OE of specific genes and functional classes. Several studies have quan-
                                   tified the fitness consequences of gene-OE libraries in laboratory strains of budding yeast S. cerevi-
                                   siae to reveal fitness consequences across many OE genes (Sopko et al., 2006; Ho et al., 2009;
                                   Magtanong et al., 2011; Makanae et al., 2013). Deleterious OE genes are enriched for those
                                   encoding proteins in multi-subunit complexes such as the ribosome. One model to explain this
                                   enrichment is that perturbing stoichiometric balances will perturb complex assembly and function
                                   (Papp et al., 2003; Veitia et al., 2008; Birchler and Veitia, 2012; Moriya, 2015). Cells have mecha-
                                   nisms to control the dosage of some of these proteins, yet high-copy OE can still overwhelm these
                                   mechanisms in the cell (Li et al., 1995; Li et al., 1996; Fewell and Woolford, 1999; Hose et al.,
                                   2015; Ascencio et al., 2021). Protein OE can also force promiscuous interactions, perturbing pro-
                                   tein interaction networks. Proteins with intrinsically disordered regions (IDRs) are particularly suscep-
                                   tible to promiscuous interactions with other proteins, and deleterious OE genes are enriched for
                                   those with IDRs (Gsponer et al., 2008; Vavouri et al., 2009; Ma et al., 2010; Chakrabortee et al.,
                                   2016). In fact, proteins encoded by gene duplicates fixed in several species are under-enriched for
                                   those with IDRs (Banerjee et al., 2017), suggesting the impact on long-term evolution. Finally, OE
                                   of transcription factors, kinases, and other regulators can trigger broad downstream effects that in
                                   turn amplify the expression of other downstream proteins, further taxing proteostasis but potentially
                                   also producing phenotypes that could be beneficial (Sharifpoor et al., 2012; Moriya, 2015;
                                   Youn et al., 2017). Ultimately, the fitness benefit of gene OE must outweigh the fitness costs in a
                                   given environment in order for the duplication to be beneficial to the cell.
                                       Although the evolutionary importance of gene duplication has long been appreciated, little is
                                   known about natural variation in the tolerance of duplication of specific genes. Variation in the cost
                                   of a gene’s duplication could have a significant influence on evolutionary trajectories that are accessi-
                                   ble to different individuals. Anecdotal evidence shows that different individuals can vary widely in
                                   their response to OE of specific genes. For example, prior results from our lab showed that S. cerevi-
                                   siae strains from different genetic lineages have unique fitness responses to overexpressed genes
                                   when strains are grown in the presence of toxins (Sardi et al., 2016). A major unanswered question
                                   is the degree to which reported trends in the fitness consequences of gene OE vary across natural
                                   isolates beyond lab strains and how natural variation influences the response to gene OE.
                                       To investigate these questions, we expressed the same high-copy gene OE library applied previ-
                                   ously to laboratory S. cerevisiae strains, in 15 different yeast isolates together representing four line-
                                   ages and several admixed strains, to explore the variation in tolerance to gene OE. Our results

Robinson et al. eLife 2021;10:e70564. DOI: https://doi.org/10.7554/eLife.70564                                                        2 of 23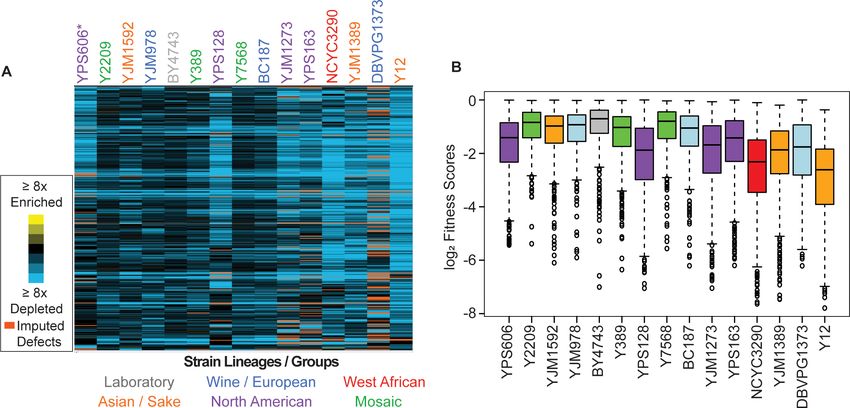
Research article                                                                                           Genetics and Genomics

                                   distinguish universal effects common to many studied strains versus strain-specific effects, including
                                   global responses independent of the OE gene as well as gene-specific sensitivities. We present evi-
                                   dence for several general models explaining strain-specific variation in the response to gene OE.
                                   These results raise important implications for the accessibility of evolutionary trajectories afforded
                                   by gene OE depending on genetic background.

                                   Results
                                   Overview
                                   We chose 15 genetically diverse S. cerevisiae strains for analysis, including strains from four defined
                                   genetic lineages (including European Wine, North American Oak, Asian, and West African), one
                                   commonly used lab strain (BY4743), and three strains that represent recently admixed ‘mosaic’
                                   strains. These isolates were collected from diverse environments including soil, vineyards, sake pro-
                                   duction, sewage, and clinical samples (Capriotti, 1955; Gerke et al., 2006; Kurtzman, 1986;
                                   McCullough et al., 1998; Sniegowski et al., 2002; Strope et al., 2015; Supplementary file 1). In
                                   addition to genetic diversity, these strains display extensive phenotype variation, for example, in
                                   nitrogen and carbon utilization (Warringer et al., 2011), nutrient requirements (Liti et al., 2009;
                                   Warringer et al., 2011), and stress tolerance (Kvitek et al., 2008; Liti et al., 2009; Will et al.,
                                   2010; Warringer et al., 2011; Strope et al., 2015; Zheng and Wang, 2015; Sardi et al., 2016;
                                   Sardi et al., 2018).
                                       Each strain was transformed with the MoBY 2.0 library that includes ~4900 open reading frames
                                   (ORFs) with their native upstream and downstream sequences, cloned into a high-copy 2-mm repli-
                                   cating plasmid (Ho et al., 2009; Magtanong et al., 2011). We chose the high-copy expression sys-
                                   tem to expose gene-specific fitness differences that may be too subtle to score when genes are
                                   merely duplicated. Although the lab strain replicates the empty vector at ~11 copies per haploid
                                   genome, most other strains maintain ~2–5 copies per haploid genome (see Figure 2—figure supple-
                                   ment 2). All strains were readily transformed with the library and grew at expected growth rates in
                                   selective media, indicating that all strains could maintain the plasmid. An aliquot of each
                                   library transformed culture was collected before and after 10 generations of competitive growth,
                                   and relative plasmid abundance was scored by quantitative sequencing of plasmid barcodes to mea-
                                   sure changes in plasmid abundance in the population, in biological triplicate (Figure 1A, see
                                   Materials and methods).
                                       Barcode abundance was normalized to the total number of reads per sample, thus producing a
                                   fitness score relative to the total set of genes expressed in each strain and accounting for strain-spe-
                                   cific differences in library expression. We measured the log2(fold change) in relative barcode abun-
                                   dance after 10 generations of competitive growth, which we refer to as the relative fitness score.
                                   Genes that are detrimental when overexpressed will drop in frequency in the population because of
                                   reduced cell growth or because cells suppress the abundance of toxic plasmids (Makanae et al.,
                                   2013), both of which we interpret as a relative fitness defect. In contrast, beneficial plasmids will rise
                                   in frequency in the population over time. We focus on genes with a significant fitness effect when
                                   OE at a false discovery rate (FDR)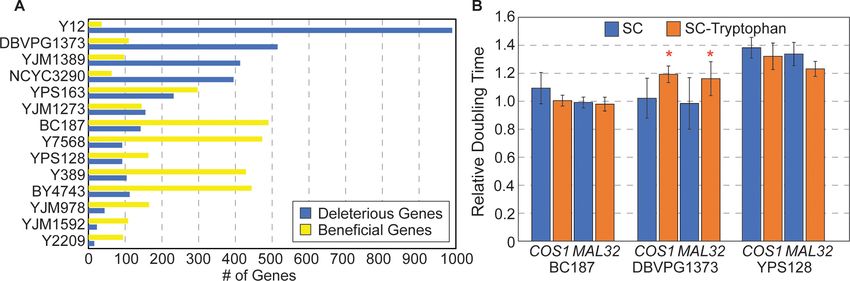
Research article                                                                                                       Genetics and Genomics

Figure 1. Overview of experiment and results. (A) Isolates transformed with the MoBY 2.0 overexpression library were grown competitively and changes
in plasmid abundance were quantified, see Materials and methods for details. (B) Heat map of hierarchically clustered log2(relative fitness scores) for
4064 genes (rows) measured in 15 strains in biological triplicate (columns) after 10 generations of growth. Strain labels are colored according to lineage.
Blue and yellow colors represent plasmids that become enriched or depleted in frequency to indicate fitness defects or benefits, respectively,
according to the key. Some barcodes with missing values after growth were inferred (see Materials and methods); those that are significant are
indicated as an orange box in the heat map. A source data file is included (see Figure 1—source data 1: Hierarchical clustered fitness scores).
The online version of this article includes the following source data for figure 1:
Source data 1. Hierarchical clustered fitness scores.

                                     palm wine but genotypically similar to Asian strains) was affected by 3060 OE genes. (We note that
                                     the low number of genes identified in YPS606 may be influenced by reduced statistical power since
                                     only duplicates of that strain were analyzed, and the lower abundance of the 2-mm plasmid in the
                                     case of YJM1592 and YJM978.) Most significant OE genes were detrimental, although there were
                                     some differences across strains. For example, whereas roughly half of the significant OE genes in the
                                     lab strain BY4743 caused a defect, over 95% of significant OE genes in the Y12 strain were detrimen-
                                     tal (Figure 2—figure supplement 1).
                                         In addition to the variable number of OE genes with fitness consequences, strains also varied in
                                     the severity of the defects (Figure 2B). While the median fitness cost of deleterious OE genes was
                                     not correlated overall with the number of deleterious genes per strain, strains with the most deleteri-
                                     ous genes (NCYC3290, YJM1389, and Y12) did show an expanded range of fitness costs, with more
                                     genes showing very strong deleterious effects compared to other strains (Figure 2B). Importantly,
                                     there was no correlation between the number of deleterious OE genes and Moby 2.0 copy number
                                     maintained in the strains (Figure 2—figure supplement 2A), as expected since our normalization
                                     procedure reflects gene fitness effects relative to the overall library in that strain. Most significant
                                     genes produced fitness effects in only a subset of strains (Figure 2C), even though results were
                                     highly reproducible within strain replicates, with over half the 4064 significant genes producing a

Robinson et al. eLife 2021;10:e70564. DOI: https://doi.org/10.7554/eLife.70564                                                                     4 of 23
Research article Genetics and Genomics Figure 2. Strain backgrounds display a wide range of fitness effects. (A) The number of deleterious genes in each strain (FDR
Research article                                                                                                    Genetics and Genomics

Figure 3. Commonly deleterious genes affect many strains but to different degrees. (A) Heat map of log2 (relative fitness scores) as shown in Figure 1B
but for 431 commonly deleterious genes. (B) The distribution of the log2 (relative fitness scores) (taking the replicate average for each gene) for 431
commonly deleterious genes are plotted. Imputed scores were not included. The strains are ordered based on the total number of deleterious genes,
from smallest to largest (left to right). A source data file is included (see Figure 3—source data 1).
The online version of this article includes the following source data for figure 3:
Source data 1. Hierarchical clustered commonly deleterious genes fitness scores.

                                     localize to the nucleus, and essential proteins (p
Research article Genetics and Genomics
Another hypothesis for dosage sensitivity is that already abundant proteins emerging from genes
and transcripts that are highly transcribed and/or translated may be more subject to aggregation if
further overexpressed. While the total set of common genes is expressed at higher mRNA and pro-
tein abundance, this trend was driven by translation factors and was not significant when translation
factors were removed from the analysis. Thus, while high abundance of translation factors could con-
tribute to their dosage effects, high expression alone is not a predictor of OE toxicity for other
genes. Together, our work suggests that the propensity to disrupt protein interaction networks is
likely a driving factor in OE gene toxicity.
Strain-specific responses to library overexpression may reflect global
differences in resource allocation
Although we identified a common set of deleterious OE genes, strains clearly varied in their
response to the library, in multiple distinct ways. Even for commonly deleterious genes, isolates var-
ied in the severity of their responsiveness (Figure 3). In general, strains with a larger number of dele-
terious OE genes displayed more severe median relative fitness costs in response to common-gene
OE than strains with fewer deleterious OE genes—the exception was North American oak-soil strains
that showed aberrantly high fitness costs of common-gene OE even though they were not the most
sensitive in terms of number of deleterious-gene effects (Figure 3B, purple boxes). These differen-
ces cannot be explained by gross differences in gene-OE levels, since strains with comparable Moby
2.0 copy numbers showed vastly different responses. For example, BC187 and YPS128 carry compa-
rable plasmid copy numbers (Figure 2—figure supplement 2A), yet YPS128 is much more sensitive
to commonly deleterious genes than BC187. Instead, these data suggest that some strains are more
sensitive to gene amplification, even for OE genes that are commonly deleterious across many
strains.
Several possibilities could explain these results. One is that cells have different capacities for tol-
erating protein overproduction, regardless of the OE gene. To test this, we measured growth rates
in response to OE of a non-native yeast protein, GFP, expressed from the highly active TEF1 pro-
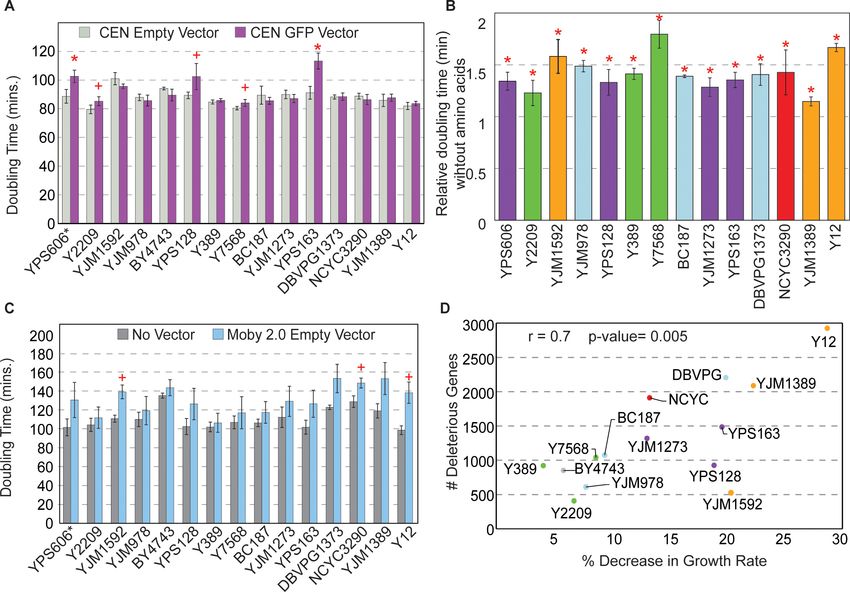
moter on a low-copy CEN vector. Strains with the most deleterious OE genes in fact did not show
higher sensitivity to GFP overexpression; however, three of the four North American oak-soil strains
did, as indicated by significantly slower doubling times (Figure 4A). The reduced growth was not
due to excessive GFP production as the oak strains express GFP at levels comparable to other
strains tested (Figure 4—figure supplement 1A). One possibility is that these strains have reduced
capacity to tolerate high protein production due to general amino acid shortage. To test, we mea-
sured growth rates during GFP OE when strains were grown in synthetic media with and without
amino acids; however, growth rates of the oak strains as a group were not different than other
strains, all of which grew comparably slower in the absence of amino acids (Figure 4B). The sensitiv-
ity of all strains to amino acid shortage is consistent with previous reports in the lab strain
(Farkas et al., 2018). However, the degree of sensitivity to amino acid shortage did not correlate
with the overall number of deleterious genes per strain, indicating that this is unlikely a driving factor
explaining strain-specific effects.
Another possibility is that strains vary in the burden of protein overproduction in the context of
the 2-mm plasmid, which may create a different type of stress on some strains. There was no overall
correlation between the number of deleterious OE genes and the abundance of the strain’s native 2-
mm plasmid (p>0.14) (although some strains with very low native 2-mm abundance also had a high
number of deleterious genes [Figure 2—figure supplement 2B]). There was also no correlation
between deleterious gene number and Moby 2.0 copy number. Nonetheless, we wondered if some
strains may be more sensitive to the burden of the Moby 2.0 plasmid.
To test this, we measured growth rates of strains with and without the Moby 2.0 empty vector.
Although many strains grew slower when expressing the empty vector under selection, some strains
were more significantly affected (Figure 4C). While none of the tests passed an FDRResearch article Genetics and Genomics Figure 4. Strains show different sensitivities to protein and DNA expression. (A) The average and standard deviation (n=3) of doubling times for strains containing a CEN empty vector (light gray) or CEN vector expressing GFP from the TEF1 promoter (purple). Asterisk indicates FDR
Research article                                                                                                      Genetics and Genomics

                                     Strain-specific responses to specific genes implicate models for variable
                                     OE tolerance
                                     In addition to gene-independent differences in tolerating overproduction, strains also varied in their
                                     response to specific OE genes. Most overexpressed genes produced a relative fitness effect in a
                                     small number of strains, suggesting the widespread influence of genetic background (Figure 2C). To
                                     further investigate, we identified genes whose OE produced a significant fitness effect in each strain
                                     and not more than two others, which we defined as ‘strain-specific’ gene lists. The lists ranged from
                                     41 genes in the Y2209 strain to 1763 genes in the Y12 strain (Figure 5A). It is important to note that
                                     some of these effects in strains overly sensitive to the empty vector could still reflect generalized
                                     strain sensitivities. For example, 60% of the deleterious genes identified by our criteria as ‘strain-spe-
                                     cific’ in Y12 were shared with another of the top four strains most sensitive to the empty vector
                                     (DVBPG1373, YJM1592, YPS163, and YJM1389, Figure 4D). Thus, some of the identified genes may
                                     be deleterious if OE in other strains growing in suboptimal or stressful conditions.
                                         Next, we investigated functional or biophysical features enriched in each strain’s list, which might
                                     implicate strain-specific constraints in tolerating gene OE. We compared, separately, genes that
                                     were specifically beneficial or detrimental in a given strain to a list of genes in that strain that were
                                     well-measured but produced no effect on fitness (FDR>0.1, see Materials and methods). To interpret
                                     the results, we also measured strain-specific gene expression differences through triplicated RNA-
                                     seq transcriptomic experiments (Supplementary file 5) to explore connections between native gene
                                     expression and the fitness consequences of gene OE.
                                         Among the many sets of functional and biophysical enrichments (see Supplementary file 6), sev-
                                     eral themes emerged that suggest models for strain-specific responses to gene OE. The first model
                                     may be particular to our experimental design, in which the S288c allele is expressed in the library.
                                     Beneficial OE genes in BC187 and Y7568 harbored an overabundance of nonsynonymous SNPs
                                     between the overexpressed S288c allele and the strains’ native allele (p
Research article Genetics and Genomics
A second model explaining strain-specific gene OE effects is one in which the unique physiology
of a strain causes a unique response to gene OE. This model is supported by functional enrichments
for strain-specific OE gene lists, especially when those functions relate to differentially expressed
genes in the same strains (Supplementary file 7). There were several functional categories that were
enriched for multiple strain-specific lists. For example, OE genes beneficial to DBVPG1373 or Y12
were enriched for genes involved in the mitotic cell cycle (pResearch article Genetics and Genomics
Genes highly beneficial to some strains may relate to 2-mm replication
We identified a unique cluster of 21 genes whose OE was strongly beneficial in over half (60%) of
the strains, but notably not the lab strain. Although not enriched for any specific functions, the group
included multiple genes involved in ribosome biogenesis/function (RRP6, RRP7, LOC1, RPL35B, and
DOM34). Interestingly, over half the genes are located next to a centromere, and on closer inspec-
tion the plasmids would have cloned the centromere in the genes’ upstream regions. This was inter-
esting because 2-mm segregation is closely coupled with chromosome segregation (Liu et al., 2014;
Mehta et al., 2002). Past work showed that cloning centromeric sequences onto a 2-mm replicating
plasmid reduces copy number to that of chromosome levels (Apostol and Greer, 1988). This raised
the possibility that CEN sequences rather than the cloned genes could influence fitness effects in the
cell, at least for a subset of these genes.
We selected two plasmids from the beneficial gene cluster that encode ERG26 (involved in ergos-
terol biosynthesis) or LOC1 (involved in mRNA localization and also ribosome biogenesis) and the
adjacent CEN encompassed in their upstream regions. Oak-soil strain YPS128 carrying the ERG26 or
LOC1 plasmids grew faster than the empty vector control, confirming the fitness benefit to this strain
(Figure 6A). If the reduced copy number and growth benefit afforded to YPS128 is due only to the
cloned CEN, then deleting the entire ORF or the start codon should retain the benefits provided by
the CEN that remains on the plasmid. We generated derivatives of each plasmid in which the ORF
(but not upstream sequence) was deleted or the start codon replaced with a stop codon (M*).
Although the plasmid in which ERG26 was deleted showed some benefits, the other mutants did
not, even though the ERG26 M* variant retained lower copy number (Figure 6). Thus, although half
the plasmids in this cluster had cloned the CEN, the gene product may still be important. While
future research will be required to disentangle why these plasmids provide a benefit, these results
are yet another example in which strains respond differently to the same experimental environment.
Figure 6. Highly beneficial genes may relate to 2-mm replication. (A) Average and standard deviation of doubling times of strain YPS128 carrying
ERG26 or LOC1 Moby 2.0 vectors relative to the empty vector (n=5), or vectors in which the gene portion was deleted (D) or the start codon was
mutated (M*). Asterisk indicates significantly faster growth rate versus the empty-vector control (pResearch article Genetics and Genomics
Discussion
Our work shows that genetic background has a profound influence on how cells respond to gene
OE. Out of the ~4000 genes whose OE impacted fitness in at least one isolate, only ~12% influenced
fitness in 10 or more of the 15 strains. A hallmark of the 431 commonly deleterious OE genes is their
potential to perturb protein-interaction networks, either because the proteins naturally display many
connections or because their biophysical properties may force promiscuous interactions when over-
expressed (Gsponer et al., 2008; Vavouri et al., 2009; Ma et al., 2010; Chakrabortee et al.,
2016). But even for commonly deleterious genes, strains varied in the cost incurred by their OE. We
suggest two main classes for strain-specific effects. One is general responses that may be indepen-
dent of the overexpressed gene. For example, some strains became sensitized to gene OE in the
context of the high-copy plasmid: those with greater sensitivity to the empty vector (independent of
the vector copy number) showed proportionately more deleterious OE genes and with greater fit-
ness costs. Whether this limitation is due to the burden of extra DNA or something related to the
stress of 2-mm replication is not clear; nonetheless, the result unmasks strain-specific vulnerabilities
that have a broad impact. We note that many of the genes scored as deleterious in these sensitive
strains may cause fitness defects in other strains grown in suboptimal or stressful conditions. The sec-
ond class of strain-specific effects pertains to gene-specific responses. Our results suggest several
explanatory models, including strain-specific physiological differences, strain-specific resource limita-
tion, and unique sensitivities to network perturbation by regulator amplification.
The implications of our study are several-fold. The first is that strains may have differential access
to evolutionary trajectories if the cost of gene duplication varies across individuals. CNVs can pro-
duce immediate phenotypic gains for genes not subject to dosage control (Zhang et al., 2009; Kon-
drashov, 2012; Hose et al., 2015), but they can also produce standing genetic variation on which
selection can later act. This standing variation is important for the long-term functional evolution
(Ohno, 1970; Graur and Wh, 2000) and it can also accelerate evolution when selective pressures
change (Zheng et al., 2020). If the cost of gene duplication, or simply increasing expression from a
single-copy gene, is higher in some backgrounds, then those strains may be less likely to evolve
through CNV mechanisms. An extreme example is whole-chromosomal aneuploidy, which is a potent
mode of rapid evolution that is prevalent in some genetic backgrounds yet poorly tolerated in others
(Torres et al., 2007; Gallone et al., 2018; Hose et al., 2020; Scopel et al., 2021). Differences in
aneuploidy tolerance could be heavily influenced by different gene-specific sensitivities across
strains. Consistent with the notion that these differences can affect evolutionary trajectories, several
studies have found that different fungal strains evolve through different mechanisms when exposed
to the same laboratory selections, where some genetic backgrounds leverage aneuploidy, poly-
ploidy, and CNV while others do not (Filteau et al., 2015; Gerstein and Berman, 2020; Tung et al.,
2021).
Another implication of our work is the interplay between gene OE, genetic background, and envi-
ronment. Past work has shown that the cost of gene OE in a single strain can vary with nutrient limi-
tation (Wagner, 2005; Kafri et al., 2016; Frumkin et al., 2017; Farkas et al., 2018; Kintaka et al.,
2020). We propose that variation in environmental responses will further reveal variation in gene OE
differences across strains, as hinted at by our studies. For example, strain Y7568 showed little sensi-
tivity to GFP OE—unless amino acids were removed from the media in which case it grew among
the worst across strains (Figure 4). The sensitivity of vineyard strain DBVPG1373 to tryptophan-con-
taining proteins was exacerbated by tryptophan depletion, an environment that produced little
added effect on other strains. Even the sensitivity to the Moby 2.0 empty vector may have unmasked
strain sensitivities that are not evident if those strains are grown in other environments. Understand-
ing gene-by-environment interactions is among the greatest challenges in genetics. Understanding
how this interplay influences evolutionary potential is even more complicated but beginning to
emerge through experimental studies (Filteau et al., 2015; Tung et al., 2021).
The results of our work also have broad application, from microbial engineering to human health.
Many industrial processes use gene OE to improve microbial traits (Keasling, 1999; Xie and Fusse-
negger, 2018). Understanding (and ultimately predicting) how the response to engineering strate-
gies will vary across host strains could accelerate engineering efforts (Steensels et al., 2014;
Sardi and Gasch, 2017; Sardi and Gasch, 2018). Interpreting functional variants, from SNPs to
CNVs, is also a major goal in human genetics and precision medicine. While already a colossal goal,
Robinson et al. eLife 2021;10:e70564. DOI: https://doi.org/10.7554/eLife.70564 12 of 23Research article Genetics and Genomics
incorporating genetic background interactions in such predictions will be fundamental. Elucidating
mechanistic underpinnings in model organisms will continue to pave the way toward deeper
understanding.
Materials and methods
Key resources table
Reagent type
(species) or Source or Additional
resource Designation reference Identifiers information
Gene (kanr) kanr Yeast knockout kanMX
Collection;
Horizon Discovery
Strain, strain BY4743 MATa/a ATCC BY4743
background his3D1/his3D1
(Saccharomyces leu2D0/leu2D0
cerevisiae) LYS2/lys2D0
met15D0/MET15
ura3D0/ura3D0
Strain, strain BC187 Gerke et al., 2006, BC187
background doi: 10.1534/
(S. genetics.
cerevisiae) 106.058453
Strain, strain DBVPG1373 Capriotti, 1955 DBVPG1373
background
(S.
cerevisiae)
Strain, strain NCYC3290 Bili wine, Liti et al., NCYC3290
background 2009,
(S. doi: 10.1038/
cerevisiae) nature07743
Strain, strain Y12 Palm wine, C. Y12
background Kurtzman
(S. and the ARS culture
cerevisiae) collection
Strain, strain Y2209 Lepidopterous Y2209
background sample,
(S. C. Kurtzman and the
cerevisiae) ARS culture
collection
Strain, strain Y389 Mushrooms, C. Y389
background Kurtzman
(S. and the ARS culture
cerevisiae) collection
Strain, strain Y7568 Papaya, C. Y7568
background Kurtzman
(S. and the ARS culture
cerevisiae) collection
Strain, strain YJM1273 Sniegowski et al., YJM1273
background 2002.
(S. doi: 10.1111/j.1567–
cerevisiae) 1364.2002.tb00048.x
Strain, strain YJM1389 Strope et al., 2015 YJM1389
background doi: 10.1101/gr.
(S. 185538.114
cerevisiae)
Strain, strain YJM1592 Strope et al., 2015 YJM1592
background doi: 10.1101/gr.
(S. 185538.114
cerevisiae)
Continued on next page
Robinson et al. eLife 2021;10:e70564. DOI: https://doi.org/10.7554/eLife.70564 13 of 23Research article Genetics and Genomics
Continued
Reagent type
(species) or Source or Additional
resource Designation reference Identifiers information
Strain, strain YJM978 Human, clinical, YJM978
background Strope et al., 2015
(S. doi: 10.1101/gr.
cerevisiae) 185538.114
Strain, strain YPS128 Sniegowski et al., YPS128
background 2002.
(S. doi: 10.1111/j.1567–
cerevisiae) 1364.2002.tb00048.x
Strain, strain YPS163 Sniegowski et al., YPS163
background 2002.
(S. doi: 10.1111/j.1567–
cerevisiae) 1364.2002.tb00048.x
Strain, strain YPS606 Oak tree bark, YPS606
background Sniegowski et al.,
(S. 2002.
cerevisiae) doi: 10.1111/j.1567–
1364.2002.tb00048.x
Antibody Rabbit anti-GFP Abcam Abcam Cat# ab290, (1:2000)
(Rabbit polyclonal) RRID:AB_303395
Antibody Mouse anti-PGK1 Abcam Abcam Cat# (1:1000)
(Mouse monoclonal) ab113687,
RRID:AB_10861977
Recombinant Moby 2.0 yeast gene Magtanong et al.,
DNA reagent overexpression 2011.
library doi: 10.1038/nbt.
1855
Recombinant pPKI Hose et al., 2020 AGB185 CEN plasmid with the
DNA reagent DOI: 10.7554/eLife. natMX selection marker
52063
Recombinant pJH2 This study AGB91 pKI’s NAT cassette
DNA reagent was replaced with
the KAN cassette
Recombinant pJH3 This study AGB92 GFP was digested out
DNA reagent of pJH2 to obtain pJH3;
this was used as the CEN
empty vector control
Recombinant pJH2_TEFprom- This study In BY4741 under pJH2 plasmid with TEF
DNA reagent GFP-ADH1term AGY1566 promoter and ADH1
terminator sewn together
with GFP
Recombinant MoBY 2.0 Empty Magtanong et al., AGB181
DNA reagent Vector Control 2011.
doi: 10.1038/nbt.
1855
Recombinant ERG26D This study AGY1672 Strain expressing plasmid
DNA reagent from Moby 2.0 with
ERG26 coding sequence
deleted
Recombinant ERG26 M* This study AGY1673 Strain expressing ERG26
DNA reagent plasmid from Moby 2.0
with start codon replaced
with a stop codon
Recombinant LOC1D This study AGY1674 Strain expressing
DNA reagent plasmid from Moby
2.0 with LOC1 coding
sequence deleted
Continued on next page
Robinson et al. eLife 2021;10:e70564. DOI: https://doi.org/10.7554/eLife.70564 14 of 23Research article Genetics and Genomics
Continued
Reagent type
(species) or Source or Additional
resource Designation reference Identifiers information
Recombinant LOC1 M* This study AGY1675 Strain expressing LOC1
DNA reagent plasmid from Moby 2.0
with start codon
replaced with a stop codon
Chemical G418 (G-418 Disulfate) RPI RPI SKU G64000 CAS #108321-42-2
compound,
drug
Strains and growth conditions
Strains used in this study are listed in Supplementary file 1. Unless otherwise indicated, strains were
grown in rich YPD medium (10 g/L yeast extract, 20 g/L peptone, 20 g/L dextrose) in shake flasks at
30˚C. Each strain was transformed with a pool of the molecular barcoded yeast ORF library (MoBY
2.0) containing 4871 pooled high copy number barcoded plasmids (Ho et al., 2009;
Magtanong et al., 2011). At least 25,000 transformants were scraped from agar plates for fivefold
replication of the library, and frozen stocks were made. All OE experiments were done in liquid YPD
medium with G418 (200 mg/L) added for plasmid selection. Experiments interrogating single genes
were performed via culture growths of yeast strains transformed with plasmids of interest, grown for
10 generations in YPD medium supplemented with G418 in shake flasks or test tubes at 30˚C with
shaking.
Moby 2.0 competitive growth
The competition experiments were performed as previously described (Ho et al., 2009;
Magtanong et al., 2011; Piotrowski Jeff and Simpkins, 2015). Briefly, frozen glycerol stocks of
library transformed cells were thawed into 100 ml of liquid YPD with G418 (200 mg/L) at a starting
OD600 of 0.05. The remaining cells from the frozen stocks were pelleted by centrifugation and repre-
sented the starting pool (generation 0) for each strain. After precisely five generations, each pooled
culture was diluted to an OD600 of 0.05 in fresh YPD containing G418, to maintain cells in log phase.
At 10 generations, cells were harvested and cell pellets were stored at 80˚C.
Library construction, sequencing, and analysis
Plasmids were recovered from each pool using QIAprep spin miniprep kits (Qiagen, Hilden, Ger-
many) after pretreatment with 1 ml R-Zymolyase (Zymo Research, Irvine, CA) and ~100 ml of glass
beads, with vortexing for 5 min. Plasmid barcodes were amplified using primers containing Illumina
multiplex adaptors as described in Magtanong et al., 2011; Piotrowski Jeff and Simpkins, 2015.
Barcodes from three biological replicates pooled and split across three lanes on an Illumina HiSeq
Rapid Run with single end 100 bp reads. Sequencing generated a median of 7,570,975 reads per
barcode. Read data are available in the Short Read Archive under accession number GSE171586.
Moby normalization and analyses
We experimented with several normalization strategies, including TMM in the edgeR package
(Robinson et al., 2010; McCarthy et al., 2012) and simple library size normalization, in which bar-
code reads were divided by the total barcode read count in the sample, multiplied by 1 million to
rescale for edgeR analysis. The latter provided the most robust procedure with the fewest assump-
tions. To recapture genes that were clearly present in the starting pool but completely absent after
10 generation growth, we performed a data imputation: genes with at least 20 normalized read
counts (>5th percentile of normalized reads) in all three replicates of the starting pool but missing
reads from the end-point analysis received a pseudocount of 1 added to the barcode reads at 10
generations. Measured and imputed data were analyzed using edgeR version 3.22.1, using a linear
model with generation (0 or 10) as a factor. Genes whose barcodes were significantly different after
10 generations of growth in each strain at an FDRResearch article Genetics and Genomics
generation 10 divided by reads at generation 0 (Supplementary file 4). Hierarchical clustering was
performed on the log2(fold change) in normalized fitness scores using Cluster 3.0 (Eisen et al.,
1998) and visualized using Java TreeView (Saldanha, 2004). We considered if differences in statisti-
cal power could explain differences in the number of significant genes. Figure 1B shows that the
biological replicates were highly reproducible. The mean correlation among replicates per strain was
generally high (0.74–0.89), aside of three triplicated strains (Y2209, YJM1592, and YJM978). The cor-
relation was lower for these strains (0.55–0.65) even though their replicates agreed well (Figure 1B);
the apparently lower correlation is almost certainly driven by noise in the nearly negligible fitness
changes (i.e., log2 values close to 0). Strains with nearly identical correlation across replicates
showed very different numbers of significant genes (e.g., Y12 and YJM1273). Thus, differences in sta-
tistical power cannot explain the differences in significant genes across strains.
Functional and biophysical enrichments were assessed using Wilcoxon rank-sum tests for continu-
ous data (e.g., gene length, # of SNPs, and % amino acid content) and Hypergeometric tests for cat-
egorical terms, taking as the background data set the total number of measured genes (except for
strain-specific gene lists, in which the background data set was a list of insignificant genes in that
strain with FDR>0.1 and measured in at least two of the biological replicates). Because gene lists are
heavily overlapping, standard FDR calculations over-correct p-values. We therefore took a stringent
p-value of 5 10 4 as significant, but also cite FDR significance in data files. Genes involved in trans-
lation that were removed from several analyses are listed in Supplementary file 2. Functional and
biophysical enrichments are available in Supplementary file 6. The background gene lists used for
enrichments are available in Supplementary file 8.
Determining copy number using quantitative PCR
We measured Moby 2.0 plasmid copy numbers in strains grown 10 generations in log-phase as
described above. Plasmid DNA was extracted from frozen cell pellets using phenol/chloroform and
ethanol precipitation, which recovers both plasmid and genomic DNA. Quantitative
PCR experiments were conducted using a Roche LightCycler 480 II and Roche LightCycler 480 SYBR
Green I Master SYBR-Green (Bio-Rad, Hercules, CA). Primers were designed to detect the KAN-MX
resistance gene located on plasmids and genomic TUB1 (control) (Supplementary file 3). CT values
for each sample were measured in technical triplicate with all experiments done in greater than three
biological replicates. The CT values for KAN were internally normalized to TUB1 expressed from the
genome and under an extreme constraint on copy number. KAN/TUB1 ratios measured for each iso-
late carrying the 2-mm plasmid were adjusted to BY4743 KAN/TUB1 ratios measured as an internal
control in each experiment. Data were scaled to BY4743 values, which were adjusted relative to a
KAN-MX marked CEN copy number measured in BY4743 (in the same way outlined above for Moby
2.0 plasmids).
2-mm copy number analysis
We determined the native copy number of the 2-mm gene, REP1, using publicly available DNA
sequencing data for each strain (Bergström et al., 2014; Hose et al., 2015; Strope et al., 2015).
(Note: BY4741 sequence was used instead of BY4743.) We mapped the sequencing data for each
strain to a S. cerevisiae genome using BWA-MEM (version 0.7.12-r1039; Li and Durbin, 2010).
Summed read counts for each gene were calculated by HT-Seq (version 0.6.0; Anders et al., 2015).
Read counts were normalized using RPKM.
Cloning
To express GFP, 343 bp upstream of TEF1 (TEFPROM) was PCR amplified and sewn to a PCR product
capturing the GFP ORF and ADH1 terminator (ADH1TERM) taken from the Yeast GFP Clone Collec-
tion (Thermo Fischer Scientific). PCR product was transformed into yeast with linearized Moby 1.0
empty vector (Ho et al., 2009) and homologous recombinants were selected and verified by
sequencing.
Moby 2.0 plasmids expressing ERG26 and LOC1 were isolated from E. coli using a Qiagen Spin
Miniprep Kit. ERG26 AND LOC1 deletions were generated by site-directed mutagenesis. The first
methionine codon of each ORF was mutated to TAG using quick-change cloning (Wang and Mal-
colm, 1999). All constructs were verified with Sanger sequencing.
Robinson et al. eLife 2021;10:e70564. DOI: https://doi.org/10.7554/eLife.70564 16 of 23Research article Genetics and Genomics
Western blot analysis
Yeast strains were grown in synthetic complete media to log phase (OD600 ~0.4). CEN-GFP was
monitored by Western blot analysis, loading OD-normalized cells in sample buffer and using rabbit
anti-GFP (Abcam) and mouse anti-PGK1 (Abcam) as a loading control, and imaging on the Licor
Odyssey Infrared Imager.
Transcriptome profiling (RNA-Seq) and analysis
Yeast strains described in Supplementary file 1 were grown in biological triplicate in rich YPD
medium with G418 at 30˚C with shaking, for three generations to an OD600 ~0.5. Cultures were pel-
leted by centrifugation and flash frozen with liquid nitrogen and maintained at 80˚C until RNA
extraction. Total RNA was extracted by hot phenol lysis (Gasch, 2002), digested with Turbo DNase
(Invitrogen) for 30 min at 37˚C, and precipitated with 5 M lithium acetate for 30 min at 20˚C. rRNA
depletion was performed using the Ribo-Zero (Yeast) rRNA Removal Kit (Illumina, San Diego, CA)
and libraries were generated according to the TruSeq Stranded Total RNA sample preparation guide
(revision E). cDNA synthesis was performed using fragment prime finish mix (Illumina, San Diego,
CA) and purified using Agencourt AMPure XP beads (Beckman Coulter, Indianapolis, IN). Illumina
adaptors were ligated to DNA using PCR (10 cycles). The samples were pooled, resplit, and run
across three lanes on an Illumina HiSeq 2500 sequencer, generating single-end 100 bp reads, with
~7,494,848 reads per sample. Data are available in GEO accession number GSE171585 and
supplementary file 5.
Reads were processed using Trimmomatic version 0.3 (Bolger et al., 2014), and mapped to the
S288c reference genome (version R64-1-1) with BWA-MEM (version 0.7.12-r1039; Li and Durbin,
2010). Read counts for each gene were calculated by HT-Seq (version 0.6.0; Anders et al., 2015).
Differentially expressed genes were identified by edgeR (Robinson et al., 2010) using a linear model
with strain background as a factor and paired replicates, identifying genes differentially expressed in
each strain relative to the average of all strains using an FDR cutoff of 0.05 (Benjamini and Hoch-
berg, 1995). Hierarchical clustering was performed by Cluster 3.0 (Eisen et al., 1998) and visualized
using Java TreeView (Saldanha, 2004). There was a total of 4802 genes that were significant in at
least one strain.
Acknowledgements
The authors thank Peipei Wang and Shinhan Shiu for their input on data analyses, Auguste Dutcher
for calculating IUPRED scores, and members of the Gasch Lab for useful feedback.
Additional information
Funding
Funder Grant reference number Author
National Cancer Institute R01CA229532 James Hose
Adam Jochem
Audrey P Gasch
U.S. Department of Energy DE-SC0018409 Michael Place
Audrey P Gasch
National Institutes of Health GT32GM007133 DeElegant Robinson
National Human Genome Re- 5T32HG002760 DeElegant Robinson
search Institute
The funders had no role in study design, data collection and interpretation, or the
decision to submit the work for publication.
Author contributions
DeElegant Robinson, Formal analysis, Validation, Investigation, Writing - original draft; Michael
Place, Software, Formal analysis; James Hose, Adam Jochem, Validation, Investigation; Audrey P
Robinson et al. eLife 2021;10:e70564. DOI: https://doi.org/10.7554/eLife.70564 17 of 23Research article Genetics and Genomics
Gasch, Conceptualization, Formal analysis, Supervision, Funding acquisition, Methodology, Writing -
review and editing
Author ORCIDs
DeElegant Robinson https://orcid.org/0000-0002-0476-3908
Audrey P Gasch https://orcid.org/0000-0002-8182-257X
Decision letter and Author response
Decision letter https://doi.org/10.7554/eLife.70564.sa1
Author response https://doi.org/10.7554/eLife.70564.sa2
Additional files
Supplementary files
. Supplementary file 1. Strains used in this study.
.Supplementary file 2. Translation-related genes. Genes annotated as involved in translation that
were removed from analysis, where indicated in the text.
. Supplementary file 3. Primers used for quantitative PCR to measure plasmid abundances.
. Supplementary file 4. Moby Fitness Scores and gene lists. Tab 1: Unnormalized read counts for
each strain. Tab 2: Library-size normalized and scaled read counts for each strain, see
Materials and methods. Tab 3: Average (log2) change in fitness and Benjamini and Hochberg-cor-
rected FDR as outputted by edgeR, without data imputation. Tab 4: Average (log2) change in fitness
and Benjamini and Hochberg-corrected FDR as outputted by edgeR, using data in which some ratios
had been imputed, see Methods for details. Tab 5: List of commonly deleterious genes. Tab 6:
Strain-specific deleterious genes for each strain. Tab 7: Strain-specific beneficial genes for each
strain.
. Supplementary file 5. RNA-seq read counts. Tab 1: Unnormalized reads counts per gene as output-
ted by HT-Seq. Tab 2: Average log2(expression ratio) comparing indicated strain versus the mean of
all strains, followed by the FDR value, as outputted by edgeR and for each strain.
. Supplementary file 6. Moby Functional Enrichments. Enrichments for commonly deleterious genes
or strain-specific genes, as indicated in each tab title. Quantitative data were scored by Wilcoxon
rank-sum tests and categorical data were scored by Hypergeometric test, as described in the
Materials and methods. Each column indicates the category, enrichment p-value(s), and either Bon-
ferroni corrected p-value (p/number of tests) or the significance score (1=FDR0.05)
using Benjamini and Hochberg ranking.
.Supplementary file 7. RNA-Seq functional enrichments. Functional enrichment of differentially
expressed (d.e.) genes in each strain using Hypergeometric tests. Overlap between the query cluster
and comparison cluster of GO and compiled categories is indicated with various p-values from
Hypergeometric tests.
. Supplementary file 8. Background gene sets used for statistical tests. Tab 1: List of Moby genes
measured in all three replications at generation 0 in at least one strain, minus the set of 431 common
genes. This list was used as the background data set for Wilcoxon rank-sum tests analyzing common
genes. Tab 2: List of Moby genes with no effect (FDR>0.1) in each strain, used for Wilcoxon rank-
sum tests of strain-specific genes. Tab 3: List of Moby genes significant in at least one strain
(FDRResearch article Genetics and Genomics
The following datasets were generated:
Database and Identifier
Author(s) Year Dataset title Dataset URL
Gasch AP, Place M 2021 Natural Variation in the Fitness https://www.ncbi.nlm. NCBI Gene Expression
Consequences of Gene nih.gov/geo/query/acc. Omnibus, GSE171586
Amplification in Wild cgi?acc=GSE171586
Saccharomyces cerevisiae
Isolates [Bar-seq]
Gasch AP, Place M 2021 Natural Variation in the Fitness https://www.ncbi.nlm. NCBI Gene Expression
Consequences of Gene nih.gov/geo/query/acc. Omnibus, GSE171585
Amplification in Wild cgi?acc=GSE171585
Saccharomyces cerevisiae
Isolates [RNA-seq]
References
Adler M, Anjum M, Berg OG, Andersson DI, Sandegren L. 2014. High fitness costs and instability of gene
duplications reduce rates of evolution of new genes by duplication-divergence mechanisms. Molecular Biology
and Evolution 31:1526–1535. DOI: https://doi.org/10.1093/molbev/msu111, PMID: 24659815
Anders S, Pyl PT, Huber W. 2015. HTSeq–a Python framework to work with high-throughput sequencing data.
Bioinformatics 31:166–169. DOI: https://doi.org/10.1093/bioinformatics/btu638, PMID: 25260700
Apostol B, Greer CL. 1988. Copy number and stability of yeast 2 mu-based plasmids carrying a transcription-
conditional centromere. Gene 67:59–68. DOI: https://doi.org/10.1016/0378-1119(88)90008-X, PMID: 2843440
Ascencio D, Diss G, Gagnon-Arsenault I, Dubé AK, DeLuna A, Landry CR. 2021. Expression attenuation as a
mechanism of robustness against gene duplication. PNAS 118:e2014345118. DOI: https://doi.org/10.1073/
pnas.2014345118, PMID: 33526669
Banerjee S, Feyertag F, Alvarez-Ponce D. 2017. Intrinsic protein disorder reduces small-scale gene duplicability.
DNA Research 24:435–444. DOI: https://doi.org/10.1093/dnares/dsx015, PMID: 28430886
Barrett RD, Schluter D. 2008. Adaptation from standing genetic variation. Trends in Ecology & Evolution 23:38–
44. DOI: https://doi.org/10.1016/j.tree.2007.09.008, PMID: 18006185
Benjamini Y, Hochberg Y. 1995. Controlling the false discovery rate: a practical and powerful approach to
multiple testing. Journal of the Royal Statistical Society 57:289–300. DOI: https://doi.org/10.1016/s0166-4328
(01)00297-2
Bergström A, Simpson JT, Salinas F, Barré B, Parts L, Zia A, Nguyen Ba AN, Moses AM, Louis EJ, Mustonen V,
Warringer J, Durbin R, Liti G. 2014. A high-definition view of functional genetic variation from natural yeast
genomes. Molecular Biology and Evolution 31:872–888. DOI: https://doi.org/10.1093/molbev/msu037,
PMID: 24425782
Berman J, Krysan DJ. 2020. Drug resistance and tolerance in fungi. Nature Reviews Microbiology 18:319–331.
DOI: https://doi.org/10.1038/s41579-019-0322-2, PMID: 32047294
Birchler JA, Veitia RA. 2012. Gene balance hypothesis: connecting issues of dosage sensitivity across biological
disciplines. PNAS 109:14746–14753. DOI: https://doi.org/10.1073/pnas.1207726109, PMID: 22908297
Bolger AM, Lohse M, Usadel B. 2014. Trimmomatic: a flexible trimmer for illumina sequence data. Bioinformatics
30:2114–2120. DOI: https://doi.org/10.1093/bioinformatics/btu170, PMID: 24695404
Brown CJ, Todd KM, Rosenzweig RF. 1998. Multiple duplications of yeast hexose transport genes in response to
selection in a glucose-limited environment. Molecular Biology and Evolution 15:931–942. DOI: https://doi.org/
10.1093/oxfordjournals.molbev.a026009, PMID: 9718721
Capriotti A. 1955. Yeasts in some netherlands soils. Antonie Van Leeuwenhoek 21:145–156. DOI: https://doi.
org/10.1007/BF02543809, PMID: 14388635
Chakrabortee S, Byers JS, Jones S, Garcia DM, Bhullar B, Chang A, She R, Lee L, Fremin B, Lindquist S, Jarosz
DF. 2016. Intrinsically disordered proteins drive emergence and inheritance of biological traits. Cell 167:369–
381. DOI: https://doi.org/10.1016/j.cell.2016.09.017, PMID: 27693355
Eisen MB, Spellman PT, Brown PO, Botstein D. 1998. Cluster analysis and display of genome-wide expression
patterns. PNAS 95:14863–14868. DOI: https://doi.org/10.1073/pnas.95.25.14863, PMID: 9843981
Farkas Z, Kalapis D, Bódi Z, Szamecz B, Daraba A, Almási K, Kovács K, Boross G, Pál F, Horváth P, Balassa T,
Molnár C, Pettkó-Szandtner A, Klement É, Rutkai E, Szvetnik A, Papp B, Pál C. 2018. Hsp70-associated
chaperones have a critical role in buffering protein production costs. eLife 7:e29845. DOI: https://doi.org/10.
7554/eLife.29845, PMID: 29377792
Fewell SW, Woolford JL. 1999. Ribosomal protein S14 of Saccharomyces cerevisiae regulates its expression by
binding to RPS14B pre-mRNA and to 18S rRNA. Molecular and Cellular Biology 19:826. DOI: https://doi.org/
10.1128/MCB.19.1.826, PMID: 9858605
Filteau M, Hamel V, Pouliot MC, Gagnon-Arsenault I, Dubé AK, Landry CR. 2015. Evolutionary rescue by
compensatory mutations is constrained by genomic and environmental backgrounds. Molecular Systems
Biology 11:832. DOI: https://doi.org/10.15252/msb.20156444, PMID: 26459777
Frumkin I, Schirman D, Rotman A, Li F, Zahavi L, Mordret E, Asraf O, Wu S, Levy SF, Pilpel Y. 2017. Gene
architectures that minimize cost of gene expression. Molecular Cell 65:142–153. DOI: https://doi.org/10.1016/j.
molcel.2016.11.007, PMID: 27989436
Robinson et al. eLife 2021;10:e70564. DOI: https://doi.org/10.7554/eLife.70564 19 of 23Research article Genetics and Genomics
Gallone B, Mertens S, Gordon JL, Maere S, Verstrepen KJ, Steensels J. 2018. Origins, evolution, domestication
and diversity of Saccharomyces beer yeasts. Current Opinion in Biotechnology 49:148–155. DOI: https://doi.
org/10.1016/j.copbio.2017.08.005, PMID: 28869826
Gasch AP, Spellman PT, Kao CM, Carmel-Harel O, Eisen MB, Storz G, Botstein D, Brown PO. 2000. Genomic
expression programs in the response of yeast cells to environmental changes. Molecular Biology of the Cell 11:
4241–4257. DOI: https://doi.org/10.1091/mbc.11.12.4241, PMID: 11102521
Gasch AP. 2002. Yeast genomic expression studies using DNA microarrays. Methods in Enzymology 350:393–
414. DOI: https://doi.org/10.1016/s0076-6879(02)50976-9, PMID: 12073326
Gerke JP, Chen CT, Cohen BA. 2006. Natural isolates of Saccharomyces cerevisiae display complex genetic
variation in sporulation efficiency. Genetics 174:985–997. DOI: https://doi.org/10.1534/genetics.106.058453,
PMID: 16951083
Gerstein AC, Berman J. 2020. Candida Albicans Genetic Background Influences Mean and Heterogeneity of
Drug Responses and Genome Stability during Evolution in Fluconazole. mSphere 5:e00480-20. DOI: https://
doi.org/10.1128/mSphere.00480-20, PMID: 32581072
Graur D, Wh L. 2000. Fundamentals of Molecular Evolution. Sinauer.
Gresham D, Desai MM, Tucker CM, Jenq HT, Pai DA, Ward A, DeSevo CG, Botstein D, Dunham MJ. 2008. The
repertoire and dynamics of evolutionary adaptations to controlled nutrient-limited environments in yeast. PLOS
Genetics 4:e1000303. DOI: https://doi.org/10.1371/journal.pgen.1000303, PMID: 19079573
Gresham D, Usaite R, Germann SM, Lisby M, Botstein D, Regenberg B. 2010. Adaptation to diverse nitrogen-
limited environments by deletion or extrachromosomal element formation of the GAP1 locus. PNAS 107:
18551–18556. DOI: https://doi.org/10.1073/pnas.1014023107, PMID: 20937885
Gsponer J, Futschik ME, Teichmann SA, Babu MM. 2008. Tight regulation of unstructured proteins: from
transcript synthesis to protein degradation. Science 322:1365–1368. DOI: https://doi.org/10.1126/science.
1163581, PMID: 19039133
Hastings PJ, Lupski JR, Rosenberg SM, Ira G. 2009. Mechanisms of change in gene copy number. Nature
Reviews Genetics 10:551–564. DOI: https://doi.org/10.1038/nrg2593, PMID: 19597530
Hermisson J, Pennings PS. 2005. Soft sweeps: molecular population genetics of adaptation from standing
genetic variation. Genetics 169:2335–2352. DOI: https://doi.org/10.1534/genetics.104.036947, PMID: 157164
98
Ho CH, Magtanong L, Barker SL, Gresham D, Nishimura S, Natarajan P, Koh JLY, Porter J, Gray CA, Andersen
RJ, Giaever G, Nislow C, Andrews B, Botstein D, Graham TR, Yoshida M, Boone C. 2009. A molecular
barcoded yeast ORF library enables mode-of-action analysis of bioactive compounds. Nature Biotechnology
27:369–377. DOI: https://doi.org/10.1038/nbt.1534, PMID: 19349972
Hose J, Yong CM, Sardi M, Wang Z, Newton MA, Gasch AP. 2015. Dosage compensation can buffer copy-
number variation in wild yeast. eLife 4:e05462. DOI: https://doi.org/10.7554/eLife.05462
Hose J, Escalante LE, Clowers KJ, Dutcher HA, Robinson D, Bouriakov V, Coon JJ, Shishkova E, Gasch AP. 2020.
The genetic basis of aneuploidy tolerance in wild yeast. eLife 9:e52063. DOI: https://doi.org/10.7554/eLife.
52063, PMID: 31909711
Kafri M, Metzl-Raz E, Jona G, Barkai N. 2016. The cost of protein production. Cell Reports 14:22–31.
DOI: https://doi.org/10.1016/j.celrep.2015.12.015, PMID: 26725116
Keasling JD. 1999. Gene-expression tools for the metabolic engineering of Bacteria. Trends in Biotechnology 17:
452–460. DOI: https://doi.org/10.1016/S0167-7799(99)01376-1, PMID: 10511704
Kintaka R, Makanae K, Namba S, Kato H, Kito K, Ohnuki S, Ohya Y, Andrews BJ, Boone C, Moriya H. 2020.
Genetic profiling of protein burden and nuclear export overload. eLife 9:e54080. DOI: https://doi.org/10.7554/
eLife.54080, PMID: 33146608
Kondrashov FA. 2012. Gene duplication as a mechanism of genomic adaptation to a changing environment.
Proceedings of the Royal Society B: Biological Sciences 279:5048–5057. DOI: https://doi.org/10.1098/rspb.
2012.1108, PMID: 22977152
Kurtzman CP. 1986. The ARS culture collection: present status and new directions. Enzyme and Microbial
Technology 8:328–333. DOI: https://doi.org/10.1016/0141-0229(86)90130-4
Kvitek DJ, Will JL, Gasch AP. 2008. Variations in stress sensitivity and genomic expression in diverse S. cerevisiae
isolates. PLOS Genetics 4:e1000223. DOI: https://doi.org/10.1371/journal.pgen.1000223, PMID: 18927628
Levasseur A, Pontarotti P. 2011. The role of duplications in the evolution of genomes highlights the need for
evolutionary-based approaches in comparative genomics. Biology Direct 6:11. DOI: https://doi.org/10.1186/
1745-6150-6-11, PMID: 21333002
Li Z, Paulovich AG, Woolford JL. 1995. Feedback inhibition of the yeast ribosomal protein gene CRY2 is
mediated by the nucleotide sequence and secondary structure of CRY2 pre-mRNA. Molecular and Cellular
Biology 15:6454–6464. DOI: https://doi.org/10.1128/MCB.15.11.6454, PMID: 7565797
Li B, Vilardell J, Warner JR. 1996. An RNA structure involved in feedback regulation of splicing and of translation
is critical for biological fitness. PNAS 93:1596–1600. DOI: https://doi.org/10.1073/pnas.93.4.1596, PMID:
8643676
Li H, Durbin R. 2010. Fast and accurate long-read alignment with Burrows-Wheeler transform. Bioinformatics 26:
589–595. DOI: https://doi.org/10.1093/bioinformatics/btp698, PMID: 20080505
Liti G, Carter DM, Moses AM, Warringer J, Parts L, James SA, Davey RP, Roberts IN, Burt A, Koufopanou V, Tsai
IJ, Bergman CM, Bensasson D, O’Kelly MJ, van Oudenaarden A, Barton DB, Bailes E, Nguyen AN, Jones M,
Quail MA, et al. 2009. Population genomics of domestic and wild yeasts. Nature 458:337–341. DOI: https://
doi.org/10.1038/nature07743, PMID: 19212322
Robinson et al. eLife 2021;10:e70564. DOI: https://doi.org/10.7554/eLife.70564 20 of 23You can also read