NEUTRON-RICH CHROMIUM ISOTOPE ANOMALIES IN SUPERNOVA NANOPARTICLES
←
→
Page content transcription
If your browser does not render page correctly, please read the page content below
The Astrophysical Journal, 720:1577–1591, 2010 September 10                                                                          doi:10.1088/0004-637X/720/2/1577

C 2010.   The American Astronomical Society. All rights reserved. Printed in the U.S.A.

                    NEUTRON-RICH CHROMIUM ISOTOPE ANOMALIES IN SUPERNOVA NANOPARTICLES
     N. Dauphas1,2 , L. Remusat2,3 , J. H. Chen4,6 , M. Roskosz5,6 , D. A. Papanastassiou2,4 , J. Stodolna5 , Y. Guan2 , C. Ma2 ,
                                                          and J. M. Eiler2
1 Origins Laboratory, Department of the Geophysical Sciences and Enrico Fermi Institute, The University of Chicago, 5734 South Ellis Avenue, Chicago, IL 60637,
                                                                   USA; dauphas@uchicago.edu
                         2 Division of Geological and Planetary Sciences, California Institute of Technology, Pasadena, CA 91125, USA
3 Muséum National d’Histoire Naturelle, Laboratoire de Minéralogie et Cosmochimie du Muséum, CNRS UMR 7202, Case Postale 52, 61 rue Buffon, 75231 Paris,
                                                                                France
                                              4 Jet Propulsion Laboratory, 4800 Oak Grove Drive, Pasadena, CA 91109
                        5 Unité Matériaux et Transformations, Université de Lille 1, CNRS UMR 8207, 59655 Villeneuve d’Ascq, France
                                              Received 2010 May 13; accepted 2010 July 5; published 2010 August 23

                                                                    ABSTRACT
               Neutron-rich isotopes with masses near that of iron are produced in Type Ia and II supernovae (SNeIa and SNeII).
               Traces of such nucleosynthesis are found in primitive meteorites in the form of variations in the isotopic abundance of
               54
                  Cr, the most neutron-rich stable isotope of chromium. The hosts of these isotopic anomalies must be presolar grains
               that condensed in the outflows of SNe, offering the opportunity to study the nucleosynthesis of iron-peak nuclei
               in ways that complement spectroscopic observations and can inform models of stellar evolution. However, despite
               almost two decades of extensive search, the carrier of 54 Cr anomalies is still unknown, presumably because it is fine
               grained and is chemically labile. Here, we identify in the primitive meteorite Orgueil the carrier of 54 Cr anomalies
               as nanoparticles (3.6 × solar). Such large enrichments in 54 Cr can only be produced in SNe. The mineralogy of the
               grains supports condensation in the O/Ne–O/C zones of an SNII, although a Type Ia origin cannot be excluded. We
               suggest that planetary materials incorporated different amounts of these nanoparticles, possibly due to late injection
               by a nearby SN that also delivered 26 Al and 60 Fe to the solar system. This idea explains why the relative abundance
               of 54 Cr and other neutron-rich isotopes vary between planets and meteorites. We anticipate that future isotopic
               studies of the grains identified here will shed new light on the birth of the solar system and the conditions in SNe.
               Key words: meteorites, meteors, meteoroids – nuclear reactions, nucleosynthesis, abundances – protoplanetary
               disks – supernovae: general
               Online-only material: color figures

                                  1. INTRODUCTION                                                that the carrier of 54 Cr anomalies must be smaller than 300 nm
                                                                                                 (Nichols et al. 1998, 2000). Several conference abstracts have
   All rocks on Earth have Cr isotopic compositions (relative                                    reported the detection of 54 Cr excess in individual grains from
abundances of 50 Cr, 52 Cr, 53 Cr, and 54 Cr) that very closely                                  meteorites (Ott et al. 1997; Qin et al. 2009; Dauphas et al. 2010;
follow the laws of mass-dependent fractionation (Ellis et al.                                    Nittler et al. 2010) but many questions are left unanswered as
2002; Schoenberg et al. 2008). In contrast, some meteorites                                      to the exact nature of these grains (i.e., phase, size, and textural
exhibit anomalous enrichments or depletions in the abundance                                     association with other phases). To address the question of the
of the neutron-rich isotope 54 Cr, relative to the abundance                                     nature and origin of the carrier of 54 Cr anomalies, we have
expected based on co-existing Cr isotopes and the laws of mass-                                  studied the Cr isotopic composition of residues from primitive
dependent fractionation (Birck & Allègre 1984; Papanastassiou                                   meteorites using a high spatial resolution ion probe (Cameca
1986; Rotaru et al. 1992; Podosek et al. 1997, 1999; Nichols                                     NanoSIMS-50L).
et al. 1998, 2000; Alexander 2002; Shukolyukov & Lugmair
2006; Trinquier et al. 2007; Birck et al. 2009; Qin et al. 2010).                                              2. MATERIALS AND METHODS
These anomalies must have a nucleosynthetic origin, meaning
                                                                                                      2.1. Preparation of Orgueil and Murchison Residues
that they were produced by nuclear reactions in stars that existed
before the Sun was born. They were presumably incorporated                                          Based on previous studies (Rotaru et al. 1992; Podosek et al.
in solar system materials in the form of presolar grains that                                    1997; Nichols et al. 1998, 2000), a protocol was established
escaped volatilization in the protosolar nebula (Mendybaev                                       to concentrate the carrier of 54 Cr anomalies (Figure 1). Ap-
et al. 2002). Presolar grains directly probe the composition                                     proximately 1.4 g each of the meteorites Orgueil and Murchi-
of the astrophysical environment where they were condensed                                       son were disaggregated at the University of Chicago using the
and provide a view of stellar nucleosynthesis that complements                                   freeze-thaw technique. The disaggregated meteorites were first
information offered by astronomical techniques. Several types                                    treated with 5 ml of 50% acetic acid (∼9 mol l−1 ) for 2 days
of presolar grains from various types of stars have already been                                 at room temperature (∼20◦ C). The residues were then leached
identified in meteorites (Zinner 1998; Lodders & Amari 2005)                                     with 10 ml of 4.5 mol l−1 nitric acid for 10 days at ∼20◦ C. Af-
but the carrier of 54 Cr anomalies has eluded characterization.                                  ter removing the supernatants, solutions of 30%–40% sodium
Previous measurements of bulk meteorite residues have shown                                      hydroxide (∼13 mol l−1 ) were added to the residues. Magnetic
                                                                                                 minerals that adhered to a Teflon-coated magnetic stirring bar
6   These authors contributed equally to this work.                                              were removed. By rinsing with water, the pH decreased toward

                                                                                          1577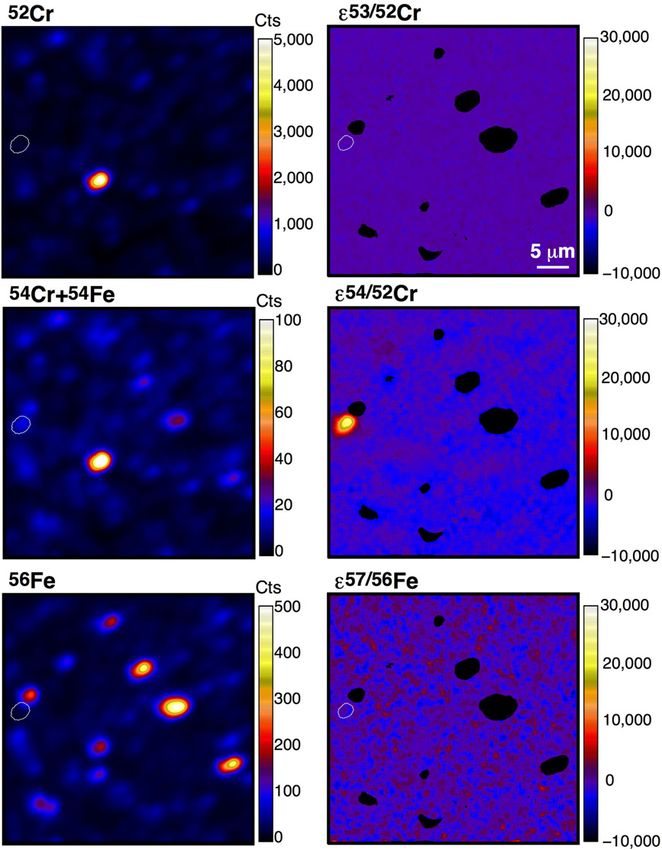
1578                                                                  DAUPHAS ET AL.                                                                        Vol. 720

Figure 1. Chemical and physical methods used for concentrating the carrier of 54 Cr anomalies (see Section 2 for details). The fractions enclosed in boxes were studied
by TEM, TIMS, and NanoSIMS. O and M stand for Orgueil and Murchison, respectively. Colloid, >200, 200–800, and  800 and M > 800). The                                  was to deconvolve the EDS spectra taking into account the
size distributions measured by secondary electron microscopy                           contributions of all elements detected (including contaminants),
(SEM) and transmission electron microscopy (TEM) are in good                           but using only the elements expected in the mineral grain for
agreement with calculated nominal sizes.                                               the quantification. Calculations of element concentrations and
                                                                                       atomic ratios were carried out using calibrated k-factors and thin
               2.2. Transmission Electron Microscopy                                   film matrix correction procedures. The k-factors for the major
                                                                                       elements were determined using standard specimens according
   Dried residues were suspended in ethanol by ultrasonication                         to the parameter-less method of Van Cappellen (1990). The
and were then deposited as droplets on carbon-coated copper                            absorption correction procedure based on the principle of
grids. The samples were studied at the University of Lille using                       electroneutrality (Van Cappellen & Doukhan 1994) was applied
a Tecnai G2-20 twin (LaB6 filament, 200 kV). The microscope                            whenever possible. Elemental distributions were obtained using
is equipped with an EDAX Si detector for energy dispersive                             spectral imaging wherein each pixel of an image contains a
X-ray spectroscopy (EDS). Grain microstructures were studied                           full EDS spectrum (see Leroux et al. 2008 for details). The
using bright field imaging in conventional TEM mode, selected                          uncertainty on atomic concentrations is typically in the range
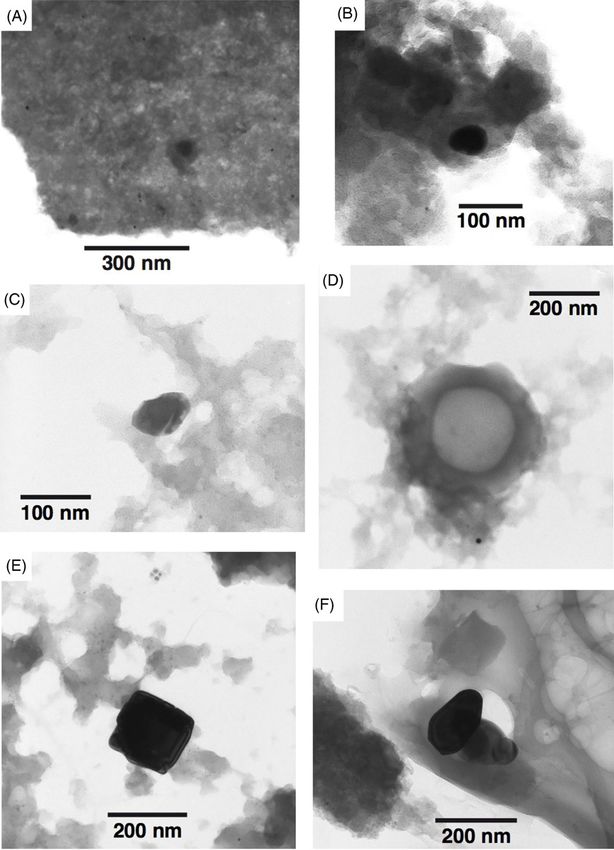
No. 2, 2010         NEUTRON-RICH CHROMIUM ISOTOPE ANOMALIES IN SUPERNOVA NANOPARTICLES                                                                    1579

Figure 2. TEM micrographs. (A) Amorphous, fluffy organic matrix in the colloidal fraction of Orgueil containing small diffracting particles (dark dots) of oxide
grains (generally spinels). (B) and (C) Small spinel grains partially embedded in the organic matrix of the colloidal fraction of Murchison. (D) Amorphous carbon
nanoglobule surrounded by fluffy OM containing spinel grains (one is in Bragg condition). This nanoglobule was found in the colloidal fraction of Murchison but
similar globules were found in Orgueil. (E) and (F) Large spinel grains found in the
1580                                                                DAUPHAS ET AL.                                                                       Vol. 720

Figure 3. X-ray elemental maps of a large clump of OM and mineral grains found in the colloidal fraction of Murchison. Exactly the same features are found in the
colloidal fraction of Orgueil. Chromium is distributed in small grains containing various amounts of Al, Mg, and Fe. Sulfur and phosphorus (not shown here) are
homogeneously distributed in the clump.

reproducible volume fraction of 900 ± 100 ppm spinel in both
Orgueil and Murchison. The composition of these minerals is
highly variable (Table 1, Figure 4). They are generally Cr-
bearing spinels close to the Mg, Al-rich end member of the
group (i.e., MgAl2 O4 with some Cr substituting for Al) but
magnesiochromite (MgCr2 O4 ) and chromite (FeCr2 O4 ) are also
present. The average Cr concentration of 29 spinels less than
100 nm in size is 25.7 atomic% (normalized to 100% non-
oxygen atoms). Using these values, one can estimate the average
Cr content of bulk clumps of OM and crystalline particles such as
the one shown in Figure 3 to be 200 ± 100 ppm by weight. This
value is similar to the bulk value obtained by bulk EDS analysis.
Though indirect, this mass balance calculation supports the idea
that the only significant carriers of chromium are nanospinels.

 2.2.2. Microstructure and Mineralogy of the
No. 2, 2010       NEUTRON-RICH CHROMIUM ISOTOPE ANOMALIES IN SUPERNOVA NANOPARTICLES                                                                    1581
                               Table 1
  Atomic Compositions of Nanospinels (Normalized to 100% Non-oxygen
                               Atoms)

    Meteorite     Size Fraction   size (nm)    Cr      Al     Mg       Fe
Orgueil (Cl1)
                   Colloidal         10       36.63   12.77   27.26   23.33
                   Colloidal         20       58.99    2.78   35.04    3.19
                   Colloidal         20       29.82   33.88   10.25   26.04
                   Colloidal         20       15.91   46.64   36.24    1.21
                   Colloidal         30        1.33   73.37   25.06    0.23
                   Colloidal         30        3.43   74.26   15.69    6.62
                   Colloidal         30       48.07    3.56   27.98   20.39
                   Colloidal         35       23.36   45.99   21.61    9.05
                   Colloidal         40       55.27    3.31   27.59   13.84
                   Colloidal         40       10.35   53.21   35.47    0.96
                   Colloidal         50       34.59   22.14   32.66   10.61
                   Colloidal         50       34.75   32.54   32.08    0.63
                   Colloidal         50       27.46   35.82   32.85    3.87
                   Colloidal         50        3.42   61.96   34.62    0.00
                   Colloidal         50       41.03   25.59   10.76   22.63
                   Colloidal        150       66.28    0.91   19.93   12.88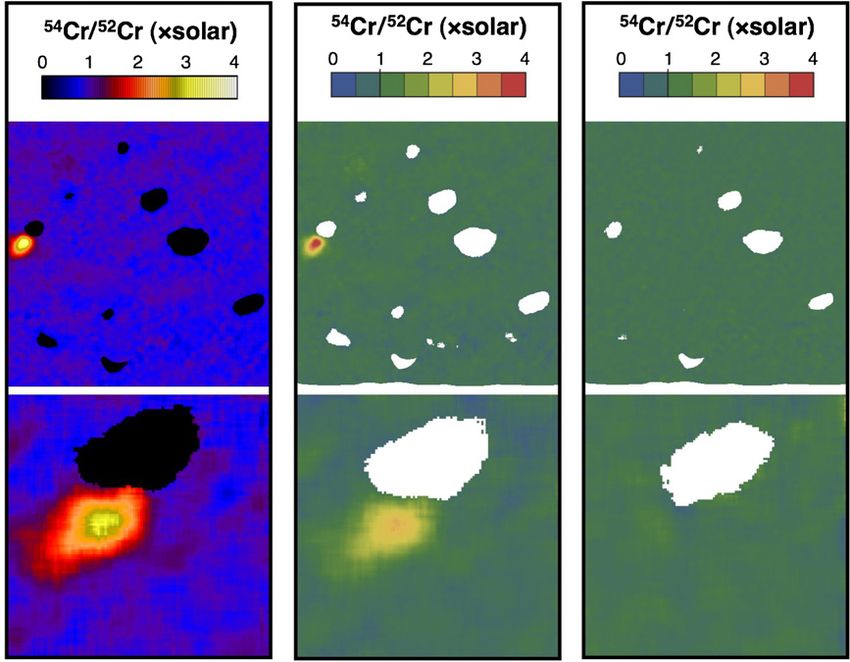
1582 DAUPHAS ET AL. Vol. 720
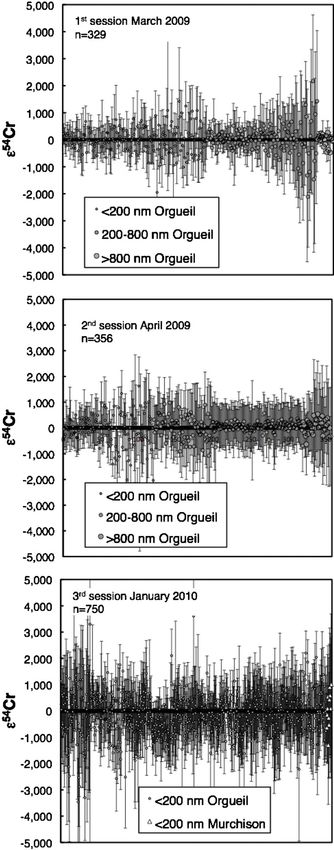
Table 2 September, which resulted in a small shift in the Cr isotopic
Cup Configurations for Cr Isotope Measurements by TIMS ratios between the two sessions.
Faraday Cups After normalization, the means and standard deviations
Configuration Acquisition Time L4 L2 C H2 H4 (2σ mean ) of each run are calculated, with elimination of out-
Line 1 33 s 52 Cr 53 Cr 54 Cr 56 Fe liers (fewer than 5% of the measured cycles). The uncertainties
Line 2 33 s 48 Ti 50 Cr 51 V 52 Cr reported for each analysis represent a total of 600–1200 ratios.
This quoted uncertainty is the internal precision of a single anal-
ysis, with the data obtained under similar conditions (e.g., ion
found or the residue remained constant. Under these conditions, signal intensity, range of mass-dependent isotope fractionation,
most if not all spinel is dissolved. and absence of mass interferences). The internal precision is
After dissolution of the sample, the solution was converted used as a measure of the quality of individual analyses. For
to the chloride form in 6–9 M HCl. A small aliquot was comparing samples, the external precision is used and is de-
taken to determine the Mn and Cr contents using a graphite fined by the reproducibility of the analyses of the Cr standard.
furnace atomic absorption spectrometer. Another aliquot was The external relative precisions (1σ ) are 5–6 and 21–64 ppm
taken for Cr isotopic analysis. Using a 2 ml anion-exchange for 53 Cr/52 Cr and 54 Cr/52 Cr ratios, respectively. The deviations
column (column 1, AG1W-X8), Cr is readily separated (not and errors of the 53 Cr/52 Cr and 54 Cr/52 Cr ratios in the samples
adsorbed) from other major elements (Fe, Cu, Co, and Ti) in are expressed as ε values relative to the mean value of the stan-
6–9 M HCl. The separation of Cr from the matrix elements dard during each session, where εi Cr = [(i Cr/52 Cr)sample /(i Cr/
makes use of the slow re-equilibration of the different hydrated
52
Cr)std −1] × 104 .
species of Cr(III) in aqueous solutions (Birck & Allègre,
1988). Following the procedure developed by C.-H. Shih (2009, 2.4. NanoSIMS Measurements and Data Reduction
personal communication), Cr in solution was converted to 2.4.1. Instrumental Setting and Data Acquisition
Cr(III) by reduction in 6 M HCl at 150◦ C for 24 hr. This solution
was evaporated to near dryness followed by dilution with 0.5 ml NanoSIMS imaging was performed on the Cameca
1 M HCl and 0.5 ml water, which was loaded onto a 2 ml NanoSIMS 50L installed at the Caltech Center for Microanalysis
cation exchanger (Column 2, AG 50W-X8 200–400 mesh resin). during three sessions covering a total duration of 24 days. A pri-
Chromium was eluted in the first 6–7 ml of 1 M HCl. The above mary O− beam of ∼30 pA, with an energy of 16 kV, was rastered
step was repeated if there was a noticeable amount of impurity on surface areas of 20 × 20 or 40 × 40 μm2 at a raster speed
(e.g., Ca, Al, and Mg measured by atomic absorption) in the Cr of 20 ms pixel−1 . The spatial resolution with the O− beam was
solution. If traces of iron were detected in the Cr solution, the between 400 and 800 nm. The images were acquired with reso-
solution was evaporated to near dryness and processed through lutions of 256 × 256 and 512 × 512 pixels for 20 × 20 and 40 ×
anion-exchange (AG1W-X8) using a smaller (0.1 ml) column. 40 μm2 raster areas, respectively (78 nm pixel−1 ). Secondary
Occasionally, when processing a larger sample (>50 mg), a ion images of 52 Cr+ , 53 Cr+ , 54 Cr+ +54 Fe+ , 56 Fe+ , and 57 Fe+ were
second cation exchange column (column 3, 0.33 ml, AG50W- recorded in multi-collection mode, using Hamamatsu discrete
x8 200–400 mesh) as described by Trinquier et al. (2008) was dynode electron multipliers with a dead time of 44 ns. Before
used. The recovery of Cr was ∼100% for column 1, ∼80% for each analysis, a high primary current (around 600 pA) was used
column 2, and ∼100% for column 3. The sample was then ready to pre-sputter the surface to achieve a steady state of secondary
for mass spectrometric analysis. The total chemistry blanks of ion emission and to remove surface contamination. Vacuum in
5 ng are negligible compared to the amounts of Cr (3–37 μg) the analysis chamber was ∼2.7 × 10⁻⁹ mbar. The contribution
extracted from each sample. of hydride molecular ions was negligible. Terrestrial chromite
was analyzed everyday to check stability, reproducibility, and
2.3.2. Mass Spectrometry to correct the data. Chromium carbide and magnetite were also
used in each session to refine and validate the correction of 54 Fe
An aliquot of 1–3 μg of the clean Cr sample was evaporated
interference on 54 Cr. The useful yield of Cr (defined as the num-
to dryness under UV light to eliminate any organic residue. The
ber of ions detected per atom sputtered from the sample) was
Cr was dissolved in a small drop of dilute HNO3 and loaded
∼3.7 times that of Fe.
with a mixture of silica gel, aluminum, and boric acid onto
an Re, V-shaped filament. The Cr isotopic composition was 2.4.2. Data Reduction
determined using a Thermo Scientific Triton Thermal Ionization
Mass Spectrometer in a dynamic mode (Table 2). We did not The mass resolving power (MRP = M/ΔM) was about 9000
use the L1 and H1 cups because they are not optimal for on 52 Cr, which is insufficient to resolve the interference of 54 Fe
the Cr mass region. Mass-dependent isotope fractionation in on 54 Cr (requiring an MRP of >73,000). The contribution of
54 +
the 53 Cr/52 Cr and 54 Cr/52 Cr ratios (line 1) was corrected by Fe on 54 Cr+ was therefore corrected using 56 Fe+ intensity
internal normalization to the 50 Cr/52 Cr (line 2) using a value of and a fixed 54 Fe/56 Fe ratio,
0.051859 (Shields et al. 1966) and the exponential law (Russell
54 54 + 56 + 54
et al. 1978). The interfering isotopes were monitored both on- Cr i i Fe
= 52 + − 52 + × 56 .
line (real-time) with data collection and before and after each 52 Cr i i Fe terrestrial
run using an electron multiplier mass scan. Interferences from
54
Fe, 50 Ti, and 50 V, monitored at masses 56, 48, and 51, were The correction was adjusted using magnetite measurements
always negligible (normal isotopic composition was assumed by modifying the assumed (terrestrial) 54 Fe/56 Fe ratio. The
57
for the interfering elements). Chromium standards (NIST SRM Fe/56 Fe ratio was monitored to make sure that the assumption
3112a) were measured before and after each Cr sample. The of uniform Fe isotopic composition was correct. Mass fraction-
Cr data were collected over two intervals in 2009 August and ation on Cr isotopes was either not corrected or was corrected
October. We replaced a pre-amplifier for the center cup in 2009 by internal normalization assuming a terrestrial value for the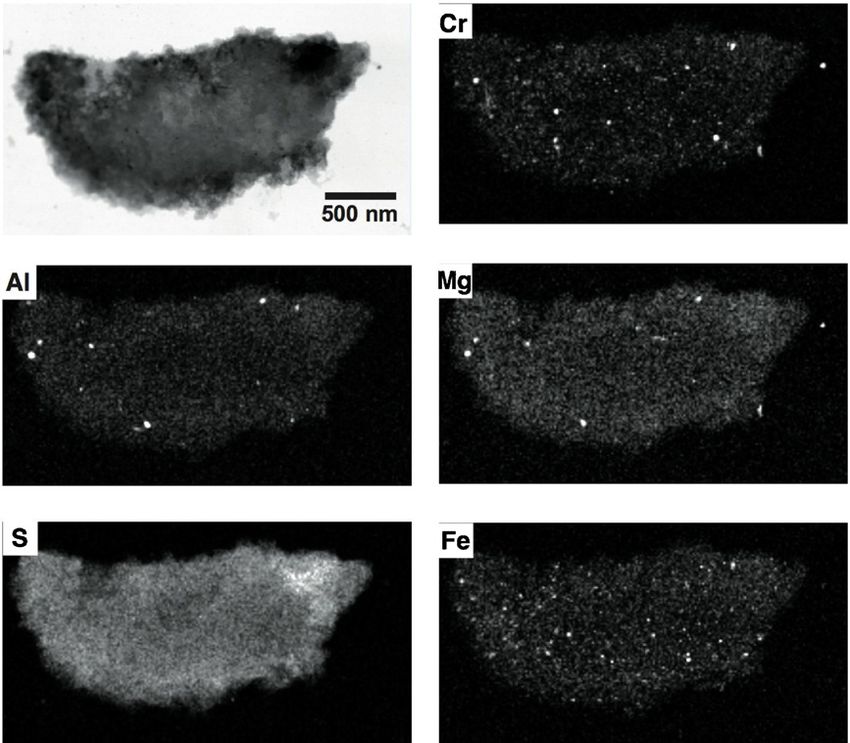
No. 2, 2010          NEUTRON-RICH CHROMIUM ISOTOPE ANOMALIES IN SUPERNOVA NANOPARTICLES                                                                        1583

Figure 6. Quality assessment of 54 Cr/52 Cr isotope ratio images. Comparison between images generated by L’image software of L.R. Nittler (A), images generated
with a Mathematica script written by the authors (B), and synthetic noise images calculated using measured 52 Cr+ and 56 Fe+ and assuming constant 54 Cr/52 Cr and
54 Fe/56 Fe ratios (C). In the synthetic images, the total counts at each pixel were randomized using Poisson distribution and the synthetic data were processed using
the same algorithm as that applied to real data. By construction, the synthetic image should show no anomaly and all isotopic variations can be ascribed to counting
statistics. In all cases, ion counts were averaged over moving boxes of 11 pixel width. The masks (black in L’image and white in Mathematica) correspond to regions
where the 54 Fe correction on 54 Cr exceeds 20,000 ε or where the 52 Cr+ ion counts represent less than 1% of the maximum ion count in the image. The top and bottom
images are 40 × 40 and 10 × 10 μm2 , respectively.
(A color version of this figure is available in the online journal.)

53
  Cr/52 Cr ratio (Shields et al. 1966) and using the exponential                      the isotopic ratios of all ROIs was compared with that predicted
law (Russell et al. 1978).                                                            from counting statistics. For 53 Cr/52 Cr and 57 Fe/56 Fe ratios,
   Image analysis was performed following two different ap-                           the measured dispersion is entirely accounted for by total ion
proaches. In method 1, regions of interest (ROIs) corresponding                       counts and Poisson statistics. The (54 Cr+54 Fe)/52 Cr and 56 Fe/
                                                                                      52
to isolated grains were defined using a grain identification al-                         Cr ratios vary more than what is allowed by counting statistics,
gorithm included in L’image software (L. R. Nittler, Carnegie                         presumably because of additional variability during secondary
Institution of Washington). For each ROI, the total counts were                       ion formation of Cr and Fe. The uncertainties on these ratios
retrieved to calculate 54 Cr/52 Cr isotopic ratios as previously de-                  can be expressed as the sum of the uncertainty associated with
scribed. The drawback of this approach is that one may miss                           counting statistics and a term that is proportional to the 56 Fe+ /
                                                                                      52
anomalies carried by small or Cr-poor grains. In method 2, cor-                          Cr+ ratio:
rected 54 Cr/52 Cr isotope ratio images were generated using a
                                                                                                      σ53/52   = σPoisson
Mathematica routine and L’image software. These images were
used to locate 54 Cr-rich “hot spots”. Corrected 54 Cr/52 Cr ratios                                   σ54/52   = 0.0027 × (56+ /52+ ) + σPoisson
were calculated from the total counts in each ROI correspond-                                         σ56/52   = 0.053 × (56+ /52+ ) + σPoisson
ing to these hot spots. To generate isotopic ratio images, the                                        σ57/56   = σPoisson .
isotopic ratio of each pixel was normalized to the isotopic ratio
of the bulk image. This approach allows us to identify isotopic                       The factors of 0.0027 and 0.053 were obtained by plotting the
anomalies that do not relate to any resolvable grain. Isotopic ra-                    dispersion in the measured ratios of the standard chromite grains
tio images generated using Mathematica and L’image software                           (σ 54/52 and σ 56/52 ) as a function of the error associated with
are almost identical (compare Figures 6(A) and (B)).                                  counting statistics (σPoisson ). For (54 Cr+54 Fe)/52 Cr and 56 Fe/
                                                                                      52
                                                                                         Cr ratios, a linear relationship was found with a y-intercept
                    2.4.3. Assessment of Uncertainties                                different from zero. The y-intercept was assumed to scale
                                                                                      linearly with the measured (56+ /52+ ) ratio. These relationships
   In order to assess the total uncertainty on 54 Cr/52 Cr ratios, ion
                                                                                      were used to calculate uncertainties on isotopic ratios from total
images of isotopically and chemically homogeneous chromite
                                                                                      counts in ROIs. Error propagation was used to calculate the
grains were subdivided into grids of squares or hexagons of
                                                                                      uncertainty on the 54 Cr/52 Cr ratio corrected for 54 Fe isobaric
uniform sizes. For example, a 10 × 10 μm2 image of 128 ×
                                                                                      interference:
128 pixels was divided into 9 ROIs of 32 × 32 pixels each, 49
ROIs of 16 × 16 pixels, 225 ROIs of 8 × 8 pixels, 961 ROIs                                         σ54 Cr/52 Cr = σ54/52
                                                                                                                   2
                                                                                                                         +0.06372 × σ56/52
                                                                                                                                      2
                                                                                                                                             .
of 4 × 4 pixels, and 4096 ROIs of 2 × 2 pixels. The number of
pixels within all ROIs does not always add up to the number of                           Another approach was adopted for assessing uncertainties on
pixels in the total image because ROIs cannot always be defined                       isotope ratio images and for evaluating the significance of 54 Cr-
near the borders. For each unit grid size, the standard deviation of                  rich regions. Ion count images of 52 Cr and 56 Fe were used to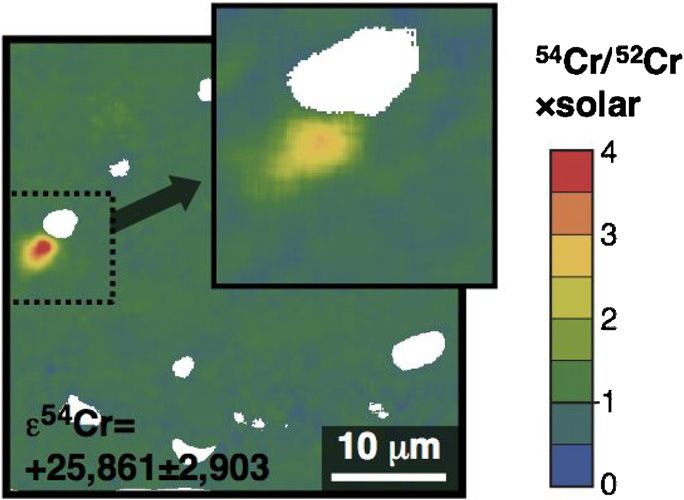
1584                                                                DAUPHAS ET AL.                                                                             Vol. 720
                                                                         Table 3
                                                    Chromium Isotopic Compositions of Meteorite Residues

                  Sample            Size Fraction     Median Size of Cr-bearing Grains (nm)        55 Mn/52 Cr           ε 53 Cr              ε 54 Cr
            Orgueil Residues         Colloidal                            30                           0.07         −2.17   ±      0.04   170.26   ±    0.11
                                     800 nm                             812                           0.59         −0.44   ±      0.05     9.84   ±    0.12
            Murchison residues       Colloidal                            34                           0.09         −1.77   ±      0.06   148.03   ±    0.17
                                     800 nm                           1,437                           0.26          0.02   ±      0.03     4.96   ±    0.08

            Notes. ε i Cr = [(i Cr/52 Cr)sample /(i Cr/52 Cr)SRM3112a −1] × 104 . Mass fractionation was corrected by internal normalization to a fixed
            50 Cr/52 Cr ratio of 0.051859 using the exponental law. Uncertainties are 95% confidence intervals.

generate synthetic images of 53 Cr and 54 Cr+54 Fe using terrestrial
53
   Cr/52 Cr, 54 Cr/52 Cr, and 54 Fe/56 Fe ratios. By construction,
these images have normal (terrestrial) isotopic compositions and
have a spatial distribution of 52 Cr ion counts that is identical to
that of the real image. A random number generator following
Poisson distribution is then applied to each pixel to simulate
the presence of noise associated with limited counting statistics.
Those images are then subjected to the same treatment as that
applied to real data. A Mathematica script modified from the
one written to analyze real data was used to generate these
synthetic images. The synthetic maps of normal (terrestrial)
54
   Cr/52 Cr ratio with noise added can then be compared directly
with measured isotope ratio images (compare Figures 6(B)
and (C)).

                            3. RESULTS
   Approximately 1.4 g each of the carbonaceous chondrites
Orgueil (classified as CI1) and Murchison (CM2) were treated
by a sequence of acid leaching, magnetic separation, and size
separation (Nichols et al. 1998, 2000) (Figure 1). Because
leaching with hot HCl is known to partially dissolve the carrier of
54
   Cr anomalies, this acid was avoided during preparation of the
residues. For each meteorite, four residues differing in nominal
grain size were isolated (colloidal, 800 nm). Bulk Cr isotopic compositions of all residues
were measured by Thermal Ionization Mass Spectrometry at
the Jet Propulsion Laboratory (Table 3, Figure 7). All four
residues from each meteorite show a large excess 54 Cr. The                          Figure 7. Chromium isotopic compositions of bulk residues from (A) Orgueil
colloidal fractions present the largest anomalies, with ε54 Cr                       and (B) Murchison (Table 3). The yellow diamonds are the measured ε54 Cr
values {ε54 Cr = [(54 Cr/52 Cr)sample /(54 Cr/52 Cr)standard −1] ×                   values (54 Cr/52 Cr ratio normalized to solar on the right axis) plotted against the
                                                                                     median size of the grains. The blue curves are the size distributions of Cr-bearing
104 } of +170.26 ± 0.11 and +148.03 ± 0.17 in Orgueil and                            grains in each nominal size fraction. The 54 Cr/52 Cr ratio was measured by TIMS
Murchison, respectively. This is much higher than previously                         (mass fractionation was corrected by internal normalization using the 50 Cr/52 Cr
reported values of ε54 Cr ∼ 10 to 20 in bulk residues of                             ratios). The size distributions of Cr-bearing grains in the colloidal and 800 nm size fractions were measured by SEM. The fact that
                                                                                     the isotopic anomalies are larger in the colloidal fraction (median size ∼30 nm)
small deficits in 53 Cr (ε53 Cr ∼ −ε54 Cr/84).                                       compared to coarser fractions indicates that the carrier of 54 Cr anomalies must
   Individual Cr-rich grains in the colloidal fraction are too small                 be very fine (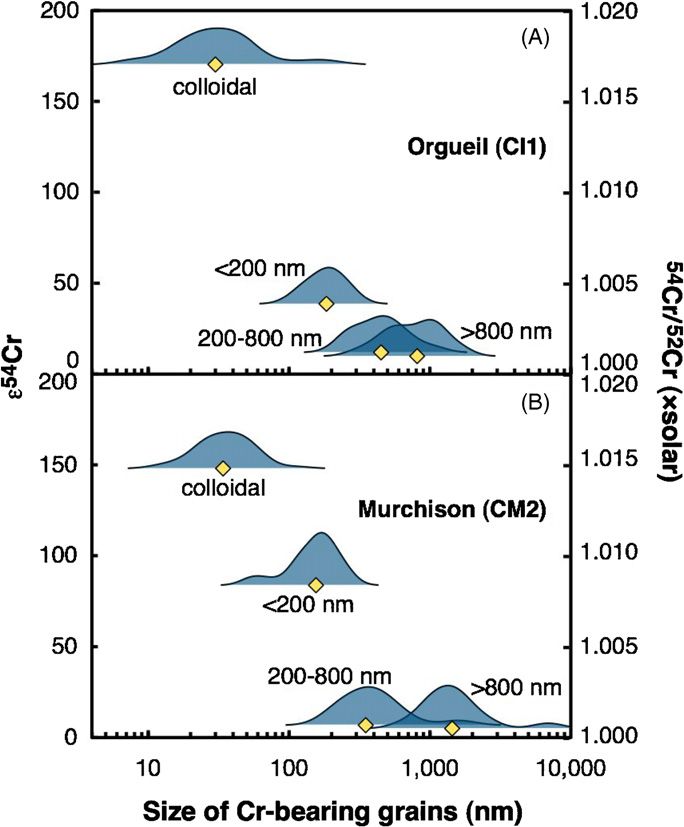
No. 2, 2010          NEUTRON-RICH CHROMIUM ISOTOPE ANOMALIES IN SUPERNOVA NANOPARTICLES                                                                           1585
                                                                                                                      Table 4
                                                                                                   Cr and Fe Isotopic Analyses of 54 Cr-rich Spots

                                                                                  Nanoparticle              ε53 Cr                  ε 54 Cr                  ε 57 Fe
                                                                                  np1                     −1 ± 288             25861 ± 2903             −929 ± 1281
                                                                                  np1 replicate          −29 ± 447             17902 ± 3291             2578 ± 2409
                                                                                  np2                    −59 ± 253              2654 ± 915               917 ± 1644

                                                                                  Notes. ε i Cr = [(i Cr/52 Cr)ROI /(i Cr/52 Cr)bulk image −1] × 104 , ε 57 Fe = [(57 Fe/
                                                                                         ROI /( Fe/ Fe)bulk image −1] × 10 . Uncertainties are 95% confidence
                                                                                  56 Fe)       57   56                          4

                                                                                  intervals. Note that contrary to TIMS data (Table 3), ε-values have not been
                                                                                  corrected for mass fractionation by internal normalization.

                                                                                  2.79( ±0.33) × solar; ε54 Cr = +17,902 ± 3,291]. The different
                                                                                  compositions are explained by different dilution with normal Cr
                                                                                  from adjacent grains.
                                                                                     In np1, the 54 Fe correction on ε54 Cr of −5775 (corresponding
                                                                                  to an Fe/Cr ratio of ∼0.7) is small compared to the measured
                                                                                  anomaly of +25,861. This correction is calculated assuming
                                                                                  constant 54 Fe/56 Fe ratio (terrestrial), which may not be valid if
                                                                                  the grain formed in an SN. An 54 Fe/56 Fe ratio of ∼2 × solar
                                                                                  can be produced in Type Ia supernovae (SNeIa; Woosley 1997),
                                                                                  which would increase the 54 Fe interference correction and would
                                                                                  bring the 54 Cr/52 Cr ratio of np1 to 3.0 × solar. An 54 Fe/56 Fe
                                                                                  ratio between ∼0.01 and 0.7 × solar can be produced in the
                                                                                  O/Ne and O/C zones of Type II supernovae (SNeII; Rauscher
                                                                                  et al. 2002; http://nucastro.org/nucleosynthesis/), which would
                                                                                  reduce the 54 Fe interference correction and would bring the
                                                                                  54
                                                                                     Cr/52 Cr ratio of np1 to 4.2 × solar. However, the measured
                                                                                  57
                                                                                     Fe/56 Fe ratio of np1 is terrestrial, suggesting that most Fe in
                                                                                  that ROI is from adjacent isotopically normal grains. Thus, it is
                                                                                  likely that the 54 Fe correction assuming solar 54 Fe/56 Fe ratio is
                                                                                  accurate. To summarize, the anomalies correspond to real excess
                                                                                  54
                                                                                     Cr and not inadequate correction of 54 Fe interference.

                                                                                        4. 54 CR-RICH SUPERNOVA NANOPARTICLES IN
                                                                                                    PLANETARY MATERIALS
                                                                                     Assuming that all grains contain the same amount of Cr and
                                                                                  given that ∼1 grain out of 1000 contains anomalous ε54 Cr =
                                                                                  +26,000, one would predict that the bulk residue of Orgueil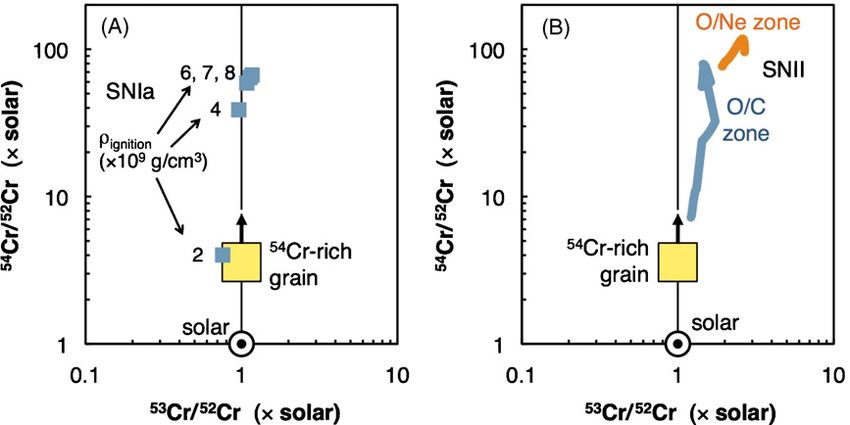
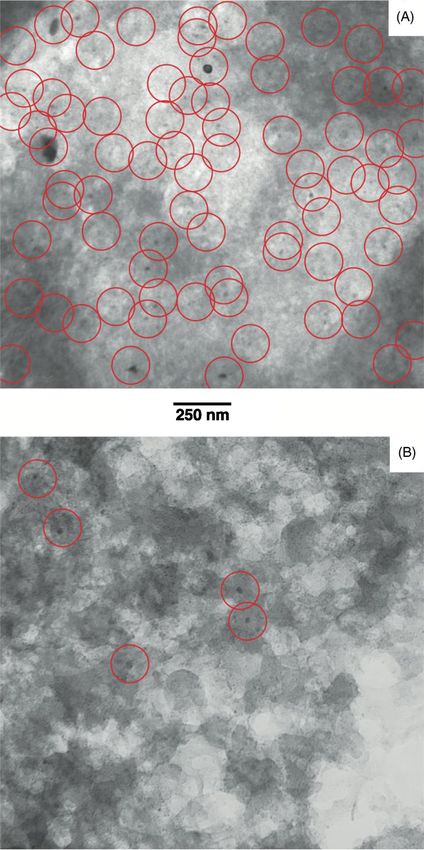
1586                                                                  DAUPHAS ET AL.                                                                        Vol. 720

Figure 9. 40 × 40 μm2 ion and isotopic ratio images of 54 Cr-rich grain np1 (delineated by a thin white line) and its surroundings. See Figure 6 caption for details on
the image processing.
(A color version of this figure is available in the online journal.)

indicating that the carrier of 54 Cr anomalies was efficiently                         bution shifted from 184 to ∼80 nm, indicating that they were
concentrated in those fractions. Therefore, we performed                               partially digested. It appears that hot HCl can dissolve spinels
a detailed TEM study of the colloidal residue to iden-                                 that are smaller than 100 nm in a relatively short time.
tify Cr-bearing phases. The dominant crystalline phases are                               Because of insufficient spatial resolution of the NanoSIMS,
nanospinels containing relatively large amounts of chromium                            the signal from the 54 Cr-rich grains may have been diluted
[e.g., Mg(Al,Cr)2 O4 ]. These spinels are embedded in OM                               by normal chromium isotopic composition from surrounding
and are sometimes associated with carbon nanoglobules (Fig-                            grains. Thus, the true 54 Cr/52 Cr ratio of the carrier phase may
ure 2(D)), which commonly have high 15 N/14 N and D/H ratios                           be higher than the values reported here and the 3.6 × solar
indicative of low temperature chemistry in cold molecular cloud                        enrichment in the 54 Cr/52 Cr ratio of np1 represents a well-
or outer protosolar disk environments (Nakamura-Messenger                              resolved anomaly but a lower limit to the actual ratio. Such
et al. 2006). It is thus likely that the carrier of 54 Cr anoma-                       a large enrichment cannot be produced in the solar system and
lies is an oxide grain, and likely a spinel. Most nanospinels                          must have a stellar origin. The Cr isotopic compositions of some
have solar composition and it is presently unknown if anything                         presolar grains (SiC and spinels) thought to have condensed in
distinguishes mineralogically or chemically the carrier of 54 Cr                       the outflows of asymptotic giant branch (AGB) stars have been
anomalies from similar grains formed in the solar system.                              measured and the maximum enrichment in the 54 Cr/52 Cr ratio
   To assess the chemical resistance of chromium-bearing                               is ∼1.1 × solar, in agreement with predictions for AGB-star
nanospinels, we have subjected the residues to 5 mol l−1 HCl                           nucleosynthesis (Zinner et al. 2005; Levine et al. 2009; Savina
for a day at 80◦ C. The residues were then reexamined under a                          et al. 2010). Therefore, AGB stars can be ruled out as the source
TEM. In the colloidal fraction, the nanospinels survived when                          of 54 Cr anomalies in solar system materials. Chromium-54 can
they were embedded in compact OM but they disappeared from                             be produced in both SNIa (thermonuclear explosion of a carbon-
the more porous fluffy aggregates (Figure 5). In the
No. 2, 2010          NEUTRON-RICH CHROMIUM ISOTOPE ANOMALIES IN SUPERNOVA NANOPARTICLES                                                                          1587

Figure 10. 10 × 10 μm2 ion and isotopic ratio images of 54 Cr-rich grain np1 (delineated by a thin white line) and its surroundings. See Figure 6 caption for details on
the image processing.
(A color version of this figure is available in the online journal.)

the solar system 50 Ti came from SNIa and the other 1/3 was                            ratios are probably too high because the electron capture rates
produced in SNII (Meyer et al. 1996). The same proportion also                         used by Woosley (1997) have been subsequently revised down-
applies to 54 Cr (B.S. Meyer 2010, personal communication).                            ward (Brachwitz et al. 2000) but no comprehensive study of
   The nucleosynthesis of 54 Cr holds clues on the origin and                          the nucleosynthesis of neutron-rich isotopes has been published
evolution of SNeIa (Woosley 1997; Brachwitz et al. 2000;                               with these reduced rates. As shown, the Cr isotopic composition
Thielemann et al. 2004). SNIa are formed in binary systems,                            of np1 (54 Cr/52 Cr = 3.6 × solar) can be explained by nucle-
when a white dwarf accretes matter from a companion star                               osynthesis in an SNIa using a central ignition density of ∼2 ×
and carbon fusion is ignited as the star approaches the Chan-                          109 g cm−3 . Owing to dilution by surrounding grains, the mea-
drasekhar limit. In the inner part of the SNIa, iron-peak nuclei                       sured 54 Cr/52 Cr ratio represents a lower limit on the true ratio of
are produced by nuclear quasi-equilibrium. If the central den-                         the grain so higher ignition densities are also permitted by this
sity at ignition is high enough, electron capture can occur, which                     constraint. Individual presolar grains, such as the ones identified
produces neutron-rich isotopes like 48 Ca or 54 Cr (high central                       in this study, record the composition of a particular parcel of mat-
ignition densities are the result of low-accretion rates on the                        ter in the star. Rather than comparing measured isotopic ratios
white dwarf). In detail, the flame propagation speed also influ-                       with total yields, they could be compared with nucleosynthetic
ences the production of 54 Cr. In Figure 12(A), we compare the                         predictions for tracer particles in multi-dimensional simulations
measured Cr isotopic composition of 54 Cr-rich grain np1 with                          of SNIa explosions (Travaglio et al. 2004, 2005; Brown et al.
model predictions (slow deflagration models NCD2A-NCD8A                                2005; Röpke et al. 2006; Meakin et al. 2009; Fink et al. 2010;
of Woosley 1997) for a range of central ignition densities be-                         Maeda et al. 2010). Such simulations are computationally chal-
tween 2 × 10⁹ and 8 × 10⁹ g cm−3 (above ∼ 9 × 10⁹ g cm−3 ,                             lenging and the parameter space explored so far does not include
nuclear burning in the white dwarf induces collapse to a neutron                       SNIa progenitors capable of producing neutron-rich isotopes in
star rather than explosion as an SN). The predicted 54 Cr/52 Cr                        large quantities.
1588                                                                    DAUPHAS ET AL.                                                                     Vol. 720
                                                                                      the Cr isotopic ratios measured in np1 with SNII model
                                                                                      predictions for a 21 M progenitor star (Rauscher et al. 2002;
                                                                                      http://nucastro.org/nucleosynthesis/). In the region of the star
                                                                                      where neutron capture was active (O/Ne and O/C zones,
                                                                                      between ∼2.5 and 5.3 M in mass coordinate), the 54 Cr/
                                                                                      52
                                                                                         Cr ratio can reach values as high as ∼120 × solar, which
                                                                                      can explain the composition measured in the grain. Very
                                                                                      similar enrichments are found for all SNII progenitor masses
                                                                                      studied by Rauscher et al. (2002) (15, 19, 20, 21, and 25 M ,
                                                                                      http://nucastro.org/nucleosynthesis/).
                                                                                         Both SNeIa and II can produce the large enrichments in 54 Cr
                                                                                      that have been measured in individual grains from meteorite
                                                                                      residues. However, one might expect the dust that condensed
                                                                                      in the outflows from these two types of stars to be different
                                                                                      (Meyer et al. 1996; Woosley 1997). In SNII, the zones where
                                                                                      the 54 Cr enrichment is the highest have O/C > 1, so equilibrium
                                                                                      thermodynamic calculations predict that dust produced in those
Figure 11. 54 Cr-rich spot in a residue (
No. 2, 2010 NEUTRON-RICH CHROMIUM ISOTOPE ANOMALIES IN SUPERNOVA NANOPARTICLES 1589
and Unknown Nuclear effects (FUN) and hibonite-bearing
inclusions in meteorites contain correlated excess in 48 Ca and
other neutron-rich isotopes that are consistent with an SNIa
origin (Völkening & Papanastassiou 1989; Meyer & Zinner
2006). Future work will tell whether a link exists between these
anomalies and the carrier of 54 Cr anomalies identified here.
5. COSMIC MEMORY OR INJECTION FROM
A NEARBY SUPERNOVA?
Small, yet resolvable 54 Cr anomalies are present in bulk plan-
etary materials (Podosek et al. 1999; Shukolyukov and Lugmair
2006; Trinquier et al. 2007; Qin et al. 2010), which can be
explained by large-scale heterogeneous distribution of the car-
rier of 54 Cr anomalies in the protosolar nebula. Such hetero-
geneity could have been inherited from the molecular cloud
core that made the solar system. The grains identified in this
study could have been formed in SNe that exploded long be-
fore the formation of the solar system. Even if these grains
were homogeneously distributed in the ISM, isotopic anoma-
lies at the scale of planetesimals could have been recovered
Figure 13. Predicted correlation between ε54 Cr and the initial 60 Fe/56 Fe ratio
by gas–dust decoupling (Adachi et al. 1976; Weidenschilling if 54 Cr-rich nanoparticles were produced in the same ccSN that injected 60 Fe
1977). As shown in the present study, 54 Cr anomalies are car- in the early solar system (see the text for details). The prediction is that for the
ried by grains less than 100 nm that would follow the gas. Aero- range of ε54 Cr values measured in bulk meteorites (from − 0.8 in achondrites to
dynamic sorting of isotopically normal, coarser grains, could +1.6 in CI chondrites; Trinquier et al. 2007; Qin et al. 2010), variations in the
initial 60 Fe/56 Fe ratio should be on the order of 10%–20%. The results obtained
have produced large-scale isotopic anomalies for 54 Cr. A cor- so far provide no evidence for 60 Fe heterogeneity at the scale of bulk planetary
relation observed between 54 Cr/52 Cr and Mn/Cr ratios among objects outside of ±10% (Dauphas et al. 2008).
carbonaceous chondrites (Shukolyukov and Lugmair 2006; Qin
et al. 2010) is consistent with this interpretation. However, no here to be a reservoir with initial 60 Fe/56 Fe = 6 × 10⁻⁷ and
correlation was found with other proxies of volatile element ε54 Cr = 0), c = (52 Cr/54 Fe)ccSN /(52 Cr/54 Fe)CHUR , ρCri
= (i Cr/
depletion (Zn/Si ratio) or size sorting (matrix fraction) in me- 52
Cr)ccSN /( Cr/ Cr)CHUR −1, ρFe = ( Fe/ Fe)ccSN /(56 Fe/
i 52 56 56 54
teorites (Qin et al. 2010). Chromium-54 seems to correlate with Fe)CHUR −1, μ54 Cr = (54−52)/(50−52), and ε Cr is as de-
54 54
anomalies in 50 Ti (Trinquier et al. 2009). This could arise from fined in Section. 2.3.2 (deviation in part per 10,000 of the
the fact that these two neutron-rich isotopes were produced at 54
Cr/52 Cr ratio corrected by internal normalization to a con-
the same site and that the carriers have the same size and the stant 50 Cr/52 Cr ratio relative to a reference composition). Note
same chemical properties, so that they would not be decoupled that this equation assumes that 54 Cr and 60 Fe were not chem-
during incorporation in meteorites. ically decoupled during injection in the solar system. For this
The presence of short-lived nuclides like 26 Al (Lee et al. calculation, we used the composition of the bulk O/Ne and
1976, 1977; Jacobsen et al. 2008; MacPherson et al. 2010) O/C layers of a 21 M progenitor star (Rauscher et al. 2002,
and 60 Fe (Birck & Lugmair 1988; Shukolyukov & Lugmair http://nucastro.org/nucleosynthesis/), an initial 60 Fe/56 Fe ratio
1993; Tachibana & Huss 2003; Mostefaoui et al. 2005; Mishra of 6 × 10⁻⁷ for CHUR (Mishra et al. 2010), and a free-decay
et al. 2010) at the time of formation of meteorites supports birth interval of 1 Myr between nucleosynthesis in the SN and injec-
of the solar system near a core-collapse SN (ccSN; Cameron tion in the solar system (Meyer & Clayton 2000). The half-life
& Truran 1977; Foster & Boss 1996; Vanhala & Boss 2000; of 60 Fe is that recently measured by Rugel et al. (2009) of
Chevalier 2000; Ouellette et al. 2007). An appealing possibility 2.62 Myr. The prediction is that for the range of ε54 Cr values
is that the SN that injected these extinct radioactivities into the measured in bulk meteorites (from − 0.8 in achondrites to +1.6 in
early solar system also delivered the 54 Cr-rich nanoparticles CI chondrites; Trinquier et al. 2007; Qin et al. 2010), variations
identified in the present study. A test of this hypothesis will be in the initial 60 Fe/56 Fe ratio should be on the order of 10%–20%
to search for correlations between 54 Cr anomalies and the initial (Figure 13). Such variations will be challenging to detect if
abundance of extinct radioactivities like 60 Fe in meteorites, as present. The results obtained so far on the relative abundance
this nuclide is produced together with 54 Cr. Assuming that 54 Cr- of the neutron-rich isotope 58 Fe provide no evidence for 60 Fe
rich nanoparticles and 60 Fe share the same ccSN origin, one heterogeneity at the scale of bulk planetary objects outside of
can for example predict the degree to which the initial 60 Fe/ ±10% (Dauphas et al. 2008). FUN inclusions in meteorites
56
Fe ratio in meteorites should be sensitive to 54 Cr/52 Cr isotopic show large variations in ε54 Cr, from −23 to +48 (Papanastassiou
variations using an equation similar to Equation (C5) of Dauphas 1986). Variations of 48 Ca in these inclusions clearly favor an
et al. (2008): SNIa origin (Meyer & Zinner 2006) but Kratz et al. (2001)
10−4 56
1 + ρFe argued that these anomalies could also be produced in SNII.
(60 Fe/56 Fe)r,t0 = (60 Fe/56 Fe)CHUR,t0 + If the 54 Cr isotopic anomalies found in FUN inclusions de-
54
c ρCr − μ54 50
Cr ρCr rive from injection from a nearby SN, we would predict that
× (60 Fe/56 Fe)ccSN e−λ60 Δt the initial 60 Fe/56 Fe ratio in these objects should vary between
× (ε54 Crr − ε54CrCHUR ), ∼0 (ε54 Cr = −23) and 26 × 10−7 (ε54 Cr = +48). While this
represents a very large range, the main difficulty with these in-
where (60 Fe/56 Fe)r,t0 and (60 Fe/56 Fe)CHUR,t0 are the ratios in clusions is their mineralogy, which is not suited to establish 60 Fe
reservoir r and in CHUR (CHondritic Uniform Reservoir, taken isochrons.1590 DAUPHAS ET AL. Vol. 720
6. SUMMARY AND CONCLUSIONS and NSF through grants NNX09AG59G and EAR-0820807 to
N.D.
Meteorites and planets have variations in the abundance of
the neutron-rich isotope 54 Cr. The nature of the carrier of these
REFERENCES
anomalies is one of the key unsettled questions in cosmochem-
istry and planetary sciences. In order to address this question, Adachi, I., Hayashi, C., & Nakazawa, K. 1976, Prog. Theor. Phys, 56,
we have measured the Cr isotopic composition of physical and 1756
chemical separates from the primitive carbonaceous chondrites Alexander, C. M. O’D. 2002, Lunar Planet. Sci., XXXIII, 1872
Orgueil and Murchison (Figure 1). The data have clear implica- Amari, S., Lewis, R. S., & Anders, E. 1994, Geochim. Cosmochim. Acta., 58,
tions. 459
Birck, J.-L., & Allègre, C. J. 1984, Geophys. Res. Lett., 11, 943
1. The colloidal fraction from Orgueil, which has a median Birck, J.-L., & Allègre, C. J. 1988, Nature, 331, 579
Birck, J. L., & Lugmair, G. W. 1988, Earth Planet. Sci. Lett., 90, 131
grain size of ∼30 nm, shows the largest 54 Cr excess ever
Birck, J.-L., Petitat, M., Luu, T. H., & Gounelle, M. 2009, Lunar Planet. Sci.,
measured in a bulk meteorite residue (54 Cr/52 Cr = 1.017 × 40, 1683
solar, Figure 7). This indicates that the carrier of 54 Cr Brachwitz, F., et al. 2000, ApJ, 536, 934
anomalies was efficiently concentrated by our procedure Brown, E. F., Calder, A. C., Plewa, T., Ricker, P. M., Robinson, K., & Gallagher,
and that it must be very fine grained (No. 2, 2010 NEUTRON-RICH CHROMIUM ISOTOPE ANOMALIES IN SUPERNOVA NANOPARTICLES 1591 Podosek, F. A., Nichols, R. H., Jr., Brannon, J. C., & Dougherty, J. R. 1999, Shukolyukov, A., & Lugmair, G. W. 2006, Earth Planet. Sci. Lett., 250, 200 Lunar Planet. Sci., 30, 1307 Stehle, M., Mazzali, P. A., Benetti, S., & Hillebrandt, W. 2005, MNRAS, 360, Podosek, F. A., Ott, U., Brannon, J. C., Neal, C. R., Bernatowicz, T. J., Swan, 1231 P., & Mahan, S. E. 1997, Meteoritics, 32, 617 Tachibana, S., & Huss, G. R. 2003, ApJ, 588, L41 Qin, L., Alexander, C. M. O’D., Carlson, R. W., Horan, M. F., & Yokoyama, T. The, L.-S., El Eid, M. F., & Meyer, B. S. 2007, ApJ, 655, 1058 2010, Geochim. Cosmochim. Acta., 74, 1122 Thielemann, F. K., Brachwitz, F., Höflich, P., Martinez-Pinedo, G., & Nomoto, Qin, L., Alexander, C. M. O’D., Nittler, L. R., Wang, J., & Carlson, R. W. 2009, K. 2004, New Astron. Rev., 48, 605 Meteorit. Planet. Sci., 44, A171 Travaglio, C., Hillebrandt, W., Reinecke, M., & Thielemann, F.-K. 2004, A&A, Rauscher, T., Heger, A., Hoffman, R. D., & Woosley, S. E. 2002, ApJ, 576, 425, 1029 323 Trinquier, A., Birck, J.-L., & Allègre, C. J. 2007, ApJ, 655, 1179 Röpke, F. K., Gieseler, M., Reinecke, M., Travaglio, C., & Hillebrandt, W. Trinquier, A., Birck, J.-L., & Allègre, C. J. 2008, J. Anal. Atom. Spectrom., 23, 2006, A&A, 453, 203 1565 Rotaru, M., Birck, J.-L., & Allègre, C. J. 1992, Nature, 358, 465 Trinquier, A., Elliott, T., Ulfbeck, D., Coath, C., Krot, A. N., & Bizzarro, M. Rugel, G., et al. 2009, Phys. Rev. Lett., 103, 072502 2009, Science, 324, 374 Russell, W. A., Papanastassiou, D. A., & Tombrello, T. A. 1978, Geochim. Van Cappellen, E. 1990, Microsc. Microanal. M., 1, 1 Cosmochim. Acta., 42, 1075 Van Cappellen, E., & Doukhan, J. C. 1994, Ultramicroscopy, 53, 343 Savina, M. R., Levine, J., Stephan, T., Dauphas, N., Davis, A. M., Knight, K. B., Vanhala, H. A. T., & Boss, A. P. 2000, ApJ, 538, 911 & Pellin, M. J. 2010, Lunar Planet. Sci., 41, 2568 Völkening, J., & Papanastassiou, D. A. 1989, Astrophys. J., 347, L43 Schoenberg, R., Zink, S., Staubwasser, M., & von Blanckenburg, F. 2008, Chem. Weidenschilling, S. J. 1977, MNRAS, 180, 57 Geol., 249, 294 Woosley, S. E. 1997, Astrophys. J., 476, 801 Shields, W. R., Murphy, T. J., Catanzaro, E. J., & Garner, E. L. 1966, J. Res. Zinner, E. 1998, Annu. Rev. Earth Planet. Sci., 26, 147 Nat. Bur. Stand., 70A, 193 Zinner, E., Nittler, L. R., Hoppe, P., Gallino, R., Straniero, O., & Alexander, Shukolyukov, A., & Lugmair, G. W. 1993, Science, 259, 1138 C. M. O’D. 2005, Geochim. Cosmochim. Acta., 69, 4149
You can also read