Neutronic Characteristics of ENDF/B-VIII.0 Compared to ENDF/B-VII.1 for Light-Water Reactor Analysis - MDPI
←
→
Page content transcription
If your browser does not render page correctly, please read the page content below

Article
Neutronic Characteristics of ENDF/B-VIII.0 Compared to
ENDF/B-VII.1 for Light-Water Reactor Analysis
Kang-Seog Kim * and William A. Wieselquist

                                           Nuclear Energy and Fuel Cycle Division, Oak Ridge National Laboratory, One Bethel Valley Road, P.O. Box 2008,
                                           MS-6172, Oak Ridge, TN 37831, USA; wieselquiswa@ornl.gov
                                           * Correspondence: kimk1@ornl.gov

                                           Abstract: The Evaluated Nuclear Data File (ENDF)/B-VIII.0 data library was released in 2018. To
                                           assess the new data during development and shortly after release, many validation calculations were
                                           performed with static, room-temperature benchmarks. Recently, when performing validation of
                                           ENDF/B-VIII.0 for pressurized water reactor depletion calculations, a regression in performance
                                           compared to ENDF/B-VII.1 was observed. This paper documents extensive benchmark calculations
                                           for light-water reactors performed using continuous energy Monte Carlo code with ENDF/B-VII.1
                                           and -VIII.0 and neutronic characteristics of ENDF/B-VIII.0 are discussed and compared to those
                                           of ENDF/B-VII.1. It is our recommendation that ENDF/B data library assessment should include
                                           reactor-specific benchmark assessments, including depletion cases, such that these types of regres-
                                           sions may be caught earlier in the data development cycle.

                                           Keywords: ENDF/B-VII.1 and VIII.0; light water reactor; neutronic characteristics; benchmark
                                 calculation


Citation: Kim, K.-S.; Wieselquist,
W.A. Neutronic Characteristics of
ENDF/B-VIII.0 Compared to                  1. Introduction
ENDF/B-VII.1 for Light-Water                     The Virtual Environment for Reactor Applications (VERA) [1], developed by the Con-
Reactor Analysis. J. Nucl. Eng. 2021, 2,   sortium for Advanced Simulation of Light Water Reactors (CASL) [2], was very successful
318–335. https://doi.org/10.3390/
                                           in simulating high-fidelity multiphysics for pressurized water reactor (PWR) physics anal-
jne2040026
                                           ysis. VERA development continues through the Nuclear Energy Advanced Modeling
                                           and Simulation (NEAMS) project [3] for the boiling water reactor (BWR) analysis. The
Academic Editor: Dan Gabriel Cacuci
                                           PWR simulation results using VERA with the Evaluated Nuclear Data File (ENDF)/B-VII.1
                                           nuclear evaluated data [4] were very consistent with the PWR measured data [5], which
Received: 12 August 2021
Accepted: 13 September 2021
                                           were processed to generate the 51-group neutron cross-section library [6,7] for the primary
Published: 23 September 2021
                                           VERA neutronics simulator MPACT [8]. The ENDF/B-VII.1 MPACT 51-group library sup-
                                           ports both non-epithermal and epithermal upscattering for 238 U, which has been known to
Publisher’s Note: MDPI stays neutral
                                           improve the Doppler temperature coefficient [9]. However, the benchmark calculations
with regard to jurisdictional claims in
                                           in the paper by Mangham et al. [5] were performed without considering epithermal up-
published maps and institutional affil-    scattering, because epithermal upscattering would result in about a 200 pcm reactivity
iations.                                   underestimation. It was expected that the ENDF/B-VIII.0 data library [10] would resolve
                                           the reactivity bias issue by considering epithermal upscattering for the PWR analysis. Ex-
                                           tensive benchmark calculations were performed using ENDF/B-VIII.0 to identify neutronic
                                           characteristics of ENDF/B-VIII.0 and results are compared to ENDF/B-VII.1.
                                                 ENDF/B-VIII.0 was released in 2018. Identifying potential issues in new ENDF/B li-
Copyright: © 2021 by the authors.
Licensee MDPI, Basel, Switzerland.
                                           braries for power plant simulations can be challenging because most validation calculations
This article is an open access article
                                           for new versions are performed for static and room-temperature benchmark problems. De-
distributed under the terms and            pletion benchmark calculations have been performed to investigate the differences between
conditions of the Creative Commons         ENDF/B-VII.1 and -VIII.0 [11] and results have shown that ENDF/B-VIII.0 significantly
Attribution (CC BY) license (https://      underestimated reactivity compared to ENDF/B-VII.1 with respect to depletion. Park
creativecommons.org/licenses/by/           et al. [12] compared both libraries in the VERA benchmark progression problems and a
4.0/).                                     similar trend to that discussed in the paper by Kim and Wieselquist [11] was indicated.

J. Nucl. Eng. 2021, 2, 318–335. https://doi.org/10.3390/jne2040026                                                https://www.mdpi.com/journal/jne
J. Nucl. Eng. 2021, 2                                                                                               319

                        However, the most influential nuclides were not identified and insufficient information
                        was included for the neutronic behavior of ENDF/B-VIII.0 in terms of light-water reactor
                        (LWR) physics analysis. Bostelmann et al. also demonstrated the impact of ENDF/B-VIII.0
                        on advanced reactor simulation [13], but the investigation concerned only its basic impact
                        on various advanced reactor analysis.
                             CASL and NEAMS developed the PWR and BWR benchmark problems to verify
                        the MPACT multigroup (MG) library for VERA, covering most neutronic characteristics
                        for the PWR and BWR physics analysis. The reference solutions were obtained using the
                        continuous-energy (CE) Monte Carlo (MC) codes SCALE/KENO [14], Serpent [15] and
                        Monte Carlo N-Particle (MCNP) Transport [16] with ENDF/B-VII.1. In addition to the
                        depletion comparison between ENDF/B-VII.1 and -VIII.0 [11], benchmark calculations
                        were performed using the CE MC codes to identify the neutronic characteristics of ENDF/B-
                        VIII.0 compared to those of ENDF/B-VII.1 for LWR physics analysis.
                             This study focuses on comparisons between ENDF/B-VIII.0 and -VII.1 for extensive
                        PWR and BWR benchmark problems to clearly identify the impact of ENDF/B-VIII.0 on
                        LWR analysis. A full investigation will be completed during the development of new
                        versions of ENDF/B through a collaboration with nuclear data evaluators within the Cross
                        Section Evaluation Working Group and it is expected to significantly shorten the ENDF/B
                        development period and minimize potential issues.

                        2. LWR Benchmark Problems
                        2.1. PWR Benchmark Problems
                             The PWR benchmark problems were taken from Kim et al. [7], which verified the
                        ENDF/B-VII.1 MPACT 51-group library for the VERA MPACT. Only a brief overview of
                        the problems is included herein; detailed descriptions can be found in the aforementioned
                        paper [7]. These benchmark problems were used in the comparison of neutronic char-
                        acteristics between ENDF/B-VII.1 and -VIII.0. Table 1 provides a summary of the PWR
                        benchmark suite.

                        Table 1. The PWR benchmark suite.

                           Case                     Description                   Number of Cases      Reference
                            A         VERA core physics progression problems             26               [7,17]
                            B          Extended VERA progression problems                15                 [7]
                            C                VERA depletion problems                     24               [7,18]
                            D        Extensive PWR pin and assembly problems            1620            [7,19,20]
                            E         Nonuniform fuel temperature problems               14                [21]
                            F             Mosteller benchmark problems                   21                [22]

                              The VERA core physics benchmark progression problems were created to provide
                        a method for developing and demonstrating new reactor physics methods and software
                        capabilities [17]. The progression problems range from a simple 2D pin cell to the full-cycle
                        depletion and refueling of a 3D reactor core configuration with control rods and burnable
                        poisons consistent with actual nuclear power plant designs. Most of the data are based on
                        fuel and plant data from the initial core loading of Watts Bar Nuclear Unit 1, a Westinghouse
                        Electric Company-designed 17 × 17 PWR.
                              Because the VERA core physics benchmark progression problems do not include
                        various 235 U enrichment and burnup compositions, additional benchmark problems were
                        developed to analyze the cross-section library’s sensitivities to 235 U enrichment, burnup
                        and a number of radial fuel rings. These benchmark problems were developed based on
                        the VERA progression problems 1B and 1C.
                              The VERA depletion benchmark problems [7,18] were developed based on the VERA
                        progression problems. The depletion benchmark suite includes 8 single-pin problems and
                        16 fuel-assembly problems with various fuel temperatures, 235 U enrichments, control rods
                        and burnable poisons.
J. Nucl. Eng. 2021, 2                                                                                                320

                              The extensive benchmark problems for PWR fuel pins and assemblies were developed
                        to determine how well the MPACT MG library agrees with CE MC results [19,20]. The
                        PWR fuel pin cases consist of three 235 U enrichments, four rod sizes, three hot coolant
                        densities, three hot fuel temperatures, cold cases at room temperature and three boron
                        concentrations. There is a total of 360 cases, 324 hot cases and 36 cold cases. The PWR pin
                        cells were modeled as three concentric rings of fuel, helium gap and zirconium, surrounded
                        by a square region of coolant. Additional benchmark problems were developed for 14 PWR
                        assembly types, including 15 × 15, 16 × 16 and 17 × 17 designs by different fuel vendors
                        and these benchmarks account for many state-point conditions encountered in a reactor.
                        Each assembly type includes 90 state points with three 235 U enrichments, three hot coolant
                        densities, three hot fuel temperatures, one cold case at standard room temperature and
                        density and three boron concentrations. There is a total of 81 hot cases and 9 cold cases per
                        assembly, for a total of 1260 cases.
                              Seoul National University developed a benchmark suite for the intrapellet nonuniform
                        temperature distribution cases [21]. The geometrical specifications include five equi-
                        volume subzones in the fuel pellet, gap, cladding and moderator. Nonuniform temperature
                        profiles as a function of power and average fuel temperatures were introduced. Benchmark
                        calculations were performed using both nonuniform and uniform temperature profiles.
                              The Mosteller benchmark [22] was originally developed to measure the Doppler
                        temperature reactivity coefficient and has also been used for validation of software. The
                        original benchmarks did not include the 1200 K cases; those cases were added to these
                        benchmark calculations.

                        2.2. BWR Benchmark Problems
                        2.2.1. VERA BWR Depletion Benchmark Problems
                             The VERA BWR depletion problems were developed for single-pin fuels only. Single-
                        pin benchmarks (shown in Table 2) were developed with fuel pins of a Peach Bottom 2
                        (PB2) 7 × 7 design with a large fuel pellet radius. Additionally, 50% and 70% voids were
                        considered to observe the trend of reactivity difference for various void fractions.

                        Table 2. Benchmark cases for the BWR VERA depletion benchmarks.

                                                                 235            Temperature (K)                 Power
                         No.    Fuel    Type     Pellet Radius       U                                   Void   Density
                                                      (cm)       wt %    Fuel        Clad         Mod.    (%)   (w/gU)
                         1A     Pin    PB2_7×7      0.60579       3.1     600        600          600      0      40
                         1B     Pin    PB2_7×7      0.60579       3.1     900        600          600      0      40
                         1C     Pin    PB2_7×7      0.60579       3.1    1200        600          600      0      40
                         1D     Pin    PB2_7×7      0.60579       2.1     900        600          600      0      40
                         1E     Pin    PB2_7×7      0.60579       3.6     900        600          600      0      40
                         1F     Pin    PB2_7×7      0.60579       4.6     900        600          600      0      40
                         1G     Pin    PB2_7×7      0.60579       3.1     900        600          600     50      40
                         1H     Pin    PB2_7×7      0.60579       3.1     900        600          600     70      40

                        2.2.2. Extensive BWR Pin and Assembly Benchmark Problems
                             Single-pin benchmark problems were developed using four BWR fuel types [23], as
                        shown in Table 3. The benchmark problems include four fuel pellet sizes, four modera-
                        tor/fuel temperatures, three 235 U enrichments, four void fractions and four burnups. The
                        analysis used a total of 220 benchmark cases.
J. Nucl. Eng. 2021, 2                                                                                                     321

                        Table 3. Benchmark cases for the BWR single pins.

                                  Category                 Case          Specification       Cases    Total     Remarks
                                                        PB Type-6       0.52070/1.62560
                                 Fuel types,
                                                          GE9           0.53213/1.62560
                              fuel radius/pitch                                                   4                 -
                                                          GE14          0.43800/1.30000
                                     (cm)
                                                        PB2 7 × 7       0.60579/1.87452
                                                         CZP a                293/293
                              Moderator/fuel
                                                         HZP b                600/600
                               temperatures                                                       4           Zero burnup
                                                         HFP c -1             600/900                 156
                                   (K)
                                                         HFP-2               600/1200
                                   235 U
                                                             -            2.1/3.1/4.1             3                 -
                             enrichment (wt %)
                                Void fraction                                                                 0% void only
                                                             -           0/50/70/90               4
                                    (%)                                                                         for CZP
                                                                                                                 3.1 wt%,
                                  Burnup                                                                          HFP-1,
                                                             -           10/20/40/60              4    64
                                (MWD/kgU)                                                                     all voids and
                                                                                                              all fuel types
                                     All                     -                  -                 -   220           -
                        a   CZP, cold zero power; b HZP, hot zero power; c HFP, hot full power.

                            Extensive BWR assembly benchmark problems were developed based on the VERA
                        BWR progression problems [23], with four fuel pellet sizes, four 235 U enrichments, four
                        moderator and fuel temperatures, three void fractions and control rod in and out. Table 4
                        provides variations of nuclear state parameters for these benchmark problems. The total
                        number of cases is 320.

                        Table 4. Benchmark cases for the BWR single assemblies.

                                  Category                 Case          Specification       Cases    Total     Remarks
                                                         PB-T6          0.52070/1.62560
                                 Fuel types,
                                                         GE-09          0.53213/1.62560
                              fuel radius/pitch                                                   4                 -
                                                         GE-14          0.43800/1.30000
                                     (cm)
                                                         GE-14v         0.60579/1.87452
                                   235 U
                                                             -          Mixed/2.1/3.1/4.1 4                         -
                             enrichment (wt %)
                                                                                                      320
                                Control rods                 -               Out/In               2                 -
                                                         CZP     a            293/293
                              Moderator/fuel
                                                         HZP b                600/600                               -
                               temperatures                                                       4
                                                         HFP c -1             600/900
                                   (K)
                                                         HFP-2               600/1200
                                Void fraction                                                                 0% void only
                                                             -               0/40/80              3
                                    (%)                                                                         for CZP
                                     All                     -                  -                 -   320           -
                        a                         b                      c
                            CZP, cold zero power; HZP, hot zero power; HFP, hot full power.

                        3. Results
                        3.1. PWR Benchmark Results
                        3.1.1. VERA PWR Benchmark Progression Problems
                            Table 5 compares the multiplication factors between ENDF/B-VII.1 and -VIII.0 with
                        and without Doppler broadening rejection correction (DBRC) [24], which is used to
                        consider epithermal upscattering. The benchmark calculations were performed using
                        SCALE/KENO with ENDF/B-VII.1 and -VIII.0. The ENDF/B-VIII.0 library overestimates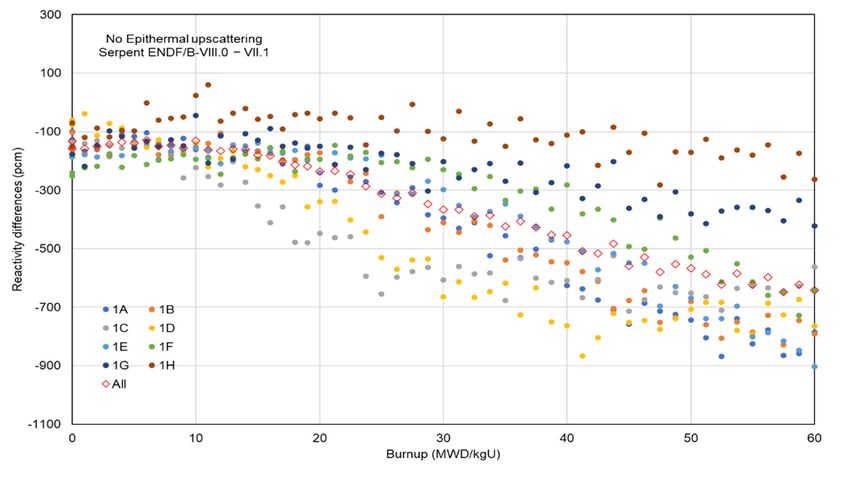
J. Nucl. Eng. 2021, 2                                                                                                     322

                        reactivity for the following cases that include 10 B and Gd isotopes: (a) 1E, 2L, 2M and 2N
                        with the integral fuel burnable absorber (IFBA) burnable poisons; (b) 2E, 2F and 2H with
                        the Pyrex burnable poisons; (c) 2G with the AgInCd control rod insertion; (d) 2O and 2P
                        with the gadolinia rods. The reactivity differences between ENDF/B-VII.1 and -VIII.0 with
                        DBRC and without DBRC are similar. Cross sections of 10 B and Gd isotopes that cause
                        positive reactivity in ENDF/B-VIII.0 are discussed in Section 4.

                        Table 5. Results of the VERA PWR benchmark progression problems.

                                                     KENO with DBRC                       KENO without DBRC
                             Case                    keff *              (2–1)                 keff *              (2–1)
                                                                        ∆ρ (pcm)                                  ∆ρ (pcm)
                                         VII.1 (1)        VIII.0 (2)               VII.1 (1)        VIII.0 (2)
                             1A           1.18569             1.18521     −34      1.18700              1.18667     −24
                             1B           1.18065             1.18002     −45      1.18214              1.18126     −63
                             1C           1.16895             1.16853     −31      1.17144              1.17116     −21
                             1D           1.15885             1.15866     −14      1.16258              1.16249     −7
                             1E           0.77082             0.77359     465      0.77127              0.77437     519
                             2A           1.18081             1.18076     −3       1.18187              1.18167     −14
                             2B           1.18190             1.18177     −9       1.18323              1.18302     −15
                             2C           1.17125             1.17143      13      1.17362              1.17354     −6
                             2D           1.16189             1.16222      24      1.16556              1.16567       8
                             2E           1.06829             1.06901      63      1.06953              1.07001      42
                             2F           0.97462             0.97579     123      0.97569              0.97670     107
                             2G           0.84674             0.84809     188      0.84766              0.84896     181
                             2H           0.78705             0.78800     153      0.78793              0.78852      95
                              2I          1.17865             1.17864       0      1.17962              1.17951     −8
                              2J          0.97378             0.97513     142      0.97496              0.97630     141
                             2K           1.01864             1.01930      64      1.01977              1.02029      50
                             2L           1.01760             1.01912     147      1.01868              1.02017     143
                             2M           0.93778             0.94003     255      0.93855              0.94090     266
                             2N           0.86840             0.87043     268      0.86944              0.87133     250
                             2O           1.04613             1.04738     114      1.04717              1.04822      96
                             2P           0.92566             0.92771     239      0.92670              0.92862     223
                        * Maximum standard deviation = 0.00013.

                        3.1.2. VERA PWR Extended Benchmark Progression Problems
                             The VERA PWR extended benchmark suite was used to discern the trend of the multi-
                        plication factors with various 235 U enrichments and various snapshot burnups in which
                        atomic number densities of depleted isotopic inventories were taken from single fuel-pin
                        depletion calculation. The benchmark calculations were performed using SCALE/KENO
                        with ENDF/B-VII.1 and VIII.0 of which the multiplication factors are compared in Table 6.
                        ENDF/B-VIII.0 overestimated reactivity at 2.1 wt % of 235 U. However, as 235 U enrichment
                        increased, ENDF/B-VIII.0 underestimated reactivity, resulting in a ∆ρ bias of about 300 pcm
                        between 2.1 and 4.6 wt % of 235 U. When all heavy and fission product yield nuclides were
                        included, reactivity differences between ENDF/B-VII.1 and VIII.0 were negligible. There
                        were significant error cancelations among 235 U, 238 U, 16 O and 239 Pu, which are discussed
                        in Section 4. The burnup history effect is discussed in Section 3.1.3.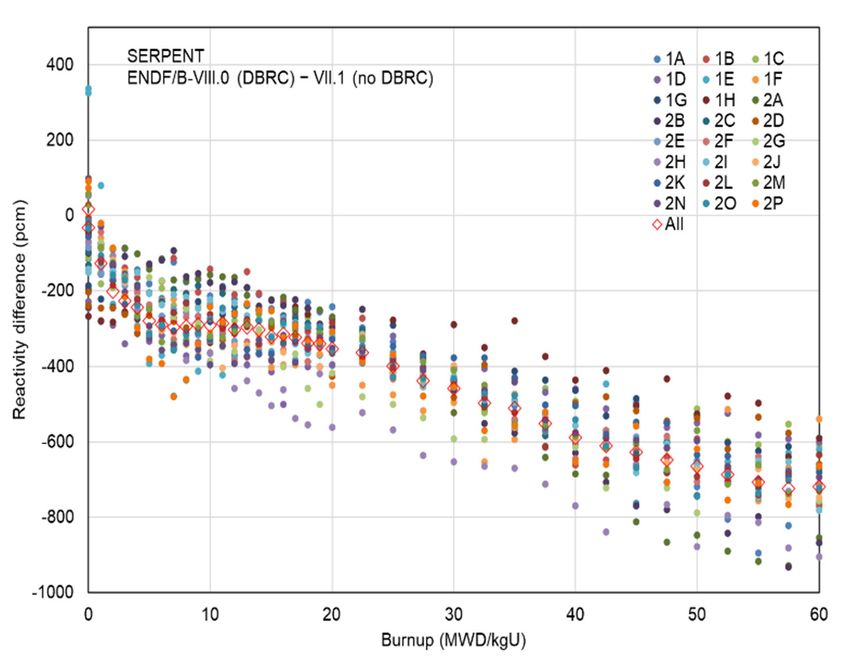
J. Nucl. Eng. 2021, 2                                                                                                     323

                        Table 6. Results of VERA PWR extended benchmark progression problems.

                                                   KENO with DBRC                        KENO without DBRC
                            Case                   keff                 (2–1)                 keff                 (2–1)
                                                                       ∆ρ (pcm)                                   ∆ρ (pcm)
                                       VII.1 (1)          VIII.0 (2)              VII.1 (1)          VIII.0 (2)
                           1B-21        1.06871            1.06994      108       1.07002             1.07163      140
                           1B-26        1.13385            1.13415       23       1.13548             1.13560       9
                           1B-31        1.18048            1.18019      −21       1.18211             1.18170      −29
                           1B-36        1.21951            1.21855      −65       1.22096             1.21980      −78
                           1B-41        1.25125            1.24909      −138      1.25244             1.25044      −128
                           1B-46        1.27712            1.27472      −147      1.27871             1.27595      −169
                          1C-00-3a      1.24435            1.24341      −61       1.24720             1.24587      −86
                          1C-10-3a      1.08484            1.08479       −4       1.08738             1.08699      −33
                          1C-20-3a      1.00059            1.00113       54       1.00297             1.00292       −5
                          1C-40-3a      0.88112            0.88135       30       0.88297             0.88318       27
                          1C-60-3a      0.80711            0.80721       15       0.80869             0.80886       26
                          1C-10-1h      1.17128            1.17082      −34       1.17394             1.17320      −54
                          1C-20-1h      1.11417            1.11401      −13       1.11647             1.11657        8
                          1C-40-1h      1.03382            1.03463       76       1.03614             1.03682       63
                          1C-60-1h      0.98625            0.98725      103       0.98849             0.98941       94

                        3.1.3. VERA PWR Depletion Benchmark Problems
                              Kim and Wieselquist [11] discussed the reactivity underestimation of ENDF/B-VIII.0
                        compared to that of ENDF/B-VII.1 for the VERA PWR depletion benchmark problems.
                        Depletion benchmark calculations were performed using Serpent with ENDF/B-VII.1 and
                        -VIII.0 ACE format libraries for the VERA depletion benchmark problems. The ENDF/B-
                        VII.1 ACE format libraries were from MCNP6.1 [16] and the ENDF/B-VIII.0 ACE format
                        libraries were processed using NJOY-2016 [25]. Figure 1a compares the multiplication fac-
                        tors (keff ) between the two ENDF/B versions without considering epithermal upscattering
                        as a function of burnup, of which standard deviations were about 20 pcm. ENDF/B-VIII.0
                        significantly underestimated the multiplication factors at high burnup points compared to
                        ENDF/B-VII.1. Figure 1b compares the multiplication factors (keff ) between ENDF/B-VIII.0
                        with DBRC and ENDF/B-VII.1 without DBRC. As might be expected, considering epither-
                        mal upscattering resulted in an additional negative reactivity bias of 150–200 pcm for the
                        PWR hot full-power calculations. However, reactivities with epithermal upscattering were
                        increased because of depletion history which is to follow up individual isotopes through
                        isotopic depletion calculation with decays and neutron–nuclide reactions. Therefore, once
                        the ENDF/B library is improved to ensure better reactivity at the beginning of burnup, low
                        reactivity at high burnups may not be an issue.
                              The most influential nuclides in terms of impact on the reactivity difference between
                        ENDF/B-VII.1 and VIII.0 were identified by Kim and Wieselquist [11]. Figure 2 shows
                        the keff differences as a function of burnup caused by the ENDF/B-VII.1 cross sections
                        of all nuclides, 235 U, 238 U, 239 Pu and 16 O. There were error cancelations at zero burnup
                        between 238 U (+230 pcm), 235 U (−210 pcm) and 16 O (−120 pcm). As burnup increased
                        and the 239 Pu influence became more negative and then more saturated, the 238 U influence
                        decreased and became more negative above 40 MWD/kgU. The 235 U influence decreased
                        and became saturated at −100 pcm. The total keff difference at 60 MWD/kgU was about
                        400 pcm, which was 650 pcm in ∆ρ. More detailed reaction rate analysis was performed to
                        demonstrate energy and reaction dependent reaction rate differences to impact the overall
                        reactivities. This analysis is discussed in Section 4.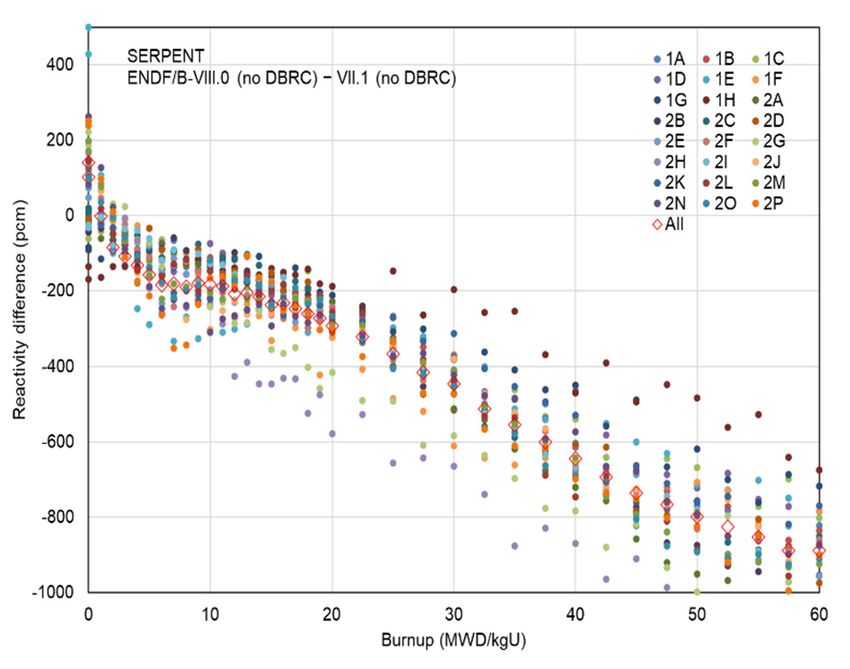
between ENDF/B-VIII.0 with DBRC and ENDF/B-VII.1 without DBRC. As might be
expected, considering epithermal upscattering resulted in an additional negative
reactivity bias of 150–200 pcm for the PWR hot full-power calculations. However,
reactivities with epithermal upscattering were increased because of depletion history
which is to follow up individual isotopes through isotopic depletion calculation with
J. Nucl. Eng. 2021, 2
decays and neutron–nuclide reactions. Therefore, once the ENDF/B library is improved324
to
ensure better reactivity at the beginning of burnup, low reactivity at high burnups may
not be an issue.
J. Nucl. Eng. 2021, 2, FOR PEER REVIEW 7
influence became more negative and then more saturated, the 238U influence decreased
and became more negative above 40 MWD/kgU. The 235U influence
(a) (b) decreased and became
saturated at −100 pcm. The total keff difference at 60 MWD/kgU was about 400 pcm, which
Figure 1. Comparison
Figure 1. Comparison of
of the
the
wasmultiplication
multiplication factors
650 pcm infactors as aa function
as
Δρ. More function ofreaction
detailedof burnup: (a)
burnup: (a) the reactivity
theanalysis
rate reactivity difference
difference
was between
between
performed ENDF/B-
ENDF/B-
to demonstrate
VIII.0 without DBRC and ENDF/B-VII.1
VIII.0 without DBRC and ENDF/B-VII.1 without DBRC;
without dependent (b)
DBRC; (b) the the reactivity
reactivity difference
difference between
between ENDF/B-VIII.0
ENDF/B-VIII.0 with
with DBRC
DBRC
energy and reaction reaction rate differences to impact the overall reactivities.
and ENDF/B-VII.1 without DBRC.
and ENDF/B-VII.1 withoutThisDBRC.
analysis is discussed in Section 4.
The most influential nuclides in terms of impact on the reactivity difference between
ENDF/B-VII.1 and VIII.0 were identified by Kim and Wieselquist [11]. Figure 2 shows the
keff differences as a function of burnup caused by the ENDF/B-VII.1 cross sections of all
nuclides, 235U, 238U, 239Pu and 16O. There were error cancelations at zero burnup between
238U (+230 pcm), 235U (−210 pcm) and 16O (−120 pcm). As burnup increased and the 239Pu
Figure
Figure2.2.Most
Mostinfluential
influentialnuclides
nuclidesininENDF/B-VIII.0.
ENDF/B-VIII.0.
3.1.4.Extensive
3.1.4. ExtensivePWR
PWRPin
Pinand
andAssembly
AssemblyBenchmark
BenchmarkProblems
Problems
Theextensive
The extensivePWR
PWRpin
pinand
andassembly
assemblybenchmark
benchmarkcalculations
calculationswere
wereperformed
performedusing
using
SCALE/KENO with ENDF/B-VII.1 and -VIII.0, with and without considering epithermal
SCALE/KENO with ENDF/B-VII.1 and -VIII.0, with and without considering epithermal
upscattering. The histogram of the reactivity differences for the pin benchmark problems
upscattering. The histogram of the reactivity differences for the pin benchmark problems
is shown in Figure 3a. ENDF/B-VIII.0 mostly underestimated reactivities, except for the
is235
shown in Figure 3a. ENDF/B-VIII.0 mostly underestimated reactivities, except for the
U 2.1 wt % cases. The same benchmark calculations used for the extensive PWR pin
235U 2.1 wt % cases. The same benchmark calculations used for the extensive PWR pin
benchmark problems were performed using MCNP. Although MCNP slightly overesti-
benchmark problems were performed using MCNP. Although MCNP slightly
mated reactivity, compared to KENO, MCNP’s overall trend was very similar to KENO’s.
overestimated reactivity, compared to KENO, MCNP’s overall trend was very similar to
Tables 7 and 8 provide the benchmark results categorized for 235 U enrichment, soluble
KENO’s. Tables 7 and 8 provide the benchmark results categorized for 235U enrichment,
boron concentration, moderator density and fuel temperature for fuel pins and assemblies,
soluble boron concentration, moderator density and fuel temperature for fuel pins and
respectively. A trend of reactivity bias can be clearly observed in 235 U enrichment and
assemblies, respectively. A trend of reactivity bias can be clearly observed in 235U
enrichment and soluble boron concentration. Under hot conditions, the boron worth of
ENDF/B-VII.1 was larger than that of ENDF/B-VIII.0 by 0.093 pcm/ppm. There was no
trend for moderator density and fuel temperature that would provide very consistent
moderator and fuel temperature reactivity coefficients.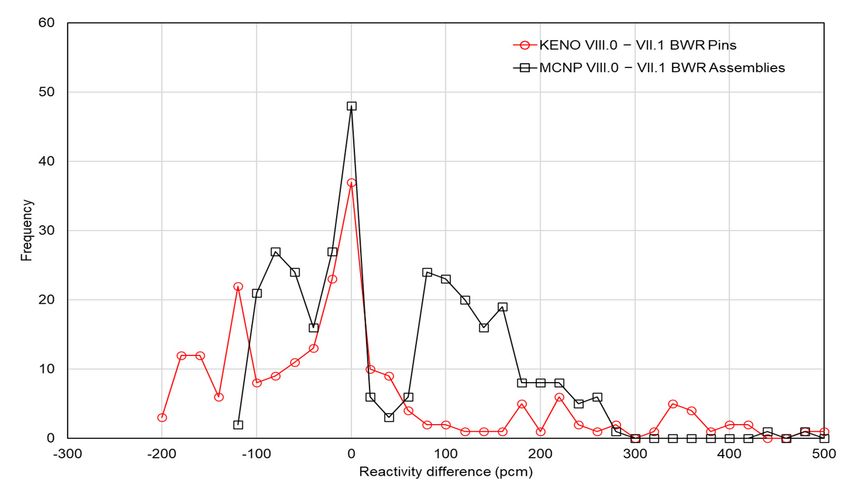
J. Nucl. Eng. 2021, 2 325
soluble boron concentration. Under hot conditions, the boron worth of ENDF/B-VII.1 was
larger than that of ENDF/B-VIII.0 by 0.093 pcm/ppm. There was no trend for moderator
J. Nucl. Eng. 2021, 2, FOR PEER REVIEW 8
density and fuel temperature that would provide very consistent moderator and fuel
temperature reactivity coefficients.
(a) (b)
Figure 3. Histogram of the extensive PWR (a) pin and (b) assembly benchmark results.
Table 7. Results
Table 7. Results of
of the
the extensive
extensive PWR
PWR pin
pin benchmark
benchmark problems.
problems.
Reactivity Differences
Reactivity Differencesbetween ENDF/B-VIII.0
between ENDF/B-VIII.0 andand
VII.1VII.1
(pcm)(pcm)
KENO
KENO with DBRC
with DBRC KENO
KENOwithout DBRC
without DBRC Counts
Counts
Average S.S.
Average Dev. Min.
Dev. Min. Max.Max. Average
Average S.S. Dev. Min.
Dev. Min. Max.Max.
All
All −56
−56 114
114 −206
−206 194
194 −66
−66 119
119 −215
−215 206
206 360
360
Total
Total Hot
Hot −−51
51 113
113 − 206
−206 194
194 −62
−62 118
118 − 215
−215 206
206 324
324
Cold −105 122 −199 35 −108 126 −209 50 36
Cold −105 122 −199 35 −108 126 −209 50 36
Hot
Hot
235 U 2.1 61 94 −47 194 50 86 −60 206 108
3.12.1 −61
69 94
85 −−47
149 19438 5081
− 86
95 −−60
157 20613 108
108
(wt
235%)
U 4.1 −145 149 −206 0 −154 158 −215 0 108
3.1 −69 85 −149 38 −81 95 −157 13 108
(wt %) 0 −111 131 −206 7 −122 140 −215 0 108
Boron 6004.1 −145
−53 149
100 −206
− 165 0101 −154
−63 158
106 −215
− 179 080 108
108
PPM 13000 11 105 − 132 −
−111 131 −206 7194 1
−122 103
140 145
−215 0206 108
108
Boron 0.7408 −−53
46 113 − 205 194 − 57 118 − 212 172 108
Density 600 100 −165 101 −63 106 −179 80 108
PPM
(g/cm3 )
0.7032 −50 111 −198 177 −62 117 −203 206 108
1300
0.6560 −11
56 105
114 −132
− 206 194
188 −166 103
119 −145
− 215 206
164 108
108
Fuel 0.7408
600 −−46
60 113
115 −205
− 206 194
162 −57
−69 118
121 −212
− 212 172
172 108
108
Density
temp. 900 −52 113 −194 185 −60 115 −205 164 108
0.7032
(K) 3) 1200
−50
−41 111
110 −198
−200 177
194 −62
−55 117
117 −203
−215 206
206 108
108
(g/cm
Cold 0.6560 −56 114 −206 188 −66 119 −215 164 108
Fuel 600
2.1 −60
−44 115
65 −206
−102 16235 −69
−45 121
70 −212
−115 17250 108
12
235 U
temp. 3.1
900 −−52
112 118
113 − 160
−194 185 0 − 116
−60 121
115 − 173
−205 1640 12
108
(wt %) 4.1 −160 164 −199 0 −164 167 −209 0 12
(K) 1200 −41 110 −200 194 −55 117 −215 206 108
0 −150 155 −199 0 −156 161 −209 0 12
Boron
Cold 600 −108 119 −171 0 −108 118 −171 0 12
PPM 1300 −57 82 −150 35 −60 87 −136 50 12
235U
2.1 −44 65 −102 35 −45 70 −115 50 12
3.1 −112 118 −160 0 −116 121 −173 0 12
(wt %)
4.1 −160 164 −199 0 −164 167 −209 0 12
0 −150 155 −199 0 −156 161 −209 0 12
Boron
600 −108 119 −171 0 −108 118 −171 0 12
PPM
1300 −57 82 −150 35 −60 87 −136 50 12
Table 8. Results of the extensive PWR assembly benchmark problems.
Reactivity Differences between ENDF/B-VIII.0 and VII.1 (pcm)
KENO with DBRC KENO without DBRC Counts
Average S. Dev. Min. Max. Average S. Dev. Min. Max.
All 32 154 −198 554 18 150 −214 545 1260
Total Hot 43 158 −198 554 28 154 −214 545 1134
Cold −65 104 −196 183 −72 107 −201 239 126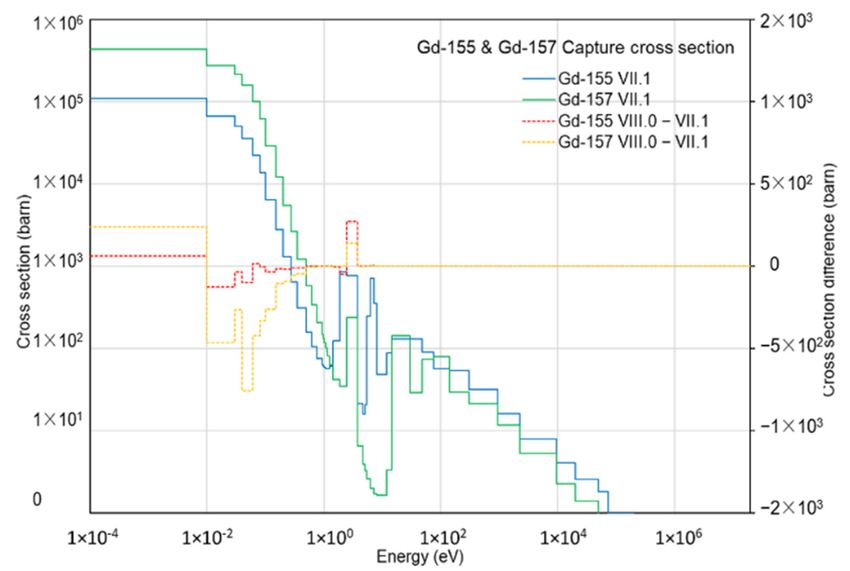
J. Nucl. Eng. 2021, 2                                                                                                               326

                        Table 8. Results of the extensive PWR assembly benchmark problems.

                                                       Reactivity Differences between ENDF/B-VIII.0 and VII.1 (pcm)
                                                        KENO with DBRC                        KENO without DBRC              Counts
                                             Average    S. Dev.    Min.      Max.     Average   S. Dev.    Min.       Max.
                                     All      32          154      −198       554       18        150      −214       545     1260
                          Total     Hot       43          158      −198       554       28        154      −214       545     1134
                                    Cold      −65         104      −196       183       −72       107      −201       239      126
                          Hot
                          235 U      2.1      178         227      −39        554       160       213      −52        545     378
                                     3.1       21         108      −135       301        7        106      −161       297     378
                         (wt %)      4.1      −71         109      −198       190       −84       119      −214       132     378
                                     0        −24         134      −198       407       −38       137      −214       372     378
                         Boron      600        40         148      −154       488       26        142      −181       469     378
                         PPM        1300      111         188      −125       554       96        179      −134       545     378
                         Density    0.7408     46         159      −197       536       32        154      −209       545     378
                                    0.7032     43         158      −198       554       27        153      −213       519     378
                         (g/cm3 )   0.6560     39         158      −198       524       25        154      −214       508     378
                           Fuel     600        30         149      −198       507       19        148      −209       520     378
                          temp.     900        44         160      −190       554       28        153      −214       545     378
                            (K)     1200       54         165      −198       550       36        159      −209       510     378
                          Cold
                          235 U      2.1      −1           75      −109       183      −10        78       −116       239      42
                                     3.1     −71           95      −161       154      −78         97      −173        59      42
                         (wt %)      4.1     −124         134      −196        38      −128       137      −201        16      42
                                      0      −118         132      −196        59      −126       138      −201        73     42
                         Boron      600      −67          94       −160       117      −74         95      −167       102     42
                         PPM        1300     −11           80      −111       183      −16         79      −124       239     42

                              Figure 3b provides the distribution of the reactivity differences between ENDF/B-
                        VIII.0 and -VII.1 for the extensive PWR assembly benchmark problems. Although ENDF/B-
                        VIII.0 underestimated reactivity for the assemblies without any absorbers, it mostly overes-
                        timated reactivity for the assemblies with various burnable absorbers, such as IFBA, Pyrex
                        and Gadolinia. ∆ρ differences of more than 500 pcm were observed in the WB2M fuel
                        assemblies with 2.1 wt % 235 U enrichment, including 128 IFBAs. Similar reactivity bias
                        trends were observed for 235 U enrichment and soluble boron concentration. The effect
                        of 10 B and Gd isotopes in increasing reactivity is discussed in Section 4. Because those
                        nuclides would burn very quickly as a burnable absorber to control reactivity, they would
                        not impact cycle length.

                        3.1.5. Seoul National University PWR Nonuniform Fuel Temperature Problems
                             Figures 4 and 5 compare temperature-dependent reactivities between ENDF/B-VII.1
                        and-VIII.0 for the Seoul National University benchmark problems with uniform and nonuni-
                        form temperature distributions, respectively, in fuel pellets with and without considering
                        epithermal upscattering. The benchmark calculations were performed using KENO with
                        the on-the-fly temperature interpolation capability. ENDF/B-VIII.0 always underestimated
                        reactivities by about 150 pcm above hot full power conditions. However, because the slopes
                        of ENDF/B-VII.1 and VIII.0 seem to be similar, fuel temperature reactivity coefficients
                        would be expected to be similar with each other.
and-VIII.0 for the Seoul National University benchmark problems with uniform and non-
uniform temperature distributions, respectively, in fuel pellets with and without consid-
ering epithermal upscattering. The benchmark calculations were performed using KENO
with the on-the-fly temperature interpolation capability. ENDF/B-VIII.0 always underes-
timated reactivities by about 150 pcm above hot full power conditions. However, because
J. Nucl. Eng. 2021, 2 327
the slopes of ENDF/B-VII.1 and VIII.0 seem to be similar, fuel temperature reactivity co-
efficients would be expected to be similar with each other.
(a) (b)
J. Nucl. Eng. 2021, 2, FOR PEER REVIEW 10
Figure 4.
4. Comparison
Comparisonofofreactivities
reactivitieswith
withuniform fuel
uniform temperature
fuel distribution:
temperature (a) epithermal
distribution: upscattering;
(a) epithermal (b) no
upscattering; (b)epi-
no
thermal upscattering.
epithermal upscattering.
(a) (b)
Figure 5. Comparison of reactivities with nonuniform fuel temperature distribution: (a) epithermal upscattering; (b) no
epithermal upscattering.
epithermal upscattering.
3.1.6.
3.1.6. PWR
PWR Mosteller
Mosteller Benchmark
Benchmark ProblemsProblems
Figure 6 provides the results
Figure 6 provides the results for for the
the Mosteller
Mosteller benchmark
benchmark problems.
problems. These
These results
results
compare
compare the Doppler temperature coefficients between ENDF/B-VII.1 and -VIII.0 for
the Doppler temperature coefficients between ENDF/B-VII.1 and -VIII.0 for
various
various 235U
235
U enrichments
enrichments withwith and without considering
and without considering epithermal
epithermal upscattering.
upscattering. The
The
benchmark calculationswere
benchmark calculations wereperformed
performed using
using SCALE/KENO
SCALE/KENO and MCNP.
and MCNP. Good
Good consis-
consistency was shown in the Doppler temperature coefficients
tency was shown in the Doppler temperature coefficients between ENDF/B-VII.1 andbetween ENDF/B-VII.1
and -VIII.0,
-VIII.0, regardless
regardless of 235of
235U enrichment. It has been shown that Doppler temperature
U enrichment. It has been shown that Doppler temperature co-
coefficients considering
efficients considering epithermalupscattering
epithermal upscatteringare
arelower
lowerthan
thanthose
thosethat
that do
do not
not consider
consider
epithermal upscattering by about 10–15%, which would ensure much
epithermal upscattering by about 10–15%, which would ensure much better agreement better agreement
with
with the
the measured plant data
measured plant data [9].
[9].various 235U enrichments with and without considering epithermal upscattering. The
benchmark calculations were performed using SCALE/KENO and MCNP. Good
consistency was shown in the Doppler temperature coefficients between ENDF/B-VII.1
and -VIII.0, regardless of 235U enrichment. It has been shown that Doppler temperature
J. Nucl. Eng. 2021, 2
coefficients considering epithermal upscattering are lower than those that do not consider
328
epithermal upscattering by about 10–15%, which would ensure much better agreement
with the measured plant data [9].
(a) (b)
Figure6.
Figure 6. Comparison
ComparisonofofDoppler
Dopplertemperature
temperaturecoefficients
coefficientswith
withvarious
various235
235U enrichments: (a) epithermal upscattering; (b)
U enrichments: (a) epithermal upscattering; (b)
noepithermal
no epithermalupscattering.
upscattering.
3.2. BWR Benchmark Results
3.2.1. BWR Depletion Benchmark Problems
The depletion trend of BWR fuels was expected to be similar to that of PWR fuels
because their compositions and operation conditions are very similar, except for soluble
boron in PWRs and void in BWRs. Therefore, single-pin investigation alone with various
void fractions may be sufficient to identify the depletion characteristics for BWR fuel.
Figure 7 provides the reactivity differences between ENDF/B-VIII.0 and -VII.1 for the BWR
depletion benchmark problems. The selected BWR fuel pins included a much larger fuel
pellet radius, which was 0.60579 cm; the PWR pellet radius was 0.4025 cm. The overall
depletion trend for the BWR pins, 1A–1F, without void was very similar to the PWR
depletion trend. The 1G and 1H cases are 50% and 70% voids, respectively; the reactivity
differences at high burnups were significantly less than the reactivity differences with
zero voids.
3.2.2. Extensive BWR Pin and Assembly Benchmark Problems
Extensive VERA BWR pin and assembly benchmark calculations were performed
using SCALE/KENO and MCNP with ENDF/B-VII.1 and -VIII.0 only, without considering
epithermal upscattering. The reactivity differences for the pin and assembly benchmark
problems are shown in Figure 8. ENDF/B-VIII.0 mostly underestimated reactivities for the
pin benchmark problems, but some reactivity overestimations were observed in the selected
cases. Many more cases with reactivity overestimations were observed for the assembly
benchmark problems, which were likely caused by the gadolinia burnable poisons.ure 7 provides the reactivity differences between ENDF/B-VIII.0 and -VII.1 for the BWR
depletion benchmark problems. The selected BWR fuel pins included a much larger fuel
pellet radius, which was 0.60579 cm; the PWR pellet radius was 0.4025 cm. The overall
depletion trend for the BWR pins, 1A–1F, without void was very similar to the PWR de-
pletion trend. The 1G and 1H cases are 50% and 70% voids, respectively; the reactivity
J. Nucl. Eng. 2021, 2 329
differences at high burnups were significantly less than the reactivity differences with
zero voids.
J. Nucl. Eng. 2021, 2, FOR PEER REVIEW 12
Figure 7. Comparison of the multiplication factors as a function of burnup for the BWR depletion
Figure 7. Comparison of the multiplication factors as a function of burnup for the BWR depletion
benchmark problems without considering epithermal upscattering.
benchmark problems without considering epithermal upscattering.
3.2.2. Extensive BWR Pin and Assembly Benchmark Problems
Extensive VERA BWR pin and assembly benchmark calculations were performed us-
ing SCALE/KENO and MCNP with ENDF/B-VII.1 and -VIII.0 only, without considering
epithermal upscattering. The reactivity differences for the pin and assembly benchmark
problems are shown in Figure 8. ENDF/B-VIII.0 mostly underestimated reactivities for the
pin benchmark problems, but some reactivity overestimations were observed in the se-
lected cases. Many more cases with reactivity overestimations were observed for the as-
sembly benchmark problems, which were likely caused by the gadolinia burnable poi-
sons.
BWRextensive
Figure8.8.BWR
Figure extensivepin
pinand
andassembly
assemblybenchmark
benchmarkresults.
results.
Table 99 provides
provides the
the benchmark
benchmark results
results categorized
categorized for 235 enrichment, void fraction,
Table for 235UUenrichment, void fraction,
burnup, control rod and fuel temperature. A trend of reactivity bias can be seen in the 235 U
burnup, control rod and fuel temperature. A trend of reactivity bias can be seen in the 235U
enrichment and void fraction. ∆ρ differences of more than 400 pcm were observed in the
enrichment and void fraction. Δρ differences of more than 400 pcm were observed in the
2.1 wt % 235 U enriched pin with 90% void, a fuel temperature of 1200 K and zero burnup,
2.1 wt % 235U enriched pin with 90% void, a fuel temperature of 1200 K and zero burnup,
as well as the mixed enriched BWR assemblies with 80% void and control rods inserted at
as well as the mixed enriched BWR assemblies with 80% void and control rods inserted at
600 and 900 K fuel temperatures.
600 and 900 K fuel temperatures.
Table 9. Results of the BWR extensive pin and assembly problems.
Reactivity Differences between ENDF/B-VIII.0 and VII.1 (pcm)
Single pins Assemblies
Average S. Dev. Min. Max. Counts Average S. Dev. Min. Max. Counts
Total All −10 157 −215 509 220 Total All 35 119 −132 474 320
Mixed 166 187 −58 474 80
2.1 79 188 −113 509 52 2.1 94 103 −24 187 80
235 U (wt %) 235U (wt %)
3.1 −20 119 −174 411 116 3.1 −23 33 −71 78 80
4.1 −78 192 −215 363 52 4.1 −96 98 −132 −15 80
0 −65 100 −211 74 112 0 0 0 0 0 0
50 −106 130 −215 34 36 40 40 40 40 40 40
Void (%) Void (%)
70 −44 91 −160 118 36 80 80 80 80 80 80J. Nucl. Eng. 2021, 2 330
Table 9. Results of the BWR extensive pin and assembly problems.
Reactivity Differences between ENDF/B-VIII.0 and VII.1 (pcm)
Single pins Assemblies
Average S. Dev. Min. Max. Counts Average S. Dev. Min. Max. Counts
Total All −10 157 −215 509 220 Total All 35 119 −132 474 320
Mixed 166 187 −58 474 80
235 2.1 79 188 −113 509 52 235 2.1 94 103 −24 187 80
U (wt %) 3.1 −20 119 −174 411 116 U (wt %) 3.1 −23 33 −71 78 80
4.1 −78 192 −215 363 52 4.1 −96 98 −132 −15 80
0 −65 100 −211 74 112 0 0 0 0 0 0
Void (%)
50 −106 130 −215 34 36
Void (%)
40 40 40 40 40 40
70 −44 91 −160 118 36 80 80 80 80 80 80
90 291 306 134 509 36 - - - - - -
0 −8 184 −215 509 156 Out 23 105 −132 239 160
Burnup 10 −59 63 −102 0 16 In 48 131 −127 474 160
20 −9 24 −52 31 16 Control rod - - - - - -
(MWD/kgU) 40 12 38 −43 74 16 - - - - - -
60 −8 39 −70 58 16 - - - - - -
293 −92 112 −204 35 28 293 −27 56 −112 122 32
Fuel temp. (K) 600 −6 155 −211 422 64 Fuel temp. (K) 600 36 123 −130 474 96
900 3 165 −215 479 64 900 44 125 −132 439 96
1200 9 166 −203 509 64 1200 47 123 −129 276 96
4. Discussion
Extensive benchmark calculations were performed using various CE MC codes, such
as SCALE/KENO, Serpent and MCNP, with the ENDF/B-VII.1 and VIII.0 libraries to
identify the neutronic characteristics of ENDF/B-VIII.0 compared to those of ENDF/B-
VII.1 for LWR analysis. The underlined neutronic characteristics of ENDF/B-VIII.0 are
summarized below.
235 U enrichment reactivity bias. Figure 3 shows that the 235 U and 16 O reactivity
differences at zero burnup were −180 and −170 pcm, respectively, but the 238 U reactivity
difference was +260 pcm. Because the 10 B reactivity difference was positive, effective
reactivity differences were canceled out between them, so no significant excess reactivity
differences were observed. Figure 9a provides the energy- and reaction-dependent reac-
tivity differences for 16 O, 235 U and 238 U, which were obtained by converting the reaction
rate differences into the reactivity differences with the same neutron spectra. Because
the excess reactivity of 235 U absorption and production was negative, the difference of
absorption was larger than that of production. Therefore, as 235 U enrichment increased,
the excess reactivity differences of both 235 U and 238 U was more negative, resulting in
reactivity underestimation in ENDF/B-VIII.0.
Positive reactivity of Gd isotopes. Figure 10a compares the flux-averaged cross
sections of 155 Gd and 157 Gd in a single gadolinia rod between ENDF/B-VII.1 and -VIII.0 in
the 51-group structure. Even though there was no change in the pointwise cross sections
of 155 Gd and 157 Gd, there were some differences in the flux-averaged MG cross sections
due to different neutron spectra. The effective ENDF/B-VIII.0 MG cross sections at very
thermal energy were smaller than those of ENDF/B-VII.1, which would result in positive
reactivity, as observed in the PWR progression cases 2O and 2P.ences were observed. Figure 9a provides the energy- and reaction-dependent reactivity
differences for 16O, 235U and 238U, which were obtained by converting the reaction rate dif-
ferences into the reactivity differences with the same neutron spectra. Because the excess
reactivity of 235U absorption and production was negative, the difference of absorption
J. Nucl. Eng. 2021, 2
was larger than that of production. Therefore, as 235U enrichment increased, the excess 331
reactivity differences of both 235U and 238U was more negative, resulting in reactivity un-
derestimation in ENDF/B-VIII.0.
(a) (b)
J. Nucl.Figure
Eng. 2021,
Figure 2, FOR PEER REVIEWgroupwise
9.9. Reaction-dependent
Reaction-dependent groupwisereactivity
reactivitydifferences
differencescaused
causedby
bythe
thereaction
reactionrate
ratedifferences
differencesfor
forthe
thetypical
typicalPWR
PWR 14
fuelpin:
fuel pin: (a)
(a) zero
zeroburnup;
burnup;(b)
(b)60
60MWD/kgU
MWD/kgU burnup.
burnup.
Positive reactivity of Gd isotopes. Figure 10a compares the flux-averaged cross sec-
tions of 155Gd and 157Gd in a single gadolinia rod between ENDF/B-VII.1 and -VIII.0 in the
51-group structure. Even though there was no change in the pointwise cross sections of
155Gd and 157Gd, there were some differences in the flux-averaged MG cross sections due
to different neutron spectra. The effective ENDF/B-VIII.0 MG cross sections at very ther-
mal energy were smaller than those of ENDF/B-VII.1, which would result in positive re-
activity, as observed in the PWR progression cases 2O and 2P.
(a) (b)
Figure 10. Comparison
Figure 10. Comparison of the flux-weighted
of the flux-weighted capture
capture cross
cross sections
sections between
between ENDF/B-VII.1
ENDF/B-VII.1 and
and -VIII.0
-VIII.0 in
in the 51-group
the 51-group
structure: (a) 155
155 Gd and 157
157Gd; (b) 1010
B.
structure: (a) Gd and Gd; (b) B.
Positive
Positive reactivity
reactivity of
of 10B.B.Figure
10
Figure10b10bcompares
compares thethe
10B10absorption cross sections, in-
B absorption cross sections,
cluding
including (n, γ) and (n, α) reactions, between ENDF/B-VII.1and
(n, γ) and (n, α) reactions, between ENDF/B-VII.1 and-VIII.0
-VIII.0 in
in the 51-group
the 51-group
structure.
structure. TheThe cross
crosssections
sectionswere
wereflux-weighted
flux-weighted using
using typical
typical PWR PWR pointwise
pointwise spectra.
spectra. The
The 10B capture cross sections of ENDF/B-VIII.0 were almost identical to those of ENDF/B-
10 B capture cross sections of ENDF/B-VIII.0 were almost identical to those of ENDF/B-VII.1
VII.1
at all at all energy
energy ranges, ranges,
whichwhich
may notmay not impact
impact eigenvalues.
eigenvalues. However,
However, the ENDF/B-
the ENDF/B-VIII.0
10 B would
VIII.0 10B would result in less reactivity worth, which is common for soluble boron, IFBA,
result in less reactivity worth, which is common for soluble boron, IFBA, Pyrex
Pyrex
and B4and B4C control
C control rods—quite
rods—quite differentdifferent
from the from thecross-section
positive positive cross-section
difference. difference.
Figure 11a
Figure
compares 11athe
compares the ENDF/B-VII.1
ENDF/B-VII.1 and VIII.0
and VIII.0 neutron neutron
spectra spectra
for a single pinfor
witha single pin with
IFBA. ENDF/B-
IFBA. ENDF/B-VIII.0 underestimated
VIII.0 underestimated thermal and verythermal and very
fast neutron fluxesfast neutron
and fluxes andepithermal
it overestimated it overes-
timated
flux. Theepithermal
differenceflux.
wouldTheresult
difference would result
in significant in significant
reactivity for 235 U, 238
increasesreactivity U and 10
increases for
B,
asU,
235 238U and
shown 10B, as11b.
in Figure shown in Figure 11b.VII.1 at all energy ranges, which may not impact eigenvalues. However, the ENDF/B-
VIII.0 10B would result in less reactivity worth, which is common for soluble boron, IFBA,
Pyrex and B4C control rods—quite different from the positive cross-section difference.
Figure 11a compares the ENDF/B-VII.1 and VIII.0 neutron spectra for a single pin with
J. Nucl. Eng. 2021, 2
IFBA. ENDF/B-VIII.0 underestimated thermal and very fast neutron fluxes and it overes- 332
timated epithermal flux. The difference would result in significant reactivity increases for
235U, 238U and 10B, as shown in Figure 11b.
(a) (b)
Figure11.
Figure 11.Comparison
Comparisonofofthetheflux
fluxand
andreactivity
reactivityfor
forIFBA
IFBAbetween
betweenENDF/B-VII.1
ENDF/B-VII.1and
and-VIII.0
-VIII.0ininthe
the51-group
51-groupstructure:
structure:(a)
(a)
neutron spectra; (b) reactivity differences.
neutron spectra; (b) reactivity differences.
Depletionhistory
Depletion historyeffect
effect[11].
[11].This
Thiseffect
effectisisperhaps
perhapsthethemost
mostchallenging
challengingissue
issueinin
ENDF/B-VIII.0. When
ENDF/B-VIII.0. When performing
performingstatic
staticand
andsnapshot
snapshotburnup
burnupcalculations,
calculations,nonosignificant
significant
reactivitydifferences
reactivity differenceswere
wereobserved.
observed.However,
However,when whenconsidering
consideringdepletion
depletionhistory,
history,there
there
wasaasignificant
was significantreactivity
reactivityunderestimation
underestimationininENDF/B-VIII.0
ENDF/B-VIII.0 that
thatmay
maylimit
limitits
itsuse
useinin
LWRanalysis.
LWR analysis.The
Themost
mostinfluential
influentialnuclides included239
nuclidesincluded Pu,235
239Pu, 16O
235U, 16 Oand 238
and238 U.
U.
Positive reactivity of voids. There was a relatively large trend for the BWR single
pins with various voids. However, there was almost no trend for the BWR fuel assemblies,
which may have been caused by error cancelation. Even though there was a large positive
reactivity at 90% void, it may not impact BWR analysis.
Epithermal upscattering. Theoretically, epithermal upscattering is much more phys-
ical than no epithermal upscattering and it would introduce better agreement with the
measured Doppler temperature coefficient. However, epithermal upscattering has not been
considered properly in LWR analysis because of concerns about its reactivity underesti-
mation. The ENDF/B-VII.1 PWR hot zero power results without considering epithermal
upscattering were very consistent with the measured plant data. Considering epithermal
upscattering may cause some reactivity differences in the measured-to-calculated compari-
son. However, the investigation in this study indicates that epithermal upscattering may
not cause any issues in fuel cycle length, as shown in Figure 1b.
Moderator and fuel temperature coefficients. Because no sensitivity to the moderator
density as provided in Tables 7 and 8 was observed, there was no impact on moderator
temperature coefficients in ENDF/B-VIII.0. As shown in Figures 5 and 6, there was also no
sensitivity to fuel temperature.
Fission product nuclides. ENDF/B-VIII.0 cross-section differences in fission product
yield nuclides had almost no impact on reactivity.
Decay and fission product yield data [11]. The ENDF/B-VIII.0 decay and fission
product yield data would not impact the multiplication factors. It is noted that the fission
product yield data were adopted from ENDF/B-VII.1, which came from England and
Ryder’s seminal work from around 1990 with some modest updates for Plutonium fast
neutron fission product yield data for ENDF/B-VII.1 [10].
Thermal scattering data for 1 H in H2 O. Figure 12 compares neutron spectra and
group-wise reactivities for a typical PWR fuel pin between the ENDF/B-VIII.0 and VII.1
1 H S(α,β) thermal scattering data in which the ENDF/B-VIII.0 data were used for other
nuclides. Eigenvalue was underestimated with the ENDF/B-VII.1 1 H S(α,β) data by about
60 pcm. There was some change in thermal neutron spectrum in fuel as shown in Figure 12a
which would result in reactivity differences in the 235 U absorption and fission reactions.tron fission product yield data for ENDF/B-VII.1 [10].
Thermal scattering data for 1H in H2O. Figure 12 compares neutron spectra and
group-wise reactivities for a typical PWR fuel pin between the ENDF/B-VIII.0 and VII.1
1H S(α,β) thermal scattering data in which the ENDF/B-VIII.0 data were used for other
J. Nucl. Eng. 2021, 2
nuclides. Eigenvalue was underestimated with the ENDF/B-VII.1 1H S(α,β) data by about 333
60 pcm. There was some change in thermal neutron spectrum in fuel as shown in Figure
12a which would result in reactivity differences in the 235U absorption and fission reac-
tions. Figure 12b shows error cancellations between the absorption and fission reactions,
Figure 12bwas
but there shows errorpositive
overall cancellations between
reactivity withthe
theabsorption and fission
ENDF/B-VIII.0 reactions,
1H S(α,β) thermalbutscatter-
there
was overall positive reactivity with the ENDF/B-VIII.0 1 H S(α,β) thermal scattering data.
ing data.
(a) (b)
Figure12.
Figure 12.Comparison
Comparisonofofthe
theflux
fluxand
and reactivity
reactivity between
between thethe ENDF/B-VIII.0
ENDF/B-VIII.0 andand VII.1
VII.1 1 H1H S (a,b)
S (a,b) thermal
thermal scattering
scattering datadata
in
in the 51-group structure: (a) neutron spectra; (b) reactivity differences.
the 51-group structure: (a) neutron spectra; (b) reactivity differences.
5. Conclusions
Neutronic characteristics of ENDF/B-VIII.0 neutron cross-section data were investi-
gated through a comparison with ENDF/B-VII.1. This type of investigation may need to
be completed during evaluation of new ENDF/B data and there should be a collaborative
iteration between the nuclear data evaluators and reactor physicists. The authors propose
that the most important issues to resolve for ENDF/B-VIII.1 are as follows:
• The depletion history effect should be eliminated, where ENDF/B-VIII.0 data have
shown a significant increase in burnup-dependent reactivity bias compared to ENDF/B-
VII.1. Six nuclides were responsible for a bias that essentially starts at 0 pcm for fresh
fuel (due to cancellation of errors among the six nuclides) and decreases linearly to
-800 pcm ∆ρ at a burnup of 60 GWd/MTU. This underprediction of reactivity with
ENDF/B-VIII.0 is noticeable in comparisons with power plant data and essentially
prevents ENDF/B-VIII.0 from being endorsed for LWR simulations.
• The epithermal scattering issue should be revisited, which exists in both ENDF/B-VII.1
as well as VIII.0. A higher-fidelity physics model is not used in practice because it
introduces additional bias when comparing with measured data. Although, due to
compensating effects, such an occurrence is not a surprise, this particular effect should
be understood better. It may be that a new high-precision measurement is required to
prove unequivocally the value of the higher-fidelity epithermal scattering treatment,
at which point it could be used as the default in simulations and we can turn our
attention to reducing the compensating errors.
Even though new ENDF/B data are developed through validation with the experiment
data, data availability is very limited, so nuclear data issues in reactor physics analysis may
not be effectively addressed in finalizing new ENDF/B libraries.
Many measured data from power plants across various advanced reactor systems
exist. However, those measured data cannot be effectively used in evaluating ENDF/B
libraries. The authors suggest that extensive benchmark calculations be performed to
evaluate expected behavior and impacts for new ENDF/B versions under development
through comparisons between other versions of ENDF/B libraries. The authors also suggest
developing a systematic strategy and procedure to ensure that power plant measured data
are engaged in nuclear data evaluation. This would shorten the development period for
new ENDF/B versions and minimize potential issues in new ENDF/B releases.J. Nucl. Eng. 2021, 2 334
Author Contributions: Conceptualization, K.-S.K.; formal analysis, K.-S.K.; investigation, K.-S.K.;
writing—original draft preparation, K.-S.K.; writing—review and editing, W.A.W.; supervision,
W.A.W.; project administration, W.A.W.; funding acquisition, W.A.W. All authors have read and
agreed to the published version of the manuscript.
Funding: This research was funded by the US Nuclear Regulatory Commission Office of Research
with the agreement number 31310019N0008 for the SCALE code development, assessment and
maintenance.
Institutional Review Board Statement: Not applicable.
Informed Consent Statement: Not applicable.
Data Availability Statement: The data presented in this study are available on request from the
corresponding author.
Acknowledgments: This research was supported by the US Nuclear Regulatory Commission Office
of Research and the US Department of Energy NEAMS project.
Conflicts of Interest: The authors declare no conflict of interest.
References
1. Turner, J.A.; Clarno, K.; Sieger, M.; Bartlett, R.; Collins, B.; Pawlowski, R.; Schmidt, R.; Summers, R. The Virtual Environment for
Reactor Applications (VERA): Design and Architecture. J. Comput. Phys. 2016, 326, 544. [CrossRef]
2. Consortium for Advanced Simulation of Light Water Reactors. Available online: http://www.casl.gov (accessed on 1 July 2021).
3. NEAMS. NEET—Nuclear Energy Advanced Modeling & Simulation. Available online: https://www.energy.gov/ne/nuclear-
reactor-technologies/advanced-modeling-simulation (accessed on 1 July 2021).
4. Chadwick, M.; Herman, M.; Obložinský, P.; Dunn, M.; Danon, Y.; Kahler, A.; Smith, D.; Pritychenko, B.; Arbanas, G.; Arcilla, R.;
et al. ENDF/B-VII.1: Nuclear Data for Science and Technology: Cross Sections, Covariances, Fission Product Yields and Decay
Data. Nucl. Data Sheet 2018, 112, 2887–2996.
5. Mangham, G.; Godfrey, A.; Eller, J. VERA Benchmarking of PWR Startup and Steady State Operation. In Proceedings of the CASL
Technical Symposium, ANS 2020 Winter Meeting, Chicago, IL, USA, 15–19 November 2020.
6. Kim, K.S.; Williams, M.L.; Wiarda, D.; Clarno, K.T. Development of the Multigroup Cross Section Library for the CASL Neutronics
Simulator MPACT: Method and Procedure. Ann. Nucl. Energy 2019, 133, 46–58. [CrossRef]
7. Kim, K.; Gentry, C.; Godfrey, A.; Liu, Y.; Palmtag, S. Development of the Multigroup Cross Section Library for the CASL
Neutronics Simulator MPACT: Verification. Ann. Nucl. Energy 2019, 132, 1–23. [CrossRef]
8. Kochunas, B.; Collins, B.; Stimpson, S.; Salko, R.; Jabaay, D.; Graham, A.; Liu, Y.; Kim, K.S.; Wieselquist, W.; Godfrey, A.; et al.
VERA Core Simulator Methodology for Pressurized Water Reactor Cycle Depletion. Nucl. Sci. Eng. 2017, 185, 217–231. [CrossRef]
9. Lee, D.; Smith, K.; Rhodes, J. The impact of 238 U resonance elastic scattering approximations on thermal reactor Doppler reactivity.
Ann. Nucl. Engr. 2009, 36, 274–280. [CrossRef]
10. Brown, D.A.; Chadwick, M.B.; Capote, R.; Kahler, A.C.; Trkov, A.; Herman, M.W.; Sonzognia, A.A.; Danond, Y.; Carlsone, A.D.;
Dunn, M.; et al. ENDF/B-VIII.0: The 8th Major Release of the Nuclear Reaction Data Library with CIELO-project Cross Sections.
New Standards and Thermal Scattering Data. Nucl. Data Sheet 2018, 148, 1–142.
11. Kim, K.S.; Wieselquist, W.A. Reactivity Underestimation of ENDF/B-VIII.0 Compared with ENDF/B-VII.1 for the Pressurized
Water Reactor Depletion Analysis. Trans. Am. Nucl. Soc. 2021, 124, 520–523.
12. Park, H.J.; Kang, H.; Lee, H.C.; Cho, J.Y. Comparison of ENDF/B-VIII.0 and ENDF/B-VII.1 in criticality, depletion benchmark,
and uncertainty analyses by McCARD. Ann. Nucl. Energy 2019, 131, 443. [CrossRef]
13. Bostelmann, F.; Holcomb, A.M.; Marshall, W.B.; Sobes, V.; Rearden, B.T. Impact of the ENDF/B-VIII.0 Library on Advanced
Reactor Simulations. Trans. Am. Nucl. Soc. 2019, 121, 1369–1372.
14. Wieselquist, W.A.; Lefebvre, R.A.; Jessee, M.A. (Eds.) SCALE Code System; ORNL/TM-2005/39, Version 6.2.4; Oak Ridge National
Laboratory: Oak Ridge, TN, USA, 2020.
15. Leppänen, J.; Pusa, M.; Viitanen, T.; Valtavirta, V.; Kaltiaisenaho, T. The Serpent Monte Carlo Code: Status, Development and
Applications in 2013. Ann. Nucl. Energy 2015, 82, 142–150. [CrossRef]
16. Goorley, T.; James, M.; Booth, T.; Brown, F.; Bull, J.; Cox, L.J.; Durkee, J.; Elson, J.; Fensin, M.; Forster, R.A.; et al. Initial MCNP6
Release Overview. Nucl. Tech. 2012, 180, 298–315. [CrossRef]
17. Godfrey, A. VERA Core Physics Benchmark Progression Problem Specifications; CASL Report, CASL-U-2012-0131-004; Oak Ridge
National Laboratory: Oak Ridge, TN, USA, 2014.
18. Kim, K.S. Specifications for the VERA Depletion Benchmark Suite; CASL-X-2015-1014-000; Oak Ridge National Laboratory: Oak
Ridge, TN, USA, 2015. Available online: https://info.ornl.gov/sites/publications/files/Pub61302.pdf (accessed on 1 July 2021).
19. Palmtag, S. MPACT Library Verification by Comparison of Pincell Calculations to Monte Carlo Results; CASL Report, CASL-U-2016-
0281-002; Oak Ridge National Lab. (ORNL): Oak Ridge, TN, USA, 2017.You can also read