Nomura ASEAN Virtual Conference 2022 - March 2022 - Digital Core REIT
←
→
Page content transcription
If your browser does not render page correctly, please read the page content below

Nomura ASEAN Virtual Conference 2022
March 2022

Disclaimer
This presentation is for information purposes only and does not constitute or form part of an offer, invitation or solicitation of any offer to purchase or subscribe for any securities of Digital Core REIT in Singapore or any other jurisdiction nor should it or any part of it form the
basis of, or be relied upon in connection with, any contract or commitment whatsoever. The value of units in Digital Core REIT (“Units”) and the income derived from them may fall as well as rise. The Units are not obligations of, deposits in, or guaranteed by Digital Core REIT
Management Pte. Ltd. (as manager of Digital Core REIT (the “Manager”)), Perpetual (Asia) Limited (as trustee of Digital Core REIT) or any of their respective affiliates. The past performance of Digital Core REIT is not necessarily indicative of the future performance of Digital
Core REIT.

This presentation may contain forward-looking statements that involve risks and uncertainties. Actual future performance, outcomes and results may differ materially from those expressed in forward-looking statements as a result of a number of risks, uncertainties and
assumptions. These forward-looking statements speak only as at the date of this presentation. No assurance can be given that future events will occur, that projections will be achieved, or that assumptions are correct. Representative examples of these factors include (without
limitation) general industry and economic conditions, interest rate trends, cost of capital and capital availability, competition from similar developments, shifts in expected levels of property rental revenue, changes in operating expenses, property expenses, governmental and
public policy changes and the continued availability of financing in the amounts and the terms necessary to support future business.

Investors are cautioned not to place undue reliance on these forward-looking statements, which are based on the current view of the Manager on future events.

Holders of Units (“Unitholders”) have no right to request that the Manager redeem or purchase their Units while the Units are listed. It is intended that Unitholders may only deal in their Units through trading on Singapore Exchange Securities Trading Limited (the “SGX-ST”).
Listing of the Units on the SGX-ST does not guarantee a liquid market for the Units.

 BofA Securities (Merrill Lynch (Singapore) Pte. Ltd.), Citigroup Global Markets Singapore Pte. Ltd. and DBS Bank Ltd were the joint issue managers, global coordinators, bookrunners and underwriters for the initial public offering of units in Digital Core REIT.

                                                                                                                                                                                                                                                                 MARCH 2022 | 2
TODAY’S
PRESENTERS

          John Stewart                      Dan Tith

                  Chief Executive Officer              Chief Financial Officer

                                                                                 MARCH
                                                                                    MARCH
                                                                                       2022 | 3
TABLE OF
CONTENTS

 1   Digital Realty
     Overview

 2   Digital Core REIT
     Overview

 3   Key Investment
     Highlights

 4   Financial
     Overview

 5   Appendix

                         MARCH 2022 | 4
1   Digital Realty
    Overview

                     MARCH 2022 | 5
Leading GLOBAL data centre provider dedicated to the full customer spectrum from ENTERPRISE colocation to HYPERSCALE

                                                    4,000+                                                                                  290+                                                                        170,000
                                                   GLOBAL CUSTOMERS                                                                      DATA CENTRES(1)                                                                    CROSS CONNECTS

 INTERCONNECTION                                                                                          COLOCATION                                                                           SCALE                                                                       HYPERSCALE

                                          EQUITY & ENTERPRISE VALUE                                                     TOP 10 PUBLICLY TRADED U.S. REIT                                                          INVESTMENT GRADE RATINGS(4)

                                          $44 bn                         EQUITY MARKET
                                                                         CAPITALIZATION                                   6th                        LARGEST PUBLICLY
                                                                                                                                                     TRADED U.S. REIT(3)
                                                                                                                                                                                                                                                           BBB
                                                                                                                                                                                                                                                           Baa2
                                          $58 bn                         ENTERPRISE
                                                                         VALUE(2)                                       2016                         ADDED TO THE
                                                                                                                                                     S&P 500 INDEX
                                                                                                                                                                                                                                                           BBB

Source: Company data and Bloomberg as of June 30, 2021 unless otherwise indicated.                                       4)   These credit ratings may not reflect the potential impact of risks relating to the structure or trading of Digital Realty’s securities and
Note: Figures include Digital Core REIT’s initial IPO portfolio.                                                              are provided solely for informational purposes. Credit ratings are not recommendations to buy, sell or hold any security, and may be
1) Includes 44 data centres held as investments in unconsolidated joint ventures.                                             revised or withdrawn at any time by the issuing organization in its sole discretion. Digital Realty does not undertake any obligation to
2) Total enterprise value calculated as the market value of common equity, plus liquidation value of preferred equity         maintain the ratings or to advise of any change in ratings. Each agency’s rating should be evaluated independently of any other
                                                                                                                              agency’s rating. An explanation of the significance of the ratings may be obtained from each of the rating agencies.
    and total debt at balance sheet carrying value.
3) U.S. REITs within the MSCI U.S. REIT Index (RMZ). Ranked by market cap as of August 11, 2021.
                                                                                                                                                                                                                                                                               MARCH 2022 | 6
Leading Global Data Centre Platform
Largest global owner and operator of data centres with over 290 facilities positioned in 47 metros across six continents
Geographically Majority
Diversified(1) Wholly-Owned(2)
North America EMEA Consolidated Uncons. JVs
North America APAC Latin America
EMEA
8% 5% 11%
140 18
DATA CENTRES METROS 109 17
DATA CENTRES METROS
Northern Virginia Seattle 28%
Chicago Portland London Brussels
New York Toronto, Canada Frankfurt Stockholm 61%
Silicon Valley Boston Amsterdam Copenhagen
Dallas Houston Paris Dusseldorf 89%
Phoenix Miami Vienna Athens
San Francisco Austin Marseille Zagreb
Atlanta Minneapolis Dublin Nairobi
Madrid Mombasa
Los Angeles Charlotte
Zurich APAC Primarily Owned Primarily Unencumbered
Real Estate(1) Real Estate(1)
68 MW 149 MW 19 7
Under Development Under Development DATA CENTRES METROS Owned Leased Unencumbered Encumbered
Singapore Osaka
14% 5%
Latin America Sydney
Melbourne
Seoul
Hong Kong
Tokyo
23 5
DATA CENTRES METROS 71 MW
Under Development
Sao Paulo Santiago 95%
Rio De Janeiro Queretaro 86%
Fortaleza
Source: Company data as of June 30, 2021 unless otherwise indicated.
Note: Represents consolidated portfolio and investments in unconsolidated joint ventures at ownership percentages. Figures include Digital Core REIT’s initial IPO portfolio.
1) Calculated based on total operating revenue as of June 30, 2021. MARCH 2022 | 7
2) Calculated based on annualized base rent as of June 30, 2021. Unconsolidated joint ventures includes both managed and non-managed joint ventures.
Core Data Centre Mandate
       Digital Realty has sold outright more than $1 billion of non-core assets to Singapore REITs, in addition to establishing a $1 billion core joint venture

  Non-Core Asset Sale and Core Joint Venture                                    Non-Core Asset Sale

                                                                                                                                          Core Strategy for
                                                                                                                                          Digital Core REIT

        Sold US$1.4bn of U.S. data centre assets to                   Sold US$678mm of European data centre assets to
          Mapletree and Mapletree Industrial Trust JV                             Ascendas REIT                                   Markets characterized by robust and
                                                                                                                                  diverse long-term customer demand

                                                                                                                                  High-quality assets with strategic
                                                                                                                                  locations generating long-term pricing
                                                                                                                                  power and well-maintained physical
                                                                                                                                  infrastructure

                                                                                                                                  Integration of these assets into
                                                                                                                                  Digital Realty’s global platform,
                                                                                                                                  offering consistency of deployment and
                                                                                                                                  operations, as well as connectivity

                                                                                                                                  Serving large and growing, strategically
                                                                                                                                  important customers

                                                                                                                                                         MARCH 2022 | 8
Strategic Rationale
Digital Core REIT will be a highly differentiated global data centre S-REIT with a leading global Sponsor committed to its growth
Rationale for Digital Core REIT Investors Rationale for Digital Realty Investors
Digital transformation driving robust demand Perpetual capital source
High-quality, mission-critical portfolio Well-suited for stabilized core data centres
Industry-leading pipeline for growth Leverages Digital Realty global capabilities
Best-in-class global data centre sponsorship Maintains requisite operational control
Balance sheet and initial scale positioned for substantial growth Preserves seamless customer experience
Superior total return profile Partner vehicle for incremental M&A
MARCH 2022 | 9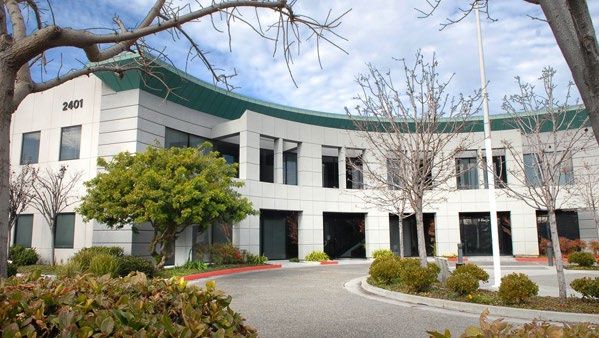
2   Digital Core REIT
    Overview

                        MARCH 2022 | 10
Create Long-term, Sustainable Value for All Stakeholders
FOCUS & through a Diversified and Growing Portfolio of Mission-Critical
MISSION Data Centres Located in Key Global Markets
STRATEGY &
VISION
Industry-Leading Sponsor in Digital Realty, the
DIFFERENTIATION
Largest Owner, Operator, Developer, and
& EXPERTISE
Acquirer(1) of Data Centres Globally
Become the Leading S-REIT Supporting
the Digital Economy with a Global
Portfolio of Core Data Centre Assets
1) Based on the % of freehold assets (owner), number of data centre assets (operator), development capital expenditure (developer) and enterprise value of acquisitions (acquirer); please refer to page 24 for detailed information.
MARCH 2022 | 11Dedicated Core Data Centre S-REIT with industry-leading pipeline and operating expertise sponsored by Digital Realty
$1.4 Bn 10 1.2 mm
APPRAISED VALUE (US$)(1) DATA CENTRES NET RENTABLE SQUARE FEET
SILICON VALLEY LOS ANGELES NORTHERN VIRGINIA TORONTO
6.2 YRS 100% 100%
WEIGHTED AVG. LEASE EXPIRY(2) FREEHOLD OCCUPANCY
Source: Company data as of June 30, 2021.
1) Based on valuation by Cushman & Wakefield of a 100% ownership interest as of August 1, 2021.
2) Based on Base Rental Income as of June 30, 2021.
MARCH 2022 | 12Portfolio Overview
Initial IPO portfolio of 10 high-quality, mission-critical data centres located in key metros across the United States and Canada
1500 Space Park 3011 Lafayette
Top-Tier Markets Tethered to Core Digital Transformation Drivers Silicon Valley Silicon Valley
Silicon Valley Toronto
2401 Walsh 2403 Walsh
Silicon Valley Silicon Valley
4 $479mm 1 $203mm
DATA CENTRES VALUE(1) (US$) DATA CENTRE VALUE(1) (US$)
414k 100% 104k 100% 200 North Nash 3015 Winona
SQUARE FEET OCCUPANCY SQUARE FEET OCCUPANCY(3) Los Angeles Los Angeles
INITIAL IPO PORTFOLIO
Los Angeles Northern Virginia
8217 Linton Hall 43831 Devin Shafron
Northern Virginia Northern Virginia
Metro Diversification(2)
2 $129mm Northern Virginia
7% 3 $629mm
DATA CENTRES VALUE(1) (US$) 38% DATA CENTRES VALUE(1) (US$)
Silicon Valley 19% 44520 Hastings 371 Gough
Northern Virginia Toronto
197k 100% Toronto 494k 100%
SQUARE FEET OCCUPANCY SQUARE FEET OCCUPANCY
Los Angeles
35%
Source: Company data as of June 30, 2021.
1) Based on valuation by Cushman & Wakefield of a 100% ownership interest as of August 1, 2021.
2) Based on Base Rental Income for the month of June 2021.
3) Excludes 11,500 square feet of empty shell space not feasible to build out as data centre capacity.
MARCH 2022 | 13High-Quality Customer Base
Serving high-quality and growing customer base – among the top customers operational across numerous Digital Realty global locations
CUSTOMER BASE TOP 20 CUSTOMERS(2)
% of Base Rental Income as of June 30, 2021 Based on Annual Recurring Revenue as of June 30, 2021
Trade Sector Credit Quality(1) Customer Rank Locations Customer Rank Locations
Fortune
Fortune 50 50 Hyperscale 1 Fortune 50 Software Company 55 11 17
Software Company
35.9% Cloud Service AAA / Aaa
Provider
2 42 12 21
Global
GlobalColocation
Colocationand
and Colocation /
Interconnection
23.9% IT Solutions B- / B3 3 33 13 Fortune 25 Tech Company 41
Interconnection Provider
Provider
Provider
Investment 4 28 14 129
Social Media Platform 18.5% Social Media Grade
Equivalent 5 Global Cloud Provider 51 15 28
Global Technology Hyperscale
11.7% Cloud Service A- / A2 6 23 16 99
Solutions Provider
Provider
Fortune 25
7 25 17 74
Colocation / Investment Grade-Rated Company
IT Service Provider 7.4% IT Solutions Not Rated
8 8 18 16
Provider
Hyperscale 9 Fortune 500 SaaS Provider 15 19 Global Telecom Network Provider 30
Global Cloud Provider 2.5% Cloud Service AA / A1
Provider 120
10 Social Content Platform 10 20
Source: Company data.
1) As of September 28, 2021. Represents credit ratings of customer or parent company by Standard & Poor’s Rating Services and Moody’s Investors Service Inc., respectively.
2) Represents consolidated portfolio plus Digital Realty’s managed portfolio of unconsolidated joint ventures based on Digital Realty’s ownership percentage. MARCH 2022 | 14
Digital Realty’s direct customers may be the entities named in this table above or their subsidiaries or affiliates.Cash Flow Strength & Stability
Stable and resilient portfolio with long weighted average lease expiry and high customer retention – organic growth underpinned by built-in rental escalations
Negligible Near-Term Lease Expirations Stable Occupancy, Sticky Customer Base
% OF LEASE EXPIRATIONS BY BASE RENTAL INCOME(1)
Year % of Lease Expirations
2021 –
2022 0.1%
99% 96%
2023 0.1%
2024 14.1%
2025 43.3%
2026 11.1% Average Historical Occupancy Average Historical Retention
2027 – Since 2012(2) Since 2012(2)
2028 –
2029 7.4% Long-term track record of stabilized portfolio occupancy
2030 – with minimal customer churn
>2030 23.9%
6.2 YRS c.100% c.2% c.85% $15 – $30 mm $15 – $20 mm
Approximate Cost of a New Approximate Cost to Migrate a
Weighted Average Of the Contracted Leases Annual Cash Rental Rate Triple Net Leases(2) 1.125 MW Data Centre Deployment(3) 1 MW Data Centre to a New Facility(3)
Lease Expiry(1) with Built-in Escalation Escalation
Clause(1)
Source: Company data as of June 30, 2021.
1) Based on Base Rental Income for the month of June 2021.
2) Based on net rentable square feet as of June 30, 2021.
3) Estimates provided by Align Communications – March 2019.
MARCH 2022 | 153 Key Investment
Highlights
MARCH 2022 | 16Key Investment Highlights
Digital Transformation
1 Driving Robust Demand
High-Quality,
2 Mission-Critical Portfolio
Dedicated Core Data Centre S-REIT with
industry-leading pipeline and operating
expertise sponsored by Digital Realty Industry-Leading
3 Pipeline for Growth
Best-in-Class
4 Global Data Centre Sponsorship
Balance Sheet and Initial Scale
5 Positioned for Substantial Growth
6 Superior Total Return Profile
MARCH 2022 | 171 Digital Economy & Transformation Driving Demand
Growing and emerging demand drivers that have further accelerated over the past year are driving the need for digital infrastructure globally
Digital Economy & Transformation Accelerated Digital Trends Digital Infrastructure Demand
Solid Demand Drivers Which Digitization of Customer Interactions North America Total Commissioned Power
Continue to Grow Avg. Share of Customer Interactions that are Digital (%) MW
11,807
10,473
Cloud Enterprise 9,128
Computing Modernization
36% 58% 6,780
7,854
15%
2019 2020
Precrisis COVID-19 Crisis
CAGR
Streaming & E-Payment and
3yrs
2020 - 2024
Social Media E-Commerce Rate of Digital Customer Interactions has
Accelerated from Prior Forecasts by (1) 2020 2021 2022 2023 2024
Emerging Trends with Digitization of Products & Services North America Hyperscale Commissioned Power
Enormous Potential Avg. Share of Products and/or Services that are MW
Partially or Fully Digitized (%)
Internet of Artificial
Things Intelligence
35% 55% 2,914
3,516
4,004
23%
2019 2020 2,261
Precrisis COVID-19 Crisis 1,732 CAGR
5G Edge
7yrs
2020 - 2024
Technology Computing
Rate of Products & Services that are Digitized
has Accelerated from Prior Forecasts by (1)
2020 2021 2022 2023 2024
Actual Projected
Source: Company data. McKinsey & Company report. IMR.
1) Years ahead of the average rate of adoption from 2017 to 2019. Based on the average percentage of adoption in each survey, McKinsey & Company calculated a trendline to represent the average rate of adoption in 2017, 2018, and just before the crisis,
which respondents were asked about in the 2020 survey. The acceleration time frame was calculated from the amount of time it would have taken to reach the current level of digital adoption respondents report if the precrisis pace of change had continued.
MARCH 2022 | 182 High-Quality, Mission-Critical Portfolio
The only 100% freehold data centre portfolio with core assets across the top markets, fully integrated into Digital Realty's global data centre platform, PlatformDIGITAL®
High-Quality S-REIT Portfolio Critical to Our Customers’ Operations Located in Strategic Data Centre Markets
Top 10 North America
Fortune 50 Data Centre Markets
Software Company Global Colocation Multi-Tenant Commissioned Power in MW(4)
Solutions Provider
35.9% 2
Northern Largest Data Centre
1,660 Market in the
of Base Rent(3) Locations
23.9% 5 Virginia World
69% 70%
Certified for
of Base Rent(3) Locations Northern
California
531 Global Hub for
Technological Innovation
Leased to
Hyperscalers Sustainability(1)
Chicago 446
NNN 85% Triple Net Lease
Structure(2) Social Media
Dallas /
Fort Worth
423
Global Tech
Platform
100%
Solutions Provider Phoenix 323
18.5% 1 11.7% 1
Freehold Land of Base Rent(3) Location Northern
of Base Rent(3) Location
New Jersey
278
Atlanta 246
CUSTOMER LEGEND Global 2.5%
IT Service
Cloud Provider
7.4%
of Base Rent(3)
Toronto 180 Business and Financial Capital of Canada
Hyperscale Cloud Social Provider and Primary Data Centre Market
1
of Base Rent(3)
Service Provider Media
Location 1 Los Angeles 176 Entertainment
Colocation / IT Publicly Listed Location Capital of the World
Solutions Provider Company
Seattle 98
Source: Company data as of June 30, 2021. IMR.
3) Based on Base Rental Income as of June 30, 2021.
1) Based on the number of data centres.
2) Based on net rentable square feet as of June 30, 2021. 4) As of 2Q 2021.
MARCH 2022 | 192 An Integrated Global Data Centre Solution
The Digital Core REIT portfolio is fully integrated into PlatformDIGITAL®, a proven solution for scaling digital business
SILICON NORTHERN
Digital Core REIT Data Centre
VALLEY Digital Core REIT Data Centre
VIRGINIA
Global Hub for Largest Data Centre
Digital Realty Data Centre
Technological Innovation Digital Realty Data Centre
Market in the World
29% of the World’s unicorns created in
1Q21 are based in Silicon Valley
PlatformDIGITAL®
Provides Customers a Trusted 70% of the World’s Internet Traffic
Runs through Northern Virginia
Foundation Where They Can Scale
63% 59%
Digital Realty Market Share(1)
Their Business and Access Cloud Digital Realty Market Share
and Network Providers, Allowing
Based on Operational Sq. Ft. Them to Quickly Grow to Meet Their Based on Operational Sq. Ft.
Evolving Digital Infrastructure
140+ 180+
Digital Realty Customers
Needs Digital Realty Customers
Located in Silicon Valley Located in Northern Virginia
Source: IMR.
1) Represents the Northern California market.
MARCH 2022 | 222 Strategic Data Centre Markets for Customers
Digital Core REIT has a presence in four of the top 10 data centre markets in North America, addressing critical customer workloads and exhibiting low vacancy
NORTHERN VIRGINIA LOS ANGELES
Largest Data Centre Market in the World Entertainment Capital of the World
70% of the World’s Internet Traffic
Runs through Northern Virginia 21% of companies in Silicon Beach are
Media and Entertainment Companies
Cloud Service Providers(3)
with Large Compute
Requirements
1,660 MW 3.1% Media and Content
Companies Located in
Los Angeles
176 MW 5.8%
Commissioned Power(1) Vacancy Rate(1) Commissioned Power(1) Vacancy Rate(1)
NORTHERN CALIFORNIA TORONTO
Global Hub for Technological Innovation Business and Financial Capital of Canada and Primary Data Centre Market
29% of the World’s Unicorns Created in 1Q
2021 are Based in Silicon Valley 7th Leading Financial Centre
in North America(2)
531 MW 4.1% 180 MW 6.7%
Major Tech Companies
Headquartered in Canadian Headquarters
Northern California for Global Companies in
Toronto
Commissioned Power(1) Vacancy Rate(1) Commissioned Power(1) Vacancy Rate(1)
Source: IMR.
1) As of 2Q 2021.
2) Per the Global Financial Centres Index 30 (GFCI 30) published September 2021. MARCH 2022 | 21
3) Based on public disclosure by Amazon Web Services, Inc., Microsoft, IBM, Oracle, Alibaba Cloud, and Tencent Cloud.3 Industry-Leading Pipeline for Growth
Digital Realty is the largest owner, operator, developer and acquirer of data centres globally
Operator Developer Acquirer
Number of Data Centres(1) Development Capital Expenditures(1) (2) Total Enterprise Value of Acquisitions(1) (3)
% of Freehold Data Centres(5) (6) (in US$ billions) (in US$ billions)
86% 58% 84% 97% 93% 100% 61%(7) 71%(8) 24%(9)
$5.0(4) Development
291 Pipeline
$19.7
230
$11.7
$2.1
$2.0
54 62
$0.8 $0.7 $3.1
28 25 21 $1.6
16 14 $0.4 $1.4
$0.4 $0.2 N/A $0.7
$0.13 Global ROFR on Digital Realty’s Existing and Global Development Pipeline
Digital Realty’s existing, under-construction and future data centre deliveries provide a highly attractive global pipeline for Digital Core REIT
Current Portfolio(1) 5%
Growth Potential Global ROFR(8)
8%
North America
EMEA
APAC 28%
$58bn
Ent. Value(1)
(Portfolio Value in US$ billions)
Global mandate
61%
281 existing data centres(3)
Latin America
Sponsor Pipeline Supports
$1.3 (5)
Path to $15+ bn
$15+ bn
Portfolio Under Development(2) Stabilized income-producing
real estate assets(4)
North America 25% 24%
Minimum occupancy of at least 90%
$5bn
EMEA
Largest
$16.3
APAC
Latin America
Investment(2) S-REIT(6)
Average rental rate
at least comparable to the market
51%
Land Bank Largest No material asset enhancement
required within two years
NORTH AMERICA EMEA APAC Data Center $3.4
810 Acres 56 Acres 28 Acres
Source: Company data and company filings.
S-REIT Portfolio(7)
Suitable for acquisition by
Digital Core REIT
Note: USD/SGD = 0.74.
1) Total enterprise value as of June 30, 2021 calculated as the market value of common equity, plus liquidation value of preferred equity and total debt at balance sheet carrying value. Breakdown calculated based on total operating revenue as of June 30, 2021.
2) Total expected investment figure includes current investment and future funding required of total committed active development.
3) Excludes the Digital Core REIT IPO portfolio of 10 data centres.
4) Stabilized income-producing real estate asset in relation to the investment mandate shall mean an operating real estate asset which meets the following criteria as at the date of the proposed offer: 1) achieved a minimum occupancy of at least 90%; 2) achieved an average rental rate at least comparable to the market rental rate for similar assets as determined
by the valuer commissioned for the latest valuation of such asset; 3) Digital Core REIT being satisfied that there are no material asset enhancement initiatives required within two years of the acquisition of such asset; and 4) is suitable for acquisition by Digital Core REIT taking into account market conditions at the time of the proposed offer.
5) Based 90% interest.
6) CapitaLand Integrated Commercial Trust; portfolio value, as at June 30, 2021, is based on carrying value of investment properties, joint ventures at ownership percentages and equity investment at fair value at ownership percentages.
7) Mapletree Industrial Trust; portfolio value includes data centre assets only and is based on reported Pro Forma impact as if the acquisition of US$1.32bn data centre portfolio in the US were completed on March 31, 2021; information based on May 20, 2021 announcement. Acquisition was completed on July 22, 2021.
The portfolio value is based on book value of investment properties, interest of the joint venture with Mapletree Investments Pte Ltd, rights of use assets and total acquisition outlay of new portfolio.
MARCH 2022 | 23
8) Global ROFR applies to relevant assets that Sponsor intends to sell to a third party; see prospectus for further details on the terms and conditions of the ROFR.4 Best-in-Class Global Data Centre Sponsorship
Industry-leading sponsor with unparalleled global data centre and public company expertise, experience and track record
Only data centre S-REIT sponsored by a global best-in-class
pure play listed data centre owner and operator Exclusive S-REIT vehicle for Digital Realty
1 Data Centre
Expertise 2 Public Company
Track Record 3 Organizational
Depth
Largest owner and 17 years on NYSE Serving 47 markets
operator across 24 countries on
6th largest US REIT 6 continents
14 years of five- and S&P 500
nines’ uptime(1)
company 3,000+ full-time
employees throughout
Full product global organization
spectrum spanning Raised US$28Bn in
interconnection, equity capital since IPO
colocation and Global teams focused
hyperscale offerings Raised more capital on design &
than any other data construction, data
centre REIT centre operations and
Serving 4,000+
customers sales & marketing
Source: Company data. MARCH 2022 | 24
1) Uptime metrics are based on a comprehensive evaluation of data centre suites owned and operated by Digital Realty worldwide, including facilities operated by Interxion: A Digital Realty Company, using standard industry methodology.4 Experienced Management Team and Board of Directors
Management team and board of directors have extensive experience in the data centre, real estate investment, finance, accounting and capital markets disciplines
EXECUTIVE OFFICERS
John Jeremy Stewart Daniel Tith Chris Cheo Mabel Tan Shu Fang
Chief Executive Officer Chief Financial Officer Senior Finance Manager Director of Capital Markets & IR
21+ YRS 8 YRS 10+ YRS 6 YRS 13+ YRS 9+ YRS 1 YR
Industry Experience Digital Realty Industry Experience Digital Realty Industry Experience Industry Experience Digital Realty
Senior Vice President, Head of EMEA Finance Senior Treasury Manager
Investor Relations, Tax & Treasury
Previous Worked For Previous Worked For Previous Worked For Previous Worked For
BOARD OF DIRECTORS
Jeffrey John David Tan Jeh Tsui Kai
Tapley Herbert Lucey Wuan Chong
21+ YRS 25+ YRS 25+ YRS 30+ YRS 30+ YRS
Industry Experience Industry Experience Industry Experience Industry Experience Industry Experience
Managing Director, Senior Vice President
EMEA Portfolio Management
Previous Worked For Previous Worked For Previous Worked For Previous Worked For Previous Worked For
Chairman
Non-Independent
Non-Executive Director
Source: Company data.
MARCH 2022 | 255 Balance Sheet and Initial Scale Positioned for Substantial Growth
Significantly lower gearing than S-REIT peers, potential to fuel outsized growth prospects
SIGNIFICANTLY LOWER GEARING vs. PEERS AMPLE DEBT HEADROOM FOR GROWTH DEBT FACILITIES AT IPO
Gearing Debt Headroom by Different Gearing at IPO US$550mm of available debt facilities,
(US$mm) ready to support acquisition opportunities
$596
39.6% US$350mm to be drawn at Listing Date with
37.4%
35.1% US$200mm undrawn
Data centre S-REIT peers average: 37.4%(1) $424
27.0% Competitive cost of debt with favorable term
DIGITAL CORE REIT’s FINANCING PARTNERS
$160 Illustrative acquisition size: $144mm(5)
Mapletree Ascendas REIT(3) Keppel DC Digital Core 35% Gearing 45% Gearing 50% Gearing
Industrial REIT (4) REIT
Limited gearing implies significant debt
Trust(2)
headroom to fund post-IPO investments
Initial scale positioned for outsized growth
Source: Company data and company filings.
relative to industry-leading pipeline
1) Simple average of Keppel DC REIT, Mapletree Industrial Trust and Ascendas REIT latest available gearing.
2) Mapletree Industrial Trust gearing is based on financials as at September 30, 2021.
3) Ascendas REIT gearing is based on financials as at September 30, 2021; not inclusive of S$207.8mm acquisition of the eleven last mile US logistics properties announced on October 22, 2021;
not inclusive of issue of HKD950,000,000 2.63%, announced on November 1, 2021.
4) Keppel DC REIT gearing is based on financials as at September 30, 2021.
MARCH 2022 | 26
5) Based on average size of the individual assets of the current portfolio.6 Superior Total Return Profile
Unique opportunity to invest in the early innings of a pure play data centre S-REIT backed by a leading global sponsor primed for growth at attractive returns
Total Return (%)(1) 2022 DPU Yield YoY DPU Growth
EXCLUSIVE S-REIT VEHICLE OF BEST-IN-CLASS
10.01% 9.23% 9.34% 9.06% DATA CENTRE OWNER & OPERATOR
S-REIT Peers
Total Return Avg.: 9.21% ONLY DATA CENTRE S-REIT WITH 100% FREEHOLD,
5.26% 4.09% 3.61% HIGH-QUALITY, MISSION-CRITICAL PORTFOLIO
4.72%
Highest Total Return
Profile Compared
to Peers 4.75% 4.51% 5.25% 5.44% GLOBAL ROFR(10) ON LARGEST AND
GROWING DATA CENTRE PIPELINE
Digital (2)
Keppel Mapletree Ascendas
Core REIT DC REIT Industrial Trust REIT
BALANCE SHEET AND INITIAL SCALE
Sponsorship Owner & Operator Owner & Operator Asset Manager Asset Manager
POSITIONED FOR SUBSTANTIAL GROWTH
Portfolio Value (US$bn) $1.4 $2.3(3) $6.3(6) $11.8(8)
Data Centre Assets (%) 100% 97.1%(3) 52.9%(6) 9.0%(8)
ATTRACTIVE ENTRY VALUATION
Freehold Data Centres (%) 100% 60.7%(4) 70.9%(7) 24.2%(9) AND COMPELLING YIELD
Market Cap (US$bn) $1.0 $3.0 $5.3 $9.4
P / NAV (x) 1.0x 1.9x(5) 1.5x(5) 1.3x(8) CLEAR PATH
TO OUTSIZED TOTAL RETURN
Gearing (%) 27.0% 35.1%(5) 39.6%(5) 37.4%(8)
Source: Company data, company filings, Bloomberg as of November 17, 2021. 7) Based on reported Pro Forma impact as if the acquisition of US$1.32bn data centre portfolio in the US were completed on March 31, 2021; information
Note: USD/SGD = 0.74. based on May 20, 2021 announcement. Acquisition was completed on July 22, 2021. Freehold % is calculated by dividing the sum of net lettable area of
1) Total return (2023E) = DPU Yield (2022E) + DPU Growth (22E-23E). freehold data centre assets (fifty-three) by total net lettable area of data centre assets based on information as of December 31, 2020 for the existing
2) All Digital Core REIT data as at June 30, 2021. portfolio and as of June 1, 2021 for the acquisition of US$1.32bn data centre portfolio in the US. Freehold asset does not include 250 Williams Street NW,
3) Inclusive of (1) acquisition of Guangdong Data Centre which is expected to be completed by 4Q 2021, based on information as of July 26, 2021, (2) NetCo Atlanta which is partly leasehold.
bonds and preference shares subscription of S$89.7mm based on information as of October 14, 2021, and (3) Divestment of iseek Data Centre in 8) NAV per Share as at June 30, 2021 and Portfolio Value, Data Centre Assets (%) and Gearing as at September 30, 2021; all figures not inclusive of
Australia based on information as of October 25, 2021. S$207.8mm acquisition of the eleven last mile US logistics properties announced on October 22, 2021; all figures not inclusive of issue of HKD950,000,000
4) Freehold % is calculated by dividing the sum of attributable lettable area of freehold data centre assets (ten) by total attributable lettable area of data 2.63%, announced on November 1, 2021.
centre assets based on information as of June 30, 2021. 9) Freehold % is calculated by dividing the sum of net lettable area of freehold data centre assets (six) by total net lettable area of data centre assets based
5) NAV per Share and Gearing as at September 30, 2021, based on information as of October 25, 2021 (Keppel DC REIT) and November 3, 2021 (Mapletree on information as of June 30, 2021. MARCH 2022 | 27
Industrial Trust), respectively. 10) Global ROFR applies to relevant assets that Sponsor intends to sell to a third party; see prospectus for further details on the terms and conditions of the
6) Portfolio Value and Data Centre Assets (%) at September 30, 2021, based on information announced November 3, 2021. ROFR.4 Financial
Overview
MARCH 2022 | 28Financial Overview
Organic growth underpinned by built-in rental escalations and secured rent contracts
Gross Revenue Cash Net Property Income Distribution per Unit
US$mm, Financial Year Ended 31 December US$mm, Financial Year Ended 31 December US$ Cents per Unit
% of Rental
Cash NPI
Contracted 99.9% 99.9% 61.0% 62.0%
Margin
Accounting
NPI 66.9 66.5
106.7
105.9
4.40
65.5
61.2
4.18
FY2022 PY2023 FY2022 PY2023 FY2022 PY2023
• Close to 100.0% of existing leases by Base Rental Income and NRSF as of June 30, 2021 have built-in annual rental escalations, generally ranging from 1.0% to 3.0%
Note: All figures on this page represent management estimates based on existing leases. MARCH 2022 | 29Proactive Capital Management
Adequate Debt Headroom for Expansion Expected Debt Maturity Profile
% US$mm $350.0
Aggregate Leverage Limit for S-REITs: 50%
Debt Headroom
$596.5mm
Weighted average debt maturity of 5.0 years
27.0%
27.0% 27.0%
27.0%
At Listing Date Available Debt Headroom FY2022 PY2023 PY2024 PY2025 PY2026 PY2027
Details of Debt
Amount Drawn at Tenor
Facility Available Facilities Undrawn Facilities Average Cost Secured / Unsecured
Listing Date (Years)
Senior Term Loan $350.0 million $350.0 million -- 1.10% 5.0 Unsecured
Senior Revolving Credit Facility $200.0 million -- $200.0 million 1.00% 4.0(1) Unsecured
Total / Weighted Average $550.0 million $350.0 million $200.0 million 1.10%(2) 5.0(2)
• Running cost of debt expected to be 1.10% pa, excluding amortisation of debt-related transaction costs
• 100% unsecured debt providing balance sheet flexibility for Digital Core REIT
• Expect to mirror the Sponsor’s strong preference for long-term, fixed rate financing, and expect to reduce reliance on the bank debt market as the business matures
1)
2)
Does not assume exercise of one-year extension option.
Weighted average for drawn debt.
MARCH 2022 | 30Unique opportunity to invest
EXCLUSIVE S-REIT VEHICLE OF BEST-IN-CLASS DATA CENTRE OWNER & OPERATOR in the early innings of a data
Digital Realty is fully committed to supporting Digital Core REIT’s growth
centre S-REIT backed by a
global sponsor primed for
ONLY DATA CENTRE S-REIT WITH 100% FREEHOLD, growth at attractive returns
HIGH-QUALITY, MISSION-CRITICAL PORTFOLIO
10 fully occupied freehold assets strategically located
in four top-tier data centre markets in North America
GLOBAL ROFR(1) ON LARGEST AND GROWING DATA CENTRE PIPELINE
Global ROFR(1) pipeline from Sponsor (US$58bn EV portfolio + US$5bn development portfolio)
BALANCE SHEET AND INITIAL SCALE POSITIONED FOR SUBSTANTIAL GROWTH
Significantly lower gearing than S-REIT peers, potential to fuel outsized growth prospects
ATTRACTIVE ENTRY VALUATION AND COMPELLING YIELD
Attractive entry valuation at c. 1x NAV and compelling DPU yield of 4.75%
CLEAR PATH TO SIGNIFICANT OUTSIZED TOTAL RETURN
The highest total return profile compared to peers
1) Global ROFR applies to relevant assets that Sponsor intends to sell to a third party; see prospectus for further details on the terms and conditions of the ROFR. MARCH 2022 | 315 Appendix
MARCH 2022 | 32Alignment of Interests with Unitholders
Full alignment of interest with Unitholders given the REIT Manager would be incentivized to maximize unitholder benefits
REIT MANAGEMENT FEE DISTRIBUTION POLICY
Semi-annual, in USD or SGD at
option of Unitholders(2)
100% of distributable income for
1 2
Forecast Year 2022 and
Projection Year 2023
Base Fee Based on Performance Fee Based On
Deposited Value Net Property Income At least 90% of annual
distributable income thereafter
0.5% 3.5%
p.a. of Deposited Value p.a. of Net Property Income(1)
100% of REIT management fees payable to Digital Core REIT
Manager will be paid in units for the forecast period(3) which
further provides alignment of interest
1) Calculated before accounting for the Performance Fee in that relevant financial year.
2) To be paid in SGD by default, unless Unitholders elect to receive in USD. MARCH 2022 | 33
3) Forecast Year 2022 and Projection Year 2023.Structure of Digital Core REIT
Designed to fully align shareholder interests by leveraging Digital Realty’s platform and preserving customer experience
Digital Realty Trust, Inc.
4 ROFR 1 REIT Ownership
98% 1 39%(1) Alignment of Interests
Digital Realty to own a substantial
Sponsor(1)
Management Services Trustee Fees stake in Digital Core REIT
Manager(2) Digital Core REIT Trustee
2 100% Management Fees Trustee Services
2
REIT Manager and Property Managers
100% 100% 100%
Singapore
Singapore Sub 1 Singapore Sub 2(3) Singapore Sub 3 Digital Realty owns 100% of Digital Access to
Core REIT’s Manager and Property Digital Realty Platform
100% of the Loan
US & Canada
Voting Shares Managers
Parent U.S. REIT(4)
100% 3
Digital Realty Direct Ownership in JV
Manager U.S. Sub(2)
3
90% Entities
Limited Liability Companies 90%
10% (U.S. JVs)(5),(7)
Limited Liability Company
Digital Realty to own 10% of each Global ROFR(9)
10% (Canadian JV)(6) U.S. JV and Canadian JV
100% 2
U.S. Asset Manager
and Property Manager(2),(8) 100% 100% 4 Global ROFR(9)
Limited Liability Companies
Canadian SPE (as trustee)
(U.S. SPEs)(5) Digital Realty to provide a ROFR to
2
Tax-Efficient Structure for
100% Canadian Asset Manager Digital Core REIT for assets majority
and Property Manager(2),(8)
100% 100%
owned by Digital Realty globally and Holding US Properties
which fit Digital Core REIT’s
US Properties(5) Canadian Property
investment mandate
1) The stake will be held by a wholly-owned subsidiary of the Sponsor.
2) The Manager wholly-owns the Manager U.S. Sub. The Manager has organised the Manager U.S. Sub so that to the extent activities of the Manager, including under the Asset Management Agreements, would be required to be performed within the U.S., those activities will be delegated to the Manager U.S. Sub.
3) If interest paid by a U.S. borrower to a non-U.S. person qualifies for the Portfolio Interest Exemption, such interest will not be subject to U.S. federal income tax or withholding tax. Singapore Sub 2 is being established, among other reasons, to extend a loan to the Parent U.S. REIT, and in order for the Portfolio Interest Exemption to apply to payments of
interest on such loan, among other requirements, Singapore Sub 2 must not hold a 10%-or-greater equity interest in the Parent U.S. REIT.
4) Approximately 125 preferred shares are proposed to be issued by Parent U.S. REIT to parties who are not related to the Sponsor with a coupon of 12%. The preferred shares will be non-voting, non-participating and redeemable at the option of Parent U.S. REIT. The terms of the preferred shares are in accordance with customary terms offered to other similar
preferred shareholders (i.e., third party holders who hold preferred shares to facilitate compliance with the 100 shareholder test) of U.S. REITs. The Articles of Incorporation for Parent U.S. REIT contains provisions that ensure that this 100 shareholder requirement is continuously met at all times required under U.S. tax rules applicable to U.S. REITs. The
Parent U.S. REIT is able to ensure that it has at least 100 shareholders because it will issue a single share of preferred stock to each of 100-125 holders and the only redemption provisions for these shareholders are entirely within the control of the Parent U.S. REIT. In addition, to ensure that the Parent U.S. REIT has at least 100 shareholders, the Articles of
Incorporation of the Parent U.S. REIT provides that any transfer of shares that would cause there to be fewer than 100 beneficial owners of shares is null and void ab initio. Transfers of shares are not effective until the transferor and transferee deliver to the board of directors of the Parent U.S. REIT an instrument in form and substance satisfactory to the
board of directors representing that the transfer complies with applicable law and the Articles of Incorporation. In addition, the Parent U.S. REIT has the right to require all record and beneficial owners of shares to provide such information as the Parent U.S. REIT may reasonably request to ascertain compliance with the restrictions of the Articles of
Incorporation and the beneficial owners of the shares. A third-party services provider will assist the Parent U.S. REIT with complying with the 100-shareholder requirement.
5) The Parent U.S. REIT would hold 90% of each U.S. JV with a wholly-owned subsidiary of the Sponsor holding the other 10% of each U.S. JV. Each U.S. JV would hold 100% of a U.S. SPE, and each such U.S. SPE would hold one Property.
6) Singapore Sub 3 would hold 90% of the Canadian JV with a wholly-owned subsidiary of the Sponsor holding the other 10% of the Canadian JV. The Canadian JV holds 100% of the Canadian SPE, and the Canadian Property is held by the Canadian SPE on behalf of the Canadian JV (i.e. the registered owner is the Canadian SPE and the beneficial owner is the
Canadian JV).
7) A taxable REIT subsidiary, which is treated as a corporation for U.S. tax purposes, will be formed to assist the Parent U.S. REIT in meeting certain REIT qualification requirements.
8) Pursuant to the Asset Management Agreements and Property Management Agreements, Digital Realty Property Manager, LLC, a wholly-owned subsidiary of the Sponsor, will be the asset manager and property manager for the U.S. Properties and Digital Realty Canada, Inc.,
a wholly-owned subsidiary of the Sponsor, will be the asset manager and property manager for the Canadian Property.
9) Global ROFR applies to relevant assets that Sponsor intends to sell to a third party; see prospectus for further details on the terms and conditions of the ROFR. MARCH 2022 | 344 Strong Alignment of Interests between Sponsor and Unitholders
Digital Realty is fully committed to supporting Digital Core REIT’s growth as a highly strategic capital partner
Structure of Digital Core REIT Designed to Fully Align Sponsor and Unitholder Interests
Digital Core REIT Ownership: Digital Realty will be the largest unitholder of Digital Core REIT with a US$390mm or c.39%(1) ownership
stake as at Listing Date
Direct Asset Ownership: The assets comprising the IPO portfolio are core to the Sponsor's investment strategy, and the Sponsor will retain a 10%
direct ownership stake in the Digital Core REIT properties at IPO
Ownership & Compensation of the REIT Manager and Property Managers: Digital Realty owns 100% of Digital Core REIT Manager and the Property
Managers. Digital Core REIT Manager will receive 100% of its compensation in units for the Forecast Year 2022 and Projection Year 2023
Dedicated Management Team: Full-time, dedicated management team comprised of longstanding Digital Realty team members with extensive data
centre, real estate and finance expertise, ensuring continuity and Sponsor commitment
Access to Sponsor Pipeline through Global ROFR(2): Digital Realty is providing a global ROFR(1) to Digital Core REIT for assets majority-owned by
Digital Realty globally which fit Digital Core REIT’s investment mandate
1)
2)
Excludes the exercise of the over-allotment option.
Global ROFR applies to relevant assets that Sponsor intends to sell to a third party; see prospectus for further details on the terms and conditions of the ROFR.
MARCH 2022 | 35Sources and Uses of Funds
SOURCES OF FUNDS SUMMARY OF FUNDING
1%
IPO Gross Proceeds Sources US$mm %
Subscription by Digital Realty 26%
IPO Gross Proceeds 600 45
Loan Facilities
Acquisition Fee in Units
Issued to REIT Manager US$1.3Bn 45% Subscription by Digital Realty 377 28
Total Sources(1) Loan Facilities 350 26
Acquisition Fee in Units Issued to REIT Manager 13 1
28%
Total Sources(1) $1,340 100%
USES OF FUNDS
3%
Purchase of Assets
Uses US$mm %
Transaction Costs
Purchase of Assets 1,296 97
US$1.3Bn Transaction Costs 44 3
Total Uses
Total Uses $1,340 100%
97%
1) Includes $125,000 preferred shares issuance.
MARCH 2022 | 36Unaudited Pro Forma Consolidated Statements of Comprehensive Income
Year Ended Six-month Period Ended
(US$'000) 31 December 2018 31 December 2019 31 December 2020 30 June 2020 30 June 2021
Gross revenue 108,241 101,900 100,471 49,701 50,517
Property expenses (38,596) (34,637) (35,291) (16,952) (18,323)
Net property income 69,645 67,263 65,180 32,749 32,194
Manager’s base fee (7,116) (7,130) (7,169) (3,581) (3,602)
Manager’s performance fee (2,438) (2,354) (2,281) (1,146) (1,127)
Trustee’s fee (213) (214) (215) (107) (108)
Other trust expenses (2,300) (2,300) (2,300) (1,150) (1,150)
Finance expense(1) (11,628) (12,506) (6,070) (3,518) (2,468)
Profit before tax and fair value change in investment properties 45,950 42,759 47,145 23,247 23,739
Fair value change in investment properties(2) (25,466) (13,050) (5,743) (4,253) (2,158)
Tax expense (7,347) (6,980) (7,016) (3,659) (3,816)
Profit for the year/period 13,137 22,729 34,386 15,335 17,765
Non-controlling interest (5,393) (4,329) (4,845) (2,285) (2,420)
Profit attributable to Unitholders 7,744 18,400 29,541 13,050 15,345
1)
2)
Finance expense comprises interest expenses, amortisation of upfront debt financing costs and commitment fee on revolving credit facility.
Fair value change in investment properties primarily pertains to acquisition costs, straight-lining adjustments of Rental Income and one-off losses due to leasing costs on new leases.
MARCH 2022 | 37Unaudited Pro Forma Consolidated Statements of Financial Position
As at 31 December 2020 As at 30 June 2021
(US$'000) US$'000 US$'000
Current assets 7,559 8,090
Cash and cash equivalents 4,000 4,000
Trade, other receivables and deferred tax asset 3,559 4,090
Non-current assets 1,441,600 1,441,600
Investment properties 1,440,500 1,440,500
Trade and other receivables 1,100 1,100
Total assets 1,449,159 1,449,690
Current liabilities 3,896 4,874
Trade and other payables 3,896 4,874
Non-current liabilities 351,684 351,473
Loans and borrowings 348,075 348,075
Prepaid rent 3,484 3,273
Preferred shares 125 125
Total liabilities 355,580 356,347
Equity 1,093,579 1,093,343
Net assets attributable to Unitholders 949,512 949,299
Noncontrolling interest 144,067 144,044
TOTAL LIABILITIES AND EQUITY 1,449,159 1,449,690
MARCH 2022 | 38Profit Forecast and Profit Projections
Forecast Year 2022 Projection Year 2023
(Full year from 1 January 2022 to (Full year from 1 January 2023 to
(US$'000) 31 December 2022) 31 December 2023)
Revenue 105,918 106,694
Property expenses (39,058) (40,181)
Net property income 66,860 66,513
Other trust expenses (2,300) (2,300)
Manager’s base fee (7,208) (7,221)
Manager’s performance fee (2,340) (2,328)
Trustee’s fee (216) (217)
Finance expense(1) (4,851) (4,874)
Fair value change in investment properties(2) (26,662) (1,050)
Profit before tax 23,283 48,523
Tax expense (6,876) (7,834)
Profit for the year 16,407 40,689
Distribution adjustments(3) 37,072 16,084
Distributable income 53,479 56,773
Non-controlling interest (5,960) (6,289)
Distributable income attributable to Unitholders 47,519 50,484
1) Finance expense comprises interest expense, amortisation of upfront debt financing costs and commitment fee on revolving credit facility.
2) Fair value change in investment properties primarily pertains to acquisition costs, straight-lining adjustments of Rental Income and one-off losses due to leasing costs on new leases.
3) Adjustments comprise the Trustee’s fees, Management fees paid in units, acquisitions costs, amortisation of debt-related transaction costs, deferred tax and adjustment for one-off fair value losses due to leasing costs on new leases.
MARCH 2022 | 41Distributable Income Bridge
INCOME BRIDGE
(US$mm, Fiscal Year Ended 31 Dec)
% of Gross 100.0% (36.9%) (2.4%) (9.0%) (4.6%) (25.2%) (6.5%) 35.0% (5.6%) 44.9%
Revenue
105.9 (39.1)
(2.5) (9.5)
FY2022 (4.8) (26.7) 37.1 (6.0) 47.5
(6.9)
Revenue Property expenses Other expenses Management fees Finance expense(1) Fair value change Tax expenses Distribution Non-controlling Distributable
(3)
in investment adjustments(3) interests income
(2)
properties(2)
(US$mm, Fiscal Year Ended 31 Dec)
% of Gross 100.0% (37.7%) (2.4%) (8.9%) (4.6%) (1.0%) (7.3%) 15.1% (5.9%) 47.3%
Revenue
106.7 (40.2)
(2.5) (9.5) (6.3)
PY2023 (4.9) (1.0) (7.8)
16.1
50.5
Revenue Property expenses Other expenses Management fees Finance expense(1) Fair value change Tax expenses Distribution Non-controlling Distributable
(3)
in investment adjustments(3) interests income
(2)
properties(2)
Note: All figures on this page represent management estimates based on existing leases.
1) Finance expense comprised of interest expense, amortisation of upfront debt financing costs and commitment fee on revolving credit facility.
2) Fair value change in investment properties primarily pertains to acquisition costs, straight-lining adjustments of Gross revenue and one-off losses due to leasing costs on new leases. MARCH 2022 | 42
3) Distribution adjustments comprise the Trustee’s fees, Management fees paid in units, acquisition costs, amortisation of debt-related transaction costs, deferred tax and adjustment for one-off fair value losses due to leasing costs on new leases.Industry Recognized ESG Leadership
Strategic focus on serving a social purpose and delivering sustainable growth for all stakeholders
ENVIRONMENTAL SOCIAL GOVERNANCE
Recognized #1 in Real Estate
Formalized ESG oversight under
Sector by JUST Capital List:
“America’s Most JUST
Companies 2021”
Published EEO-1 report, providing transparency on the
racial and gender composition of the U.S. workforce 2021 the Nominating & Corporate
Governance Committee
Demonstrated senior leadership and employee
Awarded 2021 Green Lease
Leader for third consecutive year
commitment to Diversity, Equity & Inclusion; signed
CEO Action Pledge for diversity; co-chairing Nareit’s 2020 Enhanced Board diversity with the
addition of three new Directors
diversity initiative
Named 2021 EPA ENERGY Amended corporate governance guidelines to clarify 2019 Established proxy access for
shareholders and provided
STAR® Partner of the Year for that director candidate pools must include candidates
second consecutive year with diversity of race, ethnicity and gender
2018 shareholders the ability to propose
amendments to the bylaws
Committed to reducing Scope Led disaster recovery assistance and community
Instituted minimum stock
1 and 2 emissions by 68% and
Scope 3 emissions by 24% by
2030
reinvestment programs: committed to enhancing the
well-being of shareholders, customers, employees, 2015 ownership requirements for
directors and management
vendors, and communities
Source: Company data.
MARCH 2022 | 41Digital Infrastructure Core to Our Customers’ Business and Operations
Our customers play a critical role in the digital economy and digital transformation with our data centres at the core of their operations
Cloud Spend
Largest buyers of data centre capacity and the fastest-growing
Hyperscale market segment. Includes service providers offering
(in US$ billions)
$482
Cloud enterprises a public cloud alternative to their data storage and
core operational workflows. Most disruptive segment over the $243
Service past few years, growing rapidly as IT execs modernize their IT +26%
Providers architecture
CAGR
2019A 2022E
Global Hybrid Cloud Market(1)
Critical players in the hybrid IT evolution, providing (in US$ billions)
Colocation / enterprises with private colocation options to $173
IT Solutions manage sensitive data in addition to managed
services (enhanced security, recovery management, $52
Providers remote hands, etc.)
+22%
Digital Core REIT’s Data
CAGR
2019A 2025E
Centres are Integral to
Our Customers’
Global IP Traffic
Operations Pervasive element of mainstream culture enabled by broader
(Exabytes per Month)
396
Social access to high-speed internet and the growth of mobile
Media devices. With the roll-out of 5G, the creation and consumption 201
of media content is expected to continue to grow +25%
CAGR
2019A 2022E
Source: IMR.
1) Market Research Future (MRFR), “Global Hybrid Cloud Market information by Service Type, by Components, by Vertical and Region – forecast to 2027,” August 2020.
MARCH 2022 | 42Digital Realty’s Global Customer Base
Digital Realty serves 4,000+ customers across six continents that intersect across key digital economy segments
CLOUD & CONTENT PROVIDERS ENTERPRISES CONNECTIVITY PROVIDERS
Source: Company data.
Note: Select Digital Realty customers.
MARCH 2022 | 43Supported by Digital Realty Access to Capital
Digital Core REIT will be able to leverage its sponsor’s stellar track record of accessing multiple capital sources and delivering superior shareholder returns
Full Menu of Capital Options Equity Capital Markets Debt Capital Markets Bank Loan Markets
Unsecured Senior Notes
28bn 13bn
• U.S. Dollar Bonds
• Sterling Bonds
US$ US$
• Euro Bonds
• Swiss Bonds
Debt Private Placement
Unsecured Notes Total Equity Raised Total Bond Issuance Across Multiple
Multi-Currency Since IPO Currencies Since 2015
Global Credit Facility
Unsecured Term Loan
Property-Level Secured Debt
2,634%
Preferred Perpetual Preferred Equity
Equity Convertible Preferred Equity
Common Equity Total Shareholder Return(1)
At-the-Market (ATM) (IPO – November 17, 2021)
Equity Asset Sales
Joint Venture Capital
Source: Company data.
1) Factset as of November 17, 2021. Based on the compound total return, with dividends reinvested by default on the exdate.
MARCH 2022 | 44Portfolio Overview
3011 Lafayette Street 1500 Space Park Drive 2401 Walsh Avenue 371 Gough Road 44520 Hastings Drive
Market : Silicon Valley Market : Silicon Valley Market : Silicon Valley Market : Toronto Market : Northern Virginia
Year Built/Renovated : 2000/2007 Year Built/Renovated : 1977/2008 Year Built/Renovated : 1973/2001 Year Built/Renovated : 1980/2015 Year Built : 2006
WALE : 3.7 WALE : 13.2 WALE : 11.7 WALE : 5.5 WALE : 3.9
Occupancy : 100% Occupancy : 100% Occupancy : 100% Occupancy(2) : 100% Occupancy : 100%
Sq. Ft. : 90,780 Sq. Ft. : 51,615 Sq. Ft. : 167,932 Sq. Ft. : 104,308 Sq. Ft. : 147,000
NPI (2022E) : US$7.7mm NPI (2022E) : US$5.9mm NPI (2022E) : US$4.9mm NPI (2022E) : US$10.6mm NPI (2022E) : US$15.9mm
Appraised Value(1) : US$185.0mm Appraised Value(1) : US$113.0mm Appraised Value(1) : US$112.0mm Appraised Value(1) : US$203.3mm Appraised Value(1) : US$318.0mm
2403 Walsh Avenue 3015 Winona Avenue 200 North Nash Street 43831 Devin Shafron Drive 8217 Linton Hall Road
Market : Silicon Valley Market : Los Angeles Market : Los Angeles Market : Northern Virginia Market : Northern Virginia
Year Built/Renovated : 1996/2000 Year Built/Renovated : 1991/1999 Year Built/Renovated : 1976/2000 Year Built : 2001 Year Built : 2000
WALE : 11.7 WALE : 13.6 WALE : 11.7 WALE : 4.8 WALE : 4.0
Occupancy : 100% Occupancy : 100% Occupancy : 100% Occupancy : 100% Occupancy : 100%
Sq. Ft. : 103,940 Sq. Ft. : 82,911 Sq. Ft. : 113,606 Sq. Ft. : 117,071 Sq. Ft. : 230,000
NPI (2022E) : US$3.1mm NPI (2022E) : US$2.6mm NPI (2022E) : US$3.2mm NPI (2022E) : US$1.8mm NPI (2022E) : US$11.3mm
Appraised Value(1) : US$69.2mm Appraised Value(1) : US$57.8mm Appraised Value(1) : US$71.1mm Appraised Value(1) : US$50.1mm Appraised Value(1) : US$261.0mm
1)
2)
Based on valuation by Cushman & Wakefield of a 100% ownership interest as of August 1, 2021.
Excludes 11,500 square feet of empty shell space not feasible to build out as data centre capacity.
MARCH 2022 | 45North America Data Centre Industry
North America is the largest data centre market globally, with over 6,780MW of total commissioned power as of 2020
NORTH AMERICA DATA CENTRE MARKET OVERVIEW DIGITAL CORE REIT KEY MARKETS
Commissioned Power
(MW) Multi-Tenant Commissioned Power CAGR Digital Core REIT Key Markets
Northern
Virginia
Northern
California
Los Angeles Toronto
Hyperscale Commissioned Power 2020–2024
11,807 15%
10,473 2Q 2021A Multi-Tenant
9,128 1,660 MW 531 MW 176 MW 180 MW
4,004 23% Commissioned Power
7,854 3,516
6,780 2,914
5,058 5,607 2,261
3,892 4,381 1,732 Multi-Tenant
1,198 1,312 12%
882 1,039 6,958 7,803 Commissioned Power Growth 21.7% 10.7% 12.1% 12.5%
5,049 5,594 6,215
3,342 3,861 4,294 (2Q 2021A – 2024E CAGR)
3,011
2016 2017 2018 2019 2020 2021E 2022E 2023E 2024E
2Q 2021A Vacancy Rate 3.1% 4.1% 5.8% 6.7%
Market Share (2021E) North America, primarily the US, is the most
mature region in the global data centre
North America industry
44% 2024E Vacancy Rate 2.2% 3.8% 3.0% 5.5%
Major markets (Northern Virginia, Northern
California, Dallas, Chicago, Phoenix, Northern
12,704MW New Jersey, Atlanta, Toronto and Los Angeles)
represent over two-thirds of the total
Global Multi-Tenant commissioned power in Northern America Average US$/kWh 0.07 – 0.08 0.09 – 0.10 0.14 – 0.15 0.08 – 0.09
Commissioned
Others
56%
Power 2021E Demand coming from hyperscale users such as
cloud providers and social media giants
continues to grow the North American data
centre market to new levels
Source: IMR.
MARCH 2022 | 46Key Markets: Northern Virginia
Northern Virginia is the largest data centre market in the United States with 1,660 MW of multi-tenant commissioned power as at 2Q 2021
NORTHERN VIRGINIA Lease Rates
Retail: 0-250 kW Enterprise: 250 kW- 4MW Hyperscale: 4 MW+
Largest Data Centre Market in the World $/kW/month Low High Low High Low High
2016 200 275 130 155 * *
2017 190 275 130 155 * *
2018 175 275 115 150 * *
North
1,660 MW Ashburn
Data Centre Alley – Bethesda 2019 165 275 100 125 75 100
Commissioned 2020 165 275 90 115 70 95
Power(1) Sterling 150+ Data Centres New York 2021 160 275 85 105 70 95
ACC3
Building C with 2,000+MW City 217 mi 2022E 160 275 80 105 70 90
Aldie
2023E 155 275 75 100 70 90
Reston
2024E 155 270 80 105 75 95
51 MW
Available Power(1)
KEY
Dulles Int’l Airport Tysons
Washington Digital Realty’s Market Share(2)
Digital CORE REIT
Chantilly
Facilities Arlington
38 MW Centreville
Fairfax
White House
59% 41%
Under
Construction Haymarket of the market in terms of of the market in terms of
(not leased)(1) Virginia Beach
Gainesville submarine cable
landing: 165 mi Operational Sq Ft Commissioned Power
Manassas
VA4 Bristow Multi-Tenant Absorption and Vacancy Rates
3.1% Absorption (MW) Vacancy Rate (%)
Vacancy Rate(1)
Largest data centre market in the US with over 1,660 MW of commissioned power 450 6.5% 389 7%
5.3% 5.0% 334 6%
360 324
293 285 283
One of the anchor points of the worldwide internet, as an estimated 70% of the 5%
270 2.9% 2.8% 4%
world’s internet traffic runs through Northern Virginia 2.3% 2.5% 2.2%
c.4% 180 120 123 3.9% 124 3%
Investment Cap Rate Ranked 10th in North America for hyperscale lease pricing 2%
Remain at or around 4%, 90 1%
reflecting a larger national
trend of investor interest in
The market’s vacancy is the lowest among all major markets, at 3%, although the 0 0%
the data centre sector 2016 2017 2018 2019 2020 2021E 2022E 2023E 2024E
market itself is not underserved
Absorption Vacancy
Source: IMR.
1) Multi-tenant data centre market as of 2Q 2021.
2) Only includes top five players in the market.
MARCH 2022 | 47You can also read


