On the phenomena of partial crystallization of highly undercooled magnesium silicate molten droplets - Nature
←
→
Page content transcription
If your browser does not render page correctly, please read the page content below
www.nature.com/scientificreports
OPEN On the phenomena of partial
crystallization of highly
undercooled magnesium silicate
molten droplets
Ganesh Shete, Sushil Mishra, Shyamprasad Karagadde & Atul Srivastava*
The present work reports real-time observations of the phenomena of partial crystallization of one of
the glass-forming materials, namely enstatite (MgSiO3) from its supercooled liquid droplet. Initially,
the molten droplet has been held under purely non-contact conditions using the aerodynamic
levitation technique. The desired levels of undercooling have been achieved by deliberately making
the levitated molten droplet touch a thin molybdenum wire and hence to initiate heterogeneous
nucleation from the point of contact. Influence of thermal parameters like undercooling, cooling
rates and recalescence on the process of crystallization is investigated. To understand and report
the morphological properties and extent of crystallinity, the solidified enstatite samples have
been characterized using optical/scanning electron microscopy (SEM) and X-ray diffraction (XRD)
respectively, which confirmed the formation of partially crystallized enstatite spherules and fully
glass spherules. XRD showed sharp peaks of enstatite, which confirm crystallinity and a halo profile
confirms the amorphous phase of enstatite. Based on the observations of several experiments, we
propose the effect of thermal parameters such as levels of undercooling and recalescence on the
partial crystallization, as well as partial glass formation from the initially molten droplets of enstatite
composition.
Enstatite is one of the widely explored silicate materials and is believed to be a potential candidate for a range of
applications, such as biomedical (dental implants, bone substitutions)1, opto-electronic (laser sources, optical
fibre amplifiers)2 and applied sciences (geophysics, earth and planetary sciences)3. Developing a fundamental
understanding of the nucleation of enstatite is an important step towards the study of the process of its crystalliza-
tion. Ray et al.4 studied internal and external crystallization on lithium silicate glassy samples and observed the
process of partial crystallization. Pablo et al.5 carried out partial crystallization experiments of phosphate glasses
and studied the structural and luminescence properties using SEM, XRD and Raman spectroscopy. Massera et al.6
studied the thermal history and partial to full crystallization on glass reactivity on three phosphate bioactive
glasses and suggested that only one parameter is insufficient to study the complex mechanism of crystallization.
Several authors, as described in the above literatures have studied the process of partial crystallization of various
glass-forming materials and glass–ceramics. The phenomenon of partial crystallization has attracted the inter-
est of the scientific community since it holds importance in a range of scientific and technological applications.
However, the heterogeneous nucleation offered by contaminants such as container surface prevents achieving
desired levels of undercooling. Therefore, numerous authors have studied the processes such as crystallization and
glass formation using different levitation techniques that offer an uncontaminated and undisturbed atmosphere.
Hamai et al.7 studied both heterogeneous and homogeneous crystallization using magnetic levitation. Motokawa
et al.8 studied crystallization and perfect spherical glass formation under levitated conditions. Li et al.9 studied
multiple site crystallization using high-speed videography in an undercooled mullite melt using aero-acoustic
levitation. Yasutomo et al.10 prepared spherical optical crystals that are useful for ball lenses by levitation methods.
Lü et al.11 investigated the solidification of undercooled metallic alloy by employing electromagnetic levitation.
Cao et al.12 studied crystallization of various samples using aero-acoustic levitation.
It can be seen from the above literature that various levitation methods such as magnetic levitation, acoustic
levitation have been widely explored to study crystallization or glass formation. However, such containerless
techniques of levitation strictly depend on conducting or magnetic properties of materials under consideration.
Department of Mechanical Engineering, Indian Institute of Technology Bombay, Powai, Mumbai 400076, India.
*
email: atulsr@iitb.ac.in
Scientific Reports | (2021) 11:13666 | https://doi.org/10.1038/s41598-021-93135-6 1
Vol.:(0123456789)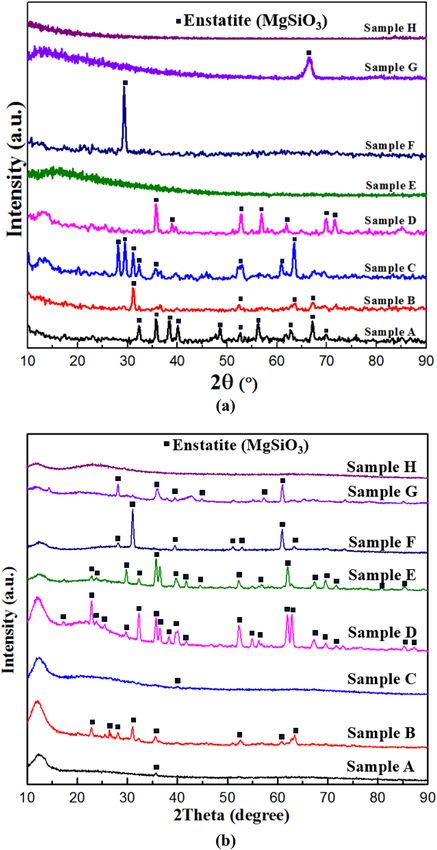
www.nature.com/scientificreports/
In this direction, the aerodynamic levitation methodology, which is independent of the properties of the material
under consideration, becomes important as it also allows control over the possible initiation of heterogeneous
nucleation of any desired level of undercooling by deliberately making the molten sample touch an external
nucleating agent. In the context of aerodynamic levitation based crystallization experiments on magnesium sili-
cates, Beitz et al.13 attempted to create accretionary rims around the chondrule like objects at room temperature
20 °C and at 1100 °C and tested the hypothesis that these rims were formed in the solar nebula by the accretion
of dust on surfaces of chondrules. Mishra et al.14 reported an experimental study of crystallization of magnesium
silicates under aerodynamically levitated conditions. Pack et al.15 developed an in-house aerodynamic levitation
facility equipped with inductively coupled mass spectrometry (ICPMS) to perform evaporation and reduction
experiments on silicates to study chemical analysis.
Experimental studies based on partial crystallization of glass-forming materials under container-less condi-
tions are highly scarce. The primary motivation of performing such levitation-based experiments, particularly
on magnesium silicates (enstatite), has been motivated by its importance in the field of earth and planetary
science. Enstatite is believed to be a part of chondrules in chondritic meteorites, which, in turn, is the remnant
of the early solar s ystem3,16–18. These chondrules are considered to be formed from silicates (crystalline and
glassy) under freely floating c onditions19. Several authors suggested that chondrules were formed under nearly
equilibrium conditions and hence employed very slow cooling rates using sample holding t echniques20. The
sample holding technique offered immediate heterogeneous nucleation sites and hence observed lesser levels
of undercooling21–24. Faure et al.22 studied olivine morphology as a function of slower cooling rates and lower
undercooling levels since the use of electric furnaces offer relatively small cooling rates. But some of the authors
have employed relatively higher cooling rates as well25–28.
The discussion of cooling rates that are applied to cool the silicate samples from high temperatures can
be further extended to levels of undercooling obtained. Nelson et al.28 prepared glassy crystals of enstatite
spherules (which were strikingly similar to chondrule-like objects) from rapid crystallization but undercooling
levels achieved were restricted to 400 K. Their experimental conditions resemble the conditions of chondrule
formation by small-scale thermal events(like volcanism). Shete et al.29 studied the morphological transition of
silicate crystals obtained from highly undercooled melt droplets under aerodynamically levitated conditions for
various levels of undercooling. Nagashima et al.30 performed levitation experiments on enstatite spheres (diam-
eter < 3 mm) and proposed an undercooling regime of ΔT ~ 260–860 K for crystallization to occur since beyond
this regime crystallization is not possible due to glass formation. Tangeman et al.31 studied the crystallization
and glass formation at a relatively higher cooling rate for magnesium silicate (forsterite) at weight proportions
such as 3.5 and 40 mg that produced glassy and crystalline silicate spherule respectively. The process of partial
crystallization (or the extent of partial zones) depends heavily on the levels of undercooling, recalescence and
cooling rate. Such a study considering pure enstatite as the starting material, that has a range of applications,
has not been attempted in the past, as per the best of the knowledge of the authors. In view of this, the current
study focuses on the heterogeneous crystallization of aerodynamically levitated and deeply undercooled enstatite
molten spherules subjected to relatively higher cooling rates.
Nagashima et al.32 performed crystallization experiments on enstatite spherules hung by a thin wire of Pt–Rh
(sample holding technique) under normal gravity conditions and found completely crystalline enstatite but
didn’t find glassy parts of enstatite. But under microgravity conditions, out of 14 enstatite samples, only two
samples showed the combination of both crystalline and glassy parts of enstatite spherules. This is probably
because enstatite samples had a larger area of contact (due to the sample holding technique) for nucleation and
subsequent crystallization. A similar set of results have been compared, obtained and reported in the current
study where using the levitation technique, purely non-contact conditions have been simulated but heterogene-
ous nucleation on these levitated enstatite samples has been triggered by a thin wire of molybdenum. The clear
demarcation between the experimental methodology employed by Nagashima et al.32 and that considered in
the present study is that the a uthors32 performed microgravity experiments using a sample holder, on the other
hand, the present experiments correspond to containerless experiments under normal gravity conditions. Also,
nucleation in32 was initiated along the contact area of the sample holder (which offered mostly complete crystal-
lization) whereas in the present experimental work, nucleation has been initiated using a thin wire of molybde-
num offering conditions that are conducive majorly for partial crystallization at lower undercooling values. By
virtue of this arrangement, the enstatite samples in the present levitation-based study did not have a large area
of contact for nucleation, as that in the case of the sample holding experiments reported earlier by Nagashima
et al.32. This also suggests that such a small contact with solidifying spherule offers the possibility of various levels
of recalescence and cooling rate, which, in turn, can alter the amount of crystalline and glassy zones. A similar
set of experiments where an external nucleation site was created by using a thin wire of molybdenum have been
reported in33,34 for semiconductor sample materials (such as Si, Si-1 at%Sn). However, the application areas
targeted in these studies33,34 are different than that of the present study wherein enstatite has been considered
as sample material due to its significance in the context of earth and planetary sciences, in particular towards
developing an understanding of formation mechanism of the early solar system.
Richet et al.35 found out glass transition temperature of enstatite to be approximately 750 °C. In the context of
heterogeneous experiments performed in the current study, a range of temperatures for heterogeneous nucleation
(triggered using a thin wire of molybdenum) was selected between the enstatite melting point temperature and
its glass transition. Maeda et al.36 hypothesized that metals that have higher melting points should be preferred
as a tool to initiate (heterogeneous) nucleation and hence employed molybdenum to crystallize enstatite which
has application in glass–ceramics. For this reason, a thin wire of molybdenum has been employed to externally
nucleate the initially molten enstatite spherule in between its melting point and glass transition temperature.
Possible influence of thermal parameters like undercooling, cooling rate and recalescence has been revealed
using a cooling curve. Solidified enstatite samples obtained after experimentation have been observed using an
Scientific Reports | (2021) 11:13666 | https://doi.org/10.1038/s41598-021-93135-6 2
Vol:.(1234567890)
www.nature.com/scientificreports/
Figure 1. A schematic arrangement which shows levitating enstatite spherule where crystalline part (region
A) nucleates and subsequently crystallizes due to triggering by a thin wire of molybdenum while remaining
enstatite turns into a glass (region B) (drawing prepared on MS Office (2016) platform).
optical microscope and showed the combination of both glassy and crystalline parts of enstatite as that reported
in the l iterature32.
The possibility of enstatite to partially crystallize under heavily undercooled conditions has not been inves-
tigated to the best of the knowledge of the authors. Also, there are lacunae in the literature related to the study
of nucleation and crystallization of enstatite spherules when they are deeply undercooled. This study, equipped
with in situ high-speed imaging techniques, is expected to provide a pathway for the kinetics of crystallization.
Solidification experiments have been performed for various levels of deeper undercooling obtained by employ-
ing an aerodynamic levitation facility. Plausible effects of thermal parameters (obtained from the cooling curve
of crystallization) such as levels of undercooling, cooling rate and recalescence on the phenomenon of partial
crystallization in terms of the extent of different zones (crystalline and glassy) have been discussed. Partially crys-
tallized spherules obtained after experiments and their formation conditions have been discussed and compared
with some of the experimental works available in the open literature. Solidified enstatite samples obtained after
experimentation have been observed under optical/scanning electron microscopy (SEM) and the crystallinity
of these samples has been confirmed by X-ray diffraction (XRD). XRD analysis has also been performed on the
powdered form of all the solidified samples to ascertain any possible internal crystallization.
Experimental setup
To elucidate the impact of thermal parameters on possible crystallization of initially molten enstatite spherules,
a series of experiments were performed using aerodynamic levitation experimental facility. Details of the experi-
mental facility have been recently reported elsewhere29. In brief, aerodynamic levitation offers purely non-contact
experimental conditions leading to the realization of relatively higher levels of undercooling before the molten
droplet undergoes solidification. Ensuring the highest levels of controls over the operating parameters, it is
possible to cool the initially molten droplet much below its glass transition temperature leading to its complete
transformation into its amorphous form. In addition, while complete glass formation is possible, one can also
achieve heterogeneous nucleation at any desired level of undercooling by bringing the levitated molten droplet
in physical contact with suitable external nucleation triggering surface (e.g. nozzle surface, solid dust particles,
a thin metallic wire, etc.). This, in turn, offers better control on undercooling levels as well. In the context of the
experiments reported in the present study, heterogeneous nucleation of the levitated enstatite molten droplets
has been triggered using a thin molybdenum wire (melting point = 2623 °C, diameter = 150 µm). To study the
effect of level of undercooling on the processes of complete crystallization, partial crystallization and glass
formation, the physical contact between the molten droplet and the molybdenum wire has been established at
various stages of the cooling curve of the molten droplet i.e. between its melting point temperature (Tm) and the
glass transition temperature ( Tg).
The schematic representation of the physical configuration of an aerodynamically levitated molten drop-
let with the provision of externally induced heterogeneous nucleation using a molybdenum wire is shown in
Fig. 1. The starting material employed is enstatite ( MgSiO3) powder with 99.99% purity (Goodfellow: Supplier of
materials for research and development). Enstatite spherules of ~ 2.5 mm diameter were prepared using a laser
hearth (equipped with an experimental facility) (see Fig. 2b) and levitated using a conical nozzle made up of
aluminum (see Fig. 2a).
As shown in (Fig. 2a), argon gas with a flow rate of ~ 400 ml/min has been employed for achieving aerody-
namic levitation. Initially solid spherules were completely melted using a high power C O2 laser (Firestar i400,
Scientific Reports | (2021) 11:13666 | https://doi.org/10.1038/s41598-021-93135-6 3
Vol.:(0123456789)
www.nature.com/scientificreports/
Figure 2. (a) Schematic of the complete experimental setup showing important devices. A-Laser power supply
(Synrad i401), B-Laser head, C-Mirror, D-Lens assembly, E-Laser beam focusing screws, F-Pyrometer ports,
G-Process chamber, H-Nozzle, I-Optical ports, J-Gas port, K-Chiller, L-Zn-Se window, M-Levitating spherule,
N-Mass flow controller. (b) Schematic diagram showing the method of preparation of silicate spherules,
consisting of a copper block hearth (drawing prepared on MS Office (2016) platform).
λ = 10.6 µm and spot size = 1 mm, the maximum power output of 400 W). The molten state of the enstatite
spherules was ensured by heating the sample well above its melting point temperature ( Tm = 1560 °C)32. Moder-
ate to rapid cooling rates were achieved by suitably controlling and/or switching off (for quenching) the laser
power. Real-time visualization of the phenomena of solidification (partial crystallization and vitrification) has
been achieved by integrating the experimental facility with CMOS based high-speed camera (Phantom Digi-
tal High-speed VEO410L). Images have been recorded at 4000 frames/s with a spatial resolution of 640 × 480
pixels. The time history of the surface temperature of the solidifying droplet has been recorded using an optical
pyrometer whose default acquisition rate is 10 Hz. The pyrometer is of Chino-IR-CAS series having measure-
ment range 600–3000 °C with an emissivity value of ɛ = 0.9 at the working wavelength (0.9 µm). This emissivity
value corresponds to materials such as magnesium silicate alloys, as employed in the present set of experiments
as model material (Enstatite)37. The operating wavelength of pyrometer is 900 nm and accordingly, appropriate
emissivity corrections have been applied to maintain uniformity in the measured values of temperature over the
design range. With such emissivity corrections, the error in temperature measurement is well within acceptable
limits. For the temperature range involved in the present set of experiments, an accuracy rating of ± 0.5% of the
measured value of temperature is achieved with the employed pyrometer. In addition to this, major findings of
the present experiments are focussed majorly on the effect of two thermal parameters, namely undercooling and
amount of recalescence on the crystalline and glassy zones. These parameters are primarily the differences in two
temperature values, and hence the errors are almost negligible, w.r.t. to the orders of magnitude of high under-
cooling levels achieved. The phenomenon of heterogeneously induced onset of nucleation, once the molybdenum
wire physically touches the molten droplet, has been captured in the form of the instantaneous sharp increase
in the surface temperature of the solidifying sample (through optical pyrometer) as well as a sudden increase in
the intensity levels of the two-dimensional images as a result of the release of the latent heat of crystallization
(recalescence). In contrast, no such sudden change (increase) in the instantaneous temperature and/or intensity
levels are to be expected in the case wherein the solidifying spherule gets completely transformed into a glass
(achieves temperatures that are well below the glass transition temperature of enstatite).
Solidified spherules of enstatite obtained after experimentation were further characterized by an optical
microscope and SEM. To verify the crystallinity of the solidified enstatite samples, X-ray diffraction (XRD)
measurements were performed on Empyrean diffractometer (λ = 1.54 Å) having variable spot focus capability.
XRD analysis for the powdered form of enstatite samples have been performed with spot focus capability of 2 mm
while that on the small but crystallized surface of spherules have been performed with 0.5 mm. XRD profiles
performed on the crystallized surface of solidified enstatite samples offered the qualitative results of crystallinity
of the solidified enstatite samples, while that performed on the powdered form of samples offered information
about any possible internal crystallization. A thin gold–palladium coating has been applied on the enstatite
spherule, which got solidified completely to avoid charge build-up. This avoids the charging of electrons since
enstatite is non-conductive. The sample is then further observed under the SEM (scanning electron microscope).
Scientific Reports | (2021) 11:13666 | https://doi.org/10.1038/s41598-021-93135-6 4
Vol:.(1234567890)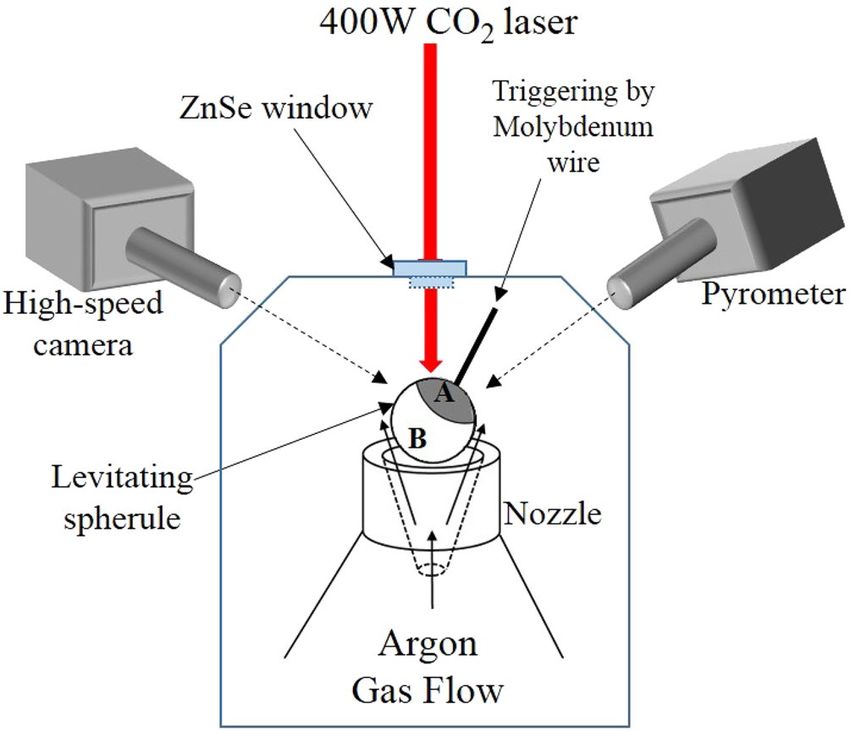
www.nature.com/scientificreports/
Figure 3. Cooling curves for enstatite melt sample A (ΔT = 510 K) and sample C (ΔT = 525 K) under a levitated
condition which shows recalescence events on the cooling curve hence indicates the presence of nucleation
and subsequent crystallization while sample H doesn’t exhibit recalescence indicating a process of vitrification.
Melting point temperature (Tm), hypercooling temperature (Thyp), and glass transition temperature (Tg) of
enstatite is shown by a broken line.
Results and discussion
Experimental observations pertaining to partial crystallization and partial vitrification of levitated enstatite
molten droplets have been discussed in this section. The range of undercooling levels achieved in the experi-
ments has been achieved by choosing the undercooled melt temperature at which the levitated molten droplet
of enstatite is made to touch the thin molybdenum wire. For ready reference and ease of discussion, solidified
samples have been termed as A, B, C, …., H.
Samples A, B, C and D are characterized by relatively lower levels of undercooling (between the range of
ΔT ~ 400–525 K) while samples E, F and G were offered higher undercooling levels (ΔT > 615 K). For samples
A to D, a detectable phenomenon of recalescence, as recorded using optical pyrometer as well as high-speed
camera, could be clearly observed which indicated towards the crystallization of the initially molten droplet
as the heterogeneous nucleation was triggered by molybdenum wire. However, samples E, F and G, wherein
the physical contact between the molten sample and the molybdenum wire was established at much deeper
levels of undercooling (closer to the glass transition temperature of enstatite), crystallization was observed for
samples E and sample G where clear recalescence was observed in the cooling curve while for sample F detect-
able recalescence was absent. Sample H corresponds to the extreme case of vitrification wherein no attempt of
heterogeneous nucleation was made and the molten droplet, under purely non-contact conditions, was allowed
to cool down to temperatures well below the glass transition temperature. This highly undercooled sample got
completely transformed into glass. The crystallized and/or glassy nature of the resultant solidified samples has
been ascertained through both surface and powder XRD analysis in each case.
It is worth clarifying here that the undercooling levels achieved in the present experimental work are well
above the hypercooling limit (which is thermodynamically defined as ΔThyp = ΔHf/Cp where ΔHf is the enthalpy
of crystallization and Cp is the specific heat of liquid). The value of hypercooling limit ΔThyp for enstatite melt is
close to 507 °C32. Beyond this limit, the solidification process changes drastically. When ΔT < ΔThyp, the liquid
(present after the recalescence) is solidified when the recalescence is over. But when ΔT > ΔThyp, the molten
sample solidifies completely in the recalescence. To our understanding, such an experimental work on enstatite
as sample material has not yet been addressed (with undercooling greater than hypercooling limit) in the open
literature that endorses the novelty of the present work.
Observations of surface features for smaller crystalline zone. Solidification patterns of samples A,
C and H have been discussed in this section. The temperature vs time history of these samples, as recorded using
optical pyrometer, has been shown in Fig. 3 which shows clear demarcations between different cooling curves in
which onset of nucleation occurs at various temperatures.
An otherwise monotonically decreasing temperature of the molten droplet shows the signs of recalescence
(instantaneous increase in temperature) due to the onset of heterogeneous nucleation as the thin molybdenum
wire is made to touch the levitated molten droplet. The sudden release of latent heat of crystallization results in
instantaneous heating of the solidifying front, a phenomenon which was ascertained through the cooling curve.
For instance, the two points of recalescence events seen in Fig. 3 for sample A corresponds to two instantaneous
Scientific Reports | (2021) 11:13666 | https://doi.org/10.1038/s41598-021-93135-6 5
Vol.:(0123456789)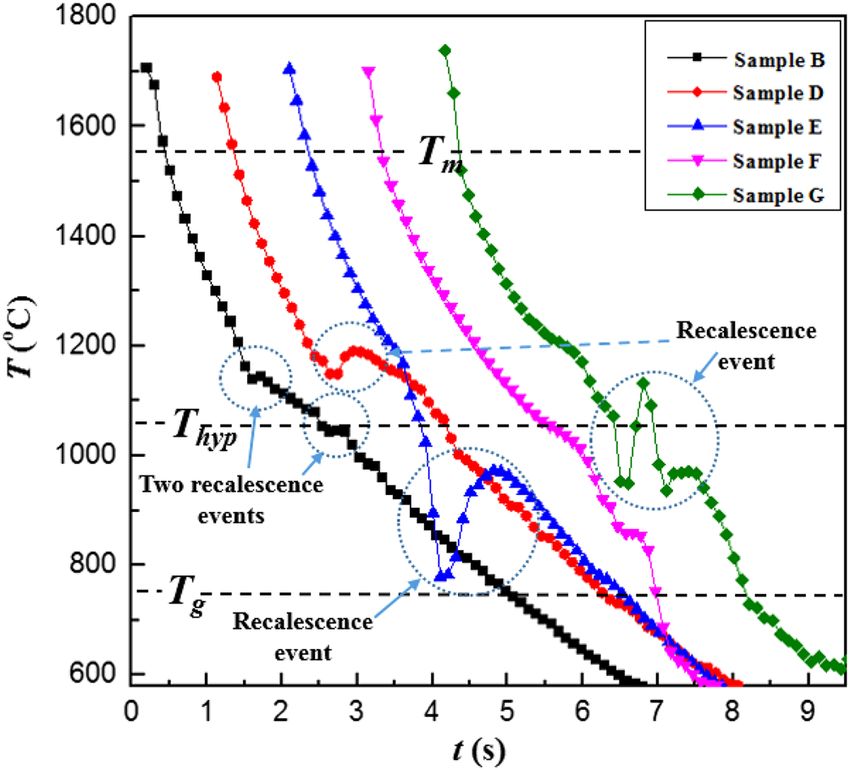
www.nature.com/scientificreports/
Figure 4. High-speed camera images of enstatite melt sample A where bright part at time instant t = 0 s
indicates completely molten initial enstatite sample, at t = 1 s shows drop in the temperature while cooling and
also at the same instant molybdenum wire comes in contact with the sample, at t = 2.55 s shows initial nucleation
and t = 3.62 s shows final partly glassy and partly crystalline enstatite sample. Scale bar in the first image applies
to all subsequent images.
Figure 5. (a) Optical microscope images of the solidified enstatite (a) sample A (ΔT = 510 K) (b) sample C,
(ΔT = 525 K) both processed under levitated conditions and triggered by a wire of molybdenum.
heating rates of 90 and 240 °C/s. The cooling curves for samples C and H have also been shown in Fig. 3. Sample
C does not exhibit any detectable recalescence phenomenon but does show a slight deviation in the cooling
curve near hypercooling temperature line ( Thyp). The cooling curve for sample H shown clearly shows a com-
plete absence of any recalescence event as the molten droplet is cooled down while being in purely non-contact
conditions. The temperature of the solidifying sample monotonically decreases, goes below the glass transition
temperature and undergoes complete vitrification leading to glass formation.
Figure 4 shows the time-lapsed high-speed images of the molybdenum wire-induced onset of nucleation
for sample A. The images corresponding to t = 0 s show the initial molten droplet under complete non-contact
conditions (aerodynamically levitated). As time proceeds further, the crystallizing front created due to the
molybdenum wire which advances in the bulk of molten droplet can be clearly seen on the sample surface. The
onset of heterogeneous nucleation, triggered using a thin wire of molybdenum (at t = 1 s) leads to the realization
of partial glass formation and partial crystallization in sample A. It was highly expected that a very small crystal-
lizing zone could have been formed since the enstatite sample experiences a very small amount of recalescence
event, which has been further confirmed by optical microscopy. The clear demarcation between the partial
crystal (formed due to liberation of latent heat) and partial glass formed while cooling the enstatite sample can
be seen using the employed high-speed imaging technique. These high-speed based imaging observations have
been supported through optical micrographs of the final solidified enstatite sample A. These optical micrographs
have been shown in Fig. 5.
Figure 5a depicts the crystallization behavior of sample A (En crystal and En glass can be seen), which fol-
lowed the thermal history shown in Fig. 3. Since enstatite is rich in silica, as the temperature drops, molecular
mobility decreases which subsequently increases the melt viscosity and hence inhibits further nucleation and
crystal growth. The crystalline phases that evolved during the process have been identified through XRD phase
analysis (see Fig. 11a) performed on the crystalline part of the spherule. These XRD analyses clearly showed the
peaks of enstatite. This suggests that both thermal history as well as the XRD analysis, ascertain the crystallinity.
Scientific Reports | (2021) 11:13666 | https://doi.org/10.1038/s41598-021-93135-6 6
Vol:.(1234567890)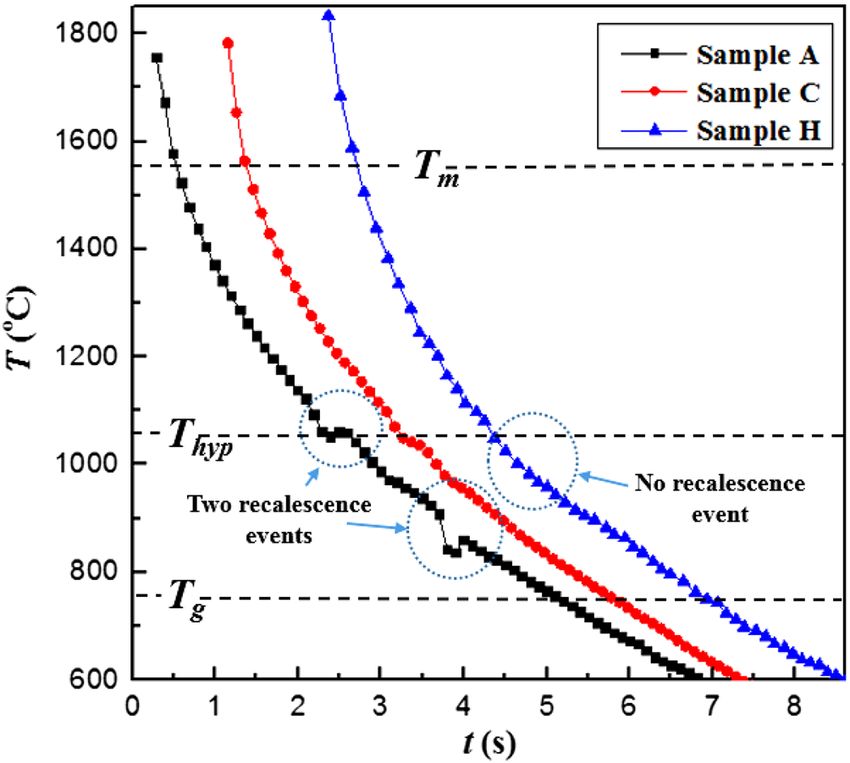
www.nature.com/scientificreports/
Figure 6. Optical microscope images of the solidified enstatite sample H both processed under levitated
conditions and not triggered by a wire of molybdenum.
Similar observations are also to be made for sample C as shown in Fig. 5b along with its XRD profile (Fig. 11a).
The smaller volume of enstatite crystalline region than enstatite glassy region for both samples A and C is
attributed to the fact that the recalescence event/s as shown in the thermal history of these samples are lesser
as compared to the all samples studied in the next subsection. The discussion about the thermal history has
been corroborated by using optical microscopy and the XRD method. Figure 5b shows the difference between
enstatite crystal and enstatite glass of sample C. XRD profile also shows some major sharp peaks which confirms
the crystallinity of the enstatite crystalline part of sample C (Fig. 11a).
Figure 6 shows the optical microscope image of the solidified sample H where only the glassy part can be
observed and no crystalline part is to be seen unlike in the case of samples A and C discussed earlier. Figure 11a
does show an initial amorphous halo and neither major nor any minor peaks are to be seen, thus confirming the
process of vitrification of the initially molten enstatite spherules.
Similar approach and set of results have also been reported by Nagashima et al.32 where enstatite melts were
held using metallic wires or rods. The authors i n32 observed that nucleation always took place from these wires
and/or rods and obtained complete crystallization under normal gravity conditions while partial crystalliza-
tion under microgravity conditions. To the best of the knowledge of the authors, this is one of the few attempts
to reproduce such mixed structures (crystalline and glassy) under levitated and normal gravity conditions. In
the context of chondrule crystallization study, the plausible mechanism that can be explained which led to the
formation of such mixed structures for enstatite (magnesium silicates) can be either due to smaller recalescence
events under levitated conditions (as per the present study) or microgravity conditions (reported by Nagashima).
Observations of surface features for larger crystalline zone. In this subsection, the solidification
phenomena of samples such as B, D, E, F and G that observed a larger crystalline zone relative to the glassy zone
have been discussed. Sample B shows two recalescence events, first quite above the hypercooling temperature
line (Thyp) and second just near Thyp line contrary to the cooling curve of sample A where second recalescence
was approaching the glass transition line (Fig. 7). Therefore, a larger crystalline zone has been observed for sam-
ple B as compared to sample A. It is to be noted sample D has experienced a relatively lesser undercooling level
(ΔT ~ 410 °C) before the molten droplet was made to heterogeneously nucleate (Fig. 7). The instant of onset of
crystallization of sample D is evident through the realization of the recalescence event due to which a sudden
rise in temperature of the solidifying droplet (by about 45 °C) takes place before the sample resumes the cooling
curve. Compared to sample A, B and C, sample D exhibits the strongest recalescence phenomenon well above
the hypercooling temperature line, hence it is expected that the extent of crystallization achieved in D would be
relatively higher than that in the other three samples.
The temperature of sample E reached near to the glass transition temperature of enstatite which is well below
the hypercooling temperature line (Tg = 750 °C) hence it experienced the largest undercooling level (ΔT = 782 °C)
as compared to all other samples. The cooling curve of sample E shows clear deep till the temperature reaches
near the glass transition temperature (Fig. 7). As it approaches the glass transition temperature of enstatite
(Tg = 750 °C), a sudden sharp jump in the temperature profile is to be seen which again raises the temperature
to ~ 1000 °C. This sudden and significantly large temperature rise (by about 195 °C) has been confirmed to be
the result of recalescence phenomenon as observed by high-speed imaging technique and XRD analysis, an
aspect of the work that has been discussed further. Figure 7 also shows the cooling curves for samples F and G.
Scientific Reports | (2021) 11:13666 | https://doi.org/10.1038/s41598-021-93135-6 7
Vol.:(0123456789)www.nature.com/scientificreports/
Figure 7. Cooling curves for enstatite melt sample B (ΔT = 519 K), sample D (ΔT = 411 °C), sample E
(ΔT = 782 K), sample F (ΔT = 702 K) and sample G (ΔT = 611 K) under a levitated condition which show
recalescence events on cooling curve hence indicates the presence of nucleation and subsequent crystallization.
Melting point temperature (Tm), hypercooling temperature (Thyp), and glass transition temperature (Tg) of
enstatite is shown by a broken line.
As compared to sample E and G, the heterogeneous nucleation in sample F was triggered at a temperature that
was very close to the glass transition temperature of enstatite (well below Thyp line) and did not observe any
detectable recalescence. As the triggering is done near the glass transition, it is reasonable to expect the most of
the sample material gets converted into its glassy phase, thereby leaving a very little possibility of the sample get-
ting converted into the crystalline phase. The cooling curve of sample G (that achieved undercooling of 611 °C)
also shows some sudden jump in the cooling curve (in between T hyp and Tg). However, in this case, the release
of latent heat of crystallization was strong enough to raise the temperature of the molten melt to levels that are
higher than the level achieved by the molten droplet just before the recalescence event. This implies that some
part of the sample G got converted into crystalline phase, which has been ascertained using XRD profile. Figure 8
shows the time-sequence of the high-speed camera images wherein the temporal history of the solidification
phenomenon of samples B, E and F can be seen. Time-sequence images recorded using a high-speed camera
after triggering a thin wire of molybdenum where partly glassy and partly crystalline phases can be observed
by looking at the bright spot (due to recalescence) and dark zones (glass formation). The comparison of both
image-sequence (Figs. 4 and 8) where temporal evolution can be seen, shows how the process of partial crystal-
lization progresses. Relatively larger zones of crystalline enstatite (as compared to a glassy zone of enstatite seen
in Fig. 4) can be visualized from the transient evolution of the process of crystallization (see Fig. 8).
The above discussion, which is based on the observations from the thermal histories has been extended
to surface feature analysis and XRD-based crystalline phase analysis (Fig. 11a). The larger volume of enstatite
crystalline region (Fig. 9a) than enstatite glassy region for sample B (as compared to sample A and C) is attrib-
uted to the fact that the second recalescence event as shown in the thermal history of sample B is farther from
the glass transition line (just near to Thyp). While for sample A, this second recalescence event is nearer to the
glass transition line (Fig. 3). This may be the possible reason that sample B got more crystallized as compared to
sample A where a glassy colony is larger.
Figure 9b shows the SEM image of sample D which was seen to be completely crystallized and no transparent
glassy part was to be seen unlike in the case of partially crystallized samples A, B and C. It is to be noted here that
for samples A, B and C, optical micrographs rather than SEM images have been shown while for sample D, the
discussion is based on SEM image. This approach has been followed in view of the fact that the glassy parts of the
partially crystallized enstatite samples (in A, B and C) led to the unavoidable charge-up effects while sample D
showed good high-resolution imaging of surface features of the enstatite sample using SEM. XRD scan confirms
the crystallinity of sample D where some major and few minor peaks are to be observed (Fig. 11a).
XRD analysis performed on the surface of sample E did not show any peak as was observed in the other
samples (sample A, B, C and D), which were partially crystallized, instead showed a halo profile at the start. In
order to understand the internal crystallization behaviour of sample E as compared to the surface crystallization
where no crystallization was detected from XRD scan of the surface of this sample (E), all the enstatite spherules
have been first crushed in an agate mortar to their powdered form and then subjected to XRD analysis. (This
aspect of the work has been elaborated in “XRD performed on powdered form of all samples” section). The optical
image for sample E (Fig. 10a) showed a glassy region of enstatite (En glass) and crystalline enstatite (En crystal).
Scientific Reports | (2021) 11:13666 | https://doi.org/10.1038/s41598-021-93135-6 8
Vol:.(1234567890)www.nature.com/scientificreports/
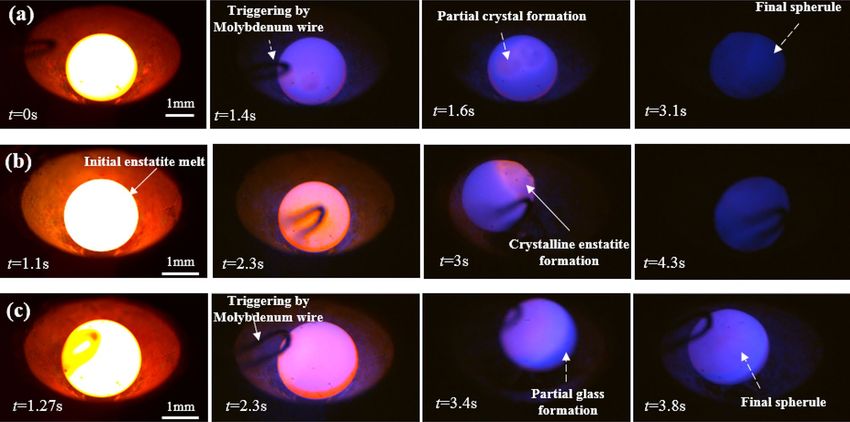
Figure 8. High-speed camera images of enstatite melt. (a) Sample B also shows bright part at time instant t = 0 s
indicates completely molten sample, at t = 1.4 s shows initial nucleation and drop in temperature while cooling
and t = 1.6 s shows partly glassy and partly crystalline enstatite and t = 3.1 s shows finally solidified sample.
The scale bar in the first image applies to all subsequent images. (b) Sample E where bright part at time instant
t = 1.1 s indicates completely molten sample, at t = 2.3 s shows drop in the temperature while cooling, at t = 3 s
shows wire touching sample and t = 4.3 s shows final partly glassy and partly crystalline enstatite sample. (c)
Sample G also shows bright part at time instant t = 1.27 s indicates completely molten sample, at t = 2.3 s shows
initial nucleation and drop in temperature while cooling and t = 3.4 s shows partly glassy and partly crystalline
enstatite and t = 3.8 s shows finally solidified sample.
Figure 9. (a) Optical microscope image of solidified enstatite sample B (ΔT = 519 K). (b) SEM image of
solidified enstatite sample D that shows only crystalline region and no glassy region (ΔT = 411 °C).
Figure 10b confirms that a very small amount of crystalline part for sample F is observed while the rest of the
part remains glassy. From the XRD profile (Fig. 11a), only a single XRD peak can be seen while other peaks were
absent or were beyond the limit of detection. The optical image for sample G shows a small portion of enstatite
glass, and a relatively large portion of crystalline enstatite (Fig. 10c). However, the XRD profile exhibits only one
sharp peak of enstatite ( MgSiO3) at 66.7° with a halo pattern nearly at 13° (Fig. 11a).
Scientific Reports | (2021) 11:13666 | https://doi.org/10.1038/s41598-021-93135-6 9
Vol.:(0123456789)www.nature.com/scientificreports/
Figure 10. (a) Optical microscope image of solidified enstatite sample E, (ΔT = 782 K), (b) sample F
(ΔT = 702 K) and (c) sample G (ΔT = 611 K) processed under levitated conditions and triggered by a wire of
molybdenum.
XRD analysis. The crystallinity of these spherules was ascertained by carrying out XRD analysis and was
confirmed to be of enstatite composition while other phases were below the limit of detection or absent. Two
different methodologies of XRD analysis have been adapted to understand the phenomenon of internal as well
as surface partial crystallization and are well elaborated in the following sub sections.
XRD performed on the crystallized surface of all samples. Figure 11a shows the XRD profiles performed on a
crystalline surface of all the samples considered in the present work in which partial crystallization and vitri-
fication process took place. A combination of major and minor peaks for samples A, B, C and D displays that
these samples exhibit crystallinity. Also, sample E does not show any XRD peak that does indicate that surface
crystallization (as that of all the other samples) is not observed at least for sample E. A single XRD peak has been
observed for sample F and sample G. It is pertinent to note here that the possibility of sample evaporation can
effectively be ruled out since the final composition obtained from the current XRD data analysis, is the same as
the starting material (enstatite (MgSiO3)) and hence no extra phase can be seen. Sample H gets converted into a
glass and hence its XRD profile shows an initial halo and does not show any major and/or minor peaks.
Scientific Reports | (2021) 11:13666 | https://doi.org/10.1038/s41598-021-93135-6 10
Vol:.(1234567890)www.nature.com/scientificreports/
Figure 11. (a) XRD patterns obtained from the surface of all samples where samples A, B, C, D, F and G show
multiple sharp peaks. However, samples E and H do not show any peaks. (b) XRD patterns of the powdered
form of all the samples where samples B, D, E, F and G show multiple sharp peaks. Samples A and C exhibit a
single and weak peak that suggests detectable crystallization has taken place. However, sample H does not show
any peak but shows an amorphous halo in the micrographs.
XRD performed on powdered form of all samples. To verify the crystallinity of the inner zones of these samples,
XRD analysis has been performed on the powdered form of enstatite spherules (Fig. 11b). XRD scans on the
powdered specimens exhibit sharp peaks as well as halo profile at low angle for these spherules, which indicate
that crystalline and glassy regions are present in the partially crystallized enstatite spherule. The XRD peak
intensity is different for powdered and bulk (solidified) samples. For bulk samples, the XRD peaks are observed
only from the focused surface/subsurface, whereas powdered sample gives overall sample information and peak
intensity changes accordingly. For example, the powdered form of sample E does show some peaks (Fig. 11b) but
an XRD scan performed on the sample surface (Fig. 11a) doesn’t show any peaks. This implies that the spherule
has got partially crystallized.
Similarly, XRD analysis performed on the crystallized surface of samples A and C showed sharp peaks
(Fig. 11a) but that performed on their powdered form showed only a single but weak peak (Fig. 11b). This
observation may be attributed to very little crystallization in the sample and the fraction of the glassy region
Scientific Reports | (2021) 11:13666 | https://doi.org/10.1038/s41598-021-93135-6 11
Vol.:(0123456789)www.nature.com/scientificreports/
being relatively very large, particularly for these two samples (Samples A and C). This can be well observed in
the optical images obtained using the optical microscopy technique (Fig. 5a,b). Also, interaction volume which is
subjected is XRD analysis is also constant for all the powdered samples hence such a small fraction of crystalline
enstatite spherules (particularly samples A and C) yield in low-intensity peak.
One of the interesting observations made through the present set of experiments revealed that the very thin
wire (150 µm) is not sufficient to fully crystallize the levitating and rapidly supercooled enstatite molten droplet.
The thin wire that has been brought into contact with the heated surface of the supercooled enstatite spherule
offered an extremely lesser area of contact as compared to similar methods employed by some of the previous
researchers in the past for initiating heterogeneous nucleation of highly undercooled enstatite spherules. For
instance, Nagashima32 performed crystallization experiments and hung enstatite spherules using two methods
namely, (a) thin PtRh wire loop (0.1 mm diameter), and (b) two parallel PtRh rods of 1 mm thickness. The area
of contact was evidently smaller in the case of the wire loop technique as compared to parallel rods and thus
influenced the temperature distribution by creating cold spots at the contact points. Moreover, the amount of
silica content present in the model material (enstatite) also offers additional resistance to crystallization at deeper
undercooling levels and more so when the initially molten sample is subjected to very high cooling rates. These
factors lead to vitrification of most of the material, an inference that has been drawn on the basis of the experi-
ments conducted as part of the present work.
Conclusions
Experimental investigations into the plausible effect of thermal parameters such as levels of undercooling, cooling
rate and amount of recalescence on the process of partial crystallization for magnesium silicate material (enstatite
spherules as the model material) under purely non-contact conditions were reported. This study suggested that
it is insufficient to take into consideration only one single parameter to study the complex mechanism of crys-
tallization. Also, it was the first time that crystallization, which occurs concomitantly with glass formation, has
been observed and reported for rapidly cooled enstatite melt under aerodynamically levitated conditions. Optical
microscopy and SEM technique have been employed to observe finally solidified structures while XRD analysis
confirms the crystallinity of enstatite spherules. Experimental findings proposed the existence of internal and
surface crystallization of solidified enstatite spherules. The nature of partial crystallization strongly suggests that
enstatite above and below its hypercooling limit (ΔT = 507 °C) exhibits sufficient molecular mobility to support
crystallization and hence enstatite spherule shows both crystalline and glassy phases under levitated conditions
which have never been explored before.The impact of the thermal history on partial crystallization may provide a
pathway, under certain circumstances, to decipher the complex mechanism of formation of the early solar system
and shed new light on glass-forming ability of enstatite (magnesium silicate) near and below hypercooling limit.
For instance, a recent study of complex forsterite (magnesium silicate) morphologies from dendritic faceted
to unbranched faceted features (Shete et al.29) indicates that such features are affected by undercooling levels.
Further work is underway to extend the current study in a more detailed manner to explore the mechanisms of
nucleation beyond the hypercooling limit and study the suitability of enstatite samples for mechanical, optical
and biomedical applications.
Received: 5 March 2021; Accepted: 7 June 2021
References
1. Goeuriot, D., Dubois, J. C., Merle, D., Thevenot, F. & Exbrayat, P. Enstatite based ceramics for machinable prosthesis applications.
J. Eur. Ceram. Soc. 18, 2045–2056 (1998).
2. Denry, I., Holloway, J. A. & Gupta, P. K. Effect of crystallization heat treatment on the microstructure of niobium-doped fluorapatite
glass-ceramics. J. Biomed. Mater. Res. Part B Appl. Biomater. 100B, 1198–1205 (2012).
3. Zanda, B. Chondrules. Earth Planet. Sci. Lett. 224, 1–17 (2004).
4. Ray, C. S., Yang, Q., Huang, W. & Day, D. Surface and internal crystallization in glasses as determined by differential thermal
analysis. J. Am. Ceram. Soc. 79, 3155–3160 (1996).
5. Lopez-Iscoa, P. et al. Effect of partial crystallization on the structural and luminescence properties of Er3+-doped phosphate
glasses. Materials 10, 473 (2017).
6. Massera, J., Mayran, M., Rocherullé, J. & Hupa, L. Crystallization behavior of phosphate glasses and its impact on the glasses’
bioactivity. J. Mater. Sci. 50, 3091–3102 (2015).
7. Hamai, M. et al. Crystal growth of ammonium chloride in magnetic levitation conditions. J. Cryst. Growth 209, 1013–1017 (2000).
8. Motokawa, M. et al. Crystal growth and materials processing in the magnetic levitation condition. J. Magn. Magn. Mater. 226–230,
2090–2093 (2001).
9. Li, M., Nagashio, K. & Kuribayashi, K. On occurrence of multiple-site crystallization in undercooled mullite melts. Scr. Mater. 45,
1431–1437 (2001).
10. Arai, Y., Aoyama, T. & Yoda, S. Spherical sapphire single-crystal synthesis by aerodynamic levitation with high growth rate. Rev.
Sci. Instrum. 75, 2262–2265 (2004).
11. Lü, P., Zhou, K. & Wang, H. P. Evidence for the transition from primary to peritectic phase growth during solidification of under-
cooled Ni-Zr alloy levitated by electromagnetic field. Sci. Rep. 6, 39042 (2016).
12. Cao, H.-L. et al. Rapid crystallization from acoustically levitated droplets. J. Acoust. Soc. Am. 131, 3164–3172 (2012).
13. Beitz, E., Blum, J., Mathieu, R., Pack, A. & Hezel, D. C. Experimental investigation of the nebular formation of chondrule rims
and the formation of chondrite parent bodies. Geochim. Cosmochim. Acta 116, 41–51 (2013).
14. Mishra, B., Manvar, P., Choudhury, K., Karagadde, S. & Srivastava, A. Experiments to understand crystallization of levitated high
temperature silicate melt droplets under low vacuum conditions. Sci. Rep. 10, 1–14 (2020).
15. Pack, A., Kremer, K., Albrecht, N., Simon, K. & Kronz, A. Description of an aerodynamic levitation apparatus with applications
in earth sciences. Geochem. Trans. 11, 1–16 (2010).
16. Jones, R. H., Grossman, J. N. & Rubin, A. E. Chemical mineralogical and isotopic properties of chondrules: Clues to their origin.
Chondrite Protoplanetary Disk 341, 251–285 (2005).
Scientific Reports | (2021) 11:13666 | https://doi.org/10.1038/s41598-021-93135-6 12
Vol:.(1234567890)www.nature.com/scientificreports/
17. Tsukamoto, K., Satoh, H., Takamura, Y. & Kuribayashi, K. A new approach for the formation of olivine-chondrules by aero-acoustic
levitation. Antarct. Meteorites 24, 179 (1999).
18. Tsukamoto, K., Kobatake, H., Nagashima, K., Satoh, H. & Yurimoto, H. Crystallization of cosmic materials in microgravity. Lunar
Planet. Sci. 31, 1846 (2001).
19. Libourel, G. & Portail, M. Chondrules as direct thermochemical sensors of solar protoplanetary disk gas. Sci. Adv. 4, eaar3321
(2018).
20. Tsuchiyama, A. & Nagahara, H. Effect of precooling thermal history and cooling rate on the texture of chondrules: A preliminary
report. Mem. Nat. Inst. Polar Res. 20, 175 (1981).
21. Nicollet, C., Faure, F., Schiano, P., Soulestin, B. & Trolliard, G. Textural evolution of polyhedral olivine experiencing rapid cooling
rates. Contrib. Mineral. Petrol. 153, 405–416 (2006).
22. Faure, F., Trolliard, G., Nicollet, C. & Montel, J. M. A developmental model of olivine morphology as a function of the cooling rate
and the degree of undercooling. Contrib. Mineral. Petrol. 145, 251–263 (2003).
23. Faure, F. & Schiano, P. Experimental investigation of equilibration conditions during forsterite growth and melt inclusion forma-
tion. Earth Planet. Sci. Lett. 236, 882–898 (2005).
24. Miura, H. et al. Cathodoluminescence microcharacterization of forsterite in the chondrule experimentally grown under super
cooling. J. Lumin. 132, 1041–1047 (2011).
25. Tsuchiyama, A., Osada, Y., Nakano, T. & Uesugi, K. Experimental reproduction of classic barred olivine chondrules: Open-system
behavior of chondrule formation. Geochim. Cosmochim. Acta 68, 653–672 (2004).
26. Lofgren, G. & Russell, W. J. Dynamic crystallization of chondrule melts of porphyritic and radial pyroxene composition. Geochim.
Cosmochim. Acta 50, 1715–1726 (1986).
27. Tsuchiyama, A., Nagahara, H. & Kushiro, I. Experimental reproduction of textures of chondrules. Earth Planet. Sci. Lett. 48,
155–165 (1980).
28. Nelson, L. S., Blander, M., Skaggs, S. R. & Keil, K. Use of a C O2 laser to prepare chondrule-like spherules from supercooled molten
oxide and silicate droplets. Earth Planet. Sci. Lett. 14, 338–344 (1972).
29. Shete, G., Karagadde, S. & Srivastava, A. Morphological transition of silicate crystals solidified from highly undercooled aerody-
namically levitated melt droplets. SN Appl. Sci. 3, 1–14 (2021).
30. Nagashima, K., Moriuchi, Y., Tanaka, K. K. & Tsukamoto, K. In situ observation of radial pyroxene chondrule formation from
levitated melts. Goldschmidt Conf. Abstr. (2007).
31. Tangeman, J. A. et al. Vitreous forsterite (Mg2SiO4): Synthesis, structure, and thermochemistry. Geophys. Res. Lett. 28, 2517–2520
(2001).
32. Nagashima, K., Tsukamoto, K., Satoh, H., Kobatake, H. & Dold, P. Reproduction of chondrules from levitated, hypercooled melts.
J. Cryst. Growth 293, 193–197 (2006).
33. Watanabe, K., Nagayama, K. & Kuribayashi, K. Morphological transition in crystallization of Si from undercooled melt. In J. Phys.
327, 012018 (2011).
34. Kuribayashi, K., Ozawa, S., Nagayama, K. & Inatomi, Y. Crystallization kinetics in Si-1 at%Sn during rapid solidification in under-
cooled melt. J. Cryst. Growth 468, 73–78 (2017).
35. Richet, P. & Bottinga, Y. Thermochemical properties of silicate glasses and liquids’ a review. Rev. Geophys. 24, 1–25 (1986).
36. Maeda, K. & Yasumori, A. Effect of molybdenum and tungsten oxides on nucleation and crystallization behaviors of MgO-Al2O3-
SiO2 glasses. J. Non. Cryst. Solids 427, 152–159 (2015).
37. Lane, M. D. et al. Midinfrared spectroscopy of synthetic olivines: Thermal emission, specular and diffuse reflectance, and attenu-
ated total reflectance studies of forsterite to fayalite. J. Geophys. Res. E Planets 116, 1–20 (2011).
Acknowledgements
This project was supported by Department of Science and Technology (DST), India under the Swarnajayanti
Fellowship scheme (Grant ID: RD/0115-DSTFL80-005). The authors acknowledge the support received from
DST, India. GS is grateful to Dasari Naveen and M. Sanjay for assistance with Optical microscopy, SEM and XRD
analysis of the solidified samples at MMMF lab, IIT Bombay.
Author contributions
G.S. performed the experiments reported, characterized the solidified samples and prepared the figures along
with the first draft of the manuscript. S.M. and S.P.K. provided technical inputs during the course of this experi-
mental work and subsequent characterization of the solidified samples. A.S. was responsible for the conceptualing
the research problem statement, planning of experiments, funding acquisition, setting up of the experimental
facility. All the authors equally contributed towards the interpretation of the experimental data and final manu-
script preparation.
Competing interests
The authors declare no competing interests.
Additional information
Correspondence and requests for materials should be addressed to A.S.
Reprints and permissions information is available at www.nature.com/reprints.
Publisher’s note Springer Nature remains neutral with regard to jurisdictional claims in published maps and
institutional affiliations.
Scientific Reports | (2021) 11:13666 | https://doi.org/10.1038/s41598-021-93135-6 13
Vol.:(0123456789)www.nature.com/scientificreports/
Open Access This article is licensed under a Creative Commons Attribution 4.0 International
License, which permits use, sharing, adaptation, distribution and reproduction in any medium or
format, as long as you give appropriate credit to the original author(s) and the source, provide a link to the
Creative Commons licence, and indicate if changes were made. The images or other third party material in this
article are included in the article’s Creative Commons licence, unless indicated otherwise in a credit line to the
material. If material is not included in the article’s Creative Commons licence and your intended use is not
permitted by statutory regulation or exceeds the permitted use, you will need to obtain permission directly from
the copyright holder. To view a copy of this licence, visit http://creativecommons.org/licenses/by/4.0/.
© The Author(s) 2021
Scientific Reports | (2021) 11:13666 | https://doi.org/10.1038/s41598-021-93135-6 14
Vol:.(1234567890)You can also read