ONA - A Song of Ice and Fire - HR Analytics live
←
→
Page content transcription
If your browser does not render page correctly, please read the page content below
ONA - A Song of Ice and Fire
Ricardo Nardaci
18 March 2019
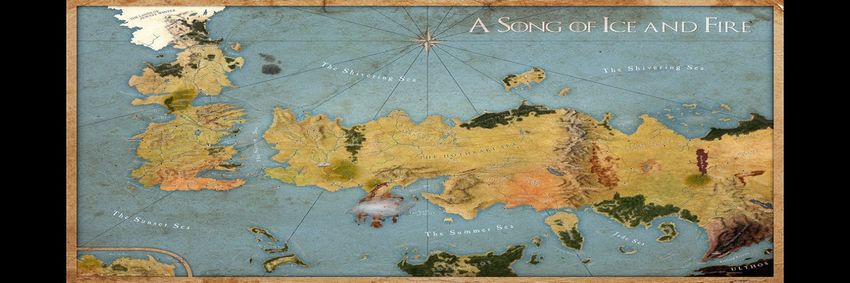
The objective of this markdown is to make an Organizational Network Analysis based on the book “A song of
ice and fire” by R.R.Martin using some graph theory elements to explore more about the characters
connection.
PS: the database does not have information about all books, it’s just a subset of it with 50 edges.
A Song of Ice and Fire
Libraries
Creating graph structure
Analysing Network
Centrality degrees
Clustering nodes
Keyplayer and central characters
Visualization
Conclusion
Libraries
The following packages will be used for our Organizational Network Analysis(ONA):
tidygraph - Used for creating and manipulating graph structures;
ggraph - Used for visualization of graph structures;
tidyverse - Used for reading data and manipulating data;
DT - Used for creating friendly HTML datatable.
library(tidygraph)
library(ggraph)
library(tidyverse)
library(DT)
Creating graph structure
With the use of tidygraph, we can easily create a graph structure as well as get it back to a tibble or data
frame object. First we will create the graph object so we can make our analysis and get it back to data frame
for easier manipulation and visualization.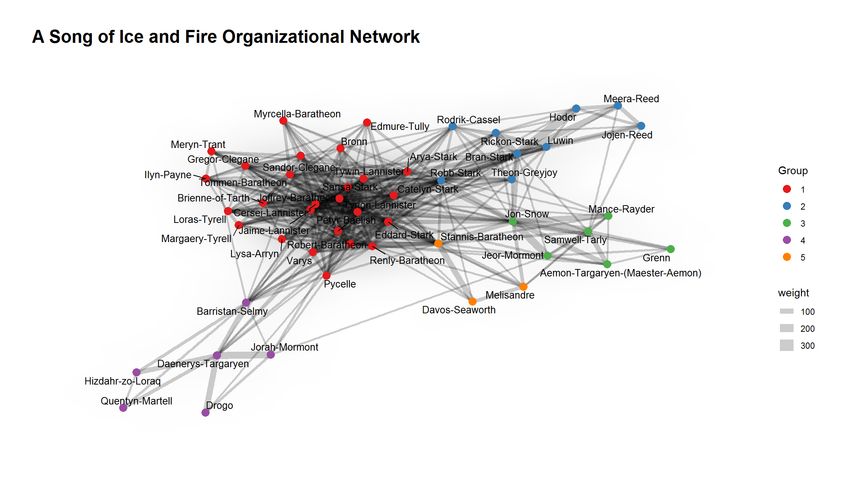
edges%
   activate(edges) %>%
   filter(!edge_is_multiple()) %>%
   mutate(centrality_e = centrality_edge_betweenness())

 df%
 activate(nodes) %>%
 as_tibble()%>%
 data.frame()

So we can dismember this all-in-one graph in centrality degree, distance to center node, clustering and two
logical variables(is it center node? and is it keyplayer node?).

Centrality degrees
Centrality degrees is the number of neighbors a node(in this case, a node is a character) has, so it can show
us who is the most influent as influent characters will have more neighbors than the ordinaries. A good way of
visualizing it is arranging the neighbors of each character in descending order.

 datatable(df%>%
           arrange(desc(Neighbors))%>%
           select(c('name','Neighbors')),filter='top',rownames=F,
                 options=list(dom='ltipr'))
Show 10 entries
name Neighbors
All All
Tyrion-Lannister 36
Robert-Baratheon 33
Joffrey-Baratheon 32
Cersei-Lannister 30
Eddard-Stark 30
Jaime-Lannister 29
Sansa-Stark 29
Robb-Stark 27
Stannis-Baratheon 27
Catelyn-Stark 26
Showing 1 to 10 of 50 entries Previous 1 2 3 4 5 Next
Clustering nodes
Clustering nodes can reveal us(specially when visualizing the graph) groups that are well related between
them. We can get the family name of each character to see if families dominate clusters as it is expected on
Song of Ice and Fire.
df$cont_sepname Family Group
All All All
Joffrey-Baratheon Baratheon 1
Myrcella-Baratheon Baratheon 1
Renly-Baratheon Baratheon 1
Robert-Baratheon Baratheon 1
Stannis-Baratheon Baratheon 5
Tommen-Baratheon Baratheon 1
Rodrik-Cassel Cassel 2
Gregor-Clegane Clegane 1
Showing 1 to 10 of 50 entries Previous 1 2 3 4 5 Next
Keyplayer and central characters
Keyplayer characters are exceptional characters normally those characters can create bridges between
clusters or peripheral characters, without them it would be harder to share thoughts, in this analysis we picked
up the top10 keyplayers. We can simply visualize the keyplayers and the central characters in a table.
datatable(df%>%
filter(Keyplayer==T | Center==T)%>%
select(c('name','Center','Keyplayer')),filter='top',rownames=F,
options=list(dom='ltipr'))
Show 100 entries
name Center Keyplayer
All All All
Aemon-Targaryen-(Maester-
false true
Aemon)
Catelyn-Stark false true
Cersei-Lannister true false
Drogo false true
Eddard-Stark true false
Hizdahr-zo-Loraq false truename Center Keyplayer
All All All
Hodor false true
Joffrey-Baratheon true true
Jon-Snow false true
Pycelle false true
Robert-Baratheon true false
Samwell-Tarly false true
Sandor-Clegane false true
Sansa-Stark true false
Tyrion-Lannister true false
Showing 1 to 15 of 15 entries Previous 1 Next
Visualization
For visualizing the connections with a graph layout we will use the ggraph package. The connections(or
edges) between the nodes will be larger as the weight increases and each node will have its character name
as a label and will be coloured from it respective cluster.
layoutAs seen in the tables above the keycharacters connect groups(and maybe in this graph we can filter it to a lesser group instead of 10) and the clusters are all well distributed Conclusion The ONA is a great solution for a organizational analysis, it’s a trending topic in HR analytics as it can show some keyplayer employees and reveal those peripheral employees that can be great developers and don’t pass their knowledge forward, it’s a great tool for managers so they can know better their team, discover essential employees for their team and even help them in decision making besides some of the information from this ONA can even be helpful when used in models for prediction. Although there’s a lot more to explore on this area, I hope you enjoyed this analysis.
You can also read