Online Monitoring of Torpedo Car Shells Based on Equal Angle Scanning

Page created by Annie Nelson
 
CONTINUE READING
Online Monitoring of Torpedo Car Shells Based on Equal Angle Scanning
applied
              sciences
Article
Online Monitoring of Torpedo Car Shells Based on Equal
Angle Scanning
Yumei Tang * and Kefu Liu

                                          School of Information Science and Technology, Fudan University, No. 220 Handan Road, Shanghai 200433, China;
                                          kfliu@fudan.edu.cn
                                          * Correspondence: 19110720076@fudan.edu.cn

                                          Abstract: Infrared sensors are being applied more and more widely in industrial production appli-
                                          cations. Based on the theory of thermal radiation, this paper discusses the system design principle,
                                          temperature calibration method, and thermal image analysis method in detail. The system passed
                                          the measurement unit certification, showing that the field of view is 180◦ , the number of scanning
                                          points is 2048, the linear velocity is 10–100 Hz, the spatial resolution is 2.5 mrad, and the precision
                                          is ±1 ◦ C. An online monitoring test of torpedo car was carried out in the steelmaking plant of Bao
                                          Steel. The results show that the system has strong anti-interference ability, stability, and reliability,
                                          and meets the application requirements of online monitoring.

                                          Keywords: infrared sensors; calibration model; online monitoring; torpedo car

                                          1. Introduction
                                      The torpedo car is a very important large-scale molten iron transportation equipment
         
                                          in the steel industry. It is a torpedo-type molten iron tank used in a large blast furnace.
Citation: Tang, Y.; Liu, K. Online        It is also called a mixed iron car. It has good insulation conditions, small heat loss, and
Monitoring of Torpedo Car Shells
                                          insulation time. Furthermore, it is energy saving and enduring. Because of the large
Based on Equal Angle Scanning. Appl.
                                          volume of the car, it can also store molten iron to coordinate the temporary imbalance
Sci. 2021, 11, 8053. https://doi.org/
                                          of ironmaking and steelmaking. At the same time, it can replace the steel-making mixer
10.3390/app11178053
                                          and ordinary molten iron car to complete desulfurization, dephosphorization, and other
                                          operations during the transportation of molten iron [1,2].
Academic Editor: Carosena Meola
                                                The lining may crack, bulge, and spall due to chemical erosion, mechanical erosion,
Received: 17 July 2021
                                          and rapid cooling and heating. Due to its high cost of maintenance, repair, and replacement,
Accepted: 25 August 2021
                                          continuous monitoring and temperature detection are required to assess the lining of the
Published: 30 August 2021                 torpedo car. When the refractory material is locally damaged severely but not found, it
                                          will cause a serious accident [3,4].
Publisher’s Note: MDPI stays neutral
                                                Infrared thermography (IRT) is a science dedicated to the acquisition and processing
with regard to jurisdictional claims in   of thermal information from non-contact measurement devices [5]. It is an effective, fast,
published maps and institutional affil-   and noncontact measurement technology that is especially suitable for measuring the
iations.                                  temperature of moving objects [6–8]. To our knowledge, the traditional measurement
                                          method is commonly used in the steel industry; that is, the relevant staff carry portable
                                          infrared instruments to detect the quantity of torpedo cars on the transportation railway [9].
                                          Not only is this method labor intensive, but also the measurement results are not stable,
Copyright: © 2021 by the authors.
                                          especially in hot or rainy and snowy weather. In order to improve the efficiency of
Licensee MDPI, Basel, Switzerland.
                                          monitoring and measurement stability, and effectively reduce the labor intensity of related
This article is an open access article    operators, online infrared sensors are wanted for scanning and imaging [10,11].
distributed under the terms and                 In this work, based on equal angle scanning, a 3–5 µm infrared scanner is designed. A
conditions of the Creative Commons        temperature calibration model is proposed and the panoramic thermal image of the torpedo
Attribution (CC BY) license (https://     car is obtained. Furthermore, an online monitoring analysis system for the temperature
creativecommons.org/licenses/by/          field of the torpedo car is developed. The inner lining thickness is simulated by thermal
4.0/).

Appl. Sci. 2021, 11, 8053. https://doi.org/10.3390/app11178053                                               https://www.mdpi.com/journal/applsci
Online Monitoring of Torpedo Car Shells Based on Equal Angle Scanning
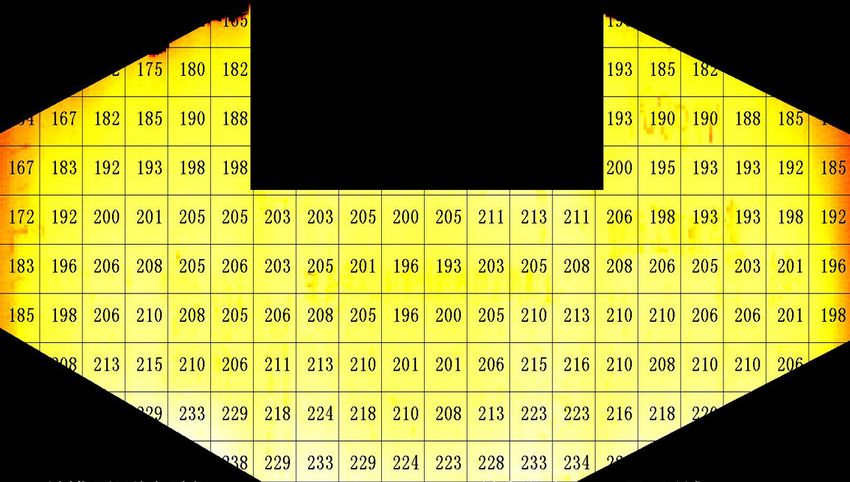
Appl. Sci. 2021, 11, 8053                                                                                               2 of 9

                            map, and the temperature map is drawn according to the body shell size. Finally, the safety
                            alarm and accurate positioning are realized.

                            2. Theory and Method
                            2.1. Infrared Radiation Theory
                                 According to Planck’s law of black body radiation [12], as long as the temperature
                            of any object in nature is higher than absolute zero (−273.15 ◦ C), it will emit energy in
                            the form of electromagnetic radiation in a very wide range of wavelengths, generating
                            electromagnetic waves (radiation energy). Different materials, different temperatures,
                            different surface brightness, different colors, etc., emit different infrared radiation intensity.
                            Planck’s radiation law gives the specific spectral distribution of blackbody radiation. At a
                            certain temperature, the energy radiated by a blackbody per unit area in unit time, unit
                            solid angle, and unit wavelength interval is:

                                                                         2hc2     1
                                                             B(λ, T) =     5
                                                                              ·   hc
                                                                                                                          (1)
                                                                          λ exp( λKT ) − 1

                                                                             −2    −1 −1
                                                            8    − 1
                                                                      (W − m −Sr −µm )
                                 B(λ, T)—Blackbody’s spectral radiance
                                 c—Speed of light 2.998 ∗ 10 m·s
                                 T—Absolute temperature of blackbody (K, T = t + 273)
                                                              −34
                                 h—Planck constant 6.626 ∗ 10 J· s)       
                                 K—Boltzmann constant 1.380 ∗ 10−23 J·K−1
                                 At a certain temperature, the spectral radiance of a black body has an extreme value,
                            and the position of this extreme value is related to the temperature. This is the Wien
                            displacement law (Wien) [13]:

                                                                λm × T = 2898(µm · K)                                     (2)

                                 λm —Wavelength at maximum blackbody spectral radiance
                                 T—Absolute temperature of blackbody (K, T = t + 273)
                                 The normal temperature range of the shell of the torpedo car is 100–500 ◦ C, so we
                            choose a medium-wave infrared detector (3–5 µm), probing to achieve the maximum
                            signal-to-noise ratio.
                                 According to Planck’s Formula (1), we put forward the voltage response model of the
                            infrared detector (3):
                                                                        A
                                                           U=           B
                                                                                 −C                               (3)
                                                                exp( t+273.2 )−1
                                 Here, t is the target radiation temperature, U is the voltage signal output by the
                            detector, and A, B, C are the correlation coefficients.

                            2.2. System Design
                                 As is shown in Figure 1, we design a high-speed line scan infrared temperature mea-
                            surement system, which uses synchronous motor scanning and real-time image processing
                            to realize the reconstruction and visualization of the two-dimensional temperature field
                            of the moving target. It is composed of a refrigerated infrared temperature measurement
                            module and a DC brushless motor synchronous scanning module, high-speed signal ac-
                            quisition and processing module, computer real-time image splicing, and other technical
                            components. The infrared sensor mainly receives the radiant energy emitted by the mea-
                            sured object, focuses it on the detector through the receiving lens, completes the conversion
                            of the optical signal to the electrical signal, and then obtains the voltage value by low noise
                            amplifier, filtering, and analog-to-digital conversion.
Online Monitoring of Torpedo Car Shells Based on Equal Angle Scanning
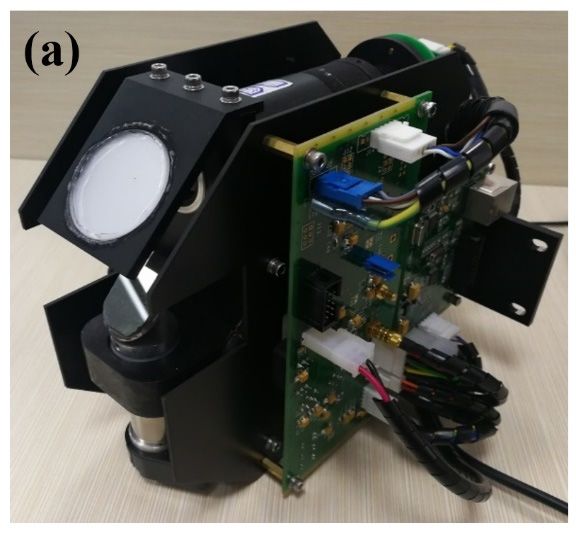
components. The infrared sensor mainly receives the radiant energy emitted by the meas-
Appl. Sci. 2021, 11, 8053
                            ured object, focuses it on the detector through the receiving lens, completes the conversion  3 of 9
                                                                 SERVER
                            of the optical signal to the electrical signal, and then obtains the voltage value
                                                                                                         TARGETby low noise
                            amplifier, filtering, and analog-to-digital conversion.

                                                RTU
                                                           SERVER                                       TARGET

                                                                                                Lens
                                                                       TEC-MCT
                                                                                             (f=100mm)
                                          RTU                         (d=0.25mm)
                                                                                                                Mirror

                                                                                        Blackbody
                                                                                SAR
                                                                TEC-MCT
                                                                                ADC
                                                                                Lens
                                                                                                                Mirror
                                                                             (f=100mm)
                                                               (d=0.25mm)
                                                                                             Mirror

                                        RTU                          SAR
                                                                            Blackbody
                                                                                           Motor Motor
                                                                TCP/IPADC    FPGA
                                                                             &PHY          Driver
                                                                                           Mirror

                                                                                                      Encoder
                                  RTU                                        Motor Motor
                                                      TCP/IP       FPGA
                                                                   &PHY      Driver

                                                                                   Encoder
                              Figure 1. System block.

                            Figure 1.In
                               Figure  1.Figure
                                      System     2, the SAR ADC sampling module obtains the voltage signal of the i
                                             block.
                                         System block.
                              detector [−5 V, +5 V] and converts it into absolute voltage in the range of [0–5].
                                    In Figure
                                 In Figure      2, the
                                            2, the  SARSAR ADC
                                                         ADC     sampling
                                                              sampling       module
                                                                          module     obtains
                                                                                  obtains thethe  voltage
                                                                                              voltage     signal
                                                                                                       signal     of the
                                                                                                              of the     infrared
                                                                                                                      infrared
                               detector [ − 5 V, +5  V] and    V it+into
                                                            converts
                            detector [−5 V, +5 V] and converts        5 absolute voltage in the range of [0–5].
                                                                      it into absolute voltage in the range  of [0–5].
                                                          V =        in
                                                                              −V        = adc _ data − V , Vin ∈ [ −5, + 5]
                                                         V Vo+ 5+ 5 2          ref                         ref
                                                  VVo o== in in − V−refVref
                                                                        = adc  _ data −−Vref
                                                                            = adc_data   Vref, Vin  ∈∈
                                                                                                , Vin [ −[− + 5]
                                                                                                         5, 5, +5]             (4) (4)
                                                            22
                              where Vo is the digital output voltage, Vin is the AD sampling output voltage, and
                               where
                            where  Vo V   is the
                                      isothe     digital
                                              digital    output
                                                      output    voltage,
                                                                      VinVisinthe
                                                                               is the
                                                                                   ADAD sampling output  voltage,
                                                                                                               andand
                                                                                                                   VrefVis
                                                                                                                        ref is
                              the  reference     voltage   ofvoltage,
                                                              ADC.                    sampling output voltage,
                            thethe reference
                                reference     voltage
                                           voltage     of ADC.
                                                    of ADC.

                            Figure 2. ADC
                               Figure      sample
                                       2. ADC     based
                                              sample    on equal
                                                     based       angle
                                                           on equal    scanning.
                                                                    angle scanning.
                              Figure 2. ADC sample based on equal angle scanning.
                                  Figure
                                     Figure3a 3a
                                               is isthe
                                                      theproposed
                                                           proposed infrared scanner
                                                                                scannerbased
                                                                                          basedonon  equal
                                                                                                  equal    angle
                                                                                                        angle     scanning.
                                                                                                              scanning.  As isAs  is
                                                                                                                               shown
                            shown   in
                               in FigureFigure
                                     Figure      3b,
                                            3b, in     in
                                                 3aorderis order to compensate
                                                             to compensate
                                                            the  proposed     for  for the
                                                                                   the
                                                                               infrared    influence
                                                                                       influence     ofbased
                                                                                                       background
                                                                                                 of background
                                                                                            scanner                 radiation,
                                                                                                               onradiation,
                                                                                                                   equal    wewe
                                                                                                                           angle carry
                                                                                                                                     scanning
                            carry
                               out out  real-time
                                    real-time         temperature
                                                 temperature          correction
                                                                    correction    through
                                                                               through      background
                                                                                          background     sampling.The
                                                                                                       sampling.    Thekey
                                                                                                                        keytechnical
                                                                                                                              tech-
                              shown in Figure 3b, in order to compensate for the influence of background radiat
                            nical index
                               index      is listed
                                       is listed  in in   Table
                                                       Table  1. 1.
                              carry out real-time temperature correction through background sampling. The ke
                              nical  index
                               Table 1.       is listed
                                        Key technical    in of
                                                      index Table    1. scanner.
                                                               infrared

                                                   Parameter                                                         Value
                                                wavelength range                                                     3–5 µm
                                                       FOV                                                            180◦
                                                   focal length                                                     100 mm
                                                pixel number/line                                                     2048
                                                  sampling rate                                                     500 kSPS
                                                    scan speed                                                     10–100 Hz
                                                     precision                                                        ±1 ◦ C
                                                spatial resolution                                                  2.5 mrad
Online Monitoring of Torpedo Car Shells Based on Equal Angle Scanning
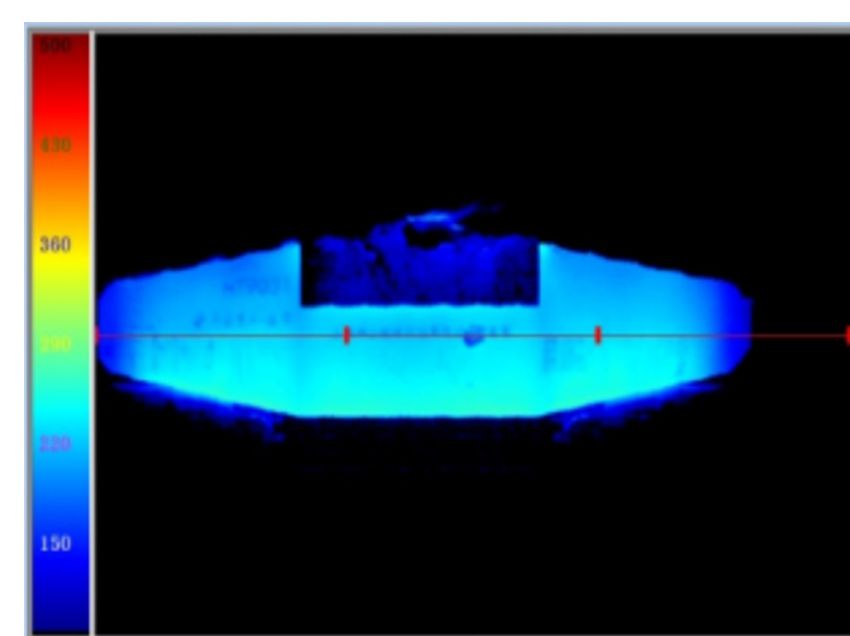
Appl. Sci. 2021, 11, 8053                                                                                                                           4 of 9
  Appl. Sci. 2021, 11, x FOR PEER REVIEW                                                                                                          4 of 9

                                                                    (b)                      START

                                                                                    (cnt_409610
                                                                                        cnt_4096=14'd1600
                                                                                                                          Vref_temp
Online Monitoring of Torpedo Car Shells Based on Equal Angle Scanning
330                                                    2.1
                                                  340                                                    2.3
                                                  350                                                    2.5
                                                  380                                                   3.25
Appl. Sci. 2021, 11, 8053                         400                                                    3.8                       5 of 9
                                                  450                                                   5.45

                                  According to Formula (3), we can obtain the temperature inversion Formula (5) of
                                  According tomeasurement
                             the temperature   Formula (3), we can obtain the temperature inversion Formula (5) of the
                                                            system:
                            temperature measurement system:
                                                                              B
                                                                     t=     BA         − 273.2
                                                                  t = log(A          − 273.2                                          (5)
                                                                                                                                     (5)
                                                                      log( U+     + 1)
                                                                            UC++C1)
                                   As
                                   As is
                                       is shown
                                          shown in
                                                 in Figure
                                                    Figure4,
                                                           4, we
                                                              we use
                                                                 use the
                                                                     the Matlab
                                                                         Matlab R2016a
                                                                                 R2016acurve
                                                                                         curvefitting
                                                                                                 fittingtool
                                                                                                         toolto
                                                                                                              toperform
                                                                                                                performcurve
                                                                                                                         curve
                            fitting
                             fitting on
                                     on Formula (3), and
                                                       and obtain
                                                            obtainthe
                                                                   thecorrelation
                                                                        correlationcoefficients:
                                                                                    coefficients:AA= 631.2,
                                                                                                       = 631.2,
                                                                                                             B =B3444,
                                                                                                                  = 3444,
                                                                                                                       andand
                                                                                                                           C=
                            C  = 0.002758.
                             0.002758.

                            Figure4.
                            Figure 4. Curve
                                      Curve fitting
                                             fitting of
                                                     oftemperature
                                                        temperaturevoltage
                                                                   voltageresponse
                                                                           responsemodel.
                                                                                   model.

                                 The
                                 The ADC(AD7321, ADI)   ADI) input    rangeisis±5±V,
                                                                inputrange         5 V,
                                                                                     thethe full-scale
                                                                                         full-scale    range
                                                                                                    range is 10isV10with
                                                                                                                     V with
                                                                                                                         8192
                            8192 codes,
                            codes,       andLSB
                                   and the    the size
                                                  LSB is
                                                       size is mV.
                                                         1.22  1.22 mV.
                                 Here,
                                 Here,wewedefine
                                            defineK(t)
                                                    K(t)as
                                                         asdt/dU           Temperature of resolution is ∆T
                                                            dt/dU = K(t). Temperature                     ∆T == K(t) ∗∗ LSB..
                                 Table 3 is the temperature    resolution in different ranges.
                                 Table 3 is the temperature resolution in different ranges.

                            Table3.3.Temperature
                            Table     Temperatureresolution
                                                  resolutioninindifferent
                                                                 differenttemperature
                                                                           temperatureranges.
                                                                                       ranges.

                                  t/°C t/◦ C            U/V       U/V        dt/dU          dt/dU                Resolution/◦ C
                                                                                                           Resolution/°C
                                  100                   0.06                 646.02                             0.8
                                       100                        0.06                      646.02                     0.8
                                  200 200               0.42      0.42       152.38         152.38              0.2    0.2
                                  300 300               1.55      1.55        61.25          61.25             0.07 0.07
                                  400 400                3.8       3.8        34.37          34.37              0.04 0.04
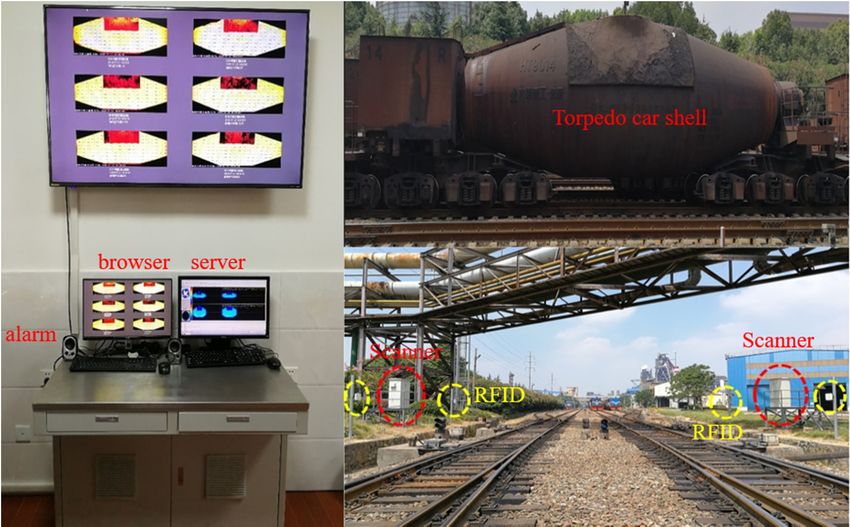
                             3. Experiments
                            3.    Experiments
                                      As isisshown
                                     As        shownininFigure
                                                           Figure  5, the
                                                                5, the  mainmain    equipment
                                                                                equipment        at monitoring
                                                                                            at the   the monitoring    site includes
                                                                                                                 site includes        two
                                                                                                                                two scan-
                             scanners        (in  the  red dashed   line  ellipse   in Figure  5); four  RFID  antennas
                            ners (in the red dashed line ellipse in Figure 5); four RFID antennas (in the yellow dashed    (in the yellow
                             dashed
                            line    circlelinein circle
                                                 Figurein3);
                                                           Figure  3); andtags
                                                             and RFID        RFID    tags installed
                                                                                  installed          on the torpedo
                                                                                            on the torpedo    car (eachcartorpedo
                                                                                                                            (each torpedo
                                                                                                                                    car is
                             car is equipped
                            equipped                 withRFID
                                              with four    four RFID    tags,tags
                                                                tags, two      two both
                                                                                     tags both
                                                                                          on theonfront
                                                                                                    the front and back
                                                                                                         and back         sides).
                                                                                                                    sides).   The The sys-
                                                                                                                                  system
                             tem     collects,   calculates, and  transmits     temperature   data   on the shell surface,
                            collects, calculates, and transmits temperature data on the shell surface, and transmits        and transmits
                            itit to
                                  to the
                                      thecentral
                                           centralcontrol
                                                      controlroom
                                                              roomthrough
                                                                     throughan   anoptical
                                                                                     opticalfiber
                                                                                             fibernetwork.
                                                                                                    network.The
                                                                                                              Thesoftware
                                                                                                                    softwareadopts
                                                                                                                               adoptsthe
                                                                                                                                       the
                            B/S(Browser/Server) architecture. The main equipment in the central control room is
                            the temperature data server and the large-screen display platform in the console. The
                            large-screen display platform is used for real-time display, and the temperature data server
                            can be used for offline data analysis.
Online Monitoring of Torpedo Car Shells Based on Equal Angle Scanning
Appl. Sci. 2021, 11, x FOR PEER REVIEW                                                                                                                            6 of 9

                                                 B/S(Browser/Server) architecture. The main equipment in the central control room is the
    Appl. Sci. 2021, 11, 8053                    temperature data server and the large-screen display platform in the console. The large-
                                                                                                                                      6 of 9
                                                 screen display platform is used for real-time display, and the temperature data server can
                                                 be used for offline data analysis.
        Appl. Sci. 2021, 11, x FOR PEER REVIEW                                                                                             6 of 9

                                          B/S(Browser/Server) architecture. The main equipment in the central control room is the
                                          temperature data server and the large-screen display platform in the console. The large-
                                          screen display platform is used for real-time display, and the temperature data server can
                                          be used for offline data analysis.

                                                 Figure 5.
                                                 Figure 5. Online
                                                           Online monitoring
                                                                  monitoring application.
                                                                             application.

                                               4.
                                               4.5.Results
                                          Figure            and
                                                            and Discussion
                                                   Online monitoring
                                                   Results           application.
                                                                  Discussion
                                                 4.1. Real Time Analysis of
                                               4.1. Real
                                          4. Results     Time Analysis
                                                     and Discussion      of Heat
                                                                            Heat Map
                                                                                 Map
                                                      As
                                          4.1. Real Time is
                                                         is shown
                                                      AsAnalysis
                                                            shown     in
                                                                 of Heat Figure
                                                                         Figure 6a,
                                                                      inMap     6a, the
                                                                                    the length
                                                                                         length of
                                                                                                of the
                                                                                                    the torpedo
                                                                                                         torpedo car
                                                                                                                 car is
                                                                                                                      is 14.5
                                                                                                                         14.5 m,
                                                                                                                              m, the
                                                                                                                                  the speed
                                                                                                                                       speed of
                                                                                                                                             of the
                                                                                                                                                 the
                                                torpedo
                                                As   is shown
                                                torpedo       car
                                                              carinwith
                                                                      Figuretwo
                                                                     with          tanks
                                                                               6a, the
                                                                             two             isisabout
                                                                                        length
                                                                                    tanks         of      88km/h
                                                                                                     the torpedo
                                                                                                  about       km/h car(normally     6–10
                                                                                                                        is 14.5 m, the
                                                                                                                       (normally           km/h),
                                                                                                                                        speed
                                                                                                                                     6–10      of the and
                                                                                                                                             km/h),   and scanning
                                                                                                                                                           scanning time
                                                                                                                                                                      time is
                                                                                                                                                                            is
                                                about
                                          torpedo          6.6 s.
                                                     car with    two As    is shown
                                                                        tanks  is about is   Figure
                                                                                          8 km/h         6b, if 6–10
                                                                                                    (normally    the km/h),
                                                                                                                      line speed      is 20 ms,
                                                                                                                               and scanning   timethe
                                                                                                                                                    is image resolution is
                                                about
                                          aboutno 6.6less
                                                           6.6
                                                       s. Asthan
                                                                s.  As
                                                             is shown
                                                                          is shown      is  Figure     6b,  if the  line   speed   is  20 ms,   the  image  resolution  is no
                                                                     330isline.
                                                                             FigureIf 6b,
                                                                                      theifline
                                                                                             the line  speedisisset
                                                                                                   speed         20 ms,
                                                                                                                    as 10thems,
                                                                                                                             image  resolution
                                                                                                                                  the   image isresolution
                                                                                                                                                   no        is no less than
                                                less330
                                          less than     than
                                                           line.330    line.
                                                                  If the  lineIf the isline
                                                                               speed          speed
                                                                                          set as  10 ms,isthe
                                                                                                           setimage
                                                                                                                as 10resolution
                                                                                                                        ms, theisimage
                                                                                                                                    no less resolution
                                                                                                                                            than 660     is no less than 660
                                                660 line.
                                          line. line.

Appl. Sci. 2021, 11, x FOR PEER REVIEW                                                                                            7 of 9

                                                                                           (a)

                                                                                                             (a)

                                                                                   (b)
                                  Figure 6. (a) Mechanical
                                                Figure 6. diagram of 320 t torpedo
                                                           (a) Mechanical          car, (b)
                                                                             diagram     of thermal imaging. car,
                                                                                             320 t torpedo          (b) thermal imaging.
                                        As is shown in Figure 7, we use the pseudo-color to describe the surface temperature
                                  field distribution on the two sides of the torpedo car. By comparing the temperature cor-
                                  responding to the color scale on the left, the temperature and relative height of each sur-
                                  face position can be visually distinguished from the figure. Through the temperature in-
                                  formation fed back from the graph, it is analyzed and inferred whether the torpedo tank
                                  body lining is damaged, whether there is sediment at the bottom, etc., as well as the spe-
                                  cific geometric dimensions and precise physical location on the surface of the torpedo car
Appl. Sci. 2021, 11, 8053                                                                                                                        7 of 9
                                                                                               (b)
                                         Figure 6. (a) Mechanical diagram of 320 t torpedo car, (b) thermal imaging.

                                         As isAsshown
                                                  is shownin Figure    7, we
                                                               in Figure   7, use  the pseudo-color
                                                                              we use      the pseudo-color  to describe   the surface
                                                                                                                 to describe             temperature
                                                                                                                               the surface    temperature
                                  fieldfield
                                         distribution      on   the two    sides  of   the    torpedo     car.  By   comparing
                                              distribution on the two sides of the torpedo car. By comparing the temperature cor- the   temperature
                                  corresponding
                                       responding to    to the
                                                            the color
                                                                 color scale
                                                                        scale on
                                                                               on the
                                                                                  the left,     the temperature
                                                                                         left, the    temperature and and relative
                                                                                                                           relative height
                                                                                                                                      height ofofeach
                                                                                                                                                  eachsur-
                                  surface   position     can  be  visually   distinguished         from   the  figure. Through
                                       face position can be visually distinguished from the figure. Through the temperature in-    the  temperature
                                  information
                                       formation   fed  back
                                                      fed  backfrom
                                                                  fromthethe
                                                                           graph,
                                                                              graph,it isitanalyzed
                                                                                            is analyzed  andand
                                                                                                             inferred   whether
                                                                                                                  inferred  whetherthe the
                                                                                                                                        torpedo   tanktank
                                                                                                                                             torpedo
                                  body   lining
                                       body       is damaged,
                                               lining   is damaged,whether    therethere
                                                                         whether     is sediment       at the at
                                                                                              is sediment      bottom,  etc., asetc.,
                                                                                                                 the bottom,     wellasaswell
                                                                                                                                           the specific
                                                                                                                                                as the spe-
                                  geometric     dimensions       and  precise   physical     location    on the  surface  of
                                       cific geometric dimensions and precise physical location on the surface of the torpedothe torpedo     car when car
                                  the above
                                       when the above situation occurs. Based on the heat transfer model and boundary[14],
                                                situation    occurs.  Based    on the   heat    transfer   model    and boundary     conditions      condi-
                                  we perform
                                       tions [14], linear  mapping,
                                                      we perform         which
                                                                      linear     can simulate
                                                                               mapping,       which  thecan
                                                                                                          radial  temperature
                                                                                                            simulate             distribution
                                                                                                                        the radial   temperature of the
                                                                                                                                                     distri-
                                  car shell,
                                       butionproviding
                                                 of the car ashell,
                                                                 basisproviding
                                                                        for the design
                                                                                    a basisoffor refractory
                                                                                                    the design linings  and the linings
                                                                                                                  of refractory   establishment
                                                                                                                                            and the of
                                                                                                                                                     estab-
                                  accurate    heatof
                                       lishment      transfer
                                                       accurate  models.
                                                                   heat transfer models.

                    (a) Thermal imaging on the two sides                                          (b) axial temperature profile.
                                             Figure
                                         Figure     7. Thermal
                                                7. Thermal     imaging
                                                           imaging and and
                                                                       axialaxial temperature
                                                                             temperature      profile.
                                                                                         profile.

                                  4.2. 4.2. Statistical
                                       Statistical       Analysis
                                                   Analysis        of Heat
                                                               of Heat MapMap
Appl. Sci. 2021, 11, x FOR PEER REVIEW  As isAs  is shown
                                              shown           in Figure
                                                        in Figure        8, image
                                                                   8, image         reconstruction
                                                                             reconstruction and unitand  unit segmentation
                                                                                                     segmentation           (20 ×8 10
                                                                                                                                   of 9ele-
                                                                                                                  (20 × 10 elements)
                                       ments) are based
                                  are performed      performed
                                                             on thebased
                                                                     axialon  the axial temperature
                                                                           temperature   data and thedata and the
                                                                                                       physical   physical
                                                                                                                model of themodel
                                                                                                                             shell. of the
                                       shell.

                                  Figure8.
                                  Figure 8. Image
                                             Image reconstruction
                                                    reconstructionof
                                                                  oftorpedo
                                                                     torpedocar.
                                                                             car.

                                       Each
                                        Each unit
                                                unit is
                                                      is preset
                                                         preset to
                                                                 toaalimit
                                                                      limitvalue
                                                                            valueof    350◦°C.
                                                                                    of350  C. Whenever
                                                                                               Wheneveraatemperature
                                                                                                           temperaturevalue
                                                                                                                        valuehigher
                                                                                                                               higher
                                  than
                                   than this
                                         this preset
                                               presetvalue
                                                       valueisisread,
                                                                 read,the
                                                                        thesystem
                                                                            systemoutputs
                                                                                     outputsthe
                                                                                              thehigh-temperature
                                                                                                  high-temperaturealarm
                                                                                                                   alarmstatus,
                                                                                                                          status,and
                                                                                                                                  and
                                  displays
                                   displays the
                                              the temperature
                                                   temperature value
                                                                   value table
                                                                          table of
                                                                                of each
                                                                                   each unit
                                                                                         unit on
                                                                                              onthe
                                                                                                 themonitor
                                                                                                     monitorscreen,
                                                                                                             screen,and
                                                                                                                     andinforms
                                                                                                                         informsthethe
                                  operator
                                   operator ofof aa“high
                                                    “hightemperature”
                                                            temperature”alarm
                                                                            alarmby byvoice.
                                                                                       voice.

                                  5. Conclusions
                                       Based on the theory of thermal radiation, this paper discusses the system design prin-
                                  ciple, temperature calibration method, and thermal image analysis method in detail. The
                                  system has passed the measurement unit certification, showing that the field of view is
                                  180°, the number of scanning points is 2048, the linear velocity is 10–100 Hz, the spatial
                                  resolution is 2.5 mrad, and the precision is ±1 °C.
Appl. Sci. 2021, 11, 8053                                                                                                       8 of 9

                                 5. Conclusions
                                       Based on the theory of thermal radiation, this paper discusses the system design
                                 principle, temperature calibration method, and thermal image analysis method in detail.
                                 The system has passed the measurement unit certification, showing that the field of view is
                                 180◦ , the number of scanning points is 2048, the linear velocity is 10–100 Hz, the spatial
                                 resolution is 2.5 mrad, and the precision is ±1 ◦ C.
                                       The temperature of the torpedo car shell is 100–500 degrees Celsius. Low-cost area
                                 array thermal imaging cameras mainly use uncooled long-wave infrared technology
                                 (8–14 microns). There are phenomena such as large temperature measurement errors
                                 in high-temperature sections, inaccurate data, and poor environmental adaptability [15,16].
                                 According to Wien’s law, to accurately measure the temperature, the mid-wave infrared
                                 imaging technology can obtain the best performance.
                                       The cooling medium-wave infrared scanning temperature measurement system can
                                 cool the detector thermoelectricity and compensate for the temperature, which can output
                                 data steadily day and night; the unique large field of view (0–180 degrees) is especially
                                 suitable for online detection of moving objects. In order to adapt to rain, snow, fog, and
                                 other weather, the installation distance should not be too far. In addition, it can simulate
                                 the lining thickness and locate the fault accurately, to assist in the analysis and infer the
                                 damage trend of the inner lining, and then help determine when the torpedo car is repaired,
                                 which not only greatly reduces the manpower and material costs, but also reduces the
                                 number of spare torpedo cars.

                                 Author Contributions: Conceptualization, methodology, software, validation, formal analysis, in-
                                 vestigation, resources, data curation, writing—original draft preparation, Y.T.; writing—review and
                                 editing, visualization, supervision, project administration, K.L. All authors have read and agreed to
                                 the published version of the manuscript.
                                 Funding: This research was funded by Hefei GoodTech, Co., Ltd.
                                 Institutional Review Board Statement: Not applicable.
                                 Informed Consent Statement: Not applicable.
                                 Conflicts of Interest: The authors declare no conflict of interest.

References
1.    Zhao, J.Y.; Zang, Y.; Qin, Q.; Wu, D.P. Thermo-Mechanical Analysis of Torpedo Car. Appl. Mech. Mater. 2011, 44–47, 1198–1202.
      [CrossRef]
2.    Yemelyanov, V.; Tochilkina, T.; Vasilieva, E.; Nedelkin, A.; Shved, E. Computer Diagnostics of the Torpedo Ladle Cars. In
      International Conference on Inventive Material Science Applications; Bindhu, V., Wang, H.H., Ranganathan, G., Eds.; Amer Inst
      Physics: Melville, NY, USA, 2018.
3.    Jin, S.L.; Harmuth, H.; Gruber, D.; Buhr, A.; Sinnema, S.; Rebouillat, L. Thermomechanical Modelling of a Torpedo Car by
      Considering Working Lining Spalling. Ironmak. Steelmak. 2020, 47, 145–149. [CrossRef]
4.    Goldwaser, A.; Schutt, A. Optimal Torpedo Scheduling. J. Artif. Intell. Res. 2018, 63, 955–986. [CrossRef]
5.    Usamentiaga, R.; Venegas, P.; Guerediaga, J.; Vega, L.; Molleda, J.; Bulnes, F.G. Infrared Thermography for Temperature
      Measurement and Non-Destructive Testing. Sensors 2014, 14, 12305–12348. [CrossRef]
6.    Dai, S.; Nie, H.; Yi, W.; Yang, Y.; Li, J.; Li, D. Research on a New Method of Multi-Zone High Temperature Point Tracking of
      Rotary Kiln Surface Temperature Based on Equal Angle Scanning. Infrared Phys. Technol. 2019, 103, 103078. [CrossRef]
7.    Gade, R.; Moeslund, T.B. Thermal Cameras and Applications: A Survey. Mach. Vis. Appl. 2014, 25, 245–262. [CrossRef]
8.    Hodgkinson, J.; Tatam, R.P. Optical Gas Sensing: A Review. Meas. Sci. Technol. 2012, 24, 012004. [CrossRef]
9.    Botelho, R.A.; Calente, A. Online Monitoring of Torpedo Car Shells. In Proceedings of the Spie the International Society for
      Optical Engineering, Aerospace/Defense Sensing, Simulation, and Controls, Orlando, FL, USA, 23 March 2001.
10.   Jiang, Z.; Guo, Y.; Pan, D.; Gui, W.; Maldague, X. Polymorphic Measurement Method of Feo Content of Sinter Based on
      Heterogeneous Features of Infrared Thermal Images. IEEE Sens. J. 2021, 21, 12036–12047.
11.   Holst, G.C.; Driggers, R.; Furxhi, O. Design Considerations for Advanced Mwir Target Acquisition Systems. Appl. Opt. 2020, 59,
      4339–4348. [CrossRef]
12.   Bose, S.N. Planck’s Law and Light Quantum Hypothesis. Z. Phys. 1924, 26, 178–181.
13.   Saurel, P. On Wien’s Displacement Law. Phys. Rev. 1910, 30, 356–358. [CrossRef]
Appl. Sci. 2021, 11, 8053                                                                                                                9 of 9

14.   Liu, Y.; Xing, Y.; Yang, C.; Li, C.; Xue, C. Simulation of Heat Transfer in the Progress of Precision Glass Molding with a Finite
      Element Method for Chalcogenide Glass. Appl. Opt. 2019, 58, 7311–7318. [CrossRef] [PubMed]
15.   Findlay, G.A.; Cutten, D.R. Comparison of Performance of 3–5-and 8–12-µm Infrared Systems. Appl. Opt. 1989, 28, 5029–5037.
      [CrossRef] [PubMed]
16.   Meitzler, T.; Gerhart, G.; Sohn, E.; Collins, P. Comparison of the Performance of 3–5 and 8–12 Micron Infrared Cameras; SPIE: Bellingham,
      UK, 1994.
You can also read