Origin Energy Time to leave its origins behind - Prepared for Lock the Gate by ITK Services David Leitch & Bailey Chappel July 2021 - cloudfront.net
←
→
Page content transcription
If your browser does not render page correctly, please read the page content below
Origin Energy
                            Time to leave its origins behind.

Prepared for Lock the Gate by
ITK Services
David Leitch & Bailey Chappel
July 2021
ORG will never be, and can never be, a preferred hydrocarbon company
- so, shareholders would be better served if it sold its gas interests.

Rejecting the 2008 takeover bid from BG was a brave step and one that has ultimately cost
investors dearly. Still, that is history and markets live in the future. What investing in
APLNG did do, by virtue of the various equity issues that have followed, is to make ORG a
largish company with a market capitalization of $8 bn. That market cap provides it with
some optionality for the future.

ORG’s simple problem is that hydrocarbon investors will always see it as a second best.
They always have and they always will. ORG is to oil and gas investors as Malcolm Turnbull
is to right wing coalition members.

Equally, utility investors - particularly the increasing majority focused on clean and green
- will always be put off by the gas business and ORG’s apparent willingness to keep on
touting its gas credentials.

Even ignoring the carbon argument, the simple financial problem is that two of ORG’s
main assets, APLNG and Eraring power station, both suppliers of thermal energy, have
finite lives of 17 and 10 years respectively. ORG needs investments to replace the operating
profits those assets supply.

There has only ever been one way out of this. Despite the relative success of APLNG the
ever-increasing carbon pressure means that ORG’s fence-sitting is becoming more of an
issue.

In this note we argue that the window for ORG to get set for a decent medium-term future
is relatively narrow. It means selling cash-generative APLNG and the prospects such as
they may be in the Beetaloo, and committing to a future that a majority of investors will
reward more highly than oil and gas. What is clear is that what ORG is doing isn’t working
for investors. It may be a slower death than that of AGL, but it just isn’t good enough. The
strategy has been wrong for many years and the share price tells you it’s still a dud. There
is a window in Australia where the Federal Government’s enthusiasm for gas carries part
of corporate Australia with it. Equally, Asian interest in gas remains high. That is the selling
opportunity.

JULY 2021                                                                                PAGE 2
ORG’s share of APLNG may be worth around A$8 bn to ORG and that’s enough to make a
major impact in the “green fuel market”. For instance, ORG could commit to a large
program of wind and solar around its proposed Gladstone hydrogen hub. The wind and
solar would be intended for a large 1 mtpa hydrogen electrolyser for export sales to Japan
and South Korea. However, the hydrogen risk is abated because markets exist in Australia
for the wind and solar.

On top of that, we argue ORG investors would be well served by the company selling its
relatively-well-performed gas retailing assets, taking advantage of the current
Government’s favourable attitude to gas and the fact that there are still buyers, and
reinvesting in green electricity. The opportunity exists for ORG to invest in a brand that
actually means something to consumers and to become the first large scale gentailer to
offer a genuinely differentiated product.

 Figure 1. ORG share price. Source: Factset

JULY 2021                                                                          PAGE 3
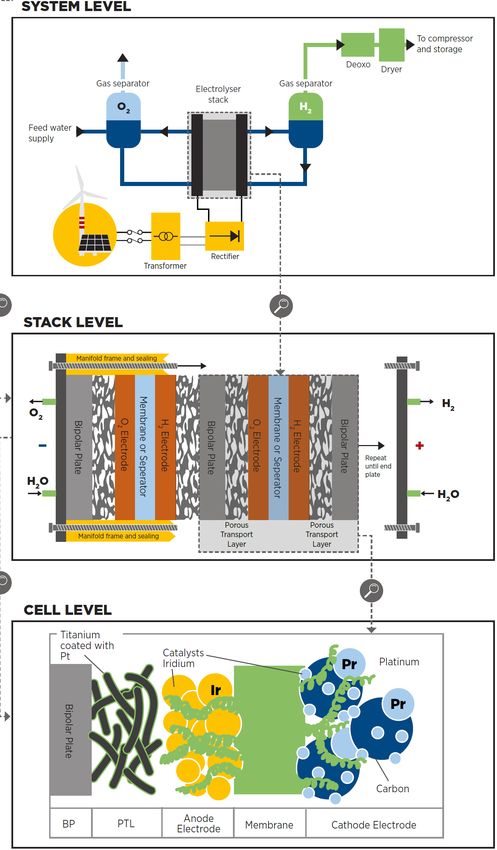
Table of Contents
ORG will never be, and can never be, a preferred hydrocarbon company - so, shareholders would be
better served if it sold its gas interests....................................................................................................2

Summary .................................................................................................................................................. 6

Fight or flee? Management response to climate change threat. ........................................................... 11

Investors questioned the APLNG concept from the beginning ............................................................. 13

Giving investors a reason to own ORG .................................................................................................. 14

APLNG likely near its peak valuation .................................................................................................... 15

Origin’s Beetaloo play ............................................................................................................................ 17

    Current drilling ................................................................................................................................. 20

A case for moving out of gas and into 100% renewable electricity ...................................................... 20

    ORG’s gas retailing business has until recently peformed well .................................................... 24

    Origin’s electricity retail business needs some unconditional love.............................................. 26

Origin’s hydrogen initiatives ................................................................................................................. 28

Hydrogen hubs and the role of gentailers ............................................................................................ 28

5 mt of hydrogen to Japan by 2030? ...................................................................................................... 30

Sketching a 1 mtpa hydrogen plant ........................................................................................................ 31

Appendix 1: Hydrogen markets .............................................................................................................. 33

    Steel ................................................................................................................................................... 36

    Cement .............................................................................................................................................. 36

    Transport ............................................................................................................................................ 37

    Power demand ................................................................................................................................... 37

Appendix 2 HYDROGEN electrolysers ................................................................................................. 39

    Scale challenges ................................................................................................................................ 40

Appendix 3: Kraken and platform business outline .............................................................................. 41

Appendix 4: Rough P&L with estimates ............................................................................................... 44

JULY 2021                                                                                                                                            PAGE 4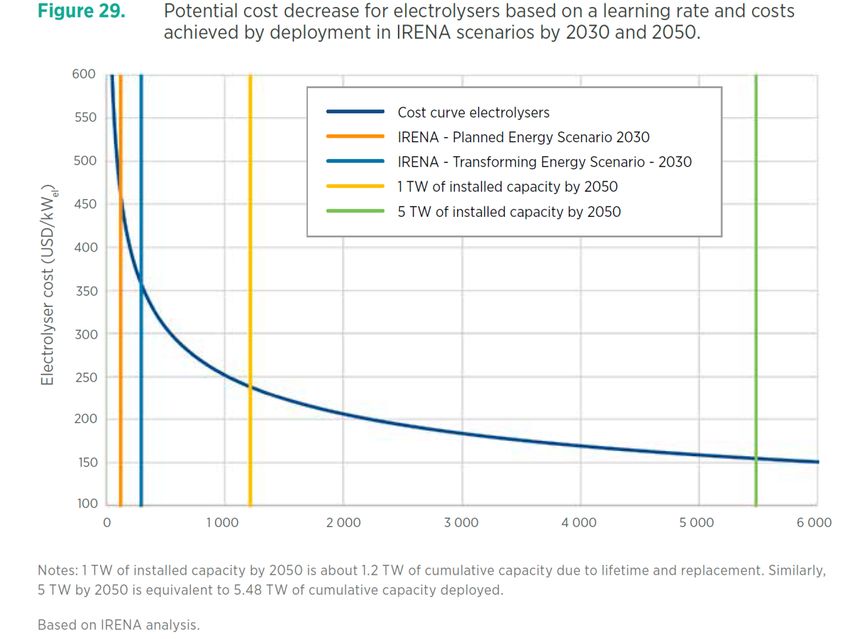
Table of Figures
Figure 1 ORG share price. Source: Factset..............................................................................................3

Figure 3. Fossil fuel carbon emissions globally. Source: Global Carbon project ................................ 10

Figure 4 Global carbon emissions by fuel. Source: Global carbon project ......................................... 11

Figure 5. ORG gross profits, gas and electricity, Source: Company ................................................... 12

Figure 6. Gas share of ORG EBITDA, Source: Company ..................................................................... 12

Figure 7. ORG FCF, Source: Company .................................................................................................. 13

Figure 8. APLNG NPV.Source: ITK ....................................................................................................... 15

Figure 9. APLNG Opex. Source: Company ........................................................................................... 16

Figure 10. APLNG Capex. Source: Company......................................................................................... 16

Figure 11. APLNG wells drilled. Source: Company ............................................................................... 17

Figure 12. Eastern Australia gas reserves and transport. Source: Empire Energy .............................. 18

Figure 13. Beetaloo basin.Source: NT Govt ........................................................................................... 19

Figure 14 Octopus web page. Source: Company ................................................................................. 20

Figure 15 Octopus web page 2, Source: Company ............................................................................... 21

Figure 16 Octopus web page 3, source: Company ............................................................................... 21

Figure 17 ORG electricity supply. Source: Company ........................................................................... 23

Figure 18. Emerging renewable generators. Source: ITK .................................................................... 24

Figure 19 ORG Gas retailing, Source: Company ..................................................................................25

Figure 20 ORG's electricity busines. Source: company, ITKf .............................................................27

Figure 21. Hydrogen, generation and retailing. .................................................................................. 30

Figure 22. Replacing Japan's thermal coal with hydrogen. Source: ITK............................................. 31

Figure 23. Hydrogen plant costs. Source: ITK ...................................................................................... 32

Figure 24. Hydrogen concept NPV. Source: ITK.................................................................................. 33

Figure 25. Commodity exports. Source: Aus Govt. ............................................................................. 34

Figure 26. Global hydrogen market potential by function. Source: BNEF......................................... 35

Figure 27. Global hydrogen demand scenarios. Source: BNEF. .......................................................... 35

Figure 28. Hydrogen electrolyser, block diagram. Source: IRENA 2020. .......................................... 39

Figure 29. Electrolyser cost reduction from learning rate. Source: IRENA. ...................................... 41

Figure 30 ORG P&L, Source: Company, ITK........................................................................................ 44

JULY 2021                                                                                                                       PAGE 5

Summary

    §       Origin can never claim to be decarbonizing so long as gas and oil exploration is part
            of the strategy. Gas alone contributed 44% of the growth in annual global carbon
            emissions ex land clearing between 2010 and 2019. Oil was the largest part of the
            other 56%. Gas is around 21% of annual global emissions and oil around 1/3.
            Advanced nations, other than Australia, are moving hard to get rid of oil, even as
            Origin is busy exploring for it. Gas is being banned in various “green” districts such
            as some towns in California. That’s the extreme today but will be mainstream in an
            easily foreseeable future. To that extent any claim the company about
            decarbonsiation shows they don’t really take climate change seriously. It is classic
            green washing. No one that takes climate change seriously thinks gas is a transition
            pathway. Companies investing in oil and gas are simply betting they can cash in
            before the window closes. That may make sense from a purely financial viewpoint,
            even if it’s risky (see AGL), but it makes a nonsense of demonstrating a sustainable
            corporate culture to stakeholders, including employees.

    §       Alas, ORG is largely a gas company. Its antecedents are in gas, gas provides most of
            the cashflow. The current CEO based the energy markets strategy around
            domination of the corporate gas market, essentially buying the share away from
            AGL via paying up for wholesale contracts. The Federal Government is shouting its
            new-found love for gas from the soap box, and it’s joined there by the Opposition.
            We argue that the friendly Federal environment provides a window for ORG to exit
            its increasingly mature, but cash flow generative gas assets and redeploy the funds
            into the seemingly cutthroat, profitless electricity market.

    §       APLNG, is the largest asset and easily largest source of cash flow in the ORG
            portfolio. ORG owns 37.5% of APLNG, the largest producer of LNG by nameplate
            capacity on the East Coast of Australia and with arguably the highest quality of
            reserves. APLNG now is essentially a mature asset where most of the cost out has
            already been achieved. ORG has done really well managing the upstream gas
            extraction for APLNG. The operation is managed in an efficient, environmentally
            conscious fashion and management have achieved great results at operating cost
            out and reducing drilling capex. But only about 35% of cost is controllable and the

JULY 2021                                                                                  PAGE 6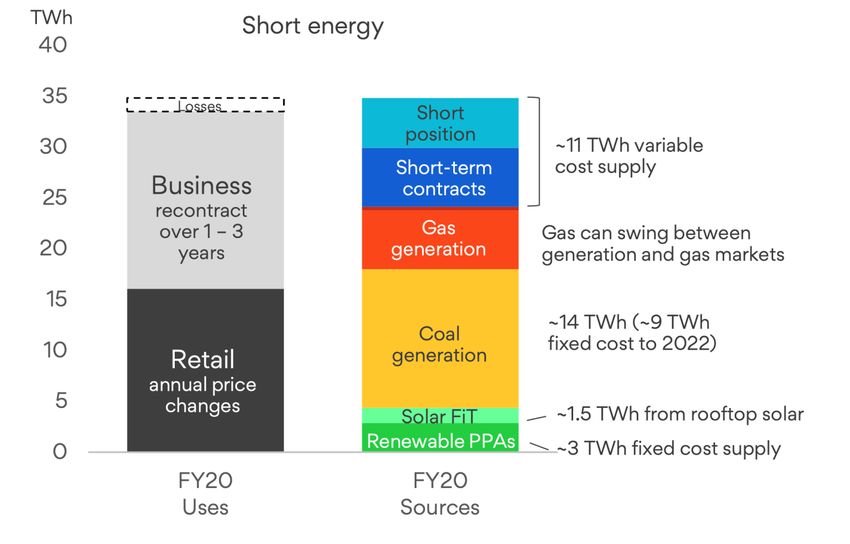
work has been done. As far as reserves go, they have been held at reasonable levels.
            It may be that if oil prices are high enough, or technology improves, some
            contingent resource can be converted to reserves. Just as likely that some issue
            emerges with the reserve base towards the end of field life. Based on current 3P
            reserves the project has about 16 years of life left and once life gets below say 10
            years, the focus will strongly shift to the clean-up liability and other end of life
            issues. For this reason, we think sale of the asset, arguably at an unknown pre-
            emptive discount to partners ConocoPhillips and Sinopec, is likely to be evaluated
            regularly. That said it’s not clear that a sale to Sinopec would even be allowed in the
            current political climate.

    §       ORG is also the largest gas wholesaler and retailer in Australia, a position built up
            when AGL effectively decided to exit the business. Profits for this business are not
            that strong and we don’t see a great long-term future unless there is a big payoff at
            say Beetaloo in the Northern Territory. But it’s easy to be skeptical that fracked
            Northern Territory gas, even as an oil by-product, can ever be even the medium-
            term future for Southeastern Australia. Maybe it will be viable, but at a minimum
            there will be zero-to-negative demand growth as a result of the high cost.

    §       In our eyes, ORG faces a choice:

               o Firstly, continue down the gas and oil path and hope shareholders eventually
                   warm up to ORG as a gas player. This seems unlikely to us. Every investor
                   we know is going to buy a gas company if they want gas. They will buy Santos
                   rather than ORG. It comes down to corporate culture and commitment.
                   ORG is always half pregnant.

               o The second option is to decide it wants to be a clean, green utility. This route
                   will undoubtedly be long and hard, and ORG’s efforts to date have not
                   inspired confidence. APLNG and the Beetaloo assets would be sold. The
                   proceeds reinvested, perhaps partly into hydrogen, partly into VRE (wind
                   and solar) and partly into products that address the behind-the-meter
                   market. Over time ORG would exit its gas wholesaling and retailing role. The
                   gas generation fleet would be converted to hydrogen which at a minimum
                   would be expensive. Installed gas turbines can likely handle at most 40% by

JULY 2021                                                                                   PAGE 7
volume of hydrogen which results in emissions reduction of say 20%. Quite
                      possibly even that would be optimistic considering embrittlement - see GE
                      white paper on using hydrogen in gas turbines.

    §       In this scenario, ORG would reengage in the VRE (wind and solar) market,
            something it’s done its best to avoid for years. Nor has it done anything to provide
            fully decarbonized firming power. Even while down in the retail business, it’s a big
            player in distributed solar installations and has various sideline businesses. In doing
            this, it has along with AGL and EnergyAustralia, opened the door to disrupters such
            as Neoen, Iberadola and PowAR which between them have captured significant
            market share and an increasing share of industry cash flow. This process is bound
            to continue. From ORG’s perspective it’s going to lose all the Eraring cash flows in
            NSW (but still have the clean-up costs) unless it takes some action to get a share of
            the NSW wind and solar market. This is hardly news, so we expect management has
            a plan.

    §       Retailing: ITK believes there likely is a large market for a pure green electricity
            retailer. There is lots of evidence for this, some of which is right in front of ORG’s
            eyes and yet it ignores it. The evidence is for instance Octopus energy. Ironically
            ORG owns 20% of Octopus. ORG appears to believe that Octopus is a success
            because of its technology. In ITK’s view that is only half the story. The other half is
            Octopus pushing its green credential to a younger, “switched on” audience. That
            younger audience will likely have a high degree of loyalty. Like a bank.

    §       Another advantage is that in Australia ORG would for the first time offer a clearly
            differentiated choice to the average consumer. At the moment the big three
            gentailers, AGL, ORG and EnergyAustralia really offer very limited product choice.
            It’s left to the small retailers to chase something different. Of course, it would mean
            ORG burning its bridges, no retreat and therefore make the so far only modestly
            successful electricity retail business into a real winner. ORG could do that. It has
            the customer base and IT systems.

    §       Green hydrogen and/or ammonia offers a path to the future. ORG would transform
            its interest in APLNG into an export-focused business that ships hydrogen and or
            ammonia to Japan and South Korea. Imbalances between the VRE power source

JULY 2021                                                                                   PAGE 8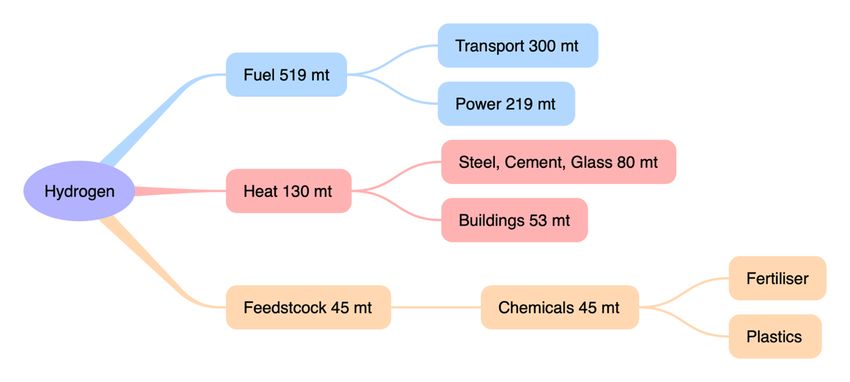
and the electrolyser capacity could be fed into or drawn from the existing grid
            (subject to green certification). ORG is pursuing two such projects. There is a high
            level of risk. Hydrogen has numerous issues from the technical to the economic,
            but also plentiful Government support and a sense of urgency in that large scale
            green hydrogen plans are being pursued all over the world. Australia has natural
            advantages, specifically low cost VRE and existing strong energy export
            arrangements with both Japan and South Korea. ORG cannot fund large scale
            investment in hydrogen and pursue its gas business.

    §       The hydrogen market is current 70 mt globally, various estimates, including one
            from BNEF suggest that a market 10X that size (about 700 mt) is a reasonable
            prospect. In such a market projects of say 1 mtpa are likely to be of the appropriate
            scale. That’s particularly because there is clear theory path to suggest that large
            scale projects will have significantly lower unit costs. But this requires electrolyser
            orders of magnitude larger than those of today. For instance, a 500 kt per year
            output is 57 tonnes per hour and at 50 KWh/kg that works to an electrolyser
            capacity of 2,800 MW and about 7 GW of VRE capacity. And even that assumes
            100% capacity utilization. Working the numbers, that’s maybe about a A$10 bn
            project. And you just can’t buy electrolysers at that scale today.

    §       In our view good strategy would look like:

               o Disengagement from oil and gas over time

               o Reasserting a strong market share in generation by investing in or acquiring
                   VRE and renewable firming

               o Continuing to pursue hydrogen/ammonia export to Asia

Some markers on that track would include selling the interest in APLNG, selling the
interests in Beetaloo and investment in NSW and QLD VRE generation. As ORG owns lots
of gas-fired power, it’s going to be hard for it to follow the battery growth, but if it doesn’t
it will get squeezed in the VRE firming market as well as in the energy space.

JULY 2021                                                                                   PAGE 9
At the global level, gas contributed 44% of growth in CO2 fossil fuel emissions 2010-2019. Although coal remains the largest single contributor to global warming and gas is “only” in third place, the fact is that gas has been the largest source of growth in global CO2 emissions over the past 9 years. Furthermore, even over 50 years of both gas and cement have increased emissions at a greater rate that of either coal or oil. Gas emissions have increased a cumulative 26% since 2010 and are 21% of total emissions. It’s likely that when we eventually see the 2021 numbers, probably in about 14 months’ time, coal will have enjoyed a resurgence. We don’t think it’s any secret that when we look at coal and cement in the past 10-20 years, what you are really looking at is the growth of China and to a far lesser extent India and other countries in South East Asia. Global warming is a global problem. Gas contributes 44% of global CO2 emissions growth since 2010 50-year view CO2 bn/t Coal Oil Gas Cement Total Gas share 1969 5.5 6.0 1.7 0.3 13.4 13% 2019 14.4 12.4 7.6 1.6 35.9 21% Change 161% 107% 345% 483% 167% Change 8.9 6.4 5.9 1.3 22.4 26% Most recent 9 years CO2 bn/t Coal Oil Gas Cement Total Gas share 2010 13.9 11.3 6.2 1.2 32.7 19% 2019 14.4 12.4 7.6 1.6 35.9 21% Change 3% 9% 23% 26% 10% Change 0.4 1.1 1.4 0.3 3.2 44% Figure 2. Fossil fuel carbon emissions globally. Source: Global Carbon Project JULY 2021 PAGE 10
Global annual carbon emissions by fuel
            16

            14

            12

            10
   GT CO2

            8

            6
                                    Coal      Oil     Gas       Cement
            4

            2

            0
                 1959
                 1961
                 1963
                 1965
                 1967
                 1969
                 1971
                 1973
                 1975
                 1977
                 1979
                 1981
                 1983
                 1985
                 1987
                 1989
                 1991
                 1993
                 1995
                 1997
                 1999
                 2001
                 2003
                 2005
                 2007
                 2009
                 2011
                 2013
                 2015
                 2017
                 2019
Figure 3. Global carbon emissions by fuel. Source: Global carbon project

Fight or flee? Management response to climate change threat.

Climate change is perhaps the most pressing area of ESG. Senior management all round
the world, and superannuation funds alike, are conscious of the much greater weight given
to ESG issues particularly as they concern large public companies. Not just climate change,
but also discrimination, other environmental issues, wage performance ratios and so on.
In general, large public companies occupy an important role in democratic, capitalist
society and management are expected to discharge their responsibilities with that
knowledge. Stakeholders also demand performance, appropriate cash flows, profitable
investments and timely changes of direction as industries rise and fall.

One of the strongest groups pushing for climate change activity are large institutional
investors. They are being pushed in that direction by their members and by their own
inclinations.

JULY 2021                                                                           PAGE 11
For Origin management, a 20-year-old public company, with prior antecedents in the “SA
Gas Co” but now a mixed energy retailer and minority investor in the largest LNG plant in
Queensland, these pressures are felt already and are growing.
So, for us the issue is not whether ORG has a long-term future in gas (because no one does)
the question is when ORG should exit its gas investments and fully commit to electricity
and perhaps hydrogen/ammonia. In truth the main reason why anyone would be hesitant
about this is that on the face of it, ORG’s just done such a terrible job with electricity.
ORG Energy markets: Electricity & gas gross
profits
(Note accounting rules have changed,
exagerating the decline in recent year)
1200
1000
800
$mn
600
400
200
0
Dec11
Jun-12
Dec12
Jun-13
Dec13
Jun-14
Dec14
Jun15
Dec15
Jun16
Dec16
Jun17
Dec17
Jun18
Dec18
Jun19
Dec19
Jun20
Dec20
Jun21
Source: Company, ITKe
gas Electricity
Figure 4. ORG gross profits, gas and electricity, Source: Company
The simplest view of the number is probably whole of company EBITDA. Even this requires
allocating some energy markets overhead to gas.
Gas is 75% or more of EBITDA
FY19 FY20 FY21 FY22
Gas retail EBITDA 515 535 392 346
Integrated gas 1892 1741 1200 1740
Gas total 2407 2276 1592 2086
Consolidated EBITDA 3232 3141 2085 2300
Gas share total 74% 72% 76% 91%
Figure 5. Gas share of ORG EBITDA, Source: Company
JULY 2021 PAGE 12Equally APLNG provides the vast majority of the free cash flow. That is the cash flow for
reinvestment and dividends. We include Octopus funding within the capex deducted in
calculating FCF.
Free cash flow $m FY19 FY20
Ebitda 3232 3141
Less APLNG -2123 -1915
Other non cash -60 -430
Operating cash 1049 796
Interest paid -373 -292
Capex -341 -641
Disposals (Acquisitions) -46 69
Free cash flow pre APLNG 289 -68
APLNG distributions 974 1275
Free cash flow 1263 1207
Dividends 165 443
Figure 6. ORG FCF, Source: Company
Investors questioned the APLNG concept from the beginning.
ORG’s investment in APLNG has been questioned many times and on several grounds.
Despite cost over runs, the project has been technically successful and has progressed to a
mature cash-generative business, albeit one that is yet to pay any income tax.
As a reminder, the first question was about whether you could profitably turn CSG into
LNG at all. The issue investors raised was that dry gas would not provide enough liquids
by product revenue to juice the returns.
The second issue was around WACC. It remains true that oil and gas exploration is
supposed to be a high risk-high return business. Utilities are supposed to be a low risk, low
return business.
The third issue was LNG competition. APLNG was almost the last project to be financed
before US shale gas to LNG became a thing. And the US shale gas to LNG process was
priced on the basis of gas prices in the USA + a margin rather than a percentage of the oil
price (13%-16%) that mostly formed the basis of historic LNG contracts. So, there was a
wall of worry that cheap US LNG would be sold on a spot market. ORG in 2013 responded
JULY 2021 PAGE 13to that by concluding a 20-year contract, starting in 2020, to buy 0.25 mt of LNG at the Henry Hub price + margin taking spot risk for sales into Asia. In FY20 that led to a write down in ORG’s books as an onerous contract. The fourth issue was just the cost of constructing LNG plants in Australia. The fifth issue was around the strength of the CSG reserves. Unlike conventional traps CSG reserves were often valued on a “3p” and “2p” basis rather than the fully proved 1p basis of conventional plays. The sixth issue and the one that is the starting point of this note: where does a 37.5% interest in one global scale LNG plant get you? Does it make you the new Conoco Philips? What happens as the field matures and investors start to focus more on the cleanup liability? What does ORG do with the cash flows from the project to build its future? Giving investors a reason to own ORG. The most common split in investor style is between growth and value investors although there are many variations. What is clear though is that oil and gas investors tend to focus on exploration achievement, that tends to be where the upside is. An oil or gas field is a finite life asset. Increasingly, for most modern forms of oil and gas extraction it’s a relatively short-lived life. There is only so much gas contained in the coal seams that APLNG has access to. Based on FY20 reported reserves and annual production of around 700 PJ, APLNG has about 16 years of life left. Reserve estimates change frequently, typically at least in the early years; reductions in costs and/or changes in commodity prices can lead to increases in reserves. Perhaps though towards the end of a project it may turn out to be less economic to produce the reserve tail. By that time well flow rates have dropped away, capital expenditure is low, but the cleanup expense becomes the focus. We start with a view that once a ten-year remaining field life is reached the market will focus on what’s next. And in fact, long before that the market will come to a view that the bulk of cost reduction has been achieved, the field can be valued reasonably accurately, and it will go ex-growth. JULY 2021 PAGE 14
ORG as upstream operator has done really well on moving capex and opex down at APLNG.
It was always expected that costs would come down an experience curve but in our view
ORG has outperformed.

APLNG likely near its peak valuation

We estimate to with a billion or so that ORG’s share of APLNG is worth $8 bn. That’s using
a Brent oil price of US$60/b. Still there are many uncertainties. We allowed an arguably
very excessive $4 bn clean up liability, on the basis that all the wells, processing plants and
Curtis Island infrastructure needs to be removed and made whole.

              APLNG                     FY22 FY23 FY24 FY25.. ..FY33            FY35    FY36
              NPV extract
              EBITDA                     4588   4822    4905    4986    5602    5751    5825
              Ungeared tax                                       -956   -1141   -1185   -1207
              Capex                      -864    -872    -881    -890    -963    -200      0
              Clean-up liability                                                        -4000
              Discountable cash          3725   3950    4024    3141    3498    4366     617
              flow
              NPV8                      29375   28000   26290   24369   10194   4572     572
              Less debt                 -7300   -6600   -5900   -5200
              Equity value              22075   21400   20390   19169   10194   4572     572

              ORG share            mn    8278   8025    7646    7188    3823    1714     214
              Shares on issue      mn    1700   1701    1702    1703    1711    1713    1714
              Per ORG share         $     4.9     4.7     4.5     4.2     2.2     1.0     0.1
              Change                             -3%     -5%     -6%    -17%    -39%    -88%

            Figure 7. APLNG NPV. Source: ITK

Other than oil price we don’t see much further upside in the valuation of APLNG. Interest
rates won’t go materially lower, so there is no cost of capital upside. Eventually APLNG
will move into a tax paying situation. That may not matter to ORG shareholders, but it will
impact the net cashflows to Connoco and potentially Sinopec.

ORG doesn’t control the majority of the opex, its either royalties - driven by the gas price
achieved - or opex in non-controlled business or to a lesser extent downstream opex at the
plant.

JULY 2021                                                                                       PAGE 15
APLNG cash costs $m FY17 FY18 FY19 FY20 FY21
Purchases 146 262 235 89 20
Royalties and tariffs 187 239 433 502 158
Operated opex (upstream) 681 649 562 561 544
Non operated opex 204 199 197 202 182
Downstream opex 213 227 228 248 243
Corporate 36 43 126 105 107
Dewatering 101 106 108
Workovers 237 179 183
Total to P&L 1541 1673 2119 1992 2032
Tota cash opexper GJ $/GJ 6.07 2.47 3.21 2.91 2.98
Royalty per GJ $/GJ 0.74 0.35 0.64 0.71 0.23
Operated upstream % total 44% 39% 27% 28% 27%
Figure 8. APLNG Opex. Source: Company
ORG does control the upstream capex which primarily consists of new wells, well gathering
and then as new areas are developed, new field compressors. ORG has reduced costs in
this area in a major way, and well productivity has also improved. It’s difficult to say how
much more can be achieved in this area. If we were to use conventional “experience”
curves, then unit costs might fall between 10% and 20% for a doubling of the cumulative
wells drilled. That will likely take at least 4-5 years.
APLNG Capex FY17 FY18 FY19 FY20 FY21
Upstream sustain 922 762 531 546 407
Upstream replace 138 105 122 83 45
Exploratation 80 65 102 88 40
Downstream 155 49 39 25
Non operated 79 189 262 205 149
Total 1374 1170 1056 922 665
Per unit of production $/GJ 5.41 1.73 1.56 1.30 0.95
Figure 9. APLNG Capex. Source: Company
The reduction in upstream sustaining capex is particularly notable.
Even so we think it’s reasonable to expect improvement to be incremental from here.
Looking at it the same way as we look at solar, wind and batteries suggests that unit cost
reductions might fall say 20% for a doubling of the cumulative number of wells drilled and
ignoring the different characteristics of Bowen and Surat wells and that some capex is
linked to processing plants.
JULY 2021 PAGE 16Wells drilled FY17 FY18 FY19 FY20
Operated wells drilled 226 290 251 260
Production TJ/day 1364 1410 1429 1429
Well commissioned 413 267
Total wells 1921 2211 2462 2722
13% 15% 11% 11%
Production per well Tj/Yr 259 233 212 192
Figure 10. APLNG wells drilled. Source: Company
Origin’s Beetaloo play
Public information regarding the Northern Territory Beetaloo basin states:
1. ORG booked a 6.6 TCF (6,500 PJ) 2C gas resource in 2017.The overall basin may
contain as much as 200,000 PJ of gas some of which may be liquids rich. A
commercial resource over the basin of say 20,000 PJ might exist.
2. ORG’s Kyalla 117 well had a gas composition of 65% methane, 19% ethane and 11%
propane, butane and no CO2, which is probably more liquids rich than the Cooper
Basin was, but well fracture stimulation was unsuccessful due, the company says,
to saline water flow back. The gas pressure pushes the liquids out.
3. The basin is about 500 km southeastof Darwin in the NT. It has a high regulatory
burden, remoteness of play, lack of infrastructure, and a lengthy wet season that
causes issues. To date there has been no commercial hydrocarbon extraction. All
these difficulties can be overcome if the resource is good enough. Early wells are
expensive - probably over $50 m per well by the time they are fracture stimulated.
Costs will need to come down 80% for commercial outcomes.
4. There are 3 zones of hydrocarbon bearing shales at varying depths down to about
5000 metres.
5. It is certain that unless the quantity of gas is very large, it will end up as very
expensive gas in Eastern markets due to the transport as well as extraction cost. To
be commercial, other than in extremely large quantities, the gas needs to have a
good liquid content. Assuming enough gas was found it could conceivably be sent
to the Gladstone LNG projects. These will be running short of gas in another 15
JULY 2021 PAGE 17years. It’s hard for us to imagine that this will be competitively priced LNG without
liquids providing most of the revenue. Since the QLD LNG projects run on dry gas,
separate liquid processing facilities would need to be built.
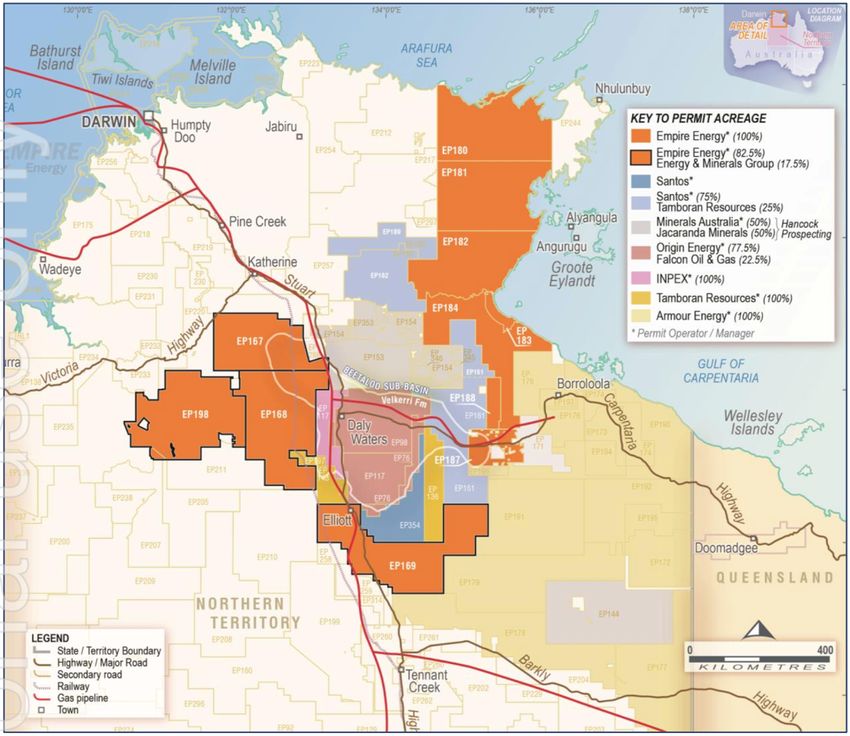
Figure 11. Eastern Australia gas reserves and transport. Source: Empire Energy
6. A couple of wells have flowed gas at average rates over the first 10 days without
fracture stimulation of say 0.4 mcf/d and then higher rates after shut in.
JULY 2021 PAGE 187. There are some theoretical questions about the overall performance due to the age
of the rocks. This may mean that repeated geological burial and exposure reduces
the overall hydrocarbon content or accessibility of it.
8. Development of the field is likely to take, say, a decade. Every year that passes the
decarbonization story for gas will get worse. Already this year we can see the “gas
divide” coming into increasingly sharper focus.
9. In our view, the best commercial outcome would be the liquids justifying the field
development and enough gas to build a pipeline to Gladstone to take advantage of
the already existing spare train on Curtis Island. By the time any Beetaloo gas is
available, Curtis Island trains may be looking for more supply. Although, this might
also be available from the “Arrow” reserves in the Surat Basin.
Figure 12. Beetaloo basin. Source: NT Govt
JULY 2021 PAGE 19CURRENT DRILLING
• Santos (75%) and Tamboran (25%) are drilling two horizontal wells to a total depth
of about 4,800 metres in the Tanumbirini play in EP161. These will be fracced and
Tamobran says flow test results are expected in the December quarter.
• Empire energy will be doing vertical hydraulic stimulation and low testing of
Carpentaria 1 and appraisal drilling and stimulation of EP 187 2D.
• Origin will be doing an extended production test of Kyalla 117 and vertically drilling
Velkerri 76. Results from this program will be progressively available, some perhaps
shortly. At the time of writing Falcon reported the well was paused.
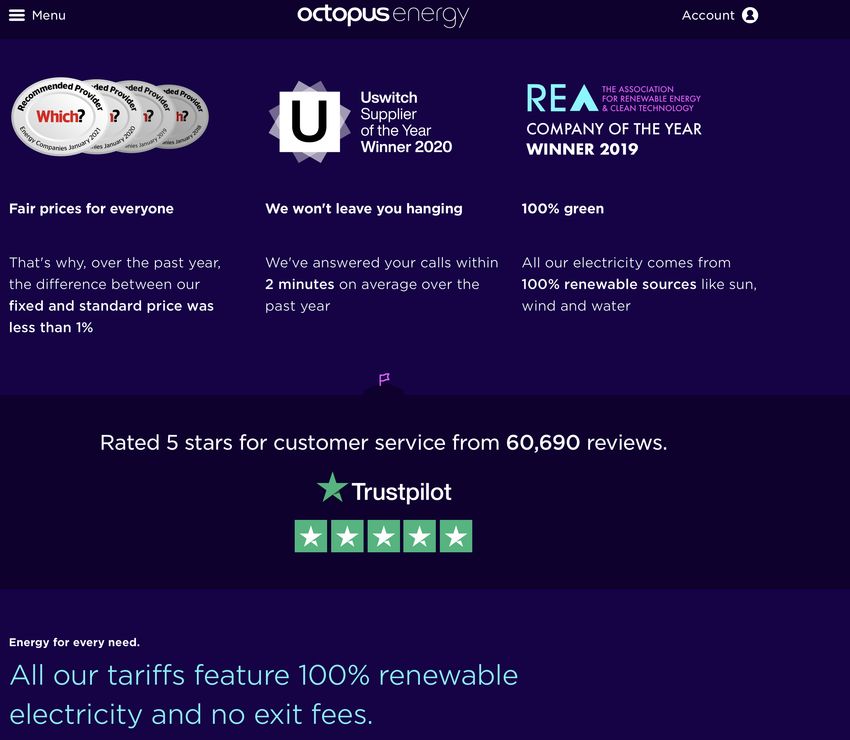
A case for moving out of gas and into 100% renewable electricity
ORG in 2020 invested close to $550m for a 20% stake in a fast-growing but as yet
unprofitable platform electricity retailer, Octopus Energy, with a marketing image based
around being green.
Figure 13. Octopus web page. Source: Company
JULY 2021 PAGE 20Figure 14. Octopus web page 2, Source: Company Figure 15. Octopus web page 3, Source: Company In fact, as detailed on the Octopus web pages, the company’s green electricity is nothing particularly special by Australian standards (https://octopus.energy/blog/what-makes- us-green/) except that as a primarily retail-focused business, all of the company’s 2 TWh of owned generation is renewable and it buys enough renewable certificates to cover the balance of sales. Or it did. JULY 2021 PAGE 21
Octopus’s position is totally and utterly incompatible with oil and gas production from
just about every point of view imaginable. Octopus has been highly successful at getting
customers with over 2 m on the platform as last published.

Culture, financial metrics, management style, and markets; there is almost no overlap. The
other half of Octopus’s business is utility software.

ORG will pay Octopus an additional $100 million for Octopus to convert ORG’s sales and
marketing computer software to Octopus’ platform, Kraken. The implementation costs at
time of announcement were to be spread over four financial years, with the bulk in FY22
and FY23. See Appendix 2 for some further details of Kraken and platform business.

At the time of the announcement in May 2020, eventual savings were targeted at, say, $125
million per year from FY2024. ITK has reservations about the transferability of utility
software to a completely different environment, particularly one with as many different
sub systems in different States as Australia has and one where the penetration of rooftop
solar into the consumer market is completely different. Equally the wholesale market
system is also quite different to the UK. Not even sure Octopus has a gas system whereas
ORG has a lot of gas business all of which requires its own software. In short we won’t be
in the least surprised, and we doubt if the market will be either, should the Kraken
installation in Australia be over budget and behind schedule. In fact we’d bet on it. Equally
the valuation of a presently unprofitable but fast growing platform business like Kraken
requires a much higher degree of familiarity with the actual uptodate numbers and the
skill to see the future profits, than ITK possesses. Still the next update will soon be available
with the FY21 profits.

ORG does do a great chart, so we have taken this from the 2020 investor presentation.

In ITK’s opinion ORG has missed many an opportunity to get control of its generation
future. It’s been one misstep after another, little of the upside AGL gets from coal, and
pretty much most of the carbon downside. Gas generation is not well regarded by green
investors and although it occasionally gets good profits, the overall results are not great.
Perhaps that will change.

JULY 2021                                                                                 PAGE 22
Figure 16. ORG electricity supply. Source: Company

What we do know though is that ORG’s coal generation is going away. Eraring is due to
close in 2032 when its ash dam is full and will likely move into a reserve role prior. This
leaves ORG with the challenge of replacing its earnings. Eraring is profitable
notwithstanding its coal contracts are short term and are no doubt linked to export parity
in some fashion.

There can be no suggestion that more gas is going to provide 14 TWh of energy. The
obvious answer is to invest in more wind and solar… but that is an approach that ORG has
always resisted.

As a result, along with AGL and EnergyAustralia, it’s in the process of ceding market share
to the companies that are building a new breed of gentailers. ITK selected a group, out of
a large number of suppliers, that we estimate have around 13% of NEM by energy already
and we expect to continue to gain market share. The Group Neoen has already established
a strong position in dispatchable power via its batteries. And we anticipate the rest of the
group to follow along as they evolve towards the traditional gentailer model - but just using
green assets instead of thermal. By and large we expect them to be supported by policy.

JULY 2021                                                                             PAGE 23
Emerging Green Generators
             MW                             Solar     Wind          Total   Energy TWh
             Neoen                           760        762         1522            4
             PowAR                           155       1559         1714            6
             Acciona                                    928          928            3
             CWP Renewables                             919          919            3
             Iberadola                       132        739          871            3
             Sun Metals Corporation          125        400          525            2
             Naturgy                                    813          813            3
             Palisade Investment Partners    120        608          728            2
             Total                          1292       6727         8019           25
             Share of total NEM                                                   13%

            Figure 17. Emerging renewable generators. Source: ITK

ORG’s position is that the customer is the scarce resource. It’s true that the number of
customers is finite although the product range is not. However, the green gentailers will
be selling the products the customers want, since 70% of the population is basically in
favour of green energy.

We argue that ORG could stop being two-faced in its support of decarbonisation and
actually demonstrate it means what it says by moving its generation assets away from
thermal and towards green. If it gets on with it, there may still be time.

The question for us is how successful a large-scale single-fuel gentailer (i.e. electricity only,
no gas) could be? Initially, getting out of gas retailing would certainly hurt profits although
we would argue that right now the business still has as value. Energy Australia for instance,
or even the new AGL Australia which has aims to be a multi-product retailer.

ORG’S GAS RETAILING BUSINESS HAS UNTIL RECENTLY PEFORMED WELL

Since about 2014 ORG has focused heavily on winning gas market share, initially based on
upstream ownership of gas production together with the contract book that went with
APLNG.

ORG went after not only the retail market but also taking a very significant share of AGL’s
industrial customer size loads, and selling significant quantities of gas into the LNG supply
market, mostly to GLNG. Still, it also did quite well in the retail market:

JULY 2021                                                                                 PAGE 24
Gas retailing
FY15 FY20 Change FY21 (F)
Residential Volume (PJ)
NSW 7.1 11 55%
Victoria 26.1 25.2 -3%
Queensland 2.8 3.1 11%
South Australia 5.8 5.7 -2%
Total volumes sold 41.7 45 8%
Customers (000s)
NSW 247 335 36%
Victoria 479 479 0%
Queensland 155 181 17%
South Australia 202 239 18%
Total gas customers 1,083 1,234 14%
Business volume (PJ) 105 159 51%
Gross profit $m
Retail 978 1,163 19% 1140
Business 755 1,673 122% 1,520
Total revenue 1,733 2,836 64% 2,660
Network costs (640) (796) 24% (830)
Energy procurement (572) (1,294) 126% (1,330)
Gross profit 521 746 43% 500
$/GJ as reported
Retail sales 23.5 25.8 10%
Business sales 7.2 10.5 47%
Network 4.4 3.9 -10%
Energy Procurement 3.9 6.4 63%
Business sales-procurement 3.3 4.2 27%
Figure 18. ORG Gas retailing, Source: Company
If one of the other existing large gentailers was to buy ORG’s gas business, there would be
large economies on the cost side. The residential gas business might be worth in the order
of $1500 per customer based on past transactions, or somewhere in the order of $2 bn. The
business volumes will depend on the length of the contract book on both the sales and
supply side. Essentially on the supply side, some contracts such as those with APLNG about
10 years to go. There is also a portfolio of transport contracts and so on. More information
is needed to value the business part of the book but if ITK was forced to guess we might
pencil in $250 -$500 m.
Gas retailing profits will be down very sharply in FY21, management forecast a full year
$200-$250 m decline in gross margin at the half year due to roll off of legacy supply ($70
JULY 2021 PAGE 25m), repricing of tariffs, lower business sales volumes and higher procurement costs. Quite the list really. Procurement costs rose a further $30 m in FY21 post the result due to arbitration outcomes on 13 PJ (FY21) of volume supplied by Beach Energy. That cost increase in $m terms will be larger when applied to all of FY22. Selling the gas business would allow ORG to focus on selling carbon free electricity, align it with Octopus more closely, vastly simplify the customer care system, investment and transformation and with a clearer corporate goal ORG could use the funds raised to replace Eraring and develop a marketing strategy that was both aligned with what the public wants and was strongly differentiated from its main competitors. It’s the fact that the gas business is doing well which makes it saleable. In another 5 years’ time it may be much harder. ITK expects that consumer attitudes towards gas consumption will take many years to change. Similarly, gas is quite hard to replace as a source of process heat to industry. Carbon free gas substitutes (green hydrogen and green ammonia) are nowhere near competitive as feedstocks for the plastics business as natural gas. So, in ITK’s opinion, gas retailing has relatively secure annuity business. Nevertheless, its growth outlook, contrary to consensus, is poor. That is the selling opportunity: the difference between consensus expectations backed up by Federal Govt rhetoric versus the imperative of climate science and the investment dollars that swing behind it. ORIGIN’S ELECTRICITY RETAIL BUSINESS NEEDS SOME UNCONDITIONAL LOVE ORG’s electricity business has been an average to poor performer from about the time it bought its interests in the NSW electricity industry. The business has been hit from pillar to post by regulatory outcomes, a mis match between supply and demand in Queensland and to an extent in Victoria and cost performance has been far from stellar. We have never understood what Origin’s retail business proposition was. Is it meant to be the cheapest? The best customer service? The most forward-looking? Its proposition to customers is unclear. The same would go with the higher volume but much lower profit wholesale business. Anyhow, we don’t propose to analyse the business in detail here. We’re suggesting a scenario where it did sell its gas interests and did retool itself as Australia’s JULY 2021 PAGE 26
No. 1 green gentailer. Green and nothing but green. Lighting the path so to speak. In that
scenario, the electricity business and its P&L would be profoundly different from what’s
been demonstrated so far.

        ORG's electricity business
                                                           FY15      FY20    Change   FY21 (F)
        Volumes (TWh)
        Retail
        NSW                                                  8.9       7.8     -12%
        Victoria                                             3.2       2.9      -9%
        Queensland                                            5        4.1     -18%
        South Australia                                      0.8       1.3     63%
        Retail volumes sold                                 17.9     16.1     -10%
        Business volume                                     18.4     17.4       -5%
        Customers (000)s
        NSW                                                1288      1191       -8%
        Victoria                                            581       556       -4%
        Queensland                                          764       645      -16%
        South Australia                                     198       239      21%
        Total customers                                    2801      2631      -6%
        Gross margin account
        Retail sales $m                                    4902      4569       -7%      4406
        Business sales                                     2238      2941      31%       2758
        Revenue ($m)                                       7217      7510       4%       7164
        Network costs                                     (3745)    (3142)     -16%    (3178)
        Wholesale energy costs                            (1906)    (3179)     67%     (3058)
        Gross profit ($m)                                  1289      1189       -8%       928
        Gross margin %                                      18%       16%                13%
       Figure 19. ORG's electricity busines. Source: company, ITK

In actuality… this is a poor performance. Volumes are down and so are customer numbers.
Gross profits are down 25% if we look to FY21 and probably more in FY22.

There are plenty of good reasons for these things, but in the end, management have been
unable to do much about the external forces. We argue the ORG brand doesn’t stand for
anything that resonates with consumers. ORG does have a bunch of interesting products
within electricity, a good example is its embedded network business, but these mostly
seem like portfolio addons rather than a core strategy.

In any event if ORG is, as we think appropriate, to focus on electricity and nothing but
electricity, as world class players such as Nextera and Orsted do, it will clearly need to
improve these results.

JULY 2021                                                                                  PAGE 27
And it could improve, the overall numbers show $7 bn of sales, a large gross margin,
arguably one that should be round $1 bn or more, and about 9% of the Australian market
by volume. That’s a substantial starting point.
Origin’s hydrogen initiatives:
§ Origin and Kawasaki Heavy Industries are collaborating on a 300 MW, 36,5 KT
green hydrogen production and export facility at Townsville. The project is
advertised as likely to enter Front End Engineering [FEED] in calendar 2021 with a
target production in the mid 2020s.
§ Origin is doing a feasibility study on a 500 MW 420KT green ammonia plant based
at Bell Bay. The feasibility study is targeted for completion by Dec 2021.
§ Origin and Posco, a South Korean steel manufacturer, have signed an MOU to
cooperate on supplying green power to Korea, via hydrogen. Right now, there is no
project associated with the MOU. And indeed, historically, ITK does not value
MOUs at all. But they are worth noting.
Hydrogen hubs and the role of gentailers:
The consensus plan to decarbonize the world at the moment is essentially:
1. Make electricity 100% carbon free;
2. Electrify as much of primary energy consumption as is feasible;
3. Deal with whatever’s left over as the technology becomes available.
Over time, and in Australia undoubtedly it was Alan Finkel that lit the flame, it’s become
clear that there is a potential role for green hydrogen and hydrogen-rich chemicals to do
part of the job.
ITK believes that green hydrogen is likely to be relatively advantaged when
§ produced at scale;
JULY 2021 PAGE 28§ in regions of the world that have access to low cost renewable energy. This doesn’t
just mean lots of resource but also low cost of using the land, and low enough
construction and operating costs;
§ when surplus or short fall production from the VRE source can be managed as part
of a larger portfolio, such as that owned by a large gentailer;
§ when it is produced relatively close to the market where it will be used;
§ when there are strong existing customer supplier relationships.
Considered against those criterion ORG is well placed on all fronts other than ‘close to
market’.
The emerging model of a decarbonised energy economy is one where most things are done
by electricity. Those things that can’t be done by electricity can often be done by green
hydrogen. Green hydrogen is both a customer of the electricity industry, being
manufactured by electrolysing water using wind and solar power, and also a supplier to it,
by storing the energy and then having it used in a turbine to provide power.
Looking at the production costs of green hydrogen, or for that matter green ammonia there
are two key drivers: the cost of the input power, wind and solar, and the unit cost of the
electrolyser. That is the capital cost of the eletrolyser allocated to each kg of hydrogen
produced. The electrolyser unit cost has itself two drivers, the cost of the equipment, and
the denominator that is the volume that goes through it each year.
It turns out that the capacity utilization of the electrolyser is a big driver of the cost of
hydrogen. This is a big problem because no matter how much wind and solar you throw
at the electrolyser, you still can’t get its natural capacity utilization over, say, 70%, even at
ideal locations like North Queensland or the North West shelf. And even when you do get
the electrolyser capacity up to 70%, you end up with lots of spilled energy as well as spare
capacity.
So, the way to deal with the spilled energy is either to export it into the grid for other uses,
or to use it to charge, say, a battery. Equally, the way to deal with the spare capacity is
either to discharge the battery or import from the grid. Alas, importing from the grid only
works if the grid itself is green.
JULY 2021 PAGE 29Equally, to get capacity utilization up to 70% requires a large wind and solar resource
operating as a portfolio. In short, it’s a scale business.
ORG, as a gentailer, has the potential to sell the excess VRE production into the grid, or to
store it and equally and take production from elsewhere in the portfolio, or even from a
green grid when the hydrogen specific VRE production falls away.
Up to10%
Hydrogen can provide the buffer in a largely wind
and solar grid as the electrolyser is interruptible and
the stored hydrogen can be used for generation
Figure 20. Hydrogen, generation and retailing.
5 mt of hydrogen to Japan by 2030?
For years, hydrogen has been studied as a conceptual solution to Japan’s decarbonsiation
effort. Along with nearly everything Japan has done in decarbonisation, the efforts have
not been particularly successful. Onshore wind in Japan has 3x the LCOE in Europe, never
mind Australia, and there is not the space for solar. ITK has argued that floating offshore
wind could provide part of the answer and perhaps hydrogen can be another part.
Japan currently has a target of 10 mt of hydrogen by 2030 most of which is expected to be
imported. This may be revised with Japan’s next 5-year energy plan expected over the next
few months. We estimate that 10 mt of hydrogen is broadly equivalent to 50 mt of thermal
coal or going on for 40% of Japan’s imports.
JULY 2021 PAGE 30Australia might reasonably hope to supply half that market based on our existing trading
relationship, likely competitive cost of hydrogen and allowing for part to be supplied as
ammonia.
Japan may be one of the first countries to build a large ship powered either by ammonia or
hydrogen but that won’t be before 2028 at the earliest. Again, you can’t easily bet on that
as a reliable source of demand.
It’s power demand where the obvious prize is. Japan’s thermal coal consumption is 130 mt
per year - equivalent to about 26 mt of hydrogen:
Using hydrogen to replace 40% of thermal coal
GJ per ton coal 26
KG of hydrogen per GJ 7
KG of hydrogen per t coal equivalent 182
Japan thermal coal consumption (mt) 132
Equivalent mt of hydrogen for 100% replacement 24.0
Mt hydrogen for 40% replacement of coal by 2030 9.6
Figure 21. Replacing Japan's thermal coal with hydrogen.
Source: ITK
At the moment the immediate prospects are for ammonia to be used in coal generation in
a ratio of say 20% hydrogen energy to 80% coal. This is on the cusp of being tested at two
separate 1000 MW units of the Hekinan power complex. This would be about 160 – 200 KT
of hydrogen. NOx emissions remain an issue, as do the overall safety issues of ammonia in
general. Still, it would only need 4-5 projects of that size to justify a1 mtpa plant.
Sketching a 1 mtpa hydrogen plant…
A discussion of electrolysers is considered in an appendix. Right now, a 10 MW electrolyser
can cost $1 m per MW or more, balance of plant costs including the site and compression
could more than double that cost.
For a 1 mtpa plant, about 8000 MW of electrolyser is needed. We guess the electrolyser
cost falls to A$333/MW and that the non-power balance of plant is 1.2 x that of the
electrolyser. Let’s assume that operating in a highly productive VRE area with an optimised
portfolio of wind and solar, electrolyser capacity utilization is 70% but that nevertheless
the wind and solar capacity is 20% oversized with an average capital cost of $1.6 m/MW.
JULY 2021 PAGE 31About 6.5GW of wind and solar are needed. Total capex is thus about A$15.5 bn before
contingencies etc and most of the capex is the very predictable wind and solar costs. And
that it can be built at low risk in a reasonable time frame. Of course, one could contract
out the power production… but why would you? Management of that is part of the core
competency.
Assumptions for 1 mtpa LNG at 100% capacity use
Electrolyser cost A$$/KW 267
Size MW 8000
VRE capital coast $/MW 1.62
VRE capacity GW 6.72
Electrolyser capex A$m 2133
VRE capital cost A$m 10886
Balance of plant A$m 2560
Total capex A$m 15580
Electrolyser cap use 70%
Non fuelopex $/kg 0.2
Fuel opex $/MWh 10
Figure 22. Hydrogen plant costs. Source: ITK
These numbers are entirely “guesstimates” and have a low range of confidence. Still, 2/3 of
the capital cost is the VRE and we do have good data on that. Because 2/3 of the capex is
VRE and because operating costs are relatively low and therefore don’t impact value to a
great extent, such a project might be able to sustain some debt. After all, even if hydrogen
was a dud, the VRE could still be sold to the broader market. 40% debt funding might get
you an equity IRR close to 15% at a price of US$2.5 kg or around US$18/gj.
The reality of any such project is likely to be far more complex. Our plant has a nameplate
of 1 million tonnes per year but produces 687 kt in this scenario. No electricity modelling
is done, all the surplus/short fall is assumed away. No tax modelling, no opex modelling,
no balance of system modelling etc.
JULY 2021 PAGE 32Hydrogen NPV 1 2 3 4 5 6… ...20 24 25 jotter Price A$/kg 3 3 3 3 3 4 4 4 4 Volume kt 687 687 687 687 687 687 687 687 687 Revenue A$m 2,289 2,312 2,335 2,359 2,382 2,406 2,766 2,878 2,907 Opex A$m (137) (140) (142) (143) (144) (146) (168) (174) (176) Fuel opex A$m (343) (350) (354) (357) (361) (365) (419) (436) (440) Ebitda A$m 1,809 1,822 1,840 1,858 1,877 1,896 2,179 2,268 2,290 Depreciation A$m (623) (623) (623) (623) (623) (623) (623) (623) (623) Ebit A$m 1,185 1,199 1,217 1,235 1,254 1,273 1,556 1,644 1,667 Cash flow Ebitda 1,809 1,822 1,840 1,858 1,877 1,896 2,179 2,268 2,290 Tax on ebit (356) (360) (365) (371) (376) (382) (467) (493) (500) Capex (15,580) 0 0 0 0 0 0 0 0 Total cash flow (14,127) 1,462 1,475 1,488 1,501 1,514 1,712 1,774 1,790 IRR 9.9% Debt 40% weightd cost 1.1% Implied equity return 14.6% Figure 23. Hydrogen concept NPV. Source: ITK JULY 2021 PAGE 33
You can also read