Pan-cancer detection of driver genes at the single-patient resolution
←
→
Page content transcription
If your browser does not render page correctly, please read the page content below
Nulsen et al. Genome Medicine      (2021) 13:12
https://doi.org/10.1186/s13073-021-00830-0

 SOFTWARE                                                                                                                                          Open Access

Pan-cancer detection of driver genes at the
single-patient resolution
Joel Nulsen1,2, Hrvoje Misetic1,2, Christopher Yau3,4 and Francesca D. Ciccarelli1,2*

  Abstract
  Background: Identifying the complete repertoire of genes that drive cancer in individual patients is crucial for
  precision oncology. Most established methods identify driver genes that are recurrently altered across patient
  cohorts. However, mapping these genes back to patients leaves a sizeable fraction with few or no drivers, hindering
  our understanding of cancer mechanisms and limiting the choice of therapeutic interventions.
  Results: We present sysSVM2, a machine learning software that integrates cancer genetic alterations with gene
  systems-level properties to predict drivers in individual patients. Using simulated pan-cancer data, we optimise
  sysSVM2 for application to any cancer type. We benchmark its performance on real cancer data and validate its
  applicability to a rare cancer type with few known driver genes. We show that drivers predicted by sysSVM2 have a
  low false-positive rate, are stable and disrupt well-known cancer-related pathways.
  Conclusions: sysSVM2 can be used to identify driver alterations in patients lacking sufficient canonical drivers or
  belonging to rare cancer types for which assembling a large enough cohort is challenging, furthering the goals of
  precision oncology. As resources for the community, we provide the code to implement sysSVM2 and the pre-
  trained models in all TCGA cancer types (https://github.com/ciccalab/sysSVM2).
  Keywords: Cancer genomics, Cancer driver genes, Systems-level properties, Patient-level driver detection

Background                                                                            as MutSigCV [1] and MuSiC [2] search for genes whose
Cancer is characterised by the acquisition of somatic al-                             mutation rate (single nucleotide variants (SNVs) and
terations of the genome, the majority of which are                                    small insertions or deletions (indels) per nucleotide) is
thought to have little or no phenotypic consequence for                               above the background level. This is because mutations
the development of the disease. Identifying the genes                                 in cancer drivers are more likely to become fixed and
whose alterations instead have a role in driving cancer                               recur across samples than those in non-driver genes.
(cancer drivers) is one of the major goals of cancer gen-                             GISTIC2 [3] adopts a similar approach for recurrent
omics and numerous methods have been developed so                                     copy number variants (CNVs). OncodriveCLUST [4]
far to achieve this.                                                                  and ActiveDriver [5] look specifically for mutations clus-
  Most of these methods work at the cohort-level, which                               tering in hotspot positions or encoding post-
means that they identify driver genes within a cohort of                              translational modification sites. TUSON [6] and 20/20+
patients. For example, recurrence-based methods such                                  [7] predict new drivers based on features of canonical
                                                                                      oncogenes and tumour suppressors, including the pro-
                                                                                      portion of missense or loss-of-function to silent muta-
* Correspondence: francesca.ciccarelli@crick.ac.uk
1
 Cancer Systems Biology Laboratory, The Francis Crick Institute, London NW1           tions occurring across patients. dNdScv [8] computes
1AT, UK                                                                               the nonsilent to silent mutation ratio to identify gene
2
 School of Cancer and Pharmaceutical Sciences, King’s College London,                 mutations under positive selection, while OncodriveFM
London SE1 1UL, UK
Full list of author information is available at the end of the article                [9] focuses on biases towards variants of high functional

                                       © The Author(s). 2021 Open Access This article is licensed under a Creative Commons Attribution 4.0 International License,
                                       which permits use, sharing, adaptation, distribution and reproduction in any medium or format, as long as you give
                                       appropriate credit to the original author(s) and the source, provide a link to the Creative Commons licence, and indicate if
                                       changes were made. The images or other third party material in this article are included in the article's Creative Commons
                                       licence, unless indicated otherwise in a credit line to the material. If material is not included in the article's Creative Commons
                                       licence and your intended use is not permitted by statutory regulation or exceeds the permitted use, you will need to obtain
                                       permission directly from the copyright holder. To view a copy of this licence, visit http://creativecommons.org/licenses/by/4.0/.
                                       The Creative Commons Public Domain Dedication waiver (http://creativecommons.org/publicdomain/zero/1.0/) applies to the
                                       data made available in this article, unless otherwise stated in a credit line to the data.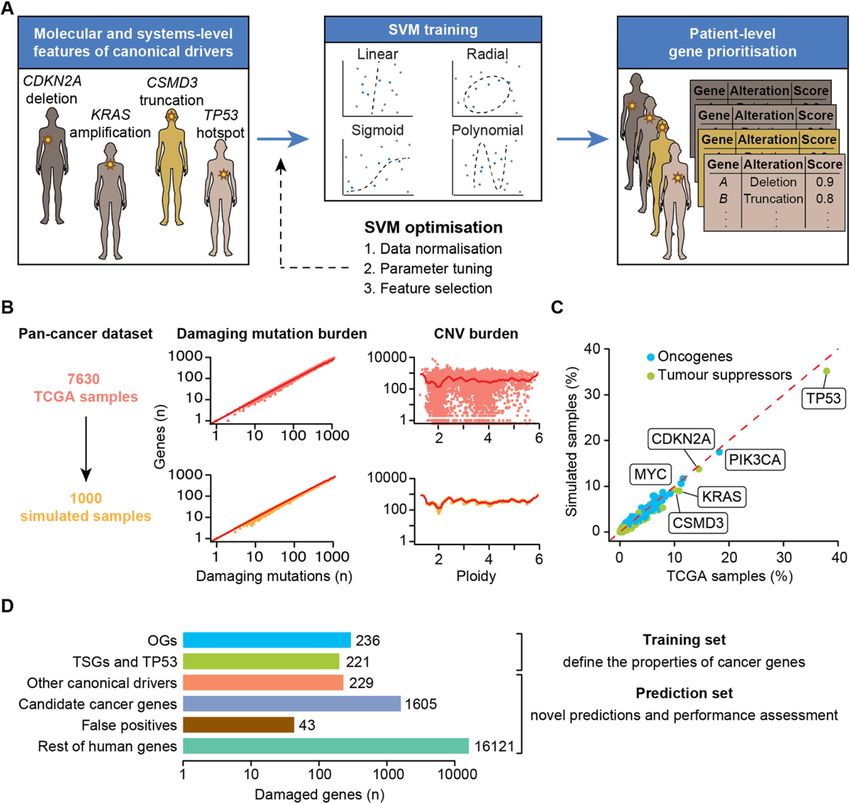
Nulsen et al. Genome Medicine   (2021) 13:12                                                                    Page 2 of 14

impact. Finally, network-based methods like HotNet2            Implementation
[10] incorporate gene interaction networks to identify         The sysSVM approach to driver detection prioritises
significantly altered modules of genes within the cohort.      genes with features similar to those of canonical cancer
Albeit with different approaches, all these methods rely       drivers, i.e. genes whose modifications have experimen-
on the comparison of alterations and/or altered genes          tally proven roles in cancer initiation and progression
across patients.                                               (Additional file 1: Supplementary Note). Canonical
   Cohort-level methods have been of great value leading       drivers differ from other human genes by an array of
to the identification of more than 2000 well-established       systems-level properties that define them as a group and
(canonical) or candidate cancer driver genes [11, 12].         do not strictly depend on the function of the single gene.
However, these approaches fail to identify rare driver         These properties include gene duplicability in the human
events that occur in small cohorts or even in single pa-       genome [20] and through vertebrate whole-genome du-
tients because of low statistical power. Moreover, they        plications [21], gene essentiality across cell lines [11],
are not ideal for application in the clinical setting be-      breadth of expression in healthy tissues at the gene and
cause they return lists of drivers in entire cohorts, rather   protein levels [11, 22, 23], protein connectivity and glo-
than predictions in individual patients.                       bal topology in the protein-protein interaction network
   Patient-level methods ideally predict cancer drivers in     [20], participation in protein complexes [22], number of
each patient but are more challenging to implement. A          targeting miRNAs [21], gene evolutionary origin [21]
few attempts such as OncoIMPACT [13], DriverNet [14]           and protein length and domain organisation [22, 23]
and DawnRank [15] combine transcriptomic and gen-              (Additional file 2: Table S1). Canonical drivers can also
omic data to identify gene network deregulations in indi-      be described using molecular properties that reflect the
vidual samples. Such methods require user-specified            somatic alterations that they acquire in cancer. These in-
gene networks and deregulation thresholds, which can           clude alterations with predicted damaging effects on
affect their results [13]. In addition, matched exome and      protein function (copy number gains and losses as well
transcriptome data from the same sample are not always         as truncating, non-truncating damaging and hotspot
available, especially in clinical settings where shotgun       mutations) and overall mutational burden and copy
transcriptomic sequencing is still rare. Alternative ap-       number of the gene (Additional file 2: Table S1).
proaches such as PHIAL [16] match the patient muta-               To leverage the systems-level and molecular properties
tions with databases of known clinically actionable or         of canonical drivers, sysSVM first identifies a set of true
driver alterations but have a limited capacity to identify     positive canonical drivers damaged within a cohort of
as-yet unknown driver alterations. To overcome this            patients (Fig. 1a). It then uses the features of this posi-
limitation, iCAGES [17] combines deleteriousness pre-          tive set to train one-class SVMs based on four kernels
dictions and curated database annotations to learn fea-        (linear, radial, sigmoid, polynomial). Finally, it ranks the
tures of true positive and true negative driver alterations.   remaining damaged genes in individual cancer patients
   We recently developed sysSVM, a patient-level driver        with a combined score that weights the kernels based on
detection method based on one-class support vector ma-         their sensitivity (Additional file 1: Supplementary Note).
chines (SVMs) [18]. sysSVM learns the distinct molecu-         Highly ranked genes have the most similar properties to
lar features (damaging somatic alterations) and systems-       those of canonical drivers and will be then considered
level features (gene properties) of canonical drivers. It      the cancer drivers for that patient. We use one-class
then predicts as drivers the altered genes in individual       SVMs for sysSVM because, while canonical drivers rep-
patients that best resemble these features. When applied       resent a reliable set of true positives, identifying a true
to 261 patients with oesophageal adenocarcinomas,              negative set of non-cancer genes is not possible. For ex-
sysSVM successfully identified the driver events in every      ample, possible negative genes could be known false
patient [18].                                                  positives of driver gene detection methods [1, 22]. How-
   Here, we further develop sysSVM to be applied to any        ever, these genes are representative of false positives ra-
cancer type and benchmark it against other available ap-       ther than true negatives, so training a classifier on them
proaches, showing that it has a lower false positive rate      is likely to introduce unwanted bias. A one-class support
and better patient coverage. We also develop optimal           vector machine for novelty detection is therefore an op-
models for identifying driver genes in all 34 cancer types     timal way to solve this issue.
available in The Cancer Genome Atlas (TCGA) [19] and
validate them in osteosarcoma, a rare cancer type that         Results
was not part of TCGA. The software, optimised models           Simulation of pan-cancer datasets
and their associated driver predictions are provided as a      In order to optimise the use of sysSVM for any cancer
resource that can be used to identify and study driver         type, we simulated 1000 cancer-agnostic samples starting
events in cancers at the single patient resolution.            from all TCGA tumours with matched mutation, CNV
Nulsen et al. Genome Medicine       (2021) 13:12                                                                                       Page 3 of 14

 Fig. 1 sysSVM approach for driver prioritisation. a Overview of sysSVM. Molecular (somatic SNVs, indels and mutation burden) and systems-level
 features (Additional file 2: Table S1) of damaged canonical drivers in the analysed samples are used for training. The best models of support
 vector machines (SVMs) with four kernels are selected using cross-validation and trained on the whole set of damaged canonical drivers. Finally, a
 combined score is used to prioritise driver genes in individual patients. The SVM implementation was generalised for optimal performance on a
 simulated cancer-agnostic dataset through data normalisation, parameter tuning and feature selection. b Generation of a simulated reference
 cohort from TCGA data. Values of damaging mutation burden and ploidy were randomly assigned to samples. Damaged genes were then
 extracted from real samples with similar values of damaging mutation burden (± 10% for mutations) and ploidy (± 0.1 for CNVs). Dots represent
 individual TCGA (orange) or simulated (yellow) samples. Red lines indicate average numbers of genes with damaging mutations or CNVs in TCGA
 samples, for each given values of damaging mutation burden or ploidy. c Frequencies of canonical drivers in real and simulated samples.
 Oncogene gain-of-function, tumour suppressor loss-of-function and both types of TP53 alterations were considered. d Gene sets used for sysSVM
 optimisation. The training set included oncogenes (OGs) and tumour suppressor genes (TSGs), as well as TP53. All other damaged genes were
 used for prediction and assessment. These included other canonical drivers (without a proven OG or TSG role), candidate cancer genes from
 published cancer sequencing screens, known false positives of established driver detection methods and the remaining damaged genes. Bars
 indicate the number of unique damaged genes across the reference cohort of 1000 simulated samples

and gene expression data (Additional file 1: Supplemen-                     simulated samples (Fig. 1b) and that gene mutation and
tary Methods). We ensured that the tumour mutation                          copy number status in the simulated dataset was the
and copy number burdens were similar between real and                       same of TCGA (Additional file 1: Figure S1A). As a

Nulsen et al. Genome Medicine   (2021) 13:12                                                                      Page 4 of 14

result, the frequency of damaging alterations in known         (Additional file 1: Supplementary Note). All models ro-
oncogenes and tumour suppressors was comparable be-            bustly prioritised canonical drivers above the rest using
tween the two datasets, with TP53, PIK3CA and                  either centred or un-centred data but showed lower per-
CDKN2A among the most frequently altered genes in              formance in distinguishing canonical drivers from false
both (Fig. 1c). We further verified that gene alteration       positives (Fig. 2a). We reasoned that false positives from
frequencies in the simulated data were not significantly       recurrence-based driver detection methods [1] shared
biased by cancer types with large cohort sizes in TCGA         some features with canonical drivers. For example, they
(Additional file 1: Figure S1B), confirming the suitability    encoded long and multi-domain proteins. When remov-
of the simulated data as a representative pan-cancer           ing protein length and number of domains from the fea-
cohort.                                                        ture list (Additional file 2: Table S2), the performance
  The simulated cohort for sysSVM optimisation (here-          substantially improved particularly for un-centred data
after referred to as the reference cohort) was composed        (Fig. 2b). We therefore removed protein length and
of 1000 samples with 18,455 genes damaged 309,427              number of domains from the model.
times. Of these, 686 were canonical drivers with an ex-           Second, we selected the optimal sets of parameters in
perimentally proven role in cancer [12, 24], 1605 were         each kernel. Hyper-parameter choice is known to have
candidate cancer genes from 273 cancer screens [11], 43        substantial impacts on classification and it is an open
were known false positive predictions of driver detection      problem for one-class SVMs [26]. Since the parameters
methods [1, 25] and 16,121 were the remaining damaged          for each kernel needed to be selected separately (Add-
genes (hereafter referred to as the rest of genes; Fig. 1d,    itional file 1: Supplementary Note), we could not use
Additional file 2: Table S2). We annotated seven mo-           AUC of the combined multi-kernel model for assess-
lecular and 25 systems-level features of all damaged           ment. Instead, we used the sensitivity of each kernel to
genes (Additional file 2: Table S1) and used these fea-        predict canonical drivers calculated from three-fold
tures for training and prediction. As a training set, we       cross-validation on the training set. Sensitivity was in-
selected 457 of the 686 canonical drivers with proven          deed a good predictor of the overall AUC of canonical
roles as oncogenes (236) or tumour suppressors (221).          drivers over the rest of genes (Fig. 2c) and false positives
We restricted somatic alterations of oncogenes and             (Fig. 2d). We therefore developed an approach to select
tumour suppressors to gain-of-function or loss-of-             the parameters that conferred the highest sensitivity in
function alterations, respectively (Additional file 1: Sup-    multiple iterations of cross-validation (Additional file 1:
plementary Methods). Since we could not reliably define        Supplementary Methods). In the reference cohort, pa-
the remaining 229 damaged canonical drivers as either          rameters chosen in this way converged within 2000
oncogenes or tumour suppressors, we could not restrict         cross-validation iterations for all kernels (Additional file 1:
their somatic alterations to the appropriate type. There-      Figure S3A).
fore, we did not use them for training but could still use        Finally, since the presence of highly correlated fea-
them for prediction and performance assessment                 tures can hinder SVM performance [27], we per-
(Fig. 1d), together with 43 false positives and 16,121 the     formed systematic feature selection by assessing the
rest of genes.                                                 pairwise correlations between all 25 systems-level fea-
                                                               tures. Four features (gene expression in 1 ≤ tissues ≤ 6
sysSVM optimisation on the pan-cancer reference cohort         and in ≥ 37 tissues; protein expression in 0 ≤ tissues ≤
Using the reference cohort, we optimised sysSVM in             8 and central position in the protein-protein inter-
terms of data normalisation, parameter tuning and fea-         action network) exhibited a significant degree of
ture selection (Fig. 1a). So as not to bias the optimisation   inter-correlation (Pearson |r| > 0.5, FDR < 0.05, Add-
with a particular set of kernel parameters, we imple-          itional file 1: Figure S3B). Removing them led to fas-
mented 512 models with parameter combinations repre-           ter       convergence        of      kernel      parameters
senting a sparse coverage of a standard grid search            (Additional file 1: Figure S3A) and improved perform-
(Additional file 1: Supplementary Note). We then mea-          ance overall (Additional file 1: Figure S3C).
sured the ability of each of these 512 models to prioritise       Based on these results, we chose the default settings
the 229 canonical drivers not used for training over the       for the cancer agnostic SVM classifier, which we
rest of damaged genes or the false positives. We did this      named sysSVM2 [28]. By default, data are un-centred
by computing the area under the curve (AUC) in each            but scaled to have unit standard deviation. Six of the
sample and taking the median AUC as representative of          original systems-level features are excluded resulting
the whole cohort (Additional file 1: Supplementary             in a total of seven molecular and 19 systems-level
Methods).                                                      features (Table 1). Finally, kernel parameters opti-
  First, we derived the optimal settings for data normal-      mised on the reference cohort are provided as a de-
isation in terms of centred and un-centred data                fault (Additional file 1: Figure S3A), although users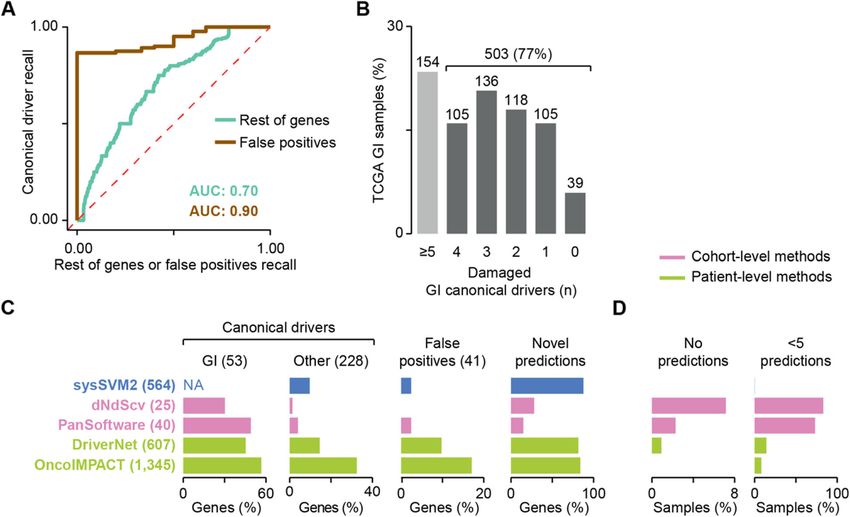
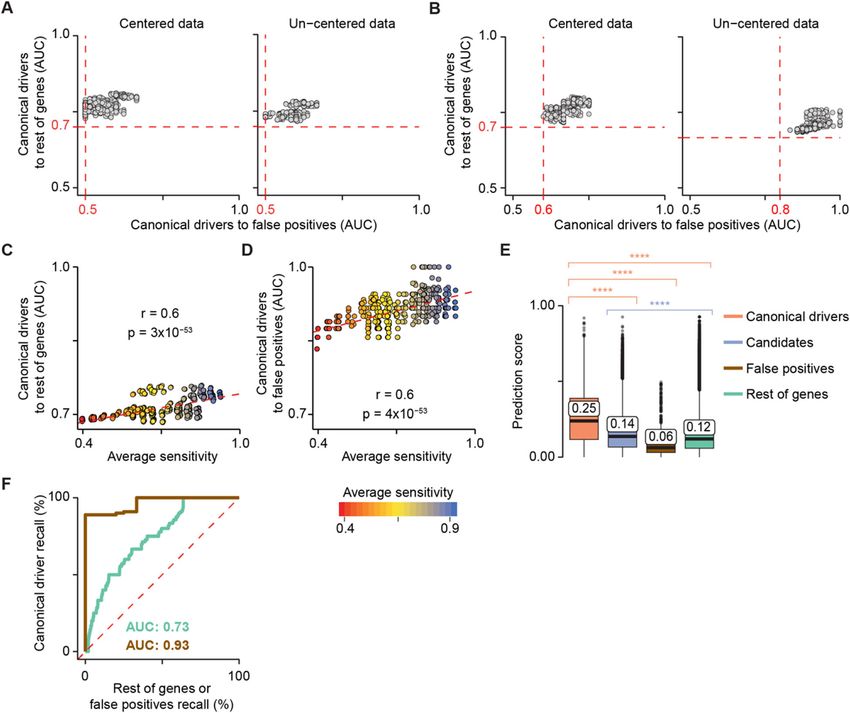
Nulsen et al. Genome Medicine        (2021) 13:12                                                                                          Page 5 of 14

 Fig. 2 sysSVM optimisation on the simulated reference cohort. Model performances on the reference cohort using centred (left) and un-centred
 (right) data with all 25 systems-level features (a) or excluding protein length and number of protein domains (b). A sparse grid of 512 parameter
 combinations in the four kernels was tested. The performance of each model was measured using the area under the curve (AUC), comparing
 the ranks of canonical drivers to the rest of genes and false positives. Median AUC values across all samples were plotted. Red dotted lines
 represent the minimum AUC values. Correlation between model average sensitivity and AUCs of canonical drivers over the rest of genes (c) or
 false positives (d). The sensitivity of each kernel was measured on the training set over 100 three-fold cross-validation iterations. The median
 values over the four kernels are plotted. R and p values from Pearson’s correlation test are reported. Dotted red lines indicate the linear regression
 curves of best fit. e Distributions of sysSVM2 prediction scores for different types of damaged genes in the reference cohort. Whiskers extend to
 1.5 times the interquartile range (IQR). Statistical significance was measured using two-sided Wilcoxon tests. The median values of the
 distributions are labelled. ****p < 2.2 × 10⁻¹⁶. f Receiver operating characteristic (ROC) curves, comparing canonical drivers to the rest of genes
 (green) and to false positives (brown). Recall rates were calculated for each sample separately and the median ROC curve across samples was
 plotted. Median areas under the curve (AUCs) for both comparisons are also indicated

may perform specific cross-validation iterations on                           top ranking positions. We also measured the relative
their own cohorts.                                                            ranks of genes in individual samples using receiver oper-
   We then assessed the performance of sysSVM2 in                             ating characteristic (ROC) curves. Comparing canonical
prioritising cancer drivers over other genes. We con-                         drivers to the rest of genes and to false positives gave
firmed that, overall, the prediction scores of 229 canon-                     AUCs of 0.73 and 0.93, respectively (Fig. 2f), demon-
ical drivers outside the training set were significantly                      strating that canonical drivers were prioritised above the
higher than those of any other gene category (Fig. 2e).                       rest of genes and especially above false positives. This
Candidate cancer genes also scored significantly higher                       was not surprising as the properties of canonical drivers
than the rest of genes, indicating that they were also in                     differ substantially from those of false positives

Nulsen et al. Genome Medicine          (2021) 13:12                                                                       Page 6 of 14

Table 1 Twenty-six features derived from molecular and systems-level properties of genes and used to predict cancer drivers in
sysSVM2. Molecular properties describe gene alterations in individual cancer samples. Systems-level properties are global gene
properties (see also Additional file 2: Table S1)
Category                    Property                                          Feature                                      Type
Molecular                   Gene mutation                                     Mutational load (n)                          Continuous
                                                                              Non-truncating damaging mutations (n)        Continuous
                                                                              Truncating mutations (n)                     Continuous
                                                                              Hotspot mutations (n)                        Continuous
                            Gene copy number                                  Gene copy number (n)                         Continuous
                                                                              Gene is amplified                            Binary
                                                                              Gene is deleted                              Binary
Systems-level               Gene duplication                                  Gene is duplicated                           Binary
                                                                              Gene is an ohnolog                           Binary
                            Gene essentiality                                 Cell lines in which gene is essential (%)    Continuous
                                                                              Gene is essential                            Binary
                            Gene expression                                   Tissues expressing gene (n)                  Continuous
                                                                              Gene is expressed in 0 tissues               Binary
                                                                              Gene is expressed in 7 ≤ tissues ≤ 36        Binary
                            Protein expression                                Tissues expressing protein (n)               Continuous
                                                                              Protein is expressed in ≥ 41 tissues         Binary
                            Protein-protein interaction network (PPIN)        PPIN degree                                  Continuous
                                                                              Protein is a PPIN hub                        Binary
                                                                              PPIN betweenness                             Continuous
                                                                              PPIN clustering coefficient                  Continuous
                            Protein complexes                                 Complexes the protein is part of (n)         Continuous
                            miRNA interactions                                miRNAs targeting the gene (n)                Continuous
                            Gene evolutionary origin                          Pre-metazoan origin                          Binary
                                                                              Metazoan origin                              Binary
                                                                              Vertebrate origin                            Binary
                                                                              Post-vertebrate origin                       Binary
PPIN protein-protein interaction network, miRNA micro RNA

(Additional file 1: Figure S3D), further supporting that                 rank damaged genes in the reference cohort and to com-
known false positives are not representative of non-                     pare their performance.
cancer genes.                                                              The distributions of AUCs of canonical drivers over
                                                                         the rest of genes or false positives were high for all four
Effect of training cohort size on sysSVM2 performance                    cohort sizes (Fig. 3a). This suggested that sysSVM2 was
The sample size of patient cohorts can highly vary across                overall very effective in prioritising cancer genes inde-
cancer types. For example, in TCGA, it ranges from 32                    pendently of the training cohort size. We then compared
samples for diffuse large B cell lymphoma (DLBC) to                      the composition of the prioritised gene list in each sam-
726 for breast cancer (BRCA, Additional file 2: Table                    ple across models of a given size. We measured a com-
S3), with a median of 201 samples. We therefore sought                   position score of the top five genes accounting for the
to address how the sample size of the training cohort af-                number and position of canonical drivers, candidate can-
fected sysSVM2 performance.                                              cer genes and false positive genes (Additional file 1: Sup-
  Starting from all TCGA samples and using the previ-                    plementary Methods). Similar to the AUC, the
ously described approach, we simulated 40 training co-                   composition score of the top five genes was also very
horts, ten of which were composed of ten samples, ten                    similar across training cohorts (Fig. 3b). However, a few
of 100 samples, ten of 200 samples and ten of 1000 sam-                  models trained on ten or 100 samples returned false
ples. We then trained sysSVM2 on each of these 40 co-                    positives in the top five positions while no false positives
horts independently and used the resulting models to                     were predicted by models trained on larger cohorts of
Nulsen et al. Genome Medicine (2021) 13:12 Page 7 of 14 Fig. 3 Effect of cohort size on sysSVM2 performance. a Distributions of AUCs comparing the ranks of canonical drivers to the rest of genes (green) and false positives (brown). Models were trained on ten simulated cohorts composed of ten, 100, 200 and 1000, for a total of 40 simulated cohorts. These were then used to predict on the same reference cohort of 1000 samples. The AUC was measured for each set of predictions in each sample. b Distributions of composition scores of the top five predictions in terms of canonical drivers, candidate cancer genes, false positives and rest of genes (Additional file 1: Supplementary Methods). The composition score was measured for each set of predictions in each sample. Six training cohorts of size ten and two cohorts of size 100 gave negative composition scores in at least one sample, indicating highly ranked false positive genes. c Ratios between observed and expected numbers of canonical drivers and false positives in the top five predictions (O/E ratios). For each size of the training cohort, the percentages of samples with a false positive O/E ratio of zero and canonical driver O/E ratios greater that 2, 5 and 10 are shown (Additional file 1: Supplementary Methods). d Rank-biased overlap (RBO) score of the top five predictions in each sample (Additional file 1: Supplementary Methods). RBO scores measured the similarity between the predictions from every possible pair of models trained on cohorts of a particular sample size. Statistical significance was measured using two-sided Wilcoxon tests. ****p < 2.2 × 10⁻¹⁶. e Distribution of the number of top five predictions shared between models trained with the same cohort size. The overlap was calculated between each pair of predictions in each sample 200 or 1000 samples. Finally, we measured the ratio be- stability. To do so, we measured the rank-biased overlap tween observed and expected canonical drivers and false (RBO) score that compares two ranked lists giving positives in the top five genes (Fig. 3c, Additional file 1: greater weight to the higher-ranked positions [29] (Add- Supplementary Methods). Independently of the training itional file 1: Supplementary Methods). The distributions cohort size, false positives in the top five genes were al- of RBO scores of the top five genes were significantly ways lower than expected, confirming that sysSVM2 effi- higher for large training cohorts compared to those ciently distinguished false positives from drivers. The composed of ten samples (Fig. 3d). Moreover, models number canonical drivers in the top five genes was more trained on large cohorts showed overall higher gene than twice the expected number in > 85% of samples overlap in the top five genes (Fig. 3e). and more than five times the expected value in around These results showed that, although sysSVM2 success- 65% of samples. As with the other metrics, the perform- fully separates canonical drivers from other genes inde- ance of sysSVM2 did not change substantially with the pendently of the training cohort size, small cohorts lead size of the training cohort. to occasional false positive predictions and to unstable Since we used the same reference cohort for predic- gene ranking. Since the median cohort size of TCGA tion, we could directly compare the gene ranks in each cancers is 201 samples, sysSVM2 is likely to separate ca- patient across models, thus assessing their prediction nonical drivers from the rest of genes with a very low
Nulsen et al. Genome Medicine        (2021) 13:12                                                                                          Page 8 of 14

false positive rate and stable gene rankings for most can-                       To identify the list of cancer drivers of each patient,
cer cohorts.                                                                  we adopted a top-up approach. Starting from the GI
                                                                              canonical drivers [11] damaged in each sample, we
Benchmark of sysSVM2 against existing methods                                 added sysSVM2 predictions progressively based on
Next, we sought to compare the predictions of                                 their rank to reach five drivers per patient (Add-
sysSVM2 on real cancer data to those of other driver                          itional file 1: Supplementary Methods). This was
detection methods. To do this, we used 657 gastro-                            based on the assumption that each cancer requires at
intestinal (GI) adenocarcinomas from TCGA (73                                 least five driver events to fully develop, in concord-
oesophageal, 279 stomach, 219 colon and 86 rectal                             ance with recent quantifications of the amount of ex-
cancers, Additional file 2: Table S3). Overall, this co-                      cess mutations arising from positive selection in
hort had 17,122 unique damaged genes, including 438                           cancer [8, 30]. While 154 patients had damaging al-
tumour suppressors and oncogenes used for sysSVM2                             terations in five or more GI canonical drivers, 503 pa-
training (Additional file 2: Table S2). After ranking                         tients (77%) needed at least one prediction (Fig. 4b),
the remaining 16,684 damaged genes, we confirmed                              highlighting the need for additional cancer driver pre-
the overall ability of sysSVM2 to prioritise the 228                          dictions. This resulted in 564 unique sysSVM2
canonical drivers not used for training over the rest                         drivers.
of damaged genes and false positives also in real data                           We then predicted the drivers in the same GI samples
(Fig. 4a).                                                                    using two cohort-level (PanSoftware [31] and dNdScv

 Fig. 4 sysSVM2 benchmark on TCGA gastro-intestinal cancers. a Median receiver operating characteristic (ROC) curves across 657 gastro-intestinal
 (GI) samples from TCGA. Curves compare the ranks of canonical drivers to the rest of genes or to false positives. The median areas under the
 curve (AUCs) are also indicated. b Distribution of GI canonical drivers across the GI cohort. Lists of canonical drivers for each GI cancer type were
 obtained from NCG6 [11] and mapped to samples of the corresponding cancer type where they were damaged. Numbers of samples are
 indicated above each bar. Samples with five or more GI drivers did not require additional driver predictions. c Comparison of performance
 between sysSVM2 and four other driver detection methods. The set of unique drivers predicted by each approach were compared in terms of
 recall of GI canonical drivers, other canonical drivers (non-GI and outside the sysSVM2 training set) and false positives and proportion of novel
 predictions not previously associated with a cancer driver role. The number of genes in each category is reported in brackets. The recall of GI
 canonical drivers could not be assessed for sysSVM2 because these were part of the training set. They were however considered as drivers by
 default, rather than predicted by the algorithm. NA, not applicable. d Proportions of 657 GI samples left with no predicted drivers (left) or fewer
 than 5 predictions. The one sample left with fewer than 5 predictions by sysSVM2 (TCGA-FP-8210, stomach cancer) had four damaged
 genes overall
Nulsen et al. Genome Medicine (2021) 13:12 Page 9 of 14
[8]) and two patient-level (OncoIMPACT [13] and Dri- as on the 34 cancer types separately. In the pan-cancer
verNet [14]) detection methods. PanSoftware integrated setting, we used all 477 tumour suppressors and onco-
26 computational driver prediction tools and we took genes damaged across the whole cohort. In the cancer-
the list of 40 damaged drivers directly from the original specific setting, we used instead only the subsets of these
publication [31], given that we used a large subset (87%) genes damaged in each cancer type (Additional file 2:
of the same TCGA GI samples. We ran the other three Table S3). We then predicted on the remaining damaged
methods with default parameters (Additional file 1: Sup- genes and applied the top-up approach as described
plementary Methods) and obtained 25 predicted drivers above, starting from the cancer-specific canonical drivers
with dNdScv, 607 with DriverNet and 1345 with damaged in each patient (Additional file 2: Table S3).
OncoIMPACT. We found that 6067 samples (79%) required at least one
We compared sysSVM2 to the four other methods in sysSVM2 prediction in order to reach five drivers
terms of recall rates of canonical drivers or false posi- (Fig. 5a). These corresponded to 4369 and 4548 unique
tives, proportion of novel predictions and patient driver genes in the pan-cancer and cancer-specific settings, re-
coverage. Overall, cohort-level methods had higher recall spectively, with a significant overlap of predictions
rates of GI canonical drivers, fewer novel predictions (3896, p < 2.2 × 10− 16, two-sided Fisher’s exact test).
and a comparably low false positive recall than sysSVM2 We then compared the performance of pan-cancer
(Fig. 4c). However, unlike sysSVM2, neither cohort-level and cancer-specific settings of sysSVM2 in prioritising
method predicted drivers in all patients, leaving the vast canonical drivers over rest of genes or false positives.
majority of them with less than five predictions and The AUCs differed significantly (FDR < 0.05) and sub-
some with no predictions (Fig. 4d). stantially (|difference in medians| > 0.05) in only five
Compared to sysSVM2, the other two patient-level cancer types (Fig. 5b, Additional file 1: Figure S5A and
methods had higher recall rates of the 228 canonical S5B). All of them were composed of small cohorts with
drivers, a comparably high proportion of novel predic- < 200 samples and in all cases the pan-cancer setting
tions but higher false positive rate (Fig. 4c). Namely, showed better performance than the cancer-specific set-
sysSVM2 made only one false positive prediction in one ting. The composition score of the top five predictions
patient while DriverNet and OncoIMPACT predicted also differed significantly and substantially (|difference in
four and seven false positives in 124 and 306 patients, medians| > 1) in only three cancer types (Fig. 5c, Add-
respectively (Additional file 1: Figure S4A). Overall, all itional file 1: Figure S5C). All these cancer types were
three methods had high patient driver coverage, but again characterised by small training cohorts and
sysSVM2 outperformed the other two with only one showed higher performance in the pan-cancer setting.
sample where it predicted less than five drivers (Fig. 4d). Predictions of cancer-specific models and the pan-
Interestingly, the overlap of predictions between cancer model were mostly similar, with the exception of
sysSVM2 and the other patient-level methods was statis- cancer types with small training cohorts (Additional file 1:
tically significant (Additional file 1: Figure S4A) even Figure S5D and S5E). Overall, these results confirmed
when only top-up predictions were considered (Add- the trend observed in the simulated data and indicated
itional file 1: Figure S4B). This suggested that the major- that the pan-cancer and cancer-specific settings per-
ity of predictions converged to the same genes. formed similarly well in most cases, except for small co-
These results showed that cohort-level methods have horts where the pan-cancer model performed better.
high specificity and sensitivity to identify cancer-specific Based on these results, we used the pan-cancer setting
canonical drivers but often fail to find drivers in a sub- for cancer types with small cohorts (N < 200) and the
stantial subset of patients. Compared to other patient- cancer-specific setting for the others, as this could reflect
level detection methods, sysSVM2 outperforms them in cancer-type specific biology without jeopardising per-
terms of specificity and patient coverage. formance or stability. The final list of patient-specific
predictions in 34 cancer types was composed of 4470
Compendium of sysSVM2 models and patient-level unique genes, the vast majority of which (93%) were rare
drivers in 34 cancer types (< 10 patients) or patient-specific (Fig. 5d, Add-
In order to provide a comprehensive resource of trained itional file 2: Table S4). A gene set enrichment analysis
models [28] and patient-level drivers, we sought to apply on these genes revealed 984 enriched pathways overall
sysSVM2 to 7646 TCGA samples of 34 cancer types (Reactome level 2 or above, FDR < 0.01, Additional file 1:
with at least one somatically damaged gene (Add- Supplementary Methods, Additional file 2: Table S5).
itional file 1: Supplementary Methods). Interestingly, when mapping these pathways to broader
To find the best training setting for the algorithm on biological processes (Reactome level 1), a few processes
real cancer samples, we compared the performance of were widely enriched in almost all cancer types (Fig. 5e).
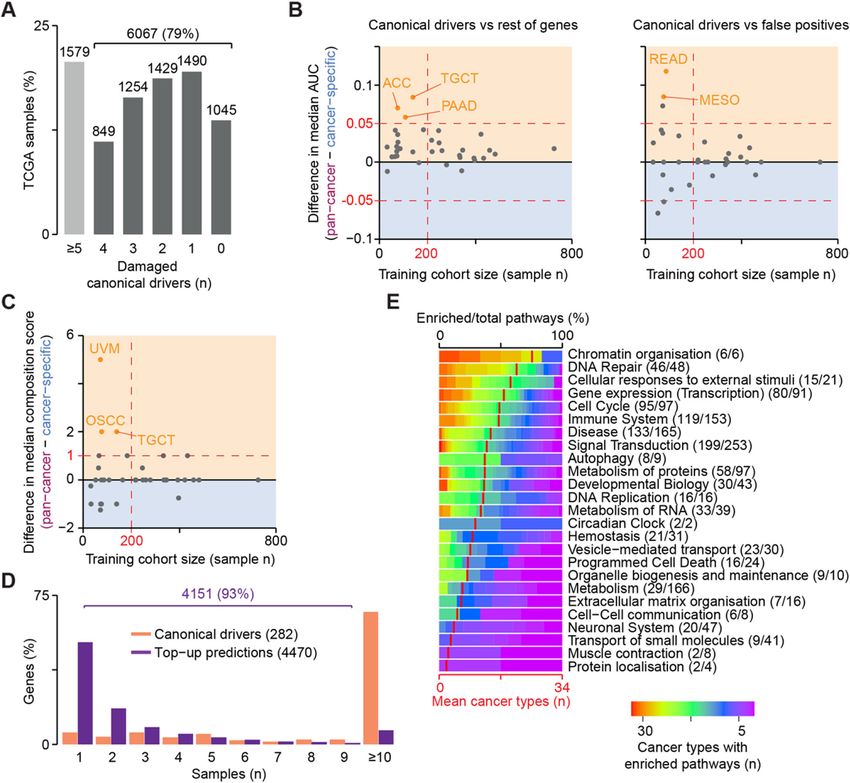
sysSVM2 trained on the whole pan-cancer cohort as well These included well-known cancer-related processesNulsen et al. Genome Medicine (2021) 13:12 Page 10 of 14 Fig. 5 sysSVM2 predictions in 34 cancer types. a Number of damaged canonical drivers per sample. Lists of canonical drivers for each cancer type were obtained from NCG [11] and mapped to samples of the corresponding cancer type. Six thousand sixty-seven samples with less than five canonical drivers damaged underwent the top-up procedure to reach five drivers. Difference in areas under the curve (AUCs) between the pan- cancer and cancer-specific settings in ranking canonical drivers over the rest of human genes and false positives (b) and in the composition score of the top five predictions (c). The median values of the distributions in each cancer type were used for comparison, with the yellow and blue regions indicating better performance in the pan-cancer and cancer-specific settings, respectively. The number of samples used for training is indicated on the x-axis. Colour dots represent cancer types where the two settings differ both significantly (FDR < 0.05, Wilcoxon rank-sum test) and substantially (|difference in medians| > 0.05 for AUCs, > 1 for composition score). ACC, adrenocortical carcinoma; TGCT, testicular germ cell tumours; PAAD, pancreatic adenocarcinoma; READ, rectum adenocarcinoma; MESO, mesothelioma; UVM, uveal melanoma; and OSCC, oesophageal squamous cell carcinoma. d Recurrence of damaging alterations in 282 canonical driver genes and 4470 sysSVM2 top-up predictions across 7646 samples. e Gene set enrichment analysis of sysSVM2 top-up genes, grouped in broad biological processes (Reactome level 1). Numbers of pathways enriched in at least one cancer type out of the total pathways tested are reported in brackets. Red vertical strokes indicate the mean number of cancer types that pathways from each broad process are enriched in (bottom x-axis) such as chromatin organisation [32], DNA repair [33], sysSVM2 predictions in an independent cancer cohort cell cycle [34] and signal transduction [35]. Therefore, We finally sought to assess whether the sysSVM2 although not recurring across patients, sysSVM2 predic- models trained on TCGA could be applied for driver tions converged to perturb similar biological processes prediction in a cancer type not included in TCGA. We that are known to contribute to cancer. therefore analysed 36 osteosarcomas from the Pan-
Nulsen et al. Genome Medicine       (2021) 13:12                                                                                    Page 11 of 14

Cancer Analysis of Whole Genomes (PCAWG) consor-                           Moreover, they included genes known to promote osteo-
tium [30]. Osteosarcoma is a rare, genetically heteroge-                   genesis such as YAP1 and YES1 [38, 39].
neous bone cancer with poor prognosis and only six                           These results showed that sysSVM2 is able to identify
well-established canonical drivers [36, 37].                               reliable cancer drivers in individual patients even for
   We annotated the genomic data of the PCAWG co-                          cancer types not used for training. This has relevant im-
hort finding 4969 damaged genes overall with a median                      plications particularly in the case of rare cancers that are
of 93 damaged genes per sample (Additional file 2: Table                   poorly studied and have little genomic data available.
S2). Only two of these samples had three damaged
osteosarcoma canonical drivers while 19 (53%) of them                      Discussion
had no canonical driver (Fig. 6a), highlighting the need                   Identifying the complete repertoire of driver events in
for further predictions. Given the small cohort size, we                   each cancer patient holds great potential for furthering
used the TCGA pan-cancer setting to rank the damaged                       the molecular understanding of cancer and ultimately
genes in each osteosarcoma. Considering the top five                       for precision oncology. While many recurrent driver
predictions per sample, we got 129 unique genes (Add-                      genes have now been identified, the highly heteroge-
itional file 2: Table S6), which were poorly recurrent                     neous long tail of rare drivers still poses great challenges
across samples (Fig. 6b), reflecting again the genetic het-                for detection, validation and therapeutic intervention.
erogeneity of osteosarcoma.                                                   Our method allows to identify driver genes in indi-
   At the cohort level, sysSVM2 predictions included five                  vidual patients. These genes converged to well-known
of the six (83%) osteosarcoma canonical drivers [36, 37].                  cancer-related biological processes and further studies
At the patient level, the six osteosarcoma canonical                       could potentially use these predictions to investigate
drivers were damaged 27 times and in 14 of these cases                     particular aspects of cancer biology, such as driver
(53%) they were in the top five predictions (Fig. 6c). This                clonality and their progressive acquisition during can-
proportion rose to 81% when considering the top ten                        cer evolution. Extending the algorithm with additional
predictions. In addition to osteosarcoma canonical                         sources of data is another avenue for future work.
drivers, 26 sysSVM2 predictions were canonical drivers                     For example, transcriptomic and epigenomic data
in other cancer types, 16 were candidate cancer driver                     could enhance the ability of sysSVM2 to identify
genes and 81 had no previously known involvement in                        driver events. Additionally, recent efforts have identi-
cancer (Additional file 2: Table S6). Despite this, these                  fied a large number of driver events in non-coding
81 genes were enriched in eight pathways (FDR < 0.1),                      genomic elements [30]. Given such a training set of
most of which have a known role in cancer (Fig. 6d).                       true positives, sysSVM2 could be further developed to

 Fig. 6 Validation of sysSVM2 in osteosarcoma. a Distribution of osteosarcoma canonical drivers across the PCAWG osteosarcoma cohort. Lists of
 canonical drivers for osteosarcoma derived from the literature [36, 37] and mapped to samples where they were damaged. Numbers of samples
 are indicated above each bar. b Recurrence of the 129 sysSVM2 predictions across the PCAWG osteosarcoma cohort. The percentages of genes
 that are predicted in 1, 2 and ≥ 3 are shown. c Patient-level predictions of osteosarcoma canonical drivers by sysSVM2 when considering the top
 five genes. The number of samples in which each canonical driver is damaged (yellow) and predicted as a driver by sysSVM2 (pink) is shown. d
 Gene set enrichment analysis of 81 sysSVM2 predictions with no previously reported involvement in cancer. Reactome level 2 and above were
 considered and pathways with FDR < 0.1 are shown
Nulsen et al. Genome Medicine   (2021) 13:12                                                                                   Page 12 of 14

identify non-coding drivers in individual patients, as        Supplementary Information
long as appropriate features could be identified. The         The online version contains supplementary material available at https://doi.
                                                              org/10.1186/s13073-021-00830-0.
general approach of identifying drivers using a com-
bination of molecular and systems-level properties af-         Additional file 1: Supplementary Note, Supplementary Methods,
fords great flexibility for such developments.                 Supplementary Figures. sysSVM2 rationale and algorithm description.
   It is increasingly common for sequencing studies to in-     Algorithm implementation and assessment. Figure S1. Comparison of
                                                               simulated and TCGA samples. Figure S2. Selection of binary features
tegrate multiple tools for driver detection [31], since        derived for PPIN and tissue expression properties. Figure S3. Parameter
building a consensus can make results robust to the            convergence and feature selection. Figure S4. Patient-level comparison
weaknesses of individual methods. sysSVM2 also has its         of driver detection methods. Figure S5. Setting comparison for sysSVM2
                                                               training on TCGA data.
weaknesses. For example, while systems-level properties
                                                               Additional file 2: Table S1. Features of genes used in sysSVM2. Table
distinguish cancer genes as a set, there are some cancer       S2. Cohorts and genes used in the study. Table S3. Application of
genes that do not follow this trend [11] and are thus          sysSVM2 to TCGA samples. Table S4. Driver predictions in 7646 TCGA
likely to be missed by the algorithm. Our approach in          samples. Table S5. Gene set enrichment analysis of TCGA predictions.
                                                               Table S6. sysSVM2 driver predictions in PCAWG osteosarcomas.
the current work of topping up known driver genes with
predictions from sysSVM2 is a simple example of how
                                                              Abbreviations
sysSVM2 can be used in conjunction with other ap-             SNV: Single-nucleotide polymorphism; Indel: Insertion or deletion; CNV: Copy
proaches. More broadly, it is likely the case that patient-   number variant; SVM: Support vector machine; TCGA: The Cancer Genome
level driver detection will eventually rely on an entire      Atlas; AUC: Area under the curve; ROC: Receiver operating characteristic;
                                                              DLBC: Diffuse large B cell lymphoma; BRCA: Breast cancer; RBO: Rank-biased
ecosystem of different methods. In this work, we have         overlap; GI: Gastro-intestinal; FDR: False discovery rate; PPIN: Protein-protein
demonstrated that there is a place for sysSVM2 in such        interaction network
an ecosystem.
                                                              Acknowledgements
                                                              The results published here are in whole or part based upon data generated
                                                              by The Cancer Genome Atlas managed by the NCI and NHGRI. We thank
Conclusions                                                   Damjan Temelkovski for testing sysSVM2.
In this work, we developed a cancer-agnostic algorithm,
sysSVM2, for identifying cancer driver in cancer individ-     Authors’ contributions
                                                              F.D.C. conceived and directed the study. J.N. performed data simulation and
ual patients [28]. By refining the machine learning ap-
                                                              algorithm assessment and optimisation under the supervision of F.D.C. and
proach upon which the original algorithm was built [18],      C.Y. H.M. carried out the pan-cancer TCGA analysis with the help of J.N.
we broadened its applicability to the pan-cancer range of     F.D.C. and J.N. wrote the manuscript. All authors read and approved the final
                                                              manuscript.
malignancies represented in TCGA. sysSVM2 success-
fully and stably prioritises canonical driver genes for       Funding
most publicly available cancer cohorts. For those com-        This work was supported by Cancer Research UK [C43634/A25487], the
posed of fewer samples, the models optimised on the           Cancer Research UK King’s Health Partners Centre at King’s College London
                                                              [C604/A25135], the Cancer Research UK City of London Centre [C7893/
whole pan-cancer dataset offer a valid alternative. More-     A26233] and innovation programme under the Marie Skłodowska-Curie
over, compared to other patient-level driver detection        grant agreement No CONTRA-766030. JN is supported by the Doctoral Train-
methods, sysSVM2 has better patient coverage and a            ing Centre for Cross-Disciplinary Approaches to Non-Equilibrium Systems,
                                                              funded by the EPSRC [EP/L015854/1].
particularly low rate of predicting established false posi-
tives. sysSVM2 can be used to identify driver alterations     Availability of data and materials
in individual patients and rare cancer types where ca-        Platform-independent R code to implement sysSVM2, along with a README
                                                              file and an example dataset, is available at https://github.com/ciccalab/
nonical drivers are insufficient to explain the onset of      sysSVM2 [28]. The recommended settings as described in this manuscript are
disease, as we have validated in osteosarcoma. This po-       set as default values. However, users can modify many aspects of the
tentially opens up further research and therapeutic           implementation, including selection of features, data normalisation and
                                                              kernel parameters. Models trained in pan-cancer and cancer-specific settings
opportunities.                                                in 34 TCGA cancer types are also provided. This software code is protected
                                                              by copyright. No permission is required from the rights-holder for non-
                                                              commercial research uses. Commercial use will require a licence from the
Availability and requirements                                 rights-holder. For further information, contact translation@crick.ac.uk. All data
Project name: sysSVM2                                         supporting this study are included in the paper.
                                                              Original data for annotating systems-level properties were obtained from the
  Project home page: https://github.com/ciccalab/sysSVM2      following publicly available sources:
  Operating system: Platform independent                      BioGRID [40]: https://thebiogrid.org/
  Programming language: R                                     CORUM [41]: http://mips.helmholtz-muenchen.de/corum/
                                                              DIP [42]: http://dip.doe-mbi.ucla.edu/dip/Main.cgi
  Other requirements: R version greater than 3.5              EggNOG [43]: http://eggnogdb.embl.de/#/app/home
  Licence: Crick Non-commercial Licence Agreement v2.0        GTEx [44]: https://www.gtexportal.org/home/
  Any restrictions to use by non-academics: Commercial        HPRD [45]: http://www.hprd.org/
                                                              MIntAct [46]: https://www.ebi.ac.uk/intact/
use will require a licence from the rights-holder. For fur-   miRecords [47]: http://c1.accurascience.com/miRecords/
ther information, contact translation@crick.ac.uk.            miRTarBase [48]: http://mirtarbase.mbc.nctu.edu.tw/php/index.php
Nulsen et al. Genome Medicine (2021) 13:12 Page 13 of 14
OGEE [49]: http://ogee.medgenius.info/browse/ 13. Bertrand D, Chng KR, Sherbaf FG, Kiesel A, Chia BK, Sia YY, et al. Patient-
PICKLES [50]: https://hartlab.shinyapps.io/pickles/ specific driver gene prediction and risk assessment through integrated
Protein Atlas [51]: https://www.proteinatlas.org/ network analysis of cancer omics profiles. Nucleic Acids Res. 2015;43(7):e44.
Reactome [52]: https://reactome.org/ 14. Bashashati A, Haffari G, Ding J, Ha G, Lui K, Rosner J, et al. DriverNet:
RefSeq [53]: https://www.ncbi.nlm.nih.gov/refseq/ uncovering the impact of somatic driver mutations on transcriptional
networks in cancer. Genome Biol. 2012;13(12):R124.
15. Hou J, Ma J. DawnRank: discovering personalized driver genes in cancer.
Ethics approval and consent to participate Genome Med. 2014;6. Article number: 56.
The need for Institutional Review Board Approval at our institutions (King’s 16. Van Allen EM, Wagle N, Stojanov P, Perrin DL, Cibulskis K, Marlow S, et al.
College London and The Francis Crick Institute) was waived for this study as Whole-exome sequencing and clinical interpretation of formalin-fixed,
all data had previously been generated as part of The Cancer Genome Atlas paraffin-embedded tumor samples to guide precision cancer medicine. Nat
and the Pan-Cancer Analysis of Whole Genomes projects. None of the results Med. 2014;20(6):682–8.
reported in this manuscript can be used to identify individual patients. This
17. Dong C, Guo Y, Yang H, He Z, Liu X, Wang K. iCAGES: integrated CAncer
study was conducted in accordance with the Helsinki Declaration.
GEnome Score for comprehensively prioritizing driver genes in personal
cancer genomes. Genome Med. 2016;8(1):135.
Consent for publication 18. Mourikis TP, Benedetti L, Foxall E, Temelkovski D, Nulsen J, Perner J, et al.
Not applicable. Patient-specific cancer genes contribute to recurrently perturbed pathways
and establish therapeutic vulnerabilities in esophageal adenocarcinoma. Nat
Commun. 2019;10(1):3101.
Competing interests 19. Ellrott K, Bailey MH, Saksena G, Covington KR, Kandoth C, Stewart C, et al.
The authors declare no competing interests. Scalable open science approach for mutation calling of tumor exomes
using multiple genomic pipelines. Cell Syst. 2018;6(3):271–81 e7.
Author details 20. Rambaldi D, Giorgi FM, Capuani F, Ciliberto A, Ciccarelli FD. Low
1
Cancer Systems Biology Laboratory, The Francis Crick Institute, London NW1 duplicability and network fragility of cancer genes. Trends Genet. 2008;24(9):
1AT, UK. 2School of Cancer and Pharmaceutical Sciences, King’s College 427–30.
London, London SE1 1UL, UK. 3School of Health Sciences, University of 21. D’Antonio M, Ciccarelli FD. Modification of gene duplicability during the
Manchester, Manchester M13 9PL, UK. 4The Alan Turing Institute, London evolution of protein interaction network. PLoS Comput Biol. 2011;7(4):
NW1 2DB, UK. e1002029.
22. An O, Dall’Olio GM, Mourikis TP, Ciccarelli FD. NCG 5.0: updates of a
Received: 7 September 2020 Accepted: 8 January 2021 manually curated repository of cancer genes and associated properties
from cancer mutational screenings. Nucleic Acids Res. 2016;44(D1):
D992–9.
References 23. D’Antonio M, Ciccarelli FD. Integrated analysis of recurrent properties of
1. Lawrence MS, Stojanov P, Polak P, Kryukov GV, Cibulskis K, Sivachenko A, cancer genes to identify novel drivers. Genome Biol. 2013;14(5):R52.
et al. Mutational heterogeneity in cancer and the search for new cancer- 24. Vogelstein B, Papadopoulos N, Velculescu VE, Zhou S, Diaz LA Jr, Kinzler KW.
associated genes. Nature. 2013;499(7457):214–8. Cancer genome landscapes. Science. 2013;339(6127):1546–58.
2. Dees ND, Zhang Q, Kandoth C, Wendl MC, Schierding W, Koboldt DC, et al. 25. An O, Pendino V, D’Antonio M, Ratti E, Gentilini M, Ciccarelli FD. NCG 4.0:
MuSiC: identifying mutational significance in cancer genomes. Genome Res. the network of cancer genes in the era of massive mutational screenings of
2012;22(8):1589–98. cancer genomes. Database (Oxford). 2014;2014:bau015.
3. Mermel CH, Schumacher SE, Hill B, Meyerson ML, Beroukhim R, Getz G. 26. Wang S, Liu Q, Zhu E, Porikli F, Yin J. Hyperparameter selection of one-class
GISTIC2.0 facilitates sensitive and confident localization of the targets of support vector machine by self-adaptive data shifting. Pattern Recogn. 2018;
focal somatic copy-number alteration in human cancers. Genome Biol. 74:198–211.
2011;12(4):R41. 27. Weston J, Mukherjee S, Chapelle O, Pontil M, Poggio T, Vapnik V. Feature
4. Tamborero D, Gonzalez-Perez A, Lopez-Bigas N. OncodriveCLUST: exploiting selection for SVMs. Conference on Neural Information Processing Systems; 2001.
the positional clustering of somatic mutations to identify cancer genes. 28. Nulsen J, Misetic H, Yau C, Ciccarelli FD. sysSVM2 software. Ciccarelli lab
Bioinformatics. 2013;29(18):2238–44. 2020. Available from https://github.com/ciccalab/sysSVM2. Accessed
5. Reimand J, Bader GD. Systematic analysis of somatic mutations in December 2020.
phosphorylation signaling predicts novel cancer drivers. Mol Syst Biol. 29. Webber W, Moffat A, Zobel J. A similarity measure for indefinite rankings.
2013;9:637. ACM Trans Inf Syst. 2010;28(4). Article number: 20.
6. Davoli T, Xu AW, Mengwasser KE, Sack LM, Yoon JC, Park PJ, et al. 30. Consortium ITP-CAoWG. Pan-cancer analysis of whole genomes. Nature.
Cumulative haploinsufficiency and triplosensitivity drive aneuploidy patterns 2020;578(7793):82–93.
and shape the cancer genome. Cell. 2013;155(4):948–62. 31. Bailey MH, Tokheim C, Porta-Pardo E, Sengupta S, Bertrand D, Weerasinghe
7. Tokheim CJ, Papadopoulos N, Kinzler KW, Vogelstein B, Karchin R. Evaluating A, et al. Comprehensive characterization of cancer driver genes and
the evaluation of cancer driver genes. Proc Natl Acad Sci U S A. 2016; mutations. Cell. 2018;173(2):371–85 e18.
113(50):14330–5. 32. Morgan MA, Shilatifard A. Chromatin signatures of cancer. Genes Dev. 2015;
8. Martincorena I, Raine KM, Gerstung M, Dawson KJ, Haase K, Van Loo P, et al. 29(3):238–49.
Universal patterns of selection in cancer and somatic tissues. Cell. 2017; 33. Helleday T, Petermann E, Lundin C, Hodgson B, Sharma RA. DNA repair
171(5):1029–41 e21. pathways as targets for cancer therapy. Nat Rev Cancer. 2008;8(3):193–204.
9. Gonzalez-Perez A, Lopez-Bigas N. Functional impact bias reveals cancer 34. Otto T, Sicinski P. Cell cycle proteins as promising targets in cancer therapy.
drivers. Nucleic Acids Res. 2012;40(21):e169. Nat Rev Cancer. 2017;17(2):93–115.
10. Leiserson MD, Vandin F, Wu HT, Dobson JR, Eldridge JV, Thomas JL, et al. 35. Sever R, Brugge JS. Signal transduction in cancer. Cold Spring Harb Perspect
Pan-cancer network analysis identifies combinations of rare somatic Med. 2015;5(4). Article number: a006098.
mutations across pathways and protein complexes. Nat Genet. 2015;47(2): 36. Chen X, Bahrami A, Pappo A, Easton J, Dalton J, Hedlund E, et al. Recurrent
106–14. somatic structural variations contribute to tumorigenesis in pediatric
11. Repana D, Nulsen J, Dressler L, Bortolomeazzi M, Venkata SK, Tourna A, et al. osteosarcoma. Cell Rep. 2014;7(1):104–12.
The Network of Cancer Genes (NCG): a comprehensive catalogue of known 37. Kovac M, Blattmann C, Ribi S, Smida J, Mueller NS, Engert F, et al. Exome
and candidate cancer genes from cancer sequencing screens. Genome Biol. sequencing of osteosarcoma reveals mutation signatures reminiscent of
2019;20(1):1. BRCA deficiency. Nat Commun. 2015;6:8940.
12. Sondka Z, Bamford S, Cole CG, Ward SA, Dunham I, Forbes SA. The COSMIC 38. Kegelman CD, Mason DE, Dawahare JH, Horan DJ, Vigil GD, Howard SS,
Cancer Gene Census: describing genetic dysfunction across all human et al. Skeletal cell YAP and TAZ combinatorially promote bone
cancers. Nat Rev Cancer. 2018;18(11):696–705. development. FASEB J. 2018;32(5):2706–21.You can also read