Papua New Guinea High Frequency Phone Survey on COVID-19 - THE WORLD BANK Data Collection: December 2020 - January 2021
←
→
Page content transcription
If your browser does not render page correctly, please read the page content below
Public Disclosure Authorized

                               THE WORLD BANK

                               Papua New Guinea High Frequency
                               Phone Survey on COVID-19

                               Data Collection: December 2020 – January 2021
Public Disclosure Authorized
Public Disclosure Authorized
Public Disclosure Authorized

                                                                               |1
.
    © 2021 The World Bank
    1818 H Street NW, Washington DC 20433
    Telephone: 202-473-1000; Internet: www.worldbank.org

    Some rights reserved

    This work is a product of the staff of The World Bank. The findings, interpretations, and conclusions expressed in this work do not
    necessarily reflect the views of the Executive Directors of The World Bank or the governments they represent. The World Bank does
    not guarantee the accuracy of the data included in this work. The boundaries, colors, denominations, and other information shown on
    any map in this work do not imply any judgment on the part of The World Bank concerning the legal status of any territory or the
    endorsement or acceptance of such boundaries.

    Rights and Permissions

    The material in this work is subject to copyright. Because The World Bank encourages dissemination of its knowledge, this work may
    be reproduced, in whole or in part, for noncommercial purposes as long as full attribution to this work is given.

    Attribution—Please cite the work as follows: “World Bank. 2021. Papua New Guinea High Frequency Phone Survey on COVID-19
    (Data Collection: December 2020 – January 2021). © World Bank.”

    All queries on rights and licenses, including subsidiary rights, should be addressed to World Bank Publications, The World Bank
    Group, 1818 H Street NW, Washington, DC 20433, USA; fax: 202-522-2625; e-mail: pubrights@worldbank.org.
Photography throughout
Cover Ashleigh Conor ©2014
Page 7 Ashleigh Conor ©2016
Page 28 Ashleigh Conor ©2016
Page 39 Ashleigh Conor ©2015
Page 40 Ashleigh Conor ©2014
Page 48 Ashleigh Conor ©2014
Page 52 Ashleigh Conor ©2014 – Grade 4
Students read books from the classroom
library in Joana Wambriwari classroom
at St Johns Primary School, Port Moresby.

                                            |2
Table of Contents

                   Executive Summary........................................................................................................................................... 5
1.                 Background........................................................................................................................................................ 8
1.1                Update on COVID-19 outbreak in PNG....................................................................................................... 8
1.2                Data Collection.................................................................................................................................................. 10
1.3                Description of Survey Objectives & Instrument......................................................................................11
1.4                Methodology and Fieldwork...........................................................................................................................11
1.5                Re-weighting.......................................................................................................................................................12
2.                 Concern & Prevention..................................................................................................................................... 14
2.1                Concerns regarding COVID-19 on household health........................................................................... 14
2.2                Financial Anxiety............................................................................................................................................... 14
2.3                Protective actions..............................................................................................................................................16
3.                 Employment and Income Response to COVID-19....................................................................................... 18
3.1                Employment.........................................................................................................................................................18
3.2                Employment Income........................................................................................................................................22
3.3                Non-Farm Business..........................................................................................................................................23
3.4                Agriculture...........................................................................................................................................................24
3.5                Remittances........................................................................................................................................................27
3.6                Access to Financial Services.........................................................................................................................28
3.7                Impacts on Poverty & Inequality.................................................................................................................28
4                  Food Security & Food Access........................................................................................................................ 30
4.1                Access to Staple Starch, Proteins, Fruits and Vegetables................................................................ 30
4.2                Food Insecurity..................................................................................................................................................32
5.                 Public Services................................................................................................................................................35
5.1                Water and Sanitation.......................................................................................................................................35
5.2                Education and Schooling.............................................................................................................................. 36
5.3                Access to Health Care.....................................................................................................................................37
6.                 Migration..........................................................................................................................................................40
7.                 Public Trust, Community Security, and Intra-household Conflict........................................................... 41
7.1                Public Trust.......................................................................................................................................................... 41
7.2                Community Security Issues........................................................................................................................... 41
7.3                Child Discipline................................................................................................................................................. 46
7.4                Intra-household conflict................................................................................................................................ 46
7.5                Changes in Child Behavior............................................................................................................................ 48
8.                 Optimism..........................................................................................................................................................49
9.                 Conclusions & Policy Recommendations.................................................................................................... 50
Appendix 1: Technical Appendix.........................................................................................................................................53
A1.1               Instrument Design............................................................................................................................................53
A1.2               Fieldwork and Implementation....................................................................................................................53
A1.3               Sampling...............................................................................................................................................................53
A1.4               Weighting.............................................................................................................................................................55
Appendix 2: Tables...............................................................................................................................................................58
                                                                                                                                                                                         |3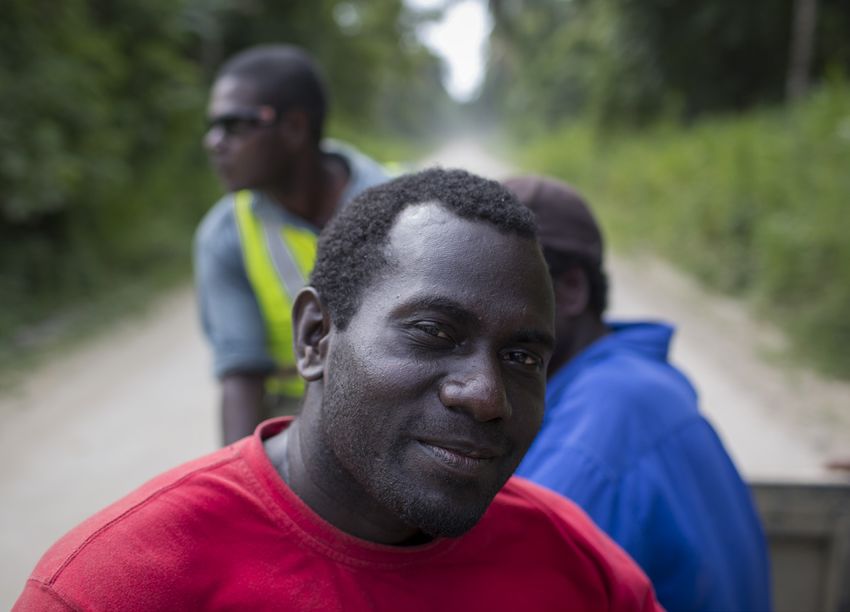
Acknowledgements

This report was written by Kristen Himelein, James Carroll Waldersee, and Masoomeh Khandan of
the World Bank and Stephanie Laryea of UNICEF-PNG using the first and second round of the World
Bank’s High Frequency Mobile Phone Survey to Assess the Socio-Economic Impacts of COVID-19 in
Papua New Guinea and the first round of the UNICEF-PNG’s Social Challenges and Hardship Survey in
Papua New Guinea.

The team gratefully acknowledges the Korea Trust Fund for Economic and Peace-Building Transitions
for financing the data collection and analysis for the World Bank survey and USAID for financing the
analysis of the UNICEF PNG survey. The team also greatly appreciates the contributions of Gwen Maru,
Shuwen Zheng, and Bagus Arya Wirapati in processing the data and informing the analysis, and C.
Jason Smith for his support in editing. The authors thank World Bank colleagues Aneesa Arur, Kathleen
Beegle, Da Woon Chung, Matthew Dornan, Virginia Horscroft, Kari Hurt, Rinku Murgai, Kenia Parsons,
Ilyas Sarsenov, Jane Sprouster, Changqing Sun, Paul Vallely, Netsanet Walelign Workie, Sonya Woo, and
Hassan Zaman, as well as UNICEF colleagues Judith Bruno, Ali Safarnejad, Andrew Musyoki Sammy, and
Jayachandran Vasudevan for their comments on earlier drafts.

The findings, interpretations, and conclusions expressed in this paper are entirely those of the authors.
They do not necessarily represent the views of the International Bank for Reconstruction and Development
/ World Bank, UNICEF and its affiliated organizations, nor those of the Executive Directors of the World
Bank nor the governments they represent.

Abbreviations

CI 		         Confidence Interval
COVID-19      Coronavirus Disease 2019
CSSE 		       Center for Systems Science and Engineering at Johns Hopkins University
DHS 		        Demographic and Health Survey
ECDC 		       European Centre for Disease Prevention and Control
FCS 		        Fragile and Conflict Afflicted Situations
GDP 		        Gross Domestic Products
HFPS 		       High Frequency Phone Survey
HIES		        Household Income and Expenditure Survey
NAT 		        Nucleic Acid Test
NCD 		        National Capital District
NDoH 		       National Department of Health (Papua New Guinea)
NGO 		        Non-Governmental Organization
PNG 		        Papua New Guinea
UNICEF        United Nations International Children’s Emergency Fund
WHO 		        World Health Organization

                                                                                                     | 4| 4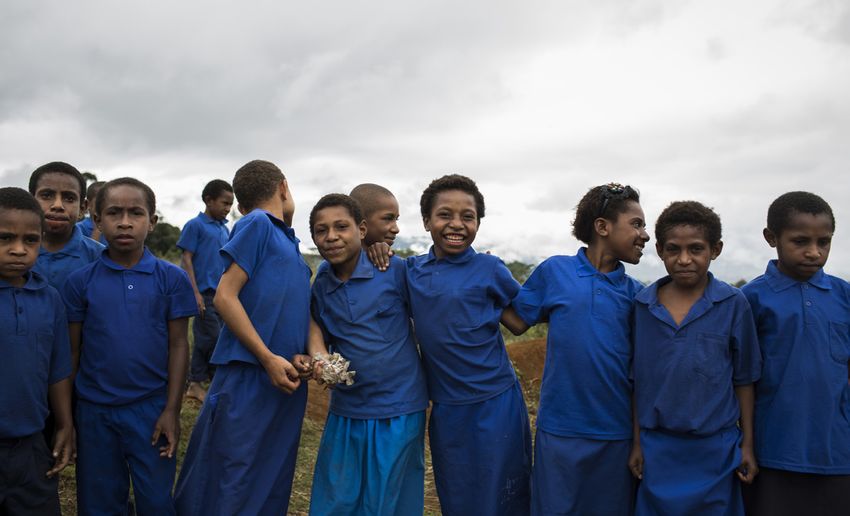
Executive Summary

This joint report by the World Bank and UNICEF PNG presents the findings from two mobile phone
surveys conducted in December 2020 and January 2021 in Papua New Guinea. The World Bank survey,
conducted in December 2020, was the second in a series, with the first round being completed in June
and July 2020. The round 2 survey interviewed a total of 2,820 respondents about their individual and
household conditions, including 1,016 of the original round 1 respondents. These results were weighted
using information from the 2016-2018 Demographic and Health Survey (DHS) to reflect nationally
representative estimates of the socioeconomic impacts of COVID-19. The UNICEF survey, conducted
in January 2021, targeted re-contacting all 2,534 households from the World Bank round 2 survey with
children under the age of 15, and achieved a final sample of 2,449. These results were also weighted
using information from the DHS to develop representative estimates for households with children under
15, 79.8 percent according to the DHS. The UNICEF survey included sections on household impacts as
well as on the children living within the household.

One year into the pandemic, COVID-19 remained a major concern for economic well-being and
household health. Nationally, 77 percent of respondents indicated that they were somewhat or very
worried about their household finances while 92 percent of the households with children under 15 were
somewhat or very worried about their households’ health. In response to the threat to household health
85 percent of households with children indicated taking at least some action in the previous week to
reduce the spread of COVID-19, with the most common being to avoid handshakes, reducing trips to the
market, and avoiding large gatherings. Actions such as more frequent handwashing and mask wearing
were most common in the National Capital District (NCD) area, being practiced at least some of the
time by nearly all respondents from households with children and all of the time by around 40 percent,
but were less common and less frequent in other areas.

More than one-quarter of those working in January 2020 had stopped by December, with the largest
losses in the agricultural sector, while women, those in the service sector, and those in urban areas
have seen comparatively stronger recoveries in employment. Despite some recovery in the second half
of 2020, there remained about a 28 percent loss in total employment between January and December
2020. According to the round 2 World Bank survey, 67 percent of respondents reported working in
the January baseline, compared to 38 percent at the time of round 1 in June and 48 percent at the
time of round 2 in December. Women experienced a more consistent recovery but had lower baseline
participation in employment. These trends may reflect the different types of work done by men and
women. While agriculture was the most common sector for both groups, a larger share of women
worked in the service sector, in particular in retail and trading activities. The agricultural sector had the
highest net loss in jobs over 2020, while the service sector was the most resilient and had the strongest
recovery. In addition, the recovery has been stronger in urban areas than in rural areas, and the share of
women in the workforce was disproportionately urban.

The crisis continued to have serious impacts on the most vulnerable groups, likely leading to increases
in poverty and inequality in 2020. Those in the bottom 40 percent of the wealth distribution have
returned to work more slowly than other groups, and full time, informal sector workers, which includes
most workers in the bottom 40 percent and the middle quintile, as well as those in the informal sector,
were more likely to see reductions in pay if still working. Also, while employment income has rebounded
across all groups and categories, the largest gains were in the top 40 percent. Finally, the recovery in
employment was strongly related to location, with econometric analysis showing higher declines in
employment over 2020 for Chimbu, Enga, Southern Highlands, and Manus Provinces, as well as the
Autonomous Region of Bougainville, compared to the NCD.

                                                                                                          |5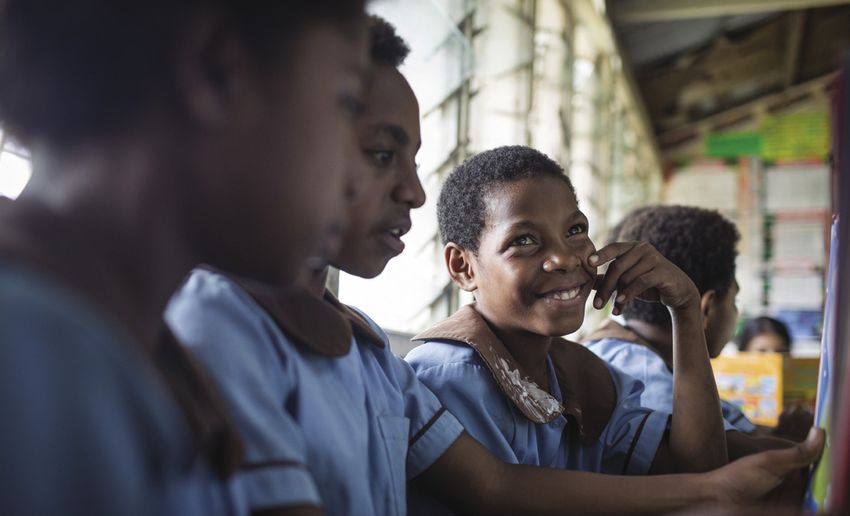
A substantial portion of agricultural households reported declining demand for their products female
headed households continued to disproportionately expect lower or no income from agriculture. In
addition, this round of the World Bank survey collected more detailed information on the agricultural
activities of households, including sales and home production, to explore the possibility of improved
domestic markets for agricultural products as imported food became more expensive or difficult to
find. While the survey found substantially lower consumption of imported foods, households reported
increased home garden production, particularly outside of the top 40 percent, but overall lower demand
for agricultural goods from local markets.

Though supply chains continued to function in both urban and rural areas, there has been a substantial
increase of those that cannot afford to buy food in rural areas. This impact was mitigated to some
extent by the heavy reliance in rural areas on home production, but the marked increase from round 1
of the World Bank survey, coupled with the fact that the bottom 40 percent were the most likely to be
unable to purchase essential food items, indicate a worsening food security environment for the poorest
and most vulnerable groups. These findings were further supported by a substantial decrease in food
insecurity in urban areas between rounds 1 and 2 and a marginal increase in rural areas in the same period.

The incidence and severity of food insecurity varied significantly between urban and rural areas and
within regions. The severity of food security was the lowest in urban areas in the Southern region, and
highest in urban areas of the Island region and in both urban and rural areas of the Momase region.
Coupled with the results on declining food affordability, this finding is further evidence of households
having difficulty in purchasing and growing sufficient food. In the absence of a comparable baseline,
it remains difficult to attribute these issues to COVID-19 or economic decline generally. Additionally,
in comparing the food insecurity findings at the individual level for evidence of inequality within
households, the analysis finds no significant differences in food insecurity between men and women.

Respondents reported declines in public service provision in recent months, with more than one-
third of households with children perceiving declines in the availability of health services in the last
30 days, particularly in urban areas of the Highlands region, and rural areas in the Islands and Southern
regions. Though nationally representative estimates showed limited evidence that COVID-19 was
directly preventing those that needed medical care from seeking it--either as urgent, preventative, or
routine care--the survey results did, however, show there were important differences in access between
geographies and types of care. Also, the main reasons for being unable to access needed care--a lack of
affordability and the inability to travel--point to declining economic conditions and mobility restrictions
as exacerbating existing issues with health care service delivery. The most difficulty in accessing urgent
care occurred in the Highlands region and for those from households in the bottom 40 percent. More
than 95 percent of those in urban areas requiring routine care, such as family planning services or
tuberculosis care, were able to access the needed care, compared to less than 75 percent of those in
rural areas, particularly in the Highlands and Momase regions. In addition, less than 70 percent of those
in the bottom 40 percent of household wealth were able to access needed routine care compared to
98 percent in the top 40 percent. Similar issues were seen in preventative care, including childhood
vaccines and pre-natal care, where there were particular issues among those in the bottom 40 percent
and in the Highlands region, where only about 75 percent of respondents were able to access services,
compared with more than 99 percent in each of the other regions. Respondents noted few issues in
accessing services for children, with nearly all children requiring either preventative or urgent medical
care being able to access health services.

Following the reopening of schools nearly all students returned and there was no evidence of closures
leading to a widening of the gender gap in primary education. Prior to the COVID-19 pandemic, there had
been a modest decline in school attendance between the 2019 and 2020 school years, perhaps reflecting
the already deteriorating economic conditions in PNG. Following school re-openings, nearly all students
returned, with less than 2 percent remaining out of school once the school had reopened, though nearly
20 percent delayed their return. There were no differences between boys and girls in delays or returning
generally. While schools were closed, less than 10 percent of primary and elementary school students
participated in distance learning, with the main reason cited as no materials were provided by the school.

                                                                                                        |6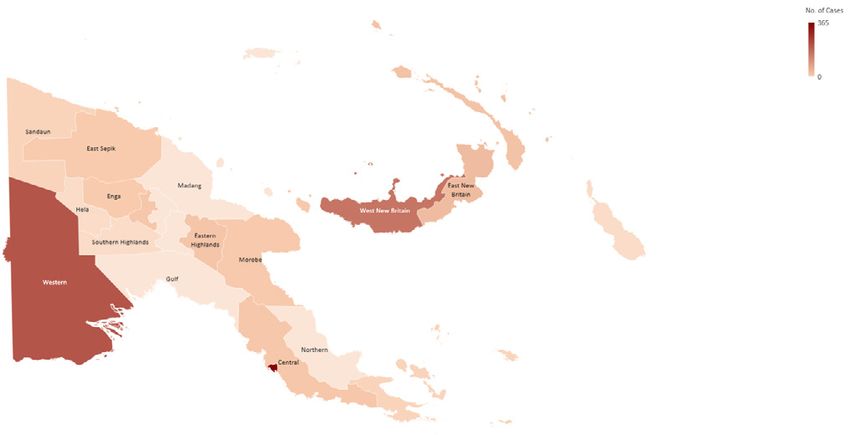
Water, sanitation, and hygiene services were also insufficient to meet household needs. At a time
when handwashing is an important preventative measure to slow the spread of the virus, between 20
and 50 percent of households with children did not have sufficient access to water in the week prior to
the survey, and the majority did not have sufficient access to soap.

While the surveys did not show large deteriorations in public trust and security issues since June,
experiences varied across geography and demographic characteristics and systematic declines were
most evident in the NCD. Compared to the rest of the country, markedly higher shares of respondents
in the NCD noted deteriorations since June in situations related to theft, alcohol and drug abuse,
intimidation by police, violence by police, and domestic abuse, as well as higher declines in overall
community trust, which could be an indicator of rising tensions. In addition, there were potential warning
signs of the impacts of the prolonged crisis on children, with more than one-third of children exhibiting
negative behavioral changes in the previous 15 days--though again a lack of baseline data limits the
ability to establish a causal link specifically with COVID-19.

This report uses data the predates the current rise in cases and therefore should be considered a
snapshot of the situation in December 2020 and January 2021. The next round of data collection is
currently planned to start in early May 2020, though the fieldwork is subject to the ability of the Digicel
call center to continue to operate their call centers safely and effectively.

                                                                                                       |7
Background 1
1.1 Update on COVID-19 outbreak in PNG
Note on recent developments: As of March 2021 there has been a significant surge in confirmed cases
of COVID-19 and an uptick in related deaths across PNG.1 Testing remains limited, and the extent of
the latest outbreak is suspected to be more severe than the confirmed numbers suggest. The data
collection period for the mobile phone surveys analyzed in this report occurred in December 2020 and
January 2021 – prior to the latest widespread outbreak - thus the results presented in this report do not
capture the impacts of these recent developments. The following background section aims to provide
context to the survey results in this report by highlighting the impacts and response efforts to COVID-19
in PNG as of end-January 2021.
Since the round 1 report,2 the number of confirmed cases in PNG has grown from 62 to 834, with 54
cases confirmed in the first two weeks of 2021 (as of January 15, 2021). At the time of the round 2
survey there had been 9 COVID-19 related deaths nationwide since the beginning of the outbreak. Of
the 22 provinces in PNG, 16 had at least one confirmed case between March 2020 and January 2021,
with the highest number of confirmed cases in the NCD (n=365), followed by Western (n=213) and West
New Britain (n=156). By comparison, in January 2021 the neighboring Papua Province of Indonesia had
a total of 6,118 confirmed cases and 134 deaths. In January 2021 the total number of cases remained
comparatively low by international standards; however, the full extent of community transmission was
unclear due to the critically low rates of testing nationally, which also limited the capacity for contact
tracing or understanding community transmission at the local level. Between March 2020 and January
2021 provincial testing rates ranged between less than 4 tests per 100,000 people to 3,700 per 100,000,
with 40,068 cumulative NAT COVID-19 tests nationwide.3 According to the January 12, 2021 joint COVID-19
Situation Report from the PNG National Department of Health (NDoH) and World Health Organization
(WHO), West New Britain and the NCD were at Stage 3--large-scale community transmission--
where most cases had been acquired locally without being linked to specific locations or clusters. 4
At that time the WHO and NDoH expected that delays to swabbing and receiving test results, and an
increase in travel and gatherings over the holiday period, would lead to an increase in the number of
cases through January.
1 As of March 30, 2021, there have been 5,620 confirmed cases and 56 confirmed deaths (COVID-19 Data Repository by the Center for
Systems Science and Engineering [CSSE] at Johns Hopkins University)
2 July 27, 2020 – PNG HFPS Report Round 1 (time of writing).
3 NAT (Nucleic Acid Testing).
4 World Health Organization. Papua New Guinea Coronavirus Disease 2019 (COVID-19) – Health Situation Report 55 (Released: 12 January
2021, Report Period 4-10 January 2021).
|8Figure 1. Confirmed Cases by Province (as of January 15, 2021). Source PNG Official COVID-19 Website.
https://covid19.info.gov.pg/index.php/2021/01/15/western-province-recorded-one-new-covid-19-case-bringing-pngs-total-cases-to-834/. See Table
1 in the appendix for exact figures.
The National Pandemic Act 2020, which was passed on June 16, 2020 to provide a legislative mechanism
to coordinate the public health response, remains in effect. Under a declaration of a pandemic, the
legislation establishes the Office of the Controller as the lead agency to combat COVID-19 and manager
of the Joint Agency Task Force of the National Control Centre for COVID-19, granting the Controller the
regulatory authority to impose health response measures and oversee their implementation. The health
response is guided by the PNG NDoH COVID-19 Emergency Response Plan, which provides a framework
for emergency health response interventions to be implemented from March 20, 2020 to February
2022 and will feed into the development of the forthcoming health sector plan, the National Health Plan
2021–2030. The COVID-19 Emergency Response Plan includes COVID-19 response interventions around
clinical management services, communications, surveillance, laboratory and operations, procurement
and logistics, operational research, and development partner coordination.
In West New Britain, a lockdown was imposed from December 31, 2020 to January 22, 2021 (or until
directed by the Controller) following a spike in confirmed cases. Residents of East New Britain were
urged not to travel to West New Britain and a 10pm-5am curfew was enforced. Public gatherings,
sporting events and cultural activities in West New Britain were suspended, with a few exceptions
for essential services such as supermarkets and pharmacies. Restaurants were required to serve take-
away only (excluding hotels). Nationally, restrictions on movement and health response measures to
combat the disease remained in effect, including, among others, restrictions on international travel and
quarantine protocols. Flights into Port Moresby were permitted from Australia, Hong Kong, Japan, and
the Solomon Islands. The border with the Indonesian Papua Province remained closed, with traditional
crossings by land and water restricted. Physical-distancing measures remained in force and a ban on
gatherings of more than 50 people continued with the exception of sporting events, religious gatherings,
and marketplaces. A ban on nightclubs and bars remained in effect, with take-away alcohol sales only
allowed from Monday to Friday.
|9Government authorities have responded to risks of the pandemic by approving a fiscal package
of emergency health and economic relief measures. In early April 2020, the government mobilized
its resources and appealed to development partners and the private sector for additional support to
protect the economy and livelihoods of vulnerable households and businesses. The ensuing package
of health and economic support measures totaled roughly US$525 million (2.2 percent of GDP) in
2020. Reflecting the government’s limited fiscal space and anticipated revenue shortfalls, the health
and economic support package was financed by external low-cost loans, foreign grants, and the use
of employees’ pension savings in superannuation funds in job-loss cases. Commercial banks agreed
to provide loan repayment holidays to affected households and businesses for three months. The tax
authority provided deferrals for tax filing and payment for two months and prioritized processing of
goods and services tax refunds for medical supplies.
International development partners have also increased their support to the health sector response
and to bolster the economy. Several support packages have been approved since the round 1 report. In
November 2020, Australia approved a AUD$140 million loan to provide additional budget support, which
was used to pay-back Government debt owed to PNG businesses and inject cash into local markets. The
Asian Development Bank, on November 26, approved a US$250 million loan to support PNG’s health
services, budget and economy, the agriculture sector, food rations for vulnerable groups, and loans and
subsidies for small businesses, in addition to increasing its budget support to the health sector from
US$100 million to US$150 million in 2020. PNG has also benefited from a time-bound suspension of
its debt services due to Australia,5 Japan, and Germany6 under the Debt Service Suspension Initiative,
committing the Government to devote its newly freed resources towards the health, economic, and
social impacts of COVID-19. Recent developments in the fight against COVID-19 also include the rapid
development of COVID-19 vaccines, donor coordination, and financial commitments of the international
community to ensure PNG and the Pacific are sufficiently resourced to, once available, achieve high-
levels of immunization against the disease. In October 2020, Australia, in coordination with New Zealand,
committed AUD$144 million (PKG 374 million) to support a three-year vaccine rollout in PNG through
the Regional COVID-19 Vaccine Access and Health Security Initiative and the COVAX Facility – Advance
Market Commitment, and additionally the Government of China has also promised to provide 100,000
vaccines to PNG.
As the situation in PNG continues to evolve, it is critical to continue monitoring both the direct and
indirect impacts of the COVID-19. A prolonged health crisis coupled with a struggling economy and
limited fiscal space for Government intervention could exacerbate existing development challenges,
particularly for the poor and near-poor, and frequent and reliable data are needed to inform
government and development partner responses going forward.
1.2 Data Collection
The data collection for the analysis underlying this report was from two surveys: the second round
of the high frequency mobile phone survey (HFMPS) conducted by the World Bank and the Social
Challenges and Hardship in PNG survey conducted by UNICEF-PNG. As the surveys used overlapping
samples, they were analyzed together, and the results are presented in this joint report. For the World
Bank survey, as with the first round of data collection, all survey instruments and procedures were
designed in accordance with the best practices laid out by the World Bank’s COVID-19 methodology
and measurement task force.7 In addition to the information below, further details are provided in the
technical appendix and in the round 1 report.8 The questionnaire and methodology for the UNICEF
survey was also reviewed by the Living Standards Measurement Study team at the World Bank to
ensure alignment with current international best practices on survey methodology.
5 Australia, Japan and Germany: from 1st May to 31st December 2020. https://clubdeparis.org/en/traitements/
papua-new-guinea-20-08-2020/en.
6 Japan and Germany: 1st January to 30th June 2021
7 The five volume best practice methodological guidelines are available at https://documents.worldbank.org/en/publication/
documents-reports/documentlist?repnb=148213.
8 The round 1 report is available through the World Bank’s Open Knowledge Repository at http://hdl.handle.net/10986/34907.
| 101.3 Description of Survey Objectives & Instrument
The objective of the second round of the World Bank high frequency mobile phone survey was to
measure the continued socioeconomic impacts of COVID-19 in Papua New Guinea, including on
livelihoods, food security, and public safety and security. The length of the survey was limited to 15
minutes and the survey instrument consisted of the following modules: Basic Information, Employment
and Income Loss, Food Access and Food Security, Health, Public Trust and Security, and Assets and
Wellbeing. The questions on employment and income were asked to the respondent and to the household
head if different from the respondent. The recall period for current employment was in the previous
week. In addition, retrospective questions were asked for new respondents about the baseline (“the
start of this year 2020”) as well about the situation at the time of round 1 in June (“June, around the
time of the Queen’s birthday holiday”). The information from the new respondent could then be pooled
with the returning respondents to have three consistent points in 2020. For retrospective questions on
employment, the baseline is defined as “the start of this year 2020” and new households were asked
both about the baseline as well as the situation in early July, corresponding with the implementation of
round 1 of data collection. Three subsequent rounds are planned, with the next in May 2021, though the
implementation calendar may be revised to respond to changing conditions on the ground.
A companion survey sponsored by UNICEF was fielded on the sub-sample of the round 2 households
containing children under age 15. The instrument for this survey included the following modules: Basic
Information, Knowledge and Behavior, Service Delivery, Roster of Children Living in the Household
(including schooling status), Access to Health, Education, Child Discipline, and Life Perspectives, with
the latter three sections being administered specifically about one randomly selected child between the
ages of 3 and 14. This survey can be linked to the World Bank survey through household-level identifiers
and therefore the two data collections can be analyzed together.
1.4 Methodology and Fieldwork
Field work was conducted through a call center set up by Digicel – Papua New Guinea with a staff of
18 interviewers and one field supervisor. The dates of implementation for the World Bank survey were
December 9 through December 31, 2020, and the UNICEF survey was collected between January 6 and
January 24, 2021. Data was collected and managed using the Survey Solutions software package. As
the objective of the survey was to measure changes as the pandemic progresses, the second round of
data collection sought to re-contact all 3,115 households contacted in round 1, though only 1,016 were
successfully re-contacted. A small number of round 1 households declined to participate in round 2
(around 3 percent) and some started but did not complete the round 2 survey (around 2 percent). The
majority of attrition was due to non-contact. Individual respondents were attempted to be reached up
to seven times before the number was abandoned. In 133 cases, the person who answered the phone
was not the original respondent but was a member of the original household. These respondents
were interviewed and treated as a returning respondent for household level analysis, but not as new
respondents for individual level analysis. In an additional 67 cases, the person responding was unaffiliated
with the original household. In these cases, if the person responding agreed, they were interviewed but
considered a new household. In addition, to reach the minimum of respondents, 1,804 replacement
households were added to the survey using Random Digit Dialing targeted based on geography and
economic status (further details are provided in the technical appendix), for a total sample size of
2,820 households.
| 11Figure 2. Timeline of daily confirmed cases in PNG, data collection period and stringency index9
(as of January 18, 2021)
State of Emergency National Pandemic Act
25 100
90
R1 R2
COVID-19 new cases (smoothed)
20 80
70
15 60
50
10 40
30
5 20
10
0 0
0
0
20
20
20
20
0
20
0
0
0
0
0
/2
20
0
0
0
20
20
/2
20
1
/2
/2
/2
/2
/2
/2
/2
/2
/2
/2
4/
5/
6/
8/
7/
2/
9/
1/
/3
2/
/4
/9
/6
/5
/7
/8
1/
0
10
0
/1
4/
4/
3/
3/
2/
/1
/1
1/
20
/1
/1
/1
/1
14
19
19
16
18
18
17
1/
30
30
16
31
15
15
Data collection Soe/pandemic act New cases smoothed Stringency index
Source: COVID-19 Data Repository by the Center for Systems Science and Engineering (CSSE) at Johns Hopkins University; Oxford COVID-19
Government Response Tracker, Blavatnik School of Government; via Our World in Data.
There was substantial overlap between the two surveys. The UNICEF follow-up survey of households
with children interviewed 2,449 of the 2,820 households interviewed in round 2 of the World Bank
survey: 86.8 percent of the total sample, and 96.6 percent of the total 2,534 that were targeted as
having children under age 15. Since the UNICEF survey targeted only households with children, there are
some statistically significant differences between the two datasets, mainly in terms of demographics.
Households without children were smaller, more likely to have female heads, and the respondent had
lower levels of education. Given, however, the small share of these households in total population, the
results from the UNICEF survey can be considered largely representative of the national population. The
same reweighting procedures were used, and the mean wealth index was close to identical between the
two groups. In the report that follows, it is noted where the UNICEF surveys were used. If not explicitly
stated, the analysis used the World Bank dataset.
1.5 Re-weighting
Province level sample size targets were generally maintained, with the most substantial losses coming
in the Southern region outside of the NCD. As in round 1, the sample design targeted a proportional
number of respondents from each province as were interviewed in the 2016-2018 DHS, for a total
minimum sample size of 2,500 respondents. Overall, the achieved sample size was above the target in
all provinces except for Chimbu (98 percent), Southern Highlands (75 percent) in the Highlands region,
New Ireland (90 percent) in the Islands region, Sandaun (88 percent) in the Momase region, Central (83
percent), Western (83 percent), Milne Bay (60 percent), and Gulf (57 percent). Re-weighting was used
to adjust for differences between the targeted and achieved sample sizes to mitigate the impact of bias
on the analysis. At least one household was interviewed in each of the 89 districts.
9 Note on Stringency Index: A higher score indicates a stricter government response (100=strictest). The stringency index is calculated
by OxCGRT using nine specific measures, including school and workplace closures, restrictions on public gatherings, transport restrictions,
and stay-at-home requirements.
| 12Figure 3. Share of targeted sample size achieved by province (rounds 1 & 2)
250%
200%
150%
100%
50%
0%
Gulf
Hela
Enga
Manus
Jiwaka
Central
Chimbu
Morobe
Madang
Milne Bay
East Sepik
New Ireland
Western (Fly)
Oro (Northern)
East New Britain
West New Britain
Eastern Highlands
AR of Bougainville
Western Highlands
Southern Highlands
Sandaun (West Sepik)
National Capital District
Highlands Region Islands Region Momase Region Southern Region
r1 completion rate r2 completion rate
Source: Rounds one and two of the high frequency mobile phone survey.
Re-weighting was also necessary in the World Bank survey to adjust for demographic and wealth
characteristics of households. As in the World Bank round 1 survey, the respondents tended to be
younger, more male, more urban, and more educated than the general population, and their households
tended to be higher on the wealth distribution. Further details on the re-weighting techniques used to
mitigate the impact of the non-random nature of phone surveys are provided in detail in the technical
appendix to this and the round 1 report. One important change implemented in round 2 was to improve
targeting for households believed to be more likely to be poor based on their spending and mobile
phone usage characteristics. Respondents that did not send or receive text messages were believed to
be more likely to be illiterate, which is associated with being poorer. Similarly, respondents that do not
buy their own phone credit, but rather receive it from others, are also believed to be more likely to be
poor. Further details are provided in the technical appendix, but these techniques were at least partially
successful in reducing the bias towards the top of the wealth distribution that was present in round 1.
Re-weighting for the UNICEF survey used similar processes, but the reference population was
households with children instead of the population generally. The base weights for the UNICEF
survey were those from the second round of the World Bank survey. To account for the differences
in the UNICEF sub-sample (households with children under age 15) and the World Bank sample (all
households), as well as to mitigate the impacts on differing response rates between the two surveys,
the base weights were re-calibrated to population means and total for households with children under
age 15 in the 2016-2018 Demographic and Health Survey. In addition, two additional sets of weights
were calculated. One set was for the child roster, which took the re-calibrated household weights as a
base for each child in the household and then applied an additional calibration for age and sex to align
with the DHS demographic profile. This process was repeated for the dataset that collected detailed
information on one randomly selected child within the household.
| 13Concern & Prevention 2
2.1 Concerns regarding COVID-19 on household health
One year into the pandemic, COVID-19 remained a major concern for household health. Nationally,
92.1 percent of the UNICEF survey respondents were somewhat or very worried about their households’
health. These results were consistent across demographic and geographic categories, with no significant
differences across sex and urban/rural locations. Regionally, 86.8 percent of the respondents in Momase
region thought COVID-19 was a threat to their households’ health, which was significantly below the
average for the other regions (93.0 percent in the Highlands region, 94.5 percent in the Islands region,
and 95.5 percent in the Southern region). There were no differences in concern overall across the three
wealth groups, but households in the middle quintile were more likely to indicate that they were very
worried about their health, 77.4 percent, compared to the 62.7 of the bottom 40 percent and the 69.9
percent of the top 40 percent. Figure 4 below show further detail on the results.
Figure 4. Concern someone in the household might become seriously ill from COVID-19
20%
0%
20%
40%
60%
80%
100%
120%
Male Female Urban Rural Highland Island Momase Southern Bottom 40% Middle Top 40%
Region Region Region Region Quintile
National Sex of HH Head Location Region Wealth Group
Very worried Somewhat worried Not too worried Not worried at all
Source: UNICEF mobile phone survey.
2.2 Financial Anxiety
More than three-quarters of the respondents were somewhat or very worried about their households’
finances in the next month, a percentage largely unchanged since round 1. Within the World Bank
round 2 survey, this result was consistent across demographic and geographic categories, with no
significant differences across sex of respondent or household head, location, or wealth status (see
Figure 5 below). Similar to the round 1 findings, those respondents reporting being somewhat or very
worried were most prevalent in the Momase region (88.9 percent) and the Highlands region (77.7
percent), and least prevalent in the Southern (64.6 percent) and Islands (67.3 percent) regions. The
largest shift between rounds came in the Islands region, which had the highest share of those indicating
that they were “very worried” in the first round and the lowest in the second round, though the share of
those indicating they were “somewhat worried” increased to keep the overall percentage of households
experiencing financial stress basically unchanged between the rounds.
Compared to round 1, financial anxiety has decreased among the bottom 40 percent but remains high.
In the first round, 85.6 percent of households in the bottom 40 percent reported being somewhat or
very worried about their household finances. This rate has decreased to 77.3 percent in round 2, though
the share indicating they were very worried remained largely unchanged between 29.3 percent in round
| 141 and 34.0 percent in round 2. Anxiety levels in the middle quintile remained largely unchanged since
round 1, though the decrease for those in the bottom 40 percent now means the middle quintile was
now experiencing the highest levels of financial anxiety, though only by a marginal amount. Financial
anxiety for the top 40 percent decreased from 79.8 percent reporting being somewhat or very worried
in round 1 to 70.4 percent in round 2. Despite these decreases, overall financial anxiety remains quite
high across the country.
Figure 5: Financial anxiety (by sex, location, and well-being status)
100%
80%
60%
40%
20%
0%
Male Female Urban Rural Highland Island Momase Southern Bottom 40% Middle Top 40%
Region Region Region Region Quintile
National Sex of HH Head Location Region Wealth Group
Very worried Somewhat worried Not too worried Not worried at all
Source: Roundt two of the high frequency mobile phone survey
COVID-19 was seen as a substantial threat to household finances going forward. Without a baseline
survey, it is not possible to attribute the levels of financial anxiety seen above directly to the current
crisis. Respondents in households with children, however, did overwhelmingly see COVID-19 as a major
threat to household finances. Nationally 69.7 percent of UNICEF respondents indicated COVID-19 was
a “big threat” to household finances, with an additional 22.4 percent saying it was a mild threat. Only
6.5 percent indicated it was not much of a threat and 1.5 percent said that it was no threat at all.
These findings were consistent across demographic and location characteristics. See Figure 6 below
for further detail.
Figure 6. Threat of COVID-19 to household finances
60%
40%
20%
0%
20%
40%
60%
80%
100%
Male Female Urban Rural Highland Island Momase Southern Bottom 40% Middle Top 40%
Region Region Region Region Quintile
National Sex of HH Head Location Region Wealth group
Very worried Somewhat worried Not too worried Not worried at all
Source: UNICEF mobile phone survey.
| 152.3 Protective actions
The majority of respondents indicated changing their behavior in response to the COVID-19 threat.
The UNICEF survey asked if respondents had undertaken any of the following actions in the previous
week: avoid handshakes or physical greetings; avoid groups of more than 10 people, such as family
gatherings, parties, church, funerals, etc.; stock up on food more than normal; reduce the number of
times you went to the market or grocery store; and avoid travel in crowded public transport. The vast
majority, 85.2 percent, indicated taking at least one of these actions in the previous week. The most
common action was to avoid handshakes (43.5 percent), followed by reducing trips to the market
(37.0 percent), avoiding large gatherings (33.1 percent), avoiding crowded public transportation (30.0
percent), and stocking up on food (29.4 percent). Econometric analysis, as shown in Table 2 in the
appendix, does not show substantial variation across the methods in terms of the characteristics of
the respondent. Women were less likely to reduce their trips to the market or grocery store, but no
more likely than men to undertake any of the other actions or collectively any of the 6. People with
no education or only primary or below were more likely to avoid handshakes and to use one of the
6 methods overall, and people with no education were more likely to avoid public transportation. In
terms of geographic impacts, those living in urban areas of the Highlands and Momase regions were
less likely to avoid handshakes than those in urban areas of the Southern region; those in both urban
and rural areas of the Islands region, as well as rural areas generally, were more likely than those in the
urban Southern region to avoid large gatherings, stock up on more food than normal, and make fewer
trips to the market. There were no significant impacts on the use of crowded public transportation by
geography and those living in urban areas of the Highlands region were less likely overall to use any
of the 6 actions. There were limited wealth effects, with only weakly significant results on households
in the bottom 40 percent being less likely to avoid large gatherings. Overall, however, the explanatory
power of these models was very low, indicating that the decision to undertake various measures was
largely a personal decision. It also demonstrates that potential economic concerns, like the inability to
stock up or store food long term or avoid public transportation, did not appear to be systematically
related to the use of protective measures.
More frequent handwashing was more common than mask wearing, but both were mainly confined to
the NCD area.10 Nationally, 77.8 percent of the UNICEF respondents indicated washing their hands with
soap at least occasionally after being out in public over the seven days prior to the survey, but there
was substantial variation across region and urban/rural locations, with 99.4 percent of respondents in
the urban areas of the Southern region, including the NCD, washing at least some of the time, compared
with 71.9 percent of respondents in the Highlands rural areas. In addition, the frequency of handwashing
was generally higher in urban areas, and in the Southern region specifically. Econometric analysis did
not show any further statistically significant relationships with the sex or education of the respondent,
or the respondent’s household wealth group, but the geographic findings were robust. Regarding the
frequency of mask wearing when in public, the share was highest in urban areas of the Southern region,
81.1 percent, compared with only 32.1 percent in the Momase rural region. In the urban areas of the
Southern region, 36.6 percent of respondents indicated wearing a mask all of the time compared to 5
percent or less in the other areas. In this case, econometric analysis demonstrated that women wore
masks less frequently than men but did not indicate other significant relationships beyond geography.
See Figure 7 and Figure 8 below for further detail on handwashing and mask wearing, respectively, and
Table 3 in the appendix for the full results from the ordered logit regressions.
10 These results exclude a small share of respondents (less than 5 percent nationally and less than 10 percent for any subgroup) that
indicated they had not gone out in public in the previous week.
| 16Figure 7. Practice of handwashing after being in public (by location)
100%
80%
60%
40%
20%
0%
Highland Islands Mamase Southern Highlands Islands Momase Southern
Total Urban Rural
All of the time Most of the time Half of the time Some of the time
Source: UNICEF mobile phone survey.
Figure 8. Practice of mask wearing in public (by location)
100%
80%
60%
40%
20%
0%
Highland Islands Mamase Southern Highlands Islands Momase Southern
Total Urban Rural
All of the time Most of the time Half of the time Some of the time
Source: UNICEF mobile phone survey.
Awareness of government measures to address COVID-19 on healthcare and education were
universally high. Nationally, 90.7 percent of the UNICEF survey respondents were aware of government
measures to address the impact of COVID-19 on healthcare, with a near identical percentage aware
of the measures to address the impact of COVID-19 on education and schooling. Neither descriptive
statistics nor econometric analysis showed any significant variation across geography or demographic
characteristics.
| 17Employment and Income Response to COVID-19 3
3.1 Employment
Though there has been some recovery in employment since June, there remains about a 28
percent loss in total employment between January and December 2020. According to the round
2 dataset, 67.1 percent of respondents reported working in the January baseline, compared to
38.3 percent at the time of round 1 in June and 47.8 percent at the time of round 2 in December.11
Of the total population, 31.4 percent reported being employed in all three periods with 30.2 percent
reporting not working in any of the three periods. The remaining 38.4 percent transitioned into or
out of work at least once over the course of 2020. Of those that stopped working between June and
December, the main reason cited was seasonality, mainly due to the agricultural calendar. Less than 1
percent cited COVID-19 restrictions, which may be unsurprising given that formal “lockdowns” in this
period were generally short and confined to specific areas. Both between the baseline and round 1, as
well as between round 1 and round 2, there was minimal switching of activities, with approximately 95
percent of those employed in both periods remaining in the same main activity. Figure 9 below shows
the movement between work status across the three rounds.
Figure 9. Change in work status by round
January June December
Working
Not working
Source: Rounds one and two of the high frequency mobile phone survey.
11 The percentages reported in this report differ from the estimates from the round 1 report because of the high turnover in respondents
between the two rounds and subsequent replacement with new respondents. Those respondents in both round 1 and round 2 were asked a follow-
up question about their employment status in January 2020 during the June 2020 round as well as their current status in both June (in round 1)
and December (in round 2). For those respondents that were new in December, they were asked retrospective questions about both January and
June, and then their current employment status in December. The weighted percentages for January are very close to the round 1 estimates but
the June estimates are outside the margin of error indicated by the confidence interval for round 1. In round 1, 66.8 percent reported working in
January (CI: 60.2, 73.3) and 53.5 percent (CI: 46.3, 60.6) reported working in June. In round 2, 67.1 percent reported working in January (CI: 60.3,
73.9), 38.2 percent reported working in June (CI: 31.4, 45.1), and 47.8 reported working in December (CI: 40.9, 54.8). It is not possible to tell which
set of statistics is more accurate in the absence of a recent representative baseline survey. The improved coverage of the poorest deciles in round
2 could be considered to be more likely to reflect the true situation of employment. Alternatively, since there was a substantial recall period for
the June statistics that were reported in the December data collection, there could be recall error in those measures. Regardless, however, both
new and returning households showed the same pattern in overall employment: a sharp decline between January and June, followed by a partial
recovery between June and December.
| 18Differing trends in employment were observed between men and women between June and December,
with women experiencing a more consistent recovery, though starting from lower participation rates.
Between January and June, substantial portions of both men and women reported stopping working,
41.3 percent and 47.1 percent respectively, with minimal offset of those previously out-of-work joining
the workforce. From January to June and then to December, there was a net loss of 59.3 percent of
the male baseline workforce between January and June, followed by a net gain of 5.8 percent of male
baseline workforce by December, for an overall change over 2020 of 34.9 percent. For women, there
was a net loss of 54.4 percent of the female baseline workforce between January and June, followed
by a net gain of 24.1 percent of female baseline workforce by December, for an overall change over
2020 of 21.5 percent. Women had lower baseline participation, however, 62.8 percent, compared to 71.3
percent for men. Figure 10 below shows the transitions by round. The difference in these trends may be
related to the differing nature of work between men and women. The two main reasons that men cited
for stopping work between rounds 1 and 2 were that their business or place of employment was closed
for a reason not directly related to the COVID-19 restrictions and because it was not farming season,
indicating both seasonality in employment as well as potentially more long term economic impacts of
a declining economy. For women, a larger proportion were involved in agriculture and retail and market
activities. Most of the losses in these two activities took place in the first part of 2020, with substantial
recovery particularly in retail as stores and markets reopen.
Figure 10. Change in work status by round (by sex)
Men Women
January June December January June December
Working
Working
Not working
Not working
Source: Rounds one and two of the high frequency mobile phone survey.
The agricultural sector had the highest net loss in jobs in 2020. The net loss in agriculture was 37.3
percent of the baseline workforce over the course of the year, compared with 28.6 percent in industry
and 16.1 percent in services. Of those working in agriculture at baseline, 42.3 percent indicated working
in all three periods, while 25.4 percent remained out of work in December after stopping between
January and June and a further 13.1 percent had stopped between June and December. The remaining
19.2 percent that stopped working between January and June had resumed activities by December.
The service sector showed both the most resilience as well as the strongest recovery. Of those
working in services at the baseline, 54.6 percent remained working through all three periods and 24.4
percent had stopped working in June but had resumed by December. Of the remainder, 19.9 percent
had stopped working between January and June and had not resumed as of December, while 1.1 percent
had stopped working between June and December. The overall change was therefore a 16.1 percent
decline. Within the service sector, those engaged in retail and trading were both most likely to remain
working across all three periods as well as return to work between June and December. Those engaged
| 19You can also read