PEARL MILLET AQUAPORIN GENE PGPIP2;6 IMPROVES ABIOTIC STRESS TOLERANCE IN TRANSGENIC TOBACCO
←
→
Page content transcription
If your browser does not render page correctly, please read the page content below
ORIGINAL RESEARCH
                                                                                                                                               published: 09 March 2022
                                                                                                                                          doi: 10.3389/fpls.2022.820996

                                             Pearl Millet Aquaporin Gene
                                             PgPIP2;6 Improves Abiotic Stress
                                             Tolerance in Transgenic Tobacco
                                             Palakolanu Sudhakar Reddy 1* , Mahamaya G. Dhaware 1 , Kaliamoorthy Sivasakthi 1 ,
                                             Kummari Divya 1 , Marka Nagaraju 2 , Katamreddy Sri Cindhuri 1 ,
                                             Polavarapu Bilhan Kavi Kishor 3 , Pooja Bhatnagar-Mathur 1† , Vincent Vadez 1 and
                                             Kiran K. Sharma 1
                                             1
                                              International Crops Research Institute for the Semi-Arid Tropics (ICRISAT), Patancheru, India, 2 Department of Biochemistry,
                                             ICMR – National Institute of Nutrition, Hyderabad, India, 3 Department of Biotechnology, Vignan’s Foundation for Science,
                            Edited by:       Technology & Research (Deemed to be University), Vadlamudi, India
                 Wolfram Weckwerth,
          University of Vienna, Austria
                                             Pearl millet [Pennisetum glaucum (L) R. Br.] is an important cereal crop of the semiarid
                    Reviewed by:
                                             tropics, which can withstand prolonged drought and heat stress. Considering an active
                Suprasanna Penna,
     Bhabha Atomic Research Centre           involvement of the aquaporin (AQP) genes in water transport and desiccation tolerance
                       (BARC), India         besides several basic functions, their potential role in abiotic stress tolerance was
                      Vadim Volkov,
      London Metropolitan University,        systematically characterized and functionally validated. A total of 34 AQP genes from
                   United Kingdom            P. glaucum were identified and categorized into four subfamilies, viz., plasma membrane
                 *Correspondence:            intrinsic proteins (PIPs), tonoplast intrinsic proteins (TIPs), nodulin-26-like intrinsic
         Palakolanu Sudhakar Reddy
                                             proteins (NIPs), and small basic intrinsic proteins (SIPs). Sequence analysis revealed
         p.sudhakarreddy@cgiar.org;
        palakolanusreddy@gmail.com           that PgAQPs have conserved characters of AQP genes with a closer relationship
                   † Present address:        to sorghum. The PgAQPs were expressed differentially under high vapor pressure
              Pooja Bhatnagar-Mathur,        deficit (VPD) and progressive drought stresses where the PgPIP2;6 gene showed
        International Maize and Wheat
      Improvement Center (CIMMYT),           significant expression under high VPD and drought stress. Transgenic tobacco plants
                      Texcoco, Mexico        were developed by heterologous expression of the PgPIP2;6 gene and functionally
                                             characterized under different abiotic stresses to further unravel their role. Transgenic
                   Specialty section:
         This article was submitted to       tobacco plants in the T2 generations displayed restricted transpiration and low root
                  Plant Biotechnology,       exudation rates in low- and high-VPD conditions. Under progressive drought stress,
               a section of the journal
            Frontiers in Plant Science
                                             wild-type (WT) plants showed a quick or faster decline of soil moisture than transgenics.
       Received: 23 November 2021
                                             While under heat stress, PgPIP2;6 transgenics showed better adaptation to heat
        Accepted: 13 January 2022            (40◦ C) with high canopy temperature depression (CTD) and low transpiration; under
         Published: 09 March 2022            low-temperature stress, they displayed lower transpiration than their non-transgenic
                              Citation:      counterparts. Cumulatively, lower transpiration rate (Tr), low root exudation rate, declined
              Reddy PS, Dhaware MG,
   Sivasakthi K, Divya K, Nagaraju M,        transpiration, elevated CTD, and lower transpiration indicate that PgPIP2;6 plays a role
        Sri Cindhuri K, Kavi Kishor PB,      under abiotic stress tolerance. Since the PgPIP2;6 transgenic plants exhibited better
    Bhatnagar-Mathur P, Vadez V and
        Sharma KK (2022) Pearl Millet
                                             adaptation against major abiotic stresses such as drought, high VPD, heat, and cold
 Aquaporin Gene PgPIP2;6 Improves            stresses by virtue of enhanced transpiration efficiency, it has the potential to engineer
Abiotic Stress Tolerance in Transgenic       abiotic stress tolerance for sustained growth and productivity of crops.
                              Tobacco.
          Front. Plant Sci. 13:820996.       Keywords: canopy temperature depression (CTD), exudation rate, Pennisetum glaucum, PgPIP2;6, progressive
       doi: 10.3389/fpls.2022.820996         drought stress, transpiration rate, transpiration efficiency, vapor pressure deficit

Frontiers in Plant Science | www.frontiersin.org                                    1                                           March 2022 | Volume 13 | Article 820996
Reddy et al.                                                                                           PgPIP2;6 Gene Role in Abiotic Stress Tolerance

INTRODUCTION                                                               (Zhang et al., 2013), but were not identified in monocots. These
                                                                           subclasses have been defined based on sequence similarity as
Pearl millet [Pennisetum glaucum (L) R. Br.], which is a                   well as intracellular localization (Maurel et al., 2015). AQPs
diploid (2n = 14) cereal crop from the Poaceae family, is                  received special attention due to their association with water
the sixth most important cereal crop providing food security               deficit conditions and correlated with the abiotic stress tolerance
to over 500 million people across Africa and Asia. It is                   mechanism (Sreedharan et al., 2013; Afzal et al., 2016). Although
known to be a versatile dryland cereal used as multi-purpose               a few AQPs have been identified and functionally characterized
crop for food, feed, fuel, construction material, and forage,              from crop plants, except for some preliminary reports, there is
especially in the arid and semiarid regions (Nambiar et al.,               no detailed investigation on the functional validation of the AQP
2011; Vadez et al., 2012). Its germplasm displays a high degree            gene family in millets, including pearl millet (Reddy et al., 2017;
of genetic diversity and variable tolerance to most of the                 Grondin et al., 2020).
abiotic stresses, thereby providing better grain yield in areas                Studies on AQPs have been demonstrated in both model
that are too harsh for profitable production of other cereals              and crop plants under different abiotic stresses, where the PIP
like rice, wheat, sorghum, and maize. Pearl millet possesses               family has been shown to play a major role in abiotic stress
abiotic stress tolerance due to efficient water conservation               tolerance by modulating the water transport pathway (Fetter
mechanisms (Kholová et al., 2010a; Reddy et al., 2017, 2021),              et al., 2004; Yaneff et al., 2014). The overexpression of the
which is considered as an efficient way of enhancing crop                  RsPIP2;1 gene has been shown to enhance drought and salt
yield under terminal drought stress (Kholová et al., 2010a;                tolerance in transgenic Eucalyptus (Tsuchihira et al., 2010), while
Zaman-Allah et al., 2011b; Belko et al., 2012). Enhanced water             TdPIP1;1 and TdPIP2;1 from durum wheat and HvPIP2;5 from
conservation traits/genes that relate to hydraulic processes in the        barley have been shown to improve salinity and osmotic stress
plant would be highly desirable for better drought adaptation              tolerance in tobacco and Arabidopsis, respectively (Ayadi et al.,
of pearl millet cultivars (Kholová et al., 2010a,b, 2012; Reddy            2011; Alavilli et al., 2016). Upon overexpression of AQPs from
et al., 2017, 2021; Tharanya et al., 2018). The rapid response of          tomato (SlPIP2;1, SlPIP2;7, or SlPIP2;5) and rice (OsPIP1 and
the transpiration rate (Tr) to increased vapor pressure deficit            OsPIP2) in Arabidopsis, higher hydraulic conductivity levels and
(VPD) suggests a possible role of hydraulic signals mediating              survival rates were displayed under drought stress conditions
the Tr response upon rising VPD. These hydraulic signals                   (Mosa et al., 2012; Li et al., 2016). Specific AQP inhibitors, such
are regulated by aquaporins (AQPs), the specialized membrane               as HgCl2 , AgNO3 , and H2 O2 , have rapidly reduced the root
transporters that play a pivotal role in conducting water at the           hydraulic conductivity in chickpea and pearl millet (Sivasakthi
cellular level (Reddy et al., 2017; Shekoofa and Sinclair, 2018;           et al., 2017a, 2020; Tharanya et al., 2018). Grondin et al.
Tharanya et al., 2018).                                                    (2020) reported that pearl millet genotypes contrasting for water
   Aquaporins (AQPs) are members of the Major Intrinsic                    use efficiency differed in AQP gene expression. PgPIP1;3 and
Proteins (MIP) family, which is represented in all kingdoms from           PgPIP1;4 were significantly more expressed in the low-water-use
archaea, animals to plants (Gomes et al., 2009; Maurel et al., 2015;       efficiency line than the high-water-use efficiency line. In addition,
Deshmukh et al., 2016). They are 23–31 kDa proteins having                 the low-water-use efficiency line has more reduction of root
several specific characteristic features, including transmembrane          hydraulic conductivity by azide (AQP inhibitor) treatment than
helices (TM) linked by five inter-helical loops (LA-LE) and                the high-water-use efficiency line. Our earlier report, PgPIP2;3,
conserved dual aspargine-proline-alanine (NPA) motifs (Maurel              showed higher transcript abundance in a high transpiration
et al., 2008). A number of AQPs have been identified in diverse            rate (TR) than the low TR line under high-VPD conditions
plant species, including 35 in Arabidopsis (Johanson et al., 2001),        (Reddy et al., 2017).
43 in maize (Chaumont et al., 2001), 34 in rice (Sakurai et al.,               The overexpression of the StPIP1 gene was shown to
2005), 58 in Populus (Gupta and Sankararamakrishnan, 2009),                ameliorate drought tolerance in potato where it improved
72 in soybean (Zhang et al., 2013), 41 in Sorghum (Reddy                   water use efficiency, increased non-structural carbohydrates,
et al., 2015a), 57 in Brassica rapa (Sonah et al., 2017), 28 in            thereby minimizing carbon starvation, and increasing biomass
Beta vulgaris (Kong et al., 2017), 65 in wheat (Madrid-Espinoza            yield (Wang et al., 2017). The ectopic expression of MaPIP1;1
et al., 2018), 41 in Setaria italica (Singh et al., 2019), 39 in           and MaPIP2;7 was shown to display multiple abiotic stress
cucumber (Zhu et al., 2019), 76 in tobacco (De Rosa et al., 2020),         tolerance in transgenic banana (Xu et al., 2020, 2021),
and 38 in pomegranate (Liu et al., 2021). Plant AQPs show                  while transgenic rice overexpressing OsPIP1;3 promoted
a high degree of gene multiplicity and assembled as tetramers              plant growth and water uptake (Liu et al., 2019). More
that are typically divided into seven subfamilies, including               recently, PePIP2;7 from bamboo has been demonstrated
plasma membrane intrinsic proteins (PIPs), tonoplast intrinsic             to confer abiotic stress tolerance in yeast and Arabidopsis
proteins (TIPs), nodulin-26-like intrinsic proteins (NIPs), and            (Sun et al., 2021).
small basic intrinsic proteins (SIPs) that have been identified                Since pearl millet is a robust cereal crop of the semiarid
in both primitive and higher plants (Anderberg et al., 2012).              tropics, it is important to understand different components of the
Hybrid intrinsic proteins (Hips), GlpF-like intrinsic proteins             abiotic stress tolerance mechanism. We systematically analyzed
(GIPs) (Danielson and Johanson, 2008), and X-intrinsic proteins            the sequences and relative expression of all PgAQPs under high
(XIPs) have only been identified in mosses as well as several              VPD and progressive drought stress, besides the functional
dicotyledonous plants (Bienert et al., 2011), including soybean            characterization of the PgPIP2;6 gene in tobacco. This work

Frontiers in Plant Science | www.frontiersin.org                       2                                     March 2022 | Volume 13 | Article 820996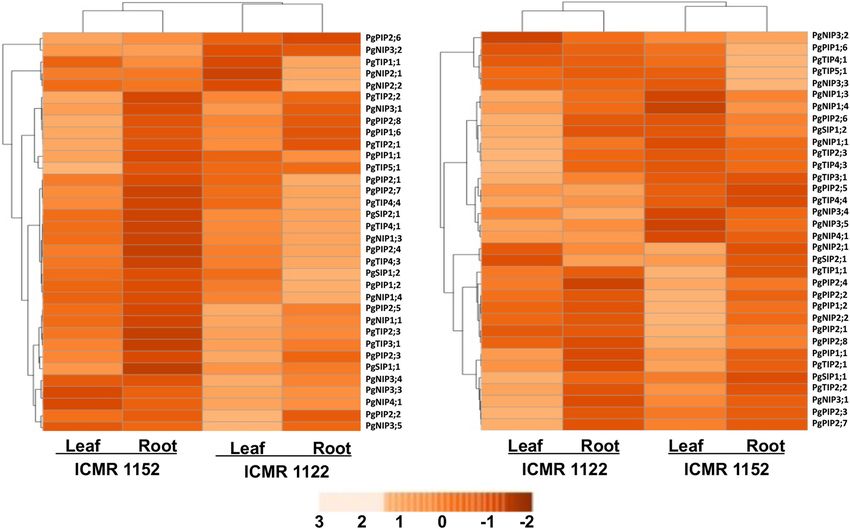
Reddy et al.                                                                                                 PgPIP2;6 Gene Role in Abiotic Stress Tolerance

provides insights on the molecular basis of water conservation          tools, such as PatchDock11 and FireDock12 , were used to dock
mechanisms in pearl millet.                                             the model against its ligand. For converting the Structure Data
                                                                        File (SDF) into Protein Data Bank (PDB) format, Marveanbeans
                                                                        software was used, while for docking the model with ligand
                                                                        PatchDock, an online server was utilized and the results were
MATERIALS AND METHODS
                                                                        visualized by PyMol.
Identification of Pearl Millet Aquaporin
                                                                        Plant Material and Abiotic Stress
Genes
Pearl millet AQP gene sequences were retrieved using maize,
                                                                        Treatments
rice, and sorghum AQP genes as a search query and scanned               In a previous study, we have selected two pearl millet genotypes
against the pearl millet genome by NCBI blast N, X, and P               (ICMR 1152 and ICMR 1122), contrasting for VPD (Serraj et al.,
databases. Chromosomal locations of PgAQPs were determined              2005; Reddy et al., 2017, 2021). These genotypes were used to
with the information obtained from the pearl millet genome              express PgAQPs under high VPD and progressive drought stress.
database1 . The intron-exon structures were predicted using the         In the case of tobacco, both the transgenic and wild-type plants
Gene Structure Display Server2 (Hu et al., 2015), and the MOTIF         were grown in controlled glasshouse conditions at 26◦ C (14-h
search3 was used to retrieve the conserved domains. Sequence            day) and 20◦ C (10-h night) 45 DAS. These plants were further
analysis, including the open reading frame (ORF) and amino              subjected to progressive drought stress (Kholová et al., 2010a)
acid (AA) translations, molecular weight, and isoelectric point         and high VPD (Reddy et al., 2017, 2021) where the controls
(pI) of PgAQP genes, was analyzed using the MacVector software          were maintained at 26◦ C for high-VPD treatment. Leaf and root
(V16.09). The GRAVY (grand average of hydropathicity)                   tissues from the respective plants were collected and immediately
instability and aliphatic indices were predicted by employing           snap frozen in liquid nitrogen for total RNA extraction and qRT-
ProtParam of Expasy tools4 (Gasteiger et al., 2005). WoLFPSORT          PCR analysis. Three biological replicates were maintained and
II5 was used to predict the subcellular locations (Guo et al.,          collected for each stress treatment.
2015), while the TMHMM server6 was used to screen the putative
trans-membrane helices (Möller et al., 2001). Phosphorylation           Cloning and Genetic Transformation of
sites (serine, threonine, and tyrosine) of the PgAQPs were              PgPIP2;6 Gene
searched using the NetPhos 3.17 program (Bloom et al., 2004).           Based on the expression profile, PgPIP2;6 gene was selected and
Multiple sequence alignment (MSA) and phylogenetic analysis             PCR amplified from the pearl millet cDNA and cloned between
were carried out with full-length protein sequences of closely          the CaMV35S - Nos terminator in the Gateway-compatible
related AQPs from monocots and dicots using the ClustalW                entry vector (pL12R34H-Ap) by digesting with NdeI and NotI
program of MacVector and MEGA 6.0 (Tamura et al., 2013).                restriction enzymes. The expression cassette of PgPIP2;6 gene
Bootstrap analysis was performed using 1,000 replicates, and the        (CaMV35S:PgPIP2;6:NosT) from the entry vector was further
branch lengths corresponded to phylogenetic distances in units          cloned into the Gateway-based plant transformation vector
of the number of amino acid substitutions per site. Conserved           pMDC100 using LR Gateway cloning. The recombinant plasmid
motifs were identified with the help of the MEME suit8 with             was transformed into Agrobacterium tumefaciens strain EHA105
parameters such as the number of motifs 10, width of the motifs         by electroporation and used for tobacco transformation as
set in-between 3 and 60, while parameters were set as default           reported previously (Divya et al., 2019); the selected rooted shoots
(Bailey et al., 2009). PAL2NAL software was used to calculate the       were transferred to pots containing autoclaved sand and soil
synonymous and non-synonymous sites, their substitution rates,          (1:1) mixture and maintained in a containment greenhouse until
and dN/dS for the PgAQPs orthologs and paralogs (Suyama et al.,         flowering and the seed set.
2006). Promoter regions of all the identified PgAQP genes were
searched by PlantCARE9 (Lescot et al., 2002). The 3D structure of       Growth of Tobacco Transgenic Plants
PgPIP2;6 protein was modeled using SWISS-MODEL10 , viewed               The untransformed wild type (WT) plants were used as negative
and labeled using the PyMol viewer, and ligands of the protein          control and a recombinant plasmid containing the PgPIP2;6
were searched using SWISS-MODEL software. Online software               expression cassette as positive control. Fully grown transgenic
                                                                        tobacco plants (T0 generation) were self-pollinated using paper
1
                                                                        bags to produce T1 seeds. Progeny plants (T1 ) selected with
  http://www.gigadb.org/dataset/100192
2
                                                                        kanamycin (50 mg L−1 ) on an agar medium were grown in
  http://gsds.cbi.pku.edu.cn
3                                                                       a growth chamber at 25◦ C at a photoperiod of a 16-h light
  http://www.genome.jp/tools/motif/
4
  http://web.expasy.org/protparam
                                                                        and 8-h dark cycle, followed by their advancement to T2
5
  http://www.genscript.com/wolf-psort.html
                                                                        generation for further analysis. The T2 generation plants and
6
  http://www.cbs.dtu.dk/services/TMHMM/                                 their untransformed wild types were maintained at 25–27◦ C
7
  http://www.cbs.dtu.dk/services/NetPhos/                               with a 16-h light and 8-h dark cycle with 300 µmol m−2 s−1
8
  http://meme-suite.org/tools/meme
9                                                                       11
  http://bioinformatics.psb.ugent.be/webtools/plantcare/html/                https://bioinfo3d.cs.tau.ac.il/PatchDock
10                                                                      12
   https://swissmodel.expasy.org                                             http://bioinfo3d.cs.tau.ac.il/FireDock

Frontiers in Plant Science | www.frontiersin.org                    3                                               March 2022 | Volume 13 | Article 820996
Reddy et al.                                                                                       PgPIP2;6 Gene Role in Abiotic Stress Tolerance

light and 70-80% relative humidity (RH) in a biosafe glasshouse        with Shimadzu scanner and analyzing with Winrhizo software
and used for physiological and molecular analysis. The genomic         (Winrhizo, Regent Ltd., Canada).
DNA of the putative T0 tobacco transgenic plants (20 days) was
isolated using the DNeasy Plant Mini Kit (Qiagen, Germany).            Imposition of Abiotic Stresses
Primer sets for CaMV35S_F (GATATCGTACCCCTACTCCAA)-                     Progressive Drought Stress
PgPIP2;6_R (AGAAGACGGTGTAGACGAGCA) and NptII_F -                       Progressive drought stress was imposed on 45-day-old tobacco
NptII_R were used to confirm the transgene integration.                plants according to Kholová et al. (2010a). From the nine well-
                                                                       watered (WW) replicate pots, six were used for physiological
                                                                       measurements and three for qRT-PCR analysis. The plants from
Measurement of Vapor Pressure                                          WW pots were maintained by daily re-watering up to an 80%
Deficient                                                              field capacity by bringing pot weight to 100 g below the field
The T2 generation transgenic tobacco plants and the WT plants          capacity weight. For water stress (WS) treatment, 12 pots were
were grown in 8-inch plastic pots filled with 5.5 kg of Alfisol        exposed to the soil moisture stress, from which nine were kept
where 16 replicate pots of each genotype were grown and the            for physiological measurements and three used for collecting
10 most uniform plants were selected to design the experiments         tissue samples for gene expression analysis. For WS, the plants
in controlled environment growth chambers. One day before              were partially compensated for transpiration, i.e., the plants were
the experiment, the pots were well watered, allowed to drain           allowed to lose no more than 50-g water each day, and any
to reach a field capacity, and bagged with a transparent plastic       transpiration loss of over 50 g was added back to the pots
bag wrapped around the plant stem to prevent the evaporation           as described earlier (Vadez and Sinclair, 2001) to allow for
of soil water during the evaluation of plant transpiration. In         progressive development of water-deficit over a 2-week period
controlled growth chambers, the transpiration rate response to         to measure parameters like normalized transpiration ratio (NTR)
stable and increasing VPD is carried out; for stable VPD, the          and fraction of transpirable soil water (FTSW) (Kholová et al.,
chamber was maintained at 1.2 kpa throughout the experiment,           2010a). When the NTR value of the test plants neared 0.1, which
whereas, for increasing VPD or treatment, the chamber VPD              was an indication of WS (pots reached 10% water content), leaves,
was raised from 0.6 to 3.80 kPa gradually (Supplementary               as well as root tissues, were collected and snap frozen in liquid
Table 5). Ten replications of wild-type and transgenic tobacco         nitrogen and stored at −80◦ C until RNA extraction.
plants were used in both stable and increasing VPD chambers
to measure the plant transpiration response throughout the             Heat Stress
day. An equal number of WT plants were also maintained in              The plants grown in a glasshouse for 45 days were exposed to heat
two chambers where one chamber was maintained at 1.2 kPa               stress at 40◦ C for 4 h and RH of 35%. Other set of plants was kept
throughout the experiment (a low-VPD chamber), while the               in control conditions in the growth chamber (28◦ C and 70% RH).
other had a ladder of VPD ranging from 0.69 to 3.8 kPa (a high-        Transpiration in both heat-stressed and control-chamber-grown
VPD chamber) with the VPD stress imposed as described earlier          plants was measured by weighing the pots before and after heat
(Reddy et al., 2017, 2021) (Supplementary Table 5). Within each        stress treatments. In addition, thermal images (infra-red) were
VPD level, the plants were weighed gravimetrically every 60 min        taken in both heat-stressed and control plants in the chamber
with 0.01-g precision scales (KERN 3600-2N, Kern & Sohn                using infrared (IR) FlexCam S (Infrared Solutions, Plymouth,
GmbH, Balingen, Germany) to derive transpiration values from           MN, United States) with a sensitivity of 0.09◦ C with an accuracy
consecutive weighing. Between successive VPD levels, a 15-min          of ± 2%. SmartView 2.1.0.10 software (Fluke Thermography
transition was allowed to gradually increase the VPD to the next       Everett, WA, United States) was used for the analysis of thermal
level. A data logger (Lascar Electronics Inc., United Kingdom)         images and estimation of canopy temperatures (Zaman-Allah
was positioned within the plant canopies in the growth chamber         et al., 2011a; Sivasakthi et al., 2017b). Leaf and root tissues from
for regular records of air temperature and relative humidity           the control and heat stressed plants were collected, snap frozen in
throughout the measurement period. At the end of the VPD               liquid nitrogen, and stored at −80◦ C for RNA extraction.
ladder (3.8 kPa at 03:00 pm), root and leaf samples were
collected from low- (1.2 kPa) and high-VPD chambers (3.8 kPa),         Cold Stress
frozen immediately in liquid nitrogen, and stored at −80◦ C            One set of 45-day-old plants was exposed to 4◦ C for 4 h in the
for RNA isolation. The plants were harvested at the end of             cold room, while the other set of plants was maintained in a
transpiration measurement. The leaf area was measured by               growth chamber (28◦ C and 70% RH) as controls. Transpiration
a leaf area meter (LI-3100C area meter, LI-COR Biosciences,
                                                   R
                                                                       in both cold-stressed and control plants was measured before
United States). At the end of the VPD experiment, shoots               and after stress treatment. Leaf and root tissues from the control
from low- and high-VPD chambers were cut using a razor                 and cold-stressed plants were collected, snap frozen in liquid
blade. The root exudate (xylem sap) was collected for 45 min           nitrogen, and preserved at −80◦ C for RNA extraction.
using pre-weighed Eppendorf cones stuffed with tissue paper
                                        R

(Kimtech Science, Ontario, United States). The root exudation          Quantitative Real-Time PCR Analysis
rate was calculated by normalizing the amount of sap exuded            Total RNA was isolated from pearl millet plants (VPD sensitive
by the root surface area and time. The root surface area (cm2 )        and insensitive genotypes treated with high VPD and progressive
and root volume (cm3 ) were calculated by scanning the roots           drought stress) and transgenic tobacco plants (control and

Frontiers in Plant Science | www.frontiersin.org                   4                                     March 2022 | Volume 13 | Article 820996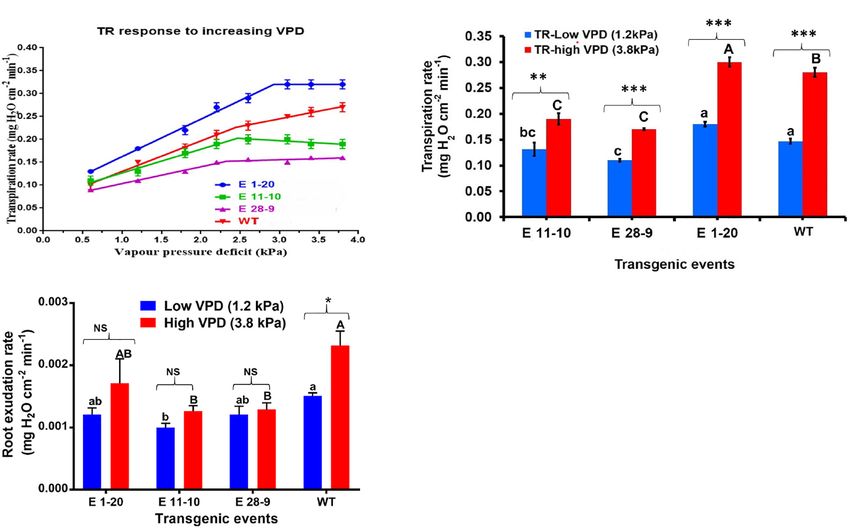
Reddy et al.                                                                                              PgPIP2;6 Gene Role in Abiotic Stress Tolerance

treated) using 100 mg of tissue with RNeasy Plant Mini kit               RESULTS
(Qiagen, Germany). The quantity and the quality of RNA were
analyzed using a NanoVue plus spectrophotometer (GE Health               Identification of Aquaporin Gene Family
Care, United States) and the ratio of the absorbance measured
                                                                         and Sequence Analysis
at 260 and 280 nm (260/280) of the samples ranging from 1.8
                                                                         A phylogeny of AQPs was carried out to understand the
to 2. The integrity of the RNA was further verified through
                                                                         evolutionary relationships among pearl millet AQPs within
denaturing 1.4% agarose gel and Bioanalyzer. The total RNA
                                                                         Pennisetum and with that of sorghum, maize, and rice (Figure 1A
isolated from control and treated samples was diluted to 30
                                                                         and Supplementary Figure 1). PgAQP’s were grouped into
ng/µl concentrations for the direct use in qRT-PCR reactions
                                                                         four major subfamilies based on their conserved and high
performed in the optical 96-well plates on a Realplex (Eppendorf,
                                                                         similarity index, including PgPIPs, PgTIPs, PgNIPs, and PgSIPs
Germany). Reactions were performed in a total volume of 10
                                                                         (Figure 1A). A total of 34 PgAQP genes were identified in
µl, containing 1 µl of RNA (30 ng), 400 nM of each primer,
                                                                         pearl millet and named based on their relationship with their
5 µl of 2 × one step SYBR RT-PCR buffer 4 (Takara, Japan),
                                                                         counterparts in the related species (Table 1 and Supplementary
and 0.5 µl of Prime Script One Step Enzyme Mix 2 (Takara,
                                                                         Figure 1). Among all classes, the PgPIP subfamily occupied the
Japan), and final volume made up to 10 µl with RNase-free
                                                                         highest number of AQP genes with 11 members. Exon/intron
H2 O. qRT-PCR reactions of all the samples were carried out by
                                                                         structure displayed a range of 1–19 (PgSIP2;1) introns, the
following a standard thermal profile: 42◦ C for 5 min and 95◦ C
                                                                         highest number present in the PgNIP subfamily and the lowest
for 10 s (reverse transcription), followed by 40 cycles of 15 s at
                                                                         in the PgTIP subfamily (Table 1 and Figure 1B). The identified
95◦ C, 15 s at 62◦ C with a fluorescent signal recording and 15 s
                                                                         AQPs were distributed on six chromosomes of pearl millet. Of
at 72◦ C. Amplicon dissociation curves were recorded after 40
                                                                         the 34, 3 were located on Chromosome 1,7 on 2,15 on 3,5 on
cycles by heating from 58 to 95◦ C with fluorescence measured
                                                                         4, 2 on 5, and 1 on 6. While Chromosome 3 was the hot spot
within 20 min. The experiments were independently repeated
                                                                         with a maximum number of AQP genes with most PIPs and
three times, and the data from these experiments were averaged.
                                                                         TIPs, Chromosome 7 did not show any AQP genes (Table 1).
The relative expression levels of PgAQP genes in response to
                                                                         PgAQPs ORFs ranged from 636 bp (PgPIP2;8) to 2,823 bp
high VPD and progressive drought stress in Tr contrasting
                                                                         (PgNIP4;1) with an average size of 528 bp. PgAQP proteins
genotypes were estimated using qBase software (Hellemans et al.,
                                                                         consisted of amino acids, ranging from 211 (PgPIP2;8) to 940
2007) by normalizing with corresponding control samples as
                                                                         (PgNIP4;1), majority of them being basic, where the pI values
well as with reference genes (Reddy et al., 2015b). Relative
                                                                         varied between 4.9 (PgNIP1;4) and 9.7 (PgPIP2;2). The MWs
expression levels of the PgPIP2;6 gene in response to different
                                                                         ranged from 21K Da to 99.79K Da with an instability index
tissues of transgenic tobacco and abiotic stress treatments were
                                                                         varying from 20.68 (PgTIP2;2) to 41.75 (PgNIP4;1), which was
estimated using the 2−11Ct method (Livak and Schmittgen,
                                                                         the only unstable one. The GRAVY values indicated that most
2001) by normalizing with L25 and EF-1 alpha reference genes
                                                                         of them were hydrophobic except PgSIP2;1, the only hydrophilic
(Schmidt and Delaney, 2010).
                                                                         AQP, and all exhibiting the highest aliphatic index (Table 1). Most
                                                                         of the PgAQPs showed the presence of serine, threonine, and
Statistical Analysis                                                     tyrosine, where serine was the most dominating phosphorylation
Transpiration response to increasing VPD (a high-VPD
                                                                         site (Supplementary Table 1). The highest number of serine
chamber) was analyzed with non-linear regression of Graph pad
                                                                         residues was observed in the PgNIP subfamily, followed by PIPs
Prism version 6 (Graph Pad software, Inc., CA, United States),
                                                                         and TIPs. Protein kinase C (PKC) and an unspecific kinase were
which provides r2 , a break point, and slope values. For the
                                                                         the major types present in all the proteins. The common kinases
progressive drought stress experiment, the relationship between
                                                                         in all subfamilies were next to PKC, cdc2, PKA, CDK1, DNAPK,
NTR and FTSW was analyzed with non-linear regression of
                                                                         P38MAPK, and PKG (Supplementary Table 1). Localization of
Graph pad Prism version 6 (Graph pad software, Inc., CA,
                                                                         PgAQPs indicated that, while they were abundant in the plasma
United States), which provides breakpoint values (Kholová et al.,
                                                                         membranes with an average of six transmembrane helices, only
2010b). Software SmartView 2.1.0.10 (Fluke Thermography)
                                                                         NIP3 subfamily members were found in the vacuole (Table 1).
was used for analysis of the thermal images and the estimation
                                                                         Motif organization of the four subfamilies of PgAQP was deduced
of canopy temperatures (Zaman-Allah et al., 2011a). CTD
                                                                         by submitting protein sequences to MEME13 . A total of 10
was calculated as the difference between the air temperature
                                                                         conserved motif sequences were identified in 34 PgAQP proteins,
(T) and leaf temperature (CTD = T air – T leaf). The relative
                                                                         showing group-specific distribution. Motifs 1 and 5 were the
expression of the PgPIP2;6 gene under different abiotic stresses
                                                                         most conserved across all PgAQPs subfamilies positioned at
was analyzed according to Livak and Schmittgen (2001). All
                                                                         C-terminus (Supplementary Figure 2). While motifs 6 and 7
the data from stress experiments (VPD, drought, heat, cold)
                                                                         were conserved in all the PgTIPs and PgNIPs, motifs 2 and 8
and relative expressions were analyzed with statistical program
                                                                         were noticed at the PgPIP subfamily’s N-terminus and Motif 9
package CoStat version 6.204 (Cohort Software, Monterey, CA,
                                                                         in TIP and NIP subfamilies. Motif 3 was common in all the
United States). One-way ANOVA was carried out to test for
                                                                         groups situated in the middle (Supplementary Figures 3, 4).
genotypic difference among the transgenic events and WT.
The means were compared using Tukey-Kramer test and least
significant difference (LSD) (at p ≤ 0.05).                              13
                                                                              https://meme-suite.org/meme/tools/meme

Frontiers in Plant Science | www.frontiersin.org                     5                                          March 2022 | Volume 13 | Article 820996
Reddy et al.                                                                                                                PgPIP2;6 Gene Role in Abiotic Stress Tolerance

  FIGURE 1 | Characterization of pearl millet AQP proteins. (A) The phylogenetic tree was constructed using MacVector software by the NJ method. (B) Exon and
  intron structure of pearl millet AQP genes is indicated by blue rectangles and thin dotted lines, respectively. The scale bar indicates nucleotide size length in the base
  pairs.

All PgAQP proteins had the inherent conserved NPA motif                                   of the PgAQP genes. GCN4 was another endosperm specific
(Motifs 1 and 3) and the aromatic/arginine (ar/R) selectivity filter                      element present only in the PgPIP genes (PgPIP2;1, PgPIP2;2,
(Supplementary Figures 2, 3).                                                             PgPIP1;1, and PgPIP1;2). CAT-box and CCGTCC-box related
   A total of 13 paralogs were identified where five were                                 to meristem expression were noticed in the promoter regions
from NIPs, four from PIPs, three from TIPs, and one from                                  of all the PgAQP genes. Along with tissue-specific cis-elements,
SIP. The paralog’s duplication events were grouped into                                   several abiotic stress-inducible cis-elements were detected in
regional and segmental gene duplications based on their                                   the promoter regions of the PgAQP genes. HSE cis-element
chromosomal localization and phylogenetic analysis. Of the                                involved in heat stress was observed in the promoter regions of 6
13 events, five were regional duplications; PgPIP1;1/PgPIP1;2,                            PgAQP genes (PgPIP1;1, PgPIP2;1, PgTIP1;1, PgTIP2;2, PgNIP1;3,
PIP2;3/PIP2;5, and PIP2;6/PIP2;8 were noticed on Chromosome                               and PgNIP3;4). The cold-responsive LTR element was noticed
3 and NIP3;2/NIP3;5, and NIP3;3/NIP3;4 on Chromosome                                      in 11 PgAQP genes (PgPIP1;1, PgPIP1;6, PgPIP2;4, PgPIP2;7,
4. The remaining eight were segmental duplication events                                  PgPIP2;8, PgTIP2;1, PgTIP2;2, PgTIP2;3, PgTIP4;1, PgNIP3;1, and
(Supplementary Table 1). Furthermore, among the non-                                      PgSIP1;1). While over 50% of the PgAQP genes had drought-
synonymous to synonymous substitutions, out of 13, 9                                      inducible MBS elements, the ABRE cis-acting element involved in
events exhibited purifying/stabilizing selection (1).                                regions of 15 PgAQP genes. The TCA cis-element involved in
The evolutionary relationship of the pearl millet with                                    salicylic acid responsiveness was noticed in the promoter regions
others showed a class-specific, group-specific relationship                               of the four PgAQP genes. CGTCA and TGACG-motifs involved
(Supplementary Table 1). Of the 12 orthologous events, six                                in the MeJA responsiveness were recognized in most of the
had an orthologous relationship with sorghum while three                                  upstream regions of PgAQP genes. Several core promoter regions
each with maize and rice. There were only three orthologous                               were observed in PgAQP promoters, including TATA-box,
duplication events (PgPIP2:7/SbPIP2:7; PgTIP5:1/SbTIP5:1, and                             CCAAT-motif, and TC-rich repeats (Supplementary Table 4).
PgNIP3:2/SbNIP3:2) that showed positive selection, while the
remaining nine events exhibited Darwinian selection pressure,
purifying/stabilizing selection during evolution. While sorghum
                                                                                          Expression of PgAQP Genes Under
and maize showed 16 orthologous events, sorghum and rice                                  Progressive Drought and High Vapor
exhibited four events, rice and maize exhibited one orthologous                           Pressure Deficit Stress in Pearl Millet
event (Supplementary Figure 1).                                                           Progressive Drought Stress
                                                                                          The expression profiling of PgAQPs was investigated among
Promoter Analysis                                                                         VPD-insensitive - ICMR 1122 and VPD-sensitive - ICMR 1152
To understand the regulatory mechanism of PgAQP genes of                                  genotypes in leaf and root tissues under progressive drought
pearl millet, cis-acting elements specific to tissue and abiotic                          and high-VPD stresses using qRT-PCR. To understand the
stress within the upstream regions of PgAQP genes were                                    function of AQP genes in drought stress adaptation/tolerance
identified (Supplementary Table 4). Up to seven Skn1 elements                             of pearl millet, progressive drought stress was imposed in pearl
specific to endosperm expression were detected in majority                                millet genotypes (ICMR 1122 and ICMR 1152), contrasting for

Frontiers in Plant Science | www.frontiersin.org                                      6                                            March 2022 | Volume 13 | Article 820996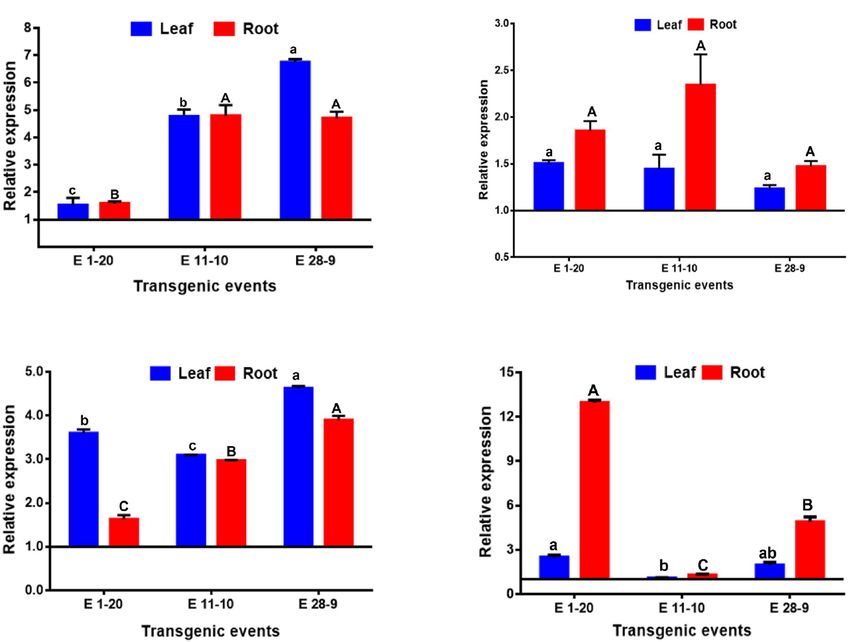
Frontiers in Plant Science | www.frontiersin.org
Reddy et al.
TABLE 1 | Physico-chemical characteristics of PgAQPs.
S. no Accession number Gene Subfamily ORF No. of Chromo- Chromosome Protein DBD MWt (kDa) pI GRAVY Aliphatic Instability TM Localiz-
(bp) Introns some localization (AA) index index helices ation
1 Pgl_GLEAN_10010809 PgPIP1;1 PIP1 867 3 3 5721622–5724718 288 46–215 30.76 8.82 0.349 94.24 34.84 6 Plas
2 Pgl_GLEAN_10001520 PgPIP1;2 PIP1 867 3 3 274573998–274575598 288 46–215 30.7 9.13 0.364 96.28 29.35 6 Plas
3 Pgl_GLEAN_10005724 PgPIP1;6 PIP1 909 1 2 104247932–104248932 302 54–287 31.31 7.72 0.425 95.03 28.06 6 Plas
4 Pgl_GLEAN_10028064 PgPIP2;1 PIP2 873 2 3 12453415–12456334 290 35–271 30.35 7.69 0.551 103.03 27.03 6 Plas
5 Pgl_GLEAN_10009812 PgPIP2;2 PIP2 699 1 2 64966663–64967453 232 24–208 24.59 9.66 0.445 102.59 25.79 5 Vacu
6 Pgl_GLEAN_10028876 PgPIP2;3 PIP2 867 2 3 45603209–45606038 288 33–270 30.11 6.95 0.523 103.12 28 6 Plas
7 Pgl_GLEAN_10028056 PgPIP2;4 PIP2 765 3 3 12167791–12168852 254 32–236 26.6 6.95 0.499 101.06 24.47 5 Plas
8 Pgl_GLEAN_10035675 PgPIP2;5 PIP2 873 2 3 257669631–257671533 290 34–271 30.38 6.58 0.502 103.72 27.26 6 Plas
9 Pgl_GLEAN_10028055 PgPIP2;6 PIP2 861 2 3 12156953–12158005 286 32–268 29.93 8.31 0.555 101.71 28.32 7 Plas
10 Pgl_GLEAN_10010255 PgPIP2;7 PIP2 861 3 Scaffold 240584–241753 286 36–264 29.79 9.16 0.668 107.76 28.95 6 Plas
763
11 Pgl_GLEAN_10028060 PgPIP2;8 PIP2 636 0 3 12322656–12323291 211 32–203 21.79 5.05 0.588 105.45 24.52 4 Plas
12 Pgl_GLEAN_10002147 PgTIP1;1 TIP1 750 1 5 153303973–153305471 249 17–232 25.72 6.27 0.812 107.75 25.92 6 Plas
13 Pgl_GLEAN_10009584 PgTIP2;1 TIP2 750 1 3 33622445–33623295 249 14–231 25.05 6 0.918 114.9 20.82 6 Plas
14 Pgl_GLEAN_10030617 PgTIP2;2 TIP2 747 2 3 100540239–100541171 248 15–231 25.02 5.66 0.924 108.95 20.68 6 Plas
15 Pgl_GLEAN_10000631 PgTIP2;3 TIP2 744 1 2 30657555–30658398 247 14–231 24.87 6.16 0.915 110.69 24.87 6 Plas
16 Pgl_GLEAN_10028702 PgTIP3;1 TIP3 675 2 2 44624536–44625481 224 20–196 23.15 6.39 0.49 98.17 34.15 5 Plas
7
17 Pgl_GLEAN_10002901 PgTIP4;1 TIP4 681 2 1 263875434–263878070 226 23–208 23.95 7.8 0.631 106.95 21.78 5 Plas
18 Pgl_GLEAN_10003218 PgTIP4;4 TIP4 750 1 3 148807632–148808412 248 16–231 25.1 6.74 0.825 114.92 22.65 6 Vacu
19 Pgl_GLEAN_10003219 PgTIP4;3 TIP4 744 1 3 148813464 –148814777 247 12–223 25.14 7.13 0.856 116.52 30.23 6 Plas-
Vacu
20 Pgl_GLEAN_10033583 PgTIP5;1 TIP5 813 2 3 272599938–272601028 270 14–243 26.68 8.91 0.808 101.04 29.29 6 Plas
21 Pgl_GLEAN_10012175 PgNIP1;1 NIP1 846 3 2 195368171–195370486 281 37–248 29.51 9.1 0.401 94.48 30.87 6 Plas
22 Pgl_GLEAN_10028618 PgNIP1;3 NIP1 822 4 1 261387113–261389753 273 44–247 28.76 8.35 0.562 100.81 29.52 6 Plas
23 Pgl_GLEAN_10028339 PgNIP1;4 NIP1 792 3 3 145385690–145386826 263 56–242 27.93 4.86 0.5 96.84 34.9 5 Plas
24 Pgl_GLEAN_10018521 PgNIP2;1 NIP2 891 4 3 14105646–14109009 296 46–253 31.81 6.74 0.39 97.53 37.58 6 Plas–ER
25 Pgl_GLEAN_10019286 PgNIP2;2 NIP2 894 4 2 103033018–103036838 297 53–258 31.56 7.69 0.452 93.27 37.87 6 Plas
PgPIP2;6 Gene Role in Abiotic Stress Tolerance
26 Pgl_GLEAN_10034621 PgNIP3;1 NIP3 909 2 2 40497062–40500916 302 70–281 31.42 9.1 0.433 96.32 34.68 5 Plas
27 Pgl_GLEAN_10030881 PgNIP3;2 NIP3 864 2 4 55573901–55575272 287 72–283 29.29 6.97 0.687 106.52 29.84 6 Vacu
March 2022 | Volume 13 | Article 820996
28 Pgl_GLEAN_10030882 PgNIP3;3 NIP3 942 3 4 55609410–55610656 313 74–286 32.83 8.5 0.684 118.79 27.27 6 Vacu
29 Pgl_GLEAN_10030883 PgNIP3;4 NIP3 933 4 4 55648949–55650374 310 81–282 32.99 8.41 0.497 106.68 31.56 5 Vacu
30 Pgl_GLEAN_10030872 PgNIP3;5 NIP3 837 1 4 55508562 –55509419 278 64–274 27.79 8.02 0.664 105.86 36.79 6 Vacu
31 Pgl_GLEAN_10012100 PgNIP4;1 NIP4 2823 10 6 110090448 –110091766 940 438–641 99.79 7.79 0.172 103.13 41.65 6 Plas
32 Pgl_GLEAN_10014008 PgSIP1;1 SIP1 717 2 4 93394125–93397493 238 53–234 24.45 8.43 0.702 107.18 27.71 6 Plas
33 Pgl_GLEAN_10003744 PgSIP1;2 SIP1 726 2 1 175152169–175154986 241 4–225 25.32 9.54 0.808 113.44 30.32 6 Plas
34 Pgl_GLEAN_10026167 PgSIP2;1 SIP2 2604 19 5 126489209 126491163 867 692–859 94.65 5.63 −0.049 84.07 36.44 5 ER
ORFs, number of amino acids (bp), proteins (amino acids), chromosomal location, isoelectric point (pI), molecular weight (MW), DNA binding domains (DBD), number of introns, localization, GRAVY, instability index,
aliphatic index, and transmembrane helices.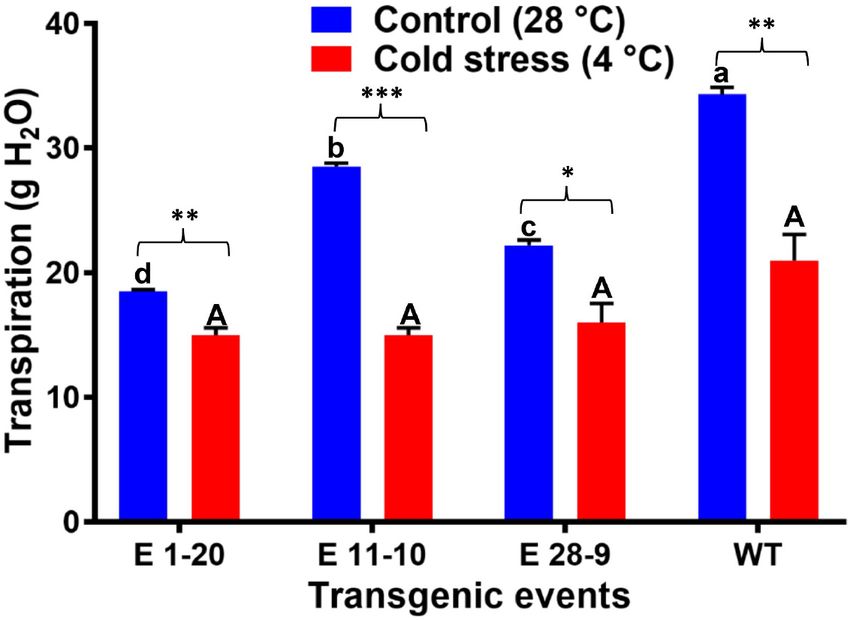
Reddy et al.                                                                                                        PgPIP2;6 Gene Role in Abiotic Stress Tolerance

  FIGURE 2 | An expression profile of the 34 PgAQP genes in leaves and roots of VPD-sensitive and VPD-insensitive genotypes under (A) drought stress and (B) high
  VPD. The color bar represents normalized log2 values.

transpiration rate response to increasing VPD. Many PgAQP                           and PgNIP3;3, were upregulated in the root tissues of ICMR
genes showed upregulation in both leaf and root tissues upon                        1152 where expressions were highest among all the 34 tested
drought imposition (Figure 2A). PgPIP2;6 of ICMR 1152 and                           PgAQPs. Interestingly, PgTIP3;1, PgTIP4;4, and PgNIP3;4
NIP1;3 and PgNIP1;3 of ICMR 1122 exhibited the highest level                        showed moderate or high expressions in roots and leaf tissues of
of expression in leaf as well as root tissues. Similarly, drought                   ICMR 112 in comparison with ICMR 1152 (Figure 2B). Apart
stress caused upregulation of six PgAQP genes like PgPIP2;5,                        from these, 10 genes, namely, PgPIP1;1, PgPIP1;2, PgPIP2;2,
PgPIP2;6, PgNIP3;2, PgNIP3;3, PgNIP3;5, PgNIP4;1, in both the                       PgPIP2;7, PgPIP2;8, PgTIP1;1, PgTIP2;1, PgTIP2;2, PgTIP4;1,
tissues of the genotype ICMR 1152. PgTIP2;3, PgPIP2;8, and the                      and PgNIP3;2, displayed higher expression levels in the leaf
PgTIPs, such as PgNIP1;1, PgNIP1;3, PgNIP3;1, PgNIP3;2, and                         tissues of ICMR 1152. Among them, PgPIP1;1; PgTIP1;1,
PgSIP1;1, were upregulated only in leaf tissues. Notably, PgPIP1;2,                 PgTIP2;1, PgTIP2;2 and PgNIP3;2 exhibited expressions in the
PgPIP2;5, PgPIP2;6, PgTIP2;3, PgTIP3;1, PgTIP4;1, PgTIP4;3,                         leaf tissues of ICMR 1122. Genes, such as PgNIP1;1, PgNIP1;3,
PgTIP4;4, PgNIP1;1, PgNIP1;4, PgNIP1;3, PgNIP2;2, PgNIP3;3,                         PgNIP1;4, PgNIP3;2, PgNIP3;3, PgNIP3;4, and PgNIP5;1
PgNIP3;4, PgNIP3;5, PgNIP4;1, PgSIP1;1, PgSIP1;2, and PgSIP2;1                      exhibited significant upregulation in root tissues of both ICMR
exhibited higher expressions in root tissues of the genotype                        1152 and ICMR 1122. PgTIP4;1, PgNIP1;3, and PgNIP3;3 in
ICMR 1122. In contrast, only one gene, PgNIP3;1, showed                             ICMR 1152 and PgTIP3;1, PgTIP4;4, PgNIP1;1, PgNIP1;3, and
high transcript levels in the leaf tissues of same genotype. All                    PgNIP4;1 in ICMR 1122 exhibited significant expressions in root
genes recorded higher expressions in the ICMR 1152 genotype                         tissues (Figure 2B). Other PgAQP genes revealed the lowest
compared to ICMR 1122. The least expression/downregulation                          expression in both the tissues of ICMR 1122 upon high-VPD
was noticed in almost all AQPs except a few in the leaf tissues                     stress treatment. In general, the PgAQP genes were highly
of the ICMR 1122 genotype. In summary, differential expression                      induced in root tissues than leaf tissues of both the genotypes in
patterns were observed in root tissues of ICMR 1122 and leaf and                    response to high-VPD stress.
root tissues of ICMR 1152 (Figure 2A).
                                                                                    Cloning and Transformation of Tobacco
High Vapor Pressure Deficit                                                         With PgPIP2;6
Under high-VPD conditions, PgAQP genes showed differential                          Based on the gene expression profile, the gene PgPIP2;6 was
expressions where the AQP genes, viz., PgPIP1;6, PgPIP2;6,                          cloned into the pMDC100 vector under the control of CaMV35S
PgTIP4;1, PgTIP5;1, PgNIP1;1, PgNIP1;3, PgNIP1;4, PgNIP3;2,                         promoter using the Gateway-cloning system. Plant expression

Frontiers in Plant Science | www.frontiersin.org                                8                                          March 2022 | Volume 13 | Article 820996
Reddy et al. PgPIP2;6 Gene Role in Abiotic Stress Tolerance
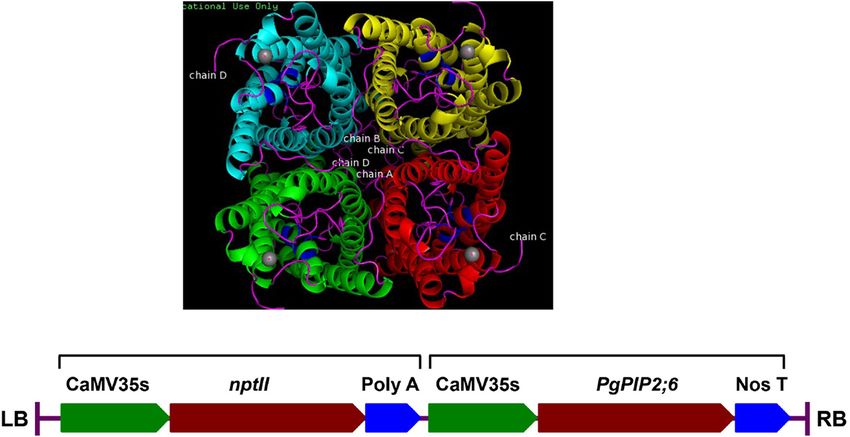
FIGURE 3 | Characterization of the pearl millet PgPIP2;6 gene. (A) The 3D model of PgPIP2;6 protein built by using homology based in silico modeling. Aquaporin
PgPIP2;6 is incorporated into the membranes in a tetrameric arrangement, comprising four individual pores. The protein structure has classical aquaporin structure
with conserved NPA motif regions, which are highlighted in blue. The ligand of the protein binds to the protein near the NPA motifs. Ligand (Cadmium ion) is
highlighted in gray spheres. (B) Schematic representation of the T-DNA region of the plant transformation vector (pMDC100), showing the two expression cassettes
for nptII and PgPIP2;6 genes. RB, right border; 35SP, CaMV35s promoter; PgPIP2;6, pearl millet plasma intrinsic protein 2;6 gene; nptII, neomycin
phosphotransferase gene; NosT, Nos terminator; LB, left border.
cassette harboring CaMV35sP-PgPIP2;6-NosT (Figure 3) was highly expressed under high evaporative demand. Mean Tr
transformed into tobacco and the putative transgenic plants comparison between transgenic and WT plants in low-VPD and
confirmed by PCR with CaMV35S trans_F - PgPIP2;6 trans_R high-VPD-chamber conditions displayed statistically significant
and nptII F- nptII R primers for integration of the transgenes. genotypic differences at p ≤ 0.05 (Figure 4B and Table 2). The
Out of the 41 T0 transgenic plants, nine events in T1 were PCR root exudation rate was slightly higher when exposed to high
positive that were analyzed through Mendelian segregation, and VPD than in the low-VPD-exposed plants. Under low- and high-
three T2 transgenic events (E 1–20, E 11–10, and E 28–9) were VPD (1.2 and 3.8 kPa) conditions, transgenic plants exhibited
selected for further analysis. slightly lower root exudation rates than WT plants (Figure 4C),
thereby implying lower Tr.
Physiological Performance of the Progressive Drought Stress
PgPIP2;6 Transgenic Tobacco Plants Imposition of progressive drought stress on transgenic and
Transpiration Response to Increasing and Stable WT tobacco plants revealed that WT plants utilized soil
Vapor Pressure Deficit Conditions moisture more quickly than the transgenics that also showed
Transpiration rate (Tr) was gradually increased under a ladder genotypic differences with declined transpiration between WT
or a high-VPD (0.6–3.8 kPa) chamber in both transgenic as and transgenic plants (Figure 5A). Segmental regression analysis
well as WT plants (Figure 4A). By contrast, Tr was stable revealed a slightly higher FTSW breakpoint value in WT
or parallel response in a low-VPD (1.2 kPa) chamber in both plants than the transgenic events (except the event E 28–9),
transgenic and WT plants (data not shown). Under high-VPD although the events E 1–20 and E 11–10 exhibited a slower
conditions, while Tr increased in all the tested genotypes, the decline in transpiration than the WT plants (Figure 5A).
slope of Tr decreased beyond the VPD breakpoint (2.4 kPa), Total transpiration was measured in WW as well as in WS
thereby indicating limited transpiration response in most of plants where a threefold total transpiration difference was
the genotypes (Figure 4A). WT plants displayed higher Tr recorded (Figure 5B). While under WW conditions, events
than the transgenic events (except in the transgenic event E 1– E 1–20 and E 28–9 were significantly different from WT
20). Transgenic events, such as E 11–10 and E 28–9, showed (Figure 5B and Table 2). Similarly, event E 28–9 was significantly
lower Tr at high VPD, indicating that they might have water- different from WT under WS conditions (Figure 5B and
conserving character. Water conservation mechanisms were Table 2).
Frontiers in Plant Science | www.frontiersin.org 9 March 2022 | Volume 13 | Article 820996Reddy et al. PgPIP2;6 Gene Role in Abiotic Stress Tolerance FIGURE 4 | Performance of the transgenic and non-transgenic WT plants under stable and increasing VPD conditions. (A) Tr response to increasing VPD conditions in PgPIP2;6 transgenic and WT tobacco plants. A plot of transpiration rates against VPD for three transgenic tobacco lines [E 1–20 (the blue-color line); E 11–10 (the green-color line); E 28–9 (the pink-color line)] and WT (the red-color line) plants. Compared to WT, transgenic events (except E 1–20) showed limited Tr under high-VPD conditions. Each data point represents means (± SE) six replicates. (B) Mean Tr of PgPIP2;6 transgenic and WT plants under low-VPD and high-VPD conditions. The bars with blue color represent low-VPD (1.2 kPa) Tr, and bars with red color represent high-VPD (3.8 kPa) Tr. Data represent means (± SE) six replicates, and means were analyzed by the Tukey–Kramer test. The “P” indicates the probability of a difference among the transgenic events and WT plants in low and high VPD. Bars with different capital letters and small letters indicate significantly different at P ≤ 0.05 in high-VPD and low-VPD conditions. The asterisks indicate the significant difference at P ≤ 0.05 between low- and high-VPD treatments. “Bars with asterisk ** and *** symbols are significantly different at P < 0.01, P < 0.001 between low VPD and high VPD stress treatment. (C) The root exudation rate of transgenic and WT tobacco plants subjected to low (1.2 kPa) and high-(3.8 kPa) VPD stress. The exudation rate was calculated by sampling the root sap. Data were analyzed by the Tukey-Kramer test. Values represent means ± SE (n = 6). Bars with different capital letters and small letters indicate significantly different at P ≤ 0.05 in high VPD and low VPD conditions. Bars with asterisk * symbol is significantly different at P < 0.05, between low and high VPD exudation. Bars with NS indicate that both low and high VPD root exudation are statistically non-significant. Temperature Stress E 11–10, and E 28–9 significantly lower transpiration than WT Transpiration was measured in both control and heat-stressed plants (Figure 7 and Table 2). plants where significant differences were noticed in their transpiration rates (Figure 6A), transgenics exhibiting lower transpiration than the WT plants (Figure 6A). Thermal Transgenic Tobacco Plants Have Higher image analysis revealed lower canopy temperature (CT) in Expression of the PgPIP2;6 Gene Under transgenics than WT plants under high-temperature (40◦ C) Abiotic Stresses stress (Figure 6B). Similarly, transgenics showed lower CT Expression levels of the PgPIP2;6 gene in leaf and root tissues, than the WT plants under optimum (28◦ C) and high- subjected to different abiotic stress treatments, were compared temperature (40◦ C) conditions (Figure 6C). Canopy temperature with their corresponding control samples using the 2−11Ct depression (CTD) analysis demonstrated higher CTD in method where a steady upregulation was recorded in response transgenics than WT plants under high-temperature stress to high VPD stress. Expression of PgPIP2;6 gene increased conditions (Figure 6D), which reverses the CT measurements. significantly in all the tested transgenic events (Figure 8A). Its A comparison of the mean CT, CTD, and transpiration data expression in leaves was higher than that in root tissues in all the among the transgenic and WT plants in both heat-stressed and three transgenic events except for E 1–20 in which the expression control plants (optimum temperature, 28◦ C) revealed statistically levels were comparatively less in both the tissues. Overall, significant (p ≤ 0.05) genotypic differences (Table 2). Under the transgenic event E 28–9 showed the highest expression cold stress (4◦ C), there was no significant difference between levels in both leaf and root tissues in comparison with other transgenic and WT plants. By contrast, transgenic events E 1–20, transgenic events (Figure 8A). These expression results were Frontiers in Plant Science | www.frontiersin.org 10 March 2022 | Volume 13 | Article 820996
Reddy et al.                                                                                                                   PgPIP2;6 Gene Role in Abiotic Stress Tolerance

TABLE 2 | Summary of different physiological traits that contribute to different abiotic stress tolerance in PgPIP2;6 transgenic and WT tobacco plants.

S.no           Trait name                                   E 1–20           E 11–10           E 28–9             WT             L.S.D.              P-            Stress
                                                                                                                                 (0.05)            value
                                                                                                                                                  significance

1              Transpiration rate – Low VPD (mg              0.18a            0.13bc           0.11c             0.15b            0.019              ***           VPD
               H2 O cm−2 min−1 )
2              Transpiration rate – High VPD (mg             0.32a            0.19c            0.16c             0.27b            0.024              ***
               H2 O cm−2 min−1 )
3              Root exudation rate – Low VPD                0.00121ab        0.001006b        0.00121ab        0.00151a          0.00028              *
               (mg H2 O cm−2 min−1 )
4              Root exudation rate – High VPD               0.001715ab       0.001268b        0.00129b         0.00232a          0.00073              *
               (mg H2 O cm−2 min−1 )
5              Leaf area VPD (cm−2 )                          501c             843b            1091a            1086a            83.709              **
6              Total chlorophyll content (µmol per          27.26b           28.03ab           30.33a           25.90b            2.060               *
               m2 of leaf)
7              Total Biomass (g)                             3.31c            7.07b            9.46a           6.0415b            1.189              **
8              Total transpiration-Well watered (g)         1177.11b         1238ab           1217.88b         1370.44a          103.72              **            Progressive
                                                                                                                                                                   drought
                                                                                                                                                                   stress
9              Total transpiration-Well stress (g)          309.41ab         309.5ab          297.58b          325.16a            13.68              **
10             Total biomass-Well watered (g)               8.8216c          13.6266ab        15.7433a         11.7933a           2.147              **
11             Total biomass-Water stress (g)                5.39c           9.8244ab         11.333a          8.4133b            1.822              **
12             Relative water content (%)-Well              95.63bc           94.30c           96.39b           98.96a            1.479              ***
               watered
13             Relative water content (%)-Water             89.40b            93.39a          91.90ab           93.24a            2.045              **
               stress
14             Transpiration- Control at 28◦ C (g           18.46d            28.46b           22.2c            34.26a            2.77               ***           Heat
               H2 O in 3 h)
15             Transpiration-Heat stress at 40◦ C             46b            56.33ab          62.33ab             74a            19.101              ns
               (g H2 O in 3 h)
16             Canopy temperature-Control at                29.402b          29.163b          28.500c          31.157a            0.307              ***
               28◦ C
17             Canopy temperature-Heat stress at            35.218c          36.230b          36.560b          38.090a            0.482              ***
               40◦ C
18             Canopy temperature depression                   -                 -            -0.500a          -3.156c            0.309              ***
               (CTD)-Control at 28◦ C                       1.403b            1.163b
19             Canopy temperature depression                 4.781a           3.769b           3.439b           1.909c            0.483              ***
               (CTD)-Heat stress at 40◦ C
20             Transpiration- Control at 28◦ C (g           18.46d            28.46b           22.2c            34.26a            1.28               ***           Cold
               H2 O in 3 h)
21             Transpiration-Cold stress at 4◦ C (g           15a              15a              16a               21a             4.416              *
               H2 O in 3 h)

Means with different letters of alphabets are significantly different (P < 0.05) and the same letters represent the absence of significant difference. The asterisk *, **, and ***
symbols are significantly different at P < 0.05, P < 0.01, P < 0.001, and ns: non-significant, respectively.

closely related to Tr data where the event E 1–20 displayed                                 transgenic events. Higher expression levels were observed in the
higher Tr than the other event under high-VPD conditions                                    leaf compared to root tissues in all transgenics (Figure 8C).
(Figures 4A, 8A). The relative expression of PgPIP2;6 was                                   Among all the tested transgenic events, E 28–9 showed higher
investigated under drought vis-a-vis WW conditions for each                                 expression in leaf as well as root tissues. These expression
transgenic event. Under WS conditions, significant variation                                results agree with the physiological data (Figure 6) where the
in the abundance of the PgPIP2;6 transcript was observed                                    events with lower PgPIP2;6 gene expression showed a higher
among diverse transgenic events (Figure 8B). PgPIP2;6 transgene                             transpiration rate under high-temperature conditions. Under
expression was upregulated under WS in root as well as in                                   cold stress, root tissues exhibited comparatively higher gene
the leaf tissues. Overall, the transgenic event E 11–10 showed                              expression than the leaf where the transgenic event E 1–20
significantly higher transcript abundance in root tissues than                              showed the highest expression in root tissues than the other two
other transgenic events (Figure 8B). A correlation was noticed                              events (Figure 8D). PgPIP2;6 expression levels were upregulated
between physiological characteristics, the level of expression                              in all the transgenic events under cold stress conditions that
of PgPIP2;6, and drought tolerance. Under heat stress, the                                  are similar to the Tr data obtained from the physiological
PgPIP2;6 transgene showed significant upregulation in all the                               experiments (Figure 7).

Frontiers in Plant Science | www.frontiersin.org                                       11                                             March 2022 | Volume 13 | Article 820996
Reddy et al. PgPIP2;6 Gene Role in Abiotic Stress Tolerance
FIGURE 5 | Progressive drought stress. (A) Relationship between the normalized transpiration rate (NTR) and fraction of transpirable soil water (FTSW) of transgenic
[E 1–20 (blue color line); E 11–10 (pink color line); E 28–9 (green color line)] and WT (red color line) during progressive drought stress treatment. The FTSW thresholds
where the transpiration initiated its decline were calculated with segmental regression procedure from Graphpad prism. Then, the regression lines of the relationships
between the NTR and FTSW were drawn by fitting NTR to FTSW data above and below the respective thresholds for transpiration decline in each genotype. The
dotted lines represent the NTR of well-watered control plants. Each point is the mean of NTR (n = 9), and the error bars are the SE of the mean. (B) Total
transpiration content in PgPIP2;6 transgenic tobacco lines under well-watered (WW) and water stress (WS) treatment. Bars with different capital letters and small
letters indicate significantly different at P ≤ 0.05 in both low and high VPD conditions. Bars with asterisk *** symbol are significantly different at P < 0.001 between
WW and WS treatment.
DISCUSSION monocots like rice, S. bicolor, and Z. mays. Pearl millet AQP
proteins contained similar structural motifs like MIP domains,
Maintaining water budget levels under different abiotic stress NPA, LE1, LE2, H1, H2, and P1-P5, thereby indicating similar
conditions is crucial for the plants to survive and to employ functional roles in pearl millet also. The presence of cis-
several adaptive mechanisms to cope with the environmental elements in the promoter regions infer that they might play
stresses (Mahdieh et al., 2008). AQP genes play critical roles a vital role in developmental and abiotic stress regulations.
in water transport, homeostasis, growth, and development of PgAQP genes displayed different expression patterns in different
plants, including other organisms (Luu and Maurel, 2005; tissues (leaf and root) of the VPD-sensitive and insensitive
Galmés et al., 2007; Li et al., 2015; Afzal et al., 2016; genotypes, indicating their tissue specific roles during abiotic
Ranganathan et al., 2017). Functional characterization of AQPs stress tolerance. Based on the expression data of all PgAQPs
in different crop species showed improved tolerance against under high VPD and drought stress to VPD-sensitive and
abiotic stress conditions (Ayadi et al., 2011; Zhou et al., insensitive genotypes, the PgPIP2;6 gene of the PIP family
2012; Liu et al., 2013; Ranganathan et al., 2016; Xu et al., could be a probable candidate gene that plays a pivotal role
2020, 2021; Sun et al., 2021). An adaptive mechanism of during abiotic stress tolerance, particularly drought. This result
pearl millet to most of the abiotic stresses also involves this has been well aligned with our earlier study in pearl millet
important class of proteins through the regulation of AQP (Reddy et al., 2017). PgPIP1;3, PgPIP1;4, and PgPIP2;3 showed
genes. The AQP gene family has been characterized in diverse higher transcript abundance in high TR genotype than low
taxa, such as Oryza sativa, Zea mays, Triticum aestevium, TR genotype under high VPD conditions (Reddy et al., 2017;
Hordeum vulgare, Sorghum bicolor, Panicum virgatum, and Grondin et al., 2020).
Brachypodium distachyon (Johanson et al., 2001; Forrest and The PIP proteins belong to the AQP family, which are known
Bhave, 2008; Nguyen et al., 2013; Hove et al., 2015; Azad to play critical roles during water transport in plasma membranes
et al., 2016). However, systematic characterization and functional of many plant species (Martre et al., 2002; Tyerman et al.,
validation of the AQP genes have not been demonstrated in 2002; Song et al., 2016; Zargar et al., 2017) toward abiotic stress
Pennisetum glaucum. The present study carried out expression adaptation. In our pursuit to identify a functional role of the
profiles of AQP genes in leaf and root tissues of contrasting pearl millet PgPIP2;6 AQP gene in transgenic tobacco plants,
genotypes under high VPD and progressive drought stresses sequence analysis of the protein with AQPs isolated from other
with the primary objective of elucidating the essential roles monocot and dicot species revealed that PgPIP2;6 protein shares
being played by AQPs. In all, 34 AQP genes were identified high sequence homology with ZmPIP2;6 and SbPIP from maize
in the P. glaucum genome that are closer to those from other and sorghum where the predicted structure resembles that of a
Frontiers in Plant Science | www.frontiersin.org 12 March 2022 | Volume 13 | Article 820996You can also read