Below Average Midsummer to Early Autumn Precipitation Evolved Into the Main Driver of Sudden Scots Pine Vitality Decline in the Swiss Rhône Valley
←
→
Page content transcription
If your browser does not render page correctly, please read the page content below
ORIGINAL RESEARCH
                                                                                                                                                  published: 13 June 2022
                                                                                                                                           doi: 10.3389/ffgc.2022.874100

                                             Below Average Midsummer to Early
                                             Autumn Precipitation Evolved Into
                                             the Main Driver of Sudden Scots Pine
                                             Vitality Decline in the Swiss Rhône
                                             Valley
                                             Stefan Hunziker 1* , Michael Begert 2 , Simon C. Scherrer 2 , Andreas Rigling 1,3 and
                                             Arthur Gessler 1,3
                                             1
                                              Research Unit Forest Dynamics, Swiss Federal Institute for Forest, Snow and Landscape Research WSL, Birmensdorf,
                                             Switzerland, 2 Climate Division, Federal Office of Meteorology and Climatology MeteoSwiss, Zurich, Switzerland, 3 Institute
                                             of Terrestrial Ecosystems, ETH Zurich, Zurich, Switzerland

                                             The vitality of Scots pine (Pinus sylvestris L.) is declining since the 1990s in many
                            Edited by:
                                             European regions. This was mostly attributed to the occurrence of hotter droughts, other
                        Rüdiger Grote,
     Karlsruhe Institute of Technology       climatic changes and secondary biotic stressors. However, it is still not well understood
                        (KIT), Germany       which specific atmospheric trends and extremes caused the observed spatio-temporal
                           Reviewed by:      dieback patterns. In the Swiss Rhône valley, we identified negative precipitation
                 Jesús Julio Camarero,
  Spanish National Research Council          anomalies between midsummer and early autumn as the main driver of sudden vitality
                            (CSIC), Spain    decline and dieback events. Whereas climate change from 1981 to 2018 did not lead
                       Maxime Cailleret,
                                             to a reduced water input within this time of the year, the potential evapotranspiration
  Institut National de Recherche pour
          l’Agriculture, l’Alimentation et   strongly increased in spring and summer. This prolonged and intensified the period
     l’Environnement (INRAE), France         of low soil moisture between midsummer and autumn, making Scots pines critically
                  *Correspondence:           dependent on substantial precipitation events which temporarily reduce the increased
                       Stefan Hunziker
               stefan.hunziker@wsl.ch        water stress. Thus, local climate characteristics (namely midsummer to early autumn
                                             precipitation minima) are decisive for the spatial occurrence of vitality decline events,
                   Specialty section:        as the lowest minima outline the most affected regions within the Swiss Rhône valley.
         This article was submitted to
        Forests and the Atmosphere,          Mortality events will most likely spread to larger areas and accelerate the decline of
               a section of the journal      Scots pines at lower elevations, whereas higher altitudes may remain suitable Scots
       Frontiers in Forests and Global
                              Change
                                             pine habitats. The results from our regional study are relevant on larger geographic
        Received: 11 February 2022
                                             scales because the same processes seem to play a key role in other European regions
           Accepted: 28 April 2022           increasingly affected by Scots pine dieback events.
          Published: 13 June 2022
                                             Keywords: Pinus sylvestris L., forest dieback, tree mortality, crown defoliation, climate change, heat drought,
                                Citation:    reference evapotranspiration, soil drought
                   Hunziker S, Begert M,
Scherrer SC, Rigling A and Gessler A
    (2022) Below Average Midsummer
to Early Autumn Precipitation Evolved
                                             INTRODUCTION
 Into the Main Driver of Sudden Scots
       Pine Vitality Decline in the Swiss
                                             Climate change affects ecosystems all over the world. The frequency and intensity of droughts
                           Rhône Valley.     (especially hotter droughts with higher vapor pressure deficits) and pest outbreaks increased in
   Front. For. Glob. Change 5:874100.        many regions, which affected tree vitality and often resulted in widespread tree mortality (Allen
       doi: 10.3389/ffgc.2022.874100         et al., 2010, 2015; Park Williams et al., 2013; Hartmann et al., 2018; Schuldt et al., 2020). Therefore,

Frontiers in Forests and Global Change | www.frontiersin.org                        1                                               June 2022 | Volume 5 | Article 874100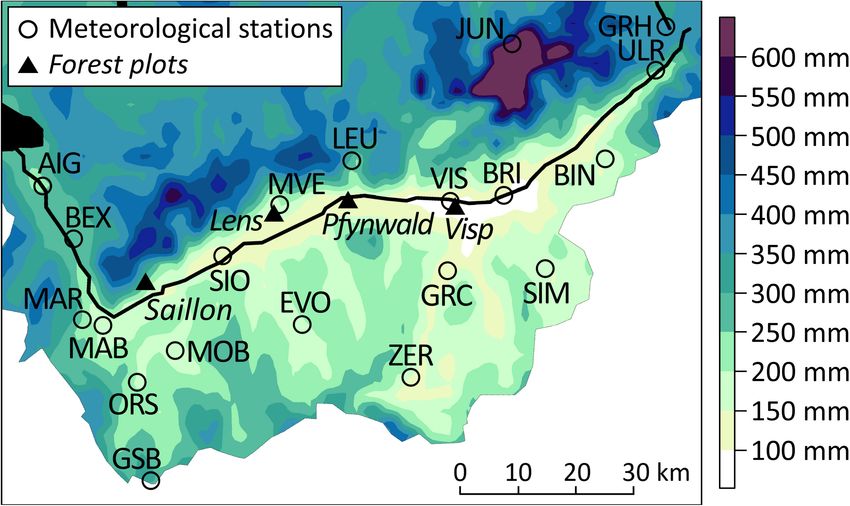
Hunziker et al.                                                                                             Precipitation Anomalies Drive Tree Vitality

forest dieback has become one of the predominant climate change             forest dieback. The Swiss Rhône valley is an ideal test
impact on plants and ecosystems (Breshears et al., 2018).                   field to address these research questions because Scots pines
    Within these global changes, the vitality of Scots pines (Pinus         were monitored on several forest plots since the 1990s and
sylvestris L.) declined in various regions across Europe (Vilà-             a dense meteorological station network provides long-term
Cabrera et al., 2013; Bose et al., 2020; Senf et al., 2020). In             and high-quality climate data. As tree vitality cannot be
dry inner-Alpine valleys, a large number of trees have been                 measured directly (Dobbertin, 2005), we used observations of
subject to mortality events in the last decades (e.g., Cech and             the tree crown defoliation as vitality indicator (Innes, 1998;
Perny, 2000; Pfister et al., 2001; Gonthier et al., 2010; Vacchiano         Eickenscheidt and Wellbrock, 2014) and the often strongly
et al., 2012) and several such events occurred in the Swiss                 related (particularly for co-dominant and dominant trees)
Rhône valley (e.g., Rebetez and Dobbertin, 2004; Bigler et al.,             mortality as the ultimate indicator of non-vitality (Dobbertin
2006; Rigling et al., 2018). Specific events were, however, limited         and Brang, 2001; Rigling et al., 2018). We analyzed and
to certain areas at lower altitude (Dobbertin, 2005; Rigling                combined data of vitality observations with further parameters
et al., 2006, 2013; Etzold et al., 2019). The Scots pine decline            of forest observations, climatic changes and anomalies since 1981
started in the 1990s, and most of the aforementioned studies                including further data sources such as soil water measurements
identified increased drought stress as the main responsible                 and remote sensing in order to disentangle the effects of
factor. This coincides with the exceptionally high magnitude                climate parameters and other impact factors. In a further
of climatic changes on the global scale since the 1980s (IPCC,              step, we tested the main finding on cases of dieback events
2014; Reid et al., 2016). However, the relative importance                  in other European regions and we drew conclusions on
of changing climate parameters such as atmospheric water                    the likely future development of the Scots pine population
demand vs. precipitation on forest decline patterns is still                within the study area.
poorly understood and hampers the ability to anticipate
future climate change impacts (Park Williams et al., 2013;
Grossiord et al., 2020). For instance, Rigling et al. (2018)                MATERIALS AND METHODS
demonstrated a connection between multi-annual periods of
a strongly negative climatic water balance and Scots pine                   Study Area
vitality drops and dieback. This correlation, however, is not               The Swiss Rhône valley is a dry inner-Alpine valley located
very consistent, does not apply to several single years, and the            in south-western Switzerland (Figure 1). Long-term annual
magnitudes of negative climatic water balance anomalies do not              mean precipitation (1981–2018) is lowest in the central
match the magnitudes of tree vitality decline. Similar results              part of the valley with a minimum of 594 mm in Sion
were found for the correlation between the April to August                  (abbreviated SIO). The regional annual mean temperature
climatic water balance and subsequent annual mortality rates                maximum (1981–2018) is reached at the same site with
(Rigling et al., 2013).                                                     10.8◦ C.
    Besides drought stress, various further factors may affect Scots           Scots pine is a common tree species in the Rhône valley
pine vitality and mortality. Infestations by insects, pathogens,            which is dominant on the monitored forest plots near Visp (0.5
nematodes, and the hemi-parasite mistletoe (Viscum album)                   ha, 695 meters above sea level (m a.s.l.), 46◦ 18’N, 7◦ 52’E), in
may increase tree mortality (e.g., Dobbertin and Rigling, 2006;             Pfynwald (0.4 ha, 615 m a.s.l., 46◦ 18’N, 7◦ 37’E), near Saillon
Rigling et al., 2006; Dobbertin et al., 2007; Wermelinger et al.,           (0.05 ha, 1,192 m a.s.l., 46◦ 10’N, 7◦ 09’E), and near Lens
2008; Pastirčáková et al., 2018; Taccoen et al., 2019) especially          (0.5 ha, 1,063 m a.s.l., 46◦ 16’N, 7◦ 26’E). All the forest plots
when trees have been predisposed by drought stress. Plant                   were unmanaged. During the analyzed time periods (Visp and
competition (Weber et al., 2007; Archambeau et al., 2020) and               Saillon: 1996–2018, Pfynwald: 2003–2018, Lens: 2005–2018),
non-drought related climatic extreme events such as spring                  the average stand densities of living trees per ha (all trees
frost or extreme heat (Teskey et al., 2015; Vitasse and Rebetez,            with diameters at breast height ≥ 12 cm were monitored)
2018; Vitasse et al., 2018) may act as additional factors reducing          were 171 (Visp), 680 (Pfynwald), 739 (Saillon), and 992 (Lens).
the vitality of Scots pines. Finally, the long-term cumulative              The corresponding basal areas were 5 m2 /ha (Visp), 24 m2 /ha
impact of all site specific predisposing, initiating and contributing       (Pfynwald), 42 m2 /ha (Saillon) and 35 m2 /ha (Lens). Besides
factors (Manion, 1991) was found to be decisive for Scots pine              Scots pine, further tree species found on the forest plot near
mortality (e.g., Rigling and Cherubini, 1999; Bigler et al., 2006;          Visp were whitebeam (Sorbus aria, 27% of the living trees) and
Camarero et al., 2015). Due to this complexity, it is difficult to          pubescent oak (Quercus pubescens, 10% of the living trees). On
disentangle the respective effects of particular climatic change            the forest plot near Saillon, 20% of the trees were spruce (Picea
factors and other potential stressors (Dale et al., 2001; Taccoen           abies) and 27% beech (Fagus sylvatica). On the forest plots in
et al., 2019).                                                              Pfynwald and near Lens, other tree species were limited to a few
    The present study aims to (1) identify the main climatic                single individuals.
drivers of sudden Scots pine vitality decline and dieback                      The mean diameters at breast height of the Scots pines
on an annual time scale, (2) analyze temporal changes of                    analyzed within this study were 20 cm (Visp and Pfynwald),
climatic parameters responsible for the increased occurrence                39 cm (Saillon) and 25 cm (Lens). The vast majority of these
of vitality decline and dieback events since the 1990s, and                 Scots pines were co-dominant or dominant trees (i.e., they
(3) explain the pronounced spatial differences of the observed              reached or rose above the average canopy top). The average

Frontiers in Forests and Global Change | www.frontiersin.org            2                                     June 2022 | Volume 5 | Article 874100
Hunziker et al. Precipitation Anomalies Drive Tree Vitality
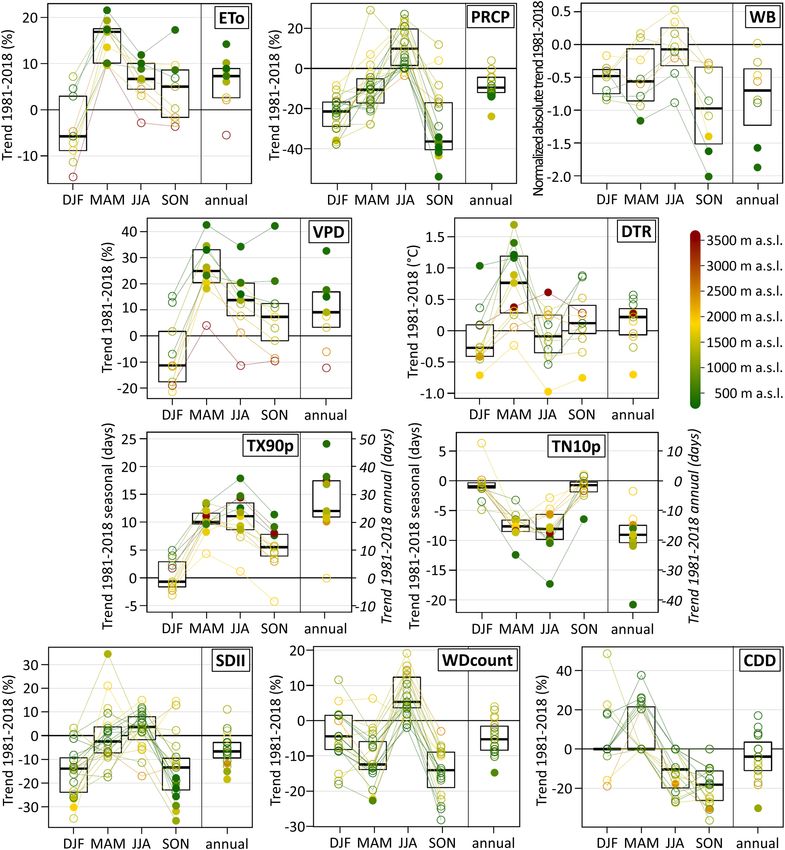
FIGURE 1 | Location of the long-term forest monitoring plots and the meteorological stations (including the station name abbreviations in capital letters) in the Rhône
valley in south-western Switzerland. For the meteorological stations, the shape of the symbol indicates the analyzed parameters at each site. Colors indicate the
altitude of forest plots and meteorological stations. ETo means reference evapotranspiration, and PRCP abbreviates precipitation (for a complete station list including
the full station names, see Supplementary Table 1).
defoliation of living Scots pines on the forest plots was 24% this error margin. Within ICP Forests, the total amount of
(Visp), 35% (Pfynwald), 27% (Saillon) and 25% (Lens). A medium defoliation is estimated, but LWF field experts additionally record
or strong mistletoe infestation (i.e., low infestation at several the amount of defoliation of unknown reasons, which is the
parts of the tree crown, strong infestation at single parts of remaining defoliation after subtracting the amount of defoliation
the crown, or strong infestation at several crown parts) was caused by obvious reasons. This allows the identification and
observed on 11% (Visp), 46% (Pfynwald) and 13% (Lens) of damage quantification of certain disturbances such as insect
the Scots pines. infestations. Other impacts such as previous frost events may not
Soils in the Rhône valley are predominantly weakly developed be recognized, however, if the damages are unspecific at the time
and shallow with a low water-retention capacity. The soils on of the assessment.
the forest plots were classified as Pararendzinas near Visp and in Even though the forest plots analyzed in the present study
Pfynwald and as Cambisols near Saillon and Lens (Etzold et al., were initiated with different aims [the plots near Visp and Lens
2018, personal communication with Stephan Zimmermann). are ICP Forests Level II plots, the plot near Saillon is a Level
I plot, and the plot in Pfynwald is an experimental plot (see
Forest Observations Joseph et al., 2020) of which only the unmanipulated control-
Visual estimation of tree crown defoliation (i.e., the proportion subplots were considered], the observations were taken by the
of needles or leaves that should be present on a tree but same field experts complying the same protocol. However, the
which have been lost) is a key indicator and the most different plot types affected the average Scots pine sample sizes
commonly used index for tree health (Innes, 1998; Eickenscheidt on the plots, which are 47 near Visp, 270 in Pfynwald, 18 near
and Wellbrock, 2014). It is evaluated regardless the cause of Saillon and 8 near Lens. Only time series with annual resolution
foliage loss, so it includes, for example, damage by insects were considered, which strongly reduced the tree number in Lens
(Eichhorn and Roskams, 2013). Besides defoliation, crown because inventories were mostly iterating between two subplots.
condition assessments include various further parameters and Newly ingrown trees with a diameter at breast height ≥ 12 cm
are done annually within the Swiss Long-term Forest Ecosystem were included every few years in the sample of the forest plots.
monitoring network (LWF, see Innes, 1995; Dobbertin, 2005; Volumetric soil water content was monitored continuously at
Schönbeck et al., 2018) and follow the protocols of the ICP the site near Visp since 2009 in 15, 50, and 80 cm soil depth
Forests program.1 Tree crown defoliation is quantified in using soil moisture sensors (ECH2O EC-5; Decagon Devices).
5% steps from 0% (i.e., completely healthy) to 100% (i.e., Large fractions of missing values between 2009 and 2012 limited
dead). Previous studies identified about three quarters of the period of analyzable soil water measurements to 2013–
individual tree crown defoliation assessments to be within ± 5% 2018.
from the observer mean or control team (Eickenscheidt and To corroborate potential frost damage on the forest plot near
Wellbrock, 2014; Ferretti et al., 2014). Internal (LWF) and Visp, multispectral satellite data of Planet Labs PBC2 with a
international (ICP Forests) training and calibration courses 3.7 m image resolution were analyzed. Color infrared (CIR)
indicate that observations by the LWF field experts assessing imagery is suitable to detect the amount of chlorophyll in the
crown defoliation in the Swiss Rhône valley were well within plant tissue and hence estimate the health condition of Scots
1 2
http://icp-forests.net/page/icp-forests-manual https://www.planet.com
Frontiers in Forests and Global Change | www.frontiersin.org 3 June 2022 | Volume 5 | Article 874100
Hunziker et al.                                                                                            Precipitation Anomalies Drive Tree Vitality

pine foliage and other vegetation (Fassnacht et al., 2012; Masaitis           • Defoliation time series that stopped because of
et al., 2013) before and after a potentially damaging event.                    other reasons than mortality as defined above
CIR images were created by changing the band combination                        were not considered.
as follows: red = Near Infrared band, green = red band and
blue = green band.                                                            • Trees with more than one missing defoliation observation
                                                                                in the last 2 years of the analyzed time period
Defoliation Change and Mortality                                                were not considered.
Forest observations were quality controlled by detecting and
removing erroneous data and internal inconsistencies. For                  Climate Observations
assessing the temporal development of tree vitality, we calculated         Time series of the atmospheric variables from the Swiss Rhône
time series of annual defoliation changes. Namely, we calculated           valley were generated by the Federal Office of Meteorology
the defoliation change (DChange ) on the forest plots for each             and Climatology (MeteoSwiss). In order to get comprehensive
time step j by averaging the annual defoliation changes of the             and reliable information on climatic changes and extremes
individual trees:                                                          in the study area, 20 meteorological stations (Figure 1) with
                                     n                                     a data completeness ≥ 84% between 1981 and 2018 were
                                   1 X
                                                                           analyzed. The period 1981–2018 was chosen for trend analyses

                  DChange(j) =         Di(j) − Di(j−1)
                                   n                                       in order to cover the shift of the climate regime in the
                                      i=1
                                                                           1980s (Reid et al., 2016) and hence potentially important
where n is the number of Scots pines on the plot, Di(j) the                changes just before the occurrence of Scots pine mortality
defoliation of tree i in year j, and Di(j−1) the defoliation of tree       events in the 1990s.
i in the previous year.                                                       Station elevations range from 381 to 3,580 m a.s.l.
    Defoliation change time series are much more robust against            The station at 3,580 m a.s.l. is located clearly above the
temporal inconsistencies of the sample than time series of the             tree line (up to ca. 2,500 m a.s.l.), but it contributes
simple mean defoliation. For example, mean defoliation time                to the assessment of the elevation dependence of the
series often indicate a recovery of tree crowns after a mortality          climatic trend signals relevant for the target mortality
event. This may be a false conclusion and just caused by the               areas at lower altitudes. A detailed list of the stations,
exclusion of dead trees (i.e., 100% defoliated trees). Furthermore,        data availability and completeness is provided in
trees with a higher defoliation are more likely to die during a            Supplementary Table 1.
stress phase, which may result in a shift toward less defoliation in          We used data on a monthly time scale of the atmospheric
the sample composition. Hence, the mean defoliation may poorly             variables maximum temperature, minimum temperature, vapor
represent actual mean crown defoliation trajectories.                      pressure, sunshine duration, wind speed, and precipitation
    In the present study, we were interested in mortality related to       (PRCP). Note that for most analyses, we transformed vapor
and impacts impairing tree health. Certain events, such as severe          pressure to relative humidity (Allen et al., 1998) in order to
storms, rockfalls, or forest management interventions, may result          remove temperature dependence from the humidity measure.
in the removal of trees irrespective of their vitality. Such cases         For the calculation of climate change indices, daily maximum
may therefore, disturb the correlation between tree vitality,              and minimum temperature and PRCP data were used. All time
mortality and stress impacts. Furthermore, it is important to              series were quality controlled and homogenized by MeteoSwiss
keep the relationship between defoliation and mortality coherent.          (Begert et al., 2005). Rarely occurring missing values in the
Therefore, we applied restrictions to defoliation time series and          monthly time series were interpolated from neighboring stations
defined tree mortality as follows:                                         using linear regression models (Frei and Schär, 1998; Frei,
    • Mortality of a tree was stated when the defoliation reached          2014) and, in case of missing daily PRCP data, from a
      100% (observation must be corroborated in the subsequent             computer mapping algorithm (Frei et al., 2006). Since the
      crown assessment).                                                   present study focuses on trends, particular emphasis was placed
                                                                           upon selecting atmospheric variables that were least exposed
    • Mortality was furthermore attributed to trees that were              to temporal inhomogeneities. For instance, we used sunshine
      fallen or degraded due to natural causes (i.e., no human             duration for the calculation of the reference evapotranspiration
      interventions) and that were defoliated by ≥ 80% in                  and not direct radiation measurements because the latter
      the previous year.                                                   were more affected by instrument changes. As a consequence,
                                                                           sunshine duration had to be transformed to net radiation
    • In rare cases, trees may seem completely defoliated while
                                                                           (Allen et al., 1998).
      being still alive. Therefore, if a defoliation of 100% was
                                                                              The spatial analysis of mild extremes of low midsummer
      reported followed by a defoliation estimation < 100% in
                                                                           to early autumn PRCP sums with a 5-year return period
      the next assessment, the defoliation value of 100% was
                                                                           is based on the monthly interpolated PRCP dataset of
      replaced by 95%.
                                                                           MeteoSwiss (RhiresM), from which the 20th percentile of July
    • In order to determine the exact mortality year of individual         to September PRCP sums from 1981 to 2018 were extracted.
      trees, only defoliation time series containing measurements          PRCP time series from 1981 to 2018 for other European regions
      in the year before mortality were considered.                        affected by Scots pine mortality events were derived from the

Frontiers in Forests and Global Change | www.frontiersin.org           4                                     June 2022 | Volume 5 | Article 874100
Hunziker et al.                                                                                                       Precipitation Anomalies Drive Tree Vitality

interpolated E-OBS dataset with a grid resolution of 0.25◦               atmosphere, the VPD may directly impact the functioning of
(Haylock et al., 2008).                                                  trees and affect plant physiology in absence as well as in
   All analyses were done on annual and seasonal time                    combination with drought (Grossiord et al., 2020; Trotsiuk
scales. For the seasons, winter includes the months December             et al., 2020; Zweifel et al., 2021). Therefore, it was analyzed in
of the previous year to February (DJF), spring March to                  addition to the ETo.
May (MAM), summer June to August (JJA), and autumn
September to November (SON). For some analyses, further                  Climatic Water Balance
time periods were analyzed such as midsummer to early                    The climatic water balance is a simple parameter integrating
autumn (July to September) or the estimated vegetation period            the main water in- and output by subtracting the ETo
(April to September).                                                    from PRCP. It is often used as indicator for drought
                                                                         and tree water stress (e.g., Eilmann et al., 2011; Rigling
Reference Evapotranspiration and Vapor Pressure                          et al., 2013; Buras et al., 2020). However, the climatic water
Deficit                                                                  balance does not consider various factors that are relevant
Evapotranspiration describes the water transfer from vegetation          for site specific water availability such as the (short-term)
and soil to the atmosphere and reaches some two-thirds                   temporal distribution of PRCP events, runoff, soil water
of the average PRCP amount over the entire land surface                  storage capacity, and difference between the potential and
(Baumgartner and Reichel, 1975). The actual evapotranspiration           actual evapotranspiration. Therefore, we focus on temporal
can be adequately estimated by calculating the potential                 changes and anomalies instead of absolute values of the
evapotranspiration from standard atmospheric measurements                climatic water balance.
(e.g., Sumner and Jacobs, 2005; Calanca et al., 2011). For
this, we used the approach of the Food and Agriculture                   Climate Change Indices
Organization of the United Nations which calculates the                  For an in-depth insight into the changes of climatic conditions
reference evapotranspiration (ETo) (Allen et al., 1998). It              in the Swiss Rhône valley and to analyze potential impacts of
is one of the more physically sound methods (Hargreaves                  (mild) atmospheric extremes on Scots pines, we computed and
and Allen, 2003) and it is widely used in various research               analyzed six climate change indices (Table 1). These indices are
fields (Ortega-Farias et al., 2009; Sentelhas et al., 2010;              largely based on the definitions by the CCl/CLIVAR/JCOMM
Amatya and Harrison, 2016). The approach is based on                     Expert Team on Climate Change Detection and Indices
the Penman-Monteith method (Penman, 1948; Monteith,                      (ETCCDI).3 In contrast to the ETo, the VPD, PRCP, and the
1965) and requires atmospheric measurements of temperature,              climatic water balance, the climate change indices are calculated
humidity, sunshine, and wind speed. In the context of                    from daily weather observations and may therefore identify
a changing climate, methods that include these four key                  trend signals and extremes which remain undetected by the
variables should be preferred over methods taking into                   other parameters.
account less input parameters (McMahon et al., 2013). Further
details on the calculation of the ETo and considerations                 Trend Estimation, Linear Regression and Correlation
regarding its adequacy over forest stands can be found in                Trends of most atmospheric parameters and indices were
Supplementary Text 1.                                                    calculated with the non-parametric Theil-Sen trend estimator
    To identify drivers of ETo trend signals, we performed               (Theil, 1950; Sen, 1968) which is robust to outliers. The
sensitivity analyses and calculated ETo time series with only            significance of trend signals was tested with the Mann-
one atmospheric variable as driver while keeping the other               Kendall test (Mann, 1945; Kendall, 1948). Because various time
variables constant. In other words, to quantify the impact of            series analyzed in the present study are serially correlated,
temperature, temperature measurements were used together with            pre-whitening (i.e., accounting for lag-1 autocorrelation) was
1981–2018 means of relative humidity, sunshine duration, and             incorporated in the test (Wang and Swail, 2001; Zhang
wind speed to calculate the ETo. Any trend signal and variability        and Zwiers, 2004) in order to avoid over-detection of trend
in the resulting ETo time series reflect consequently the specific       significance (Bayazit and Önöz, 2007). For the count data
impact of temperature. ETo trend signals calculated with different       of the climate change indices TX90p, TN10p, and WDcount,
variables as drivers can be compared directly. Furthermore,              trends were estimated by logistic regression (Frei and Schär,
we quantified the impact of the atmospheric variables on                 2001). Possible overdispersion due to fluctuating probabilities
ETo variability and extremes. This was done by calculating               and serial correlation was taken into account (Frei and Schär,
the centered root mean squared fraction and converting                   2001). All trend signals were regarded as significant in case
it to a percentual efficiency measure (see Supplementary                 of a p-value ≤ 0.05. If a time series did not cover the entire
Text 2 for details).                                                     time period between 1981 and 2018, the fitted trend line
    The vapor pressure deficit (VPD) is the difference between           was extrapolated.
the saturation vapor pressure and the actual vapor pressure                 To make atmospheric changes spatially comparable, absolute
(Seager et al., 2015) and depends therefore on the atmospheric           trends were converted to relative trend signals, except for
variables temperature and humidity. It is one of the critical            parameters for which relative trends are not meaningful (i.e.,
parameters driving evapotranspiration (Castellví et al., 1996;
Allen et al., 1998). Besides its role for the water loss to the          3
                                                                             http://etccdi.pacificclimate.org/list_27_indices.shtml

Frontiers in Forests and Global Change | www.frontiersin.org         5                                                  June 2022 | Volume 5 | Article 874100
Hunziker et al.                                                                                                              Precipitation Anomalies Drive Tree Vitality

TABLE 1 | Climate change indices analyzed in the present study.

ID            Index name                             Index definition                                                                                       Unit

DTR           Diurnal temperature range              Difference between daily maximum and minimum temperature                                               ◦C

TX90p         Warm days                              Count of days when the daily maximum temperature centered on a 5-day window > 90th percentile          days
TN10p         Cool nights                            Count of days when the daily minimum temperature centered on a 5-day window < 10th percentile          days
SDII          Simple precipitation intensity index   PRCP sum on wet days (PRCP ≥ 1 mm) divided by the count of wet days                                    mm day−1
WDcount       Wet day count                          Count of days with PRCP ≥ 1 mm                                                                         days
CDD           Maximum length of dry spell            Maximum number of consecutive days with PRCP < 1 mm                                                    days

The indices are identical to the ETCCDI climate change core indices (DTR, SDII, CDD), slightly adapted (TX90p, TN10p), and additional (WDcount).

temperature, DTR, TX90p, TN10p). In case of the climatic water                        and 2017. The rare recovery of mean crown foliation (negative
balance, trend signals were normalized by dividing them by                            values in Figure 2) of surviving trees (e.g., 2001 and 2006)
the standard deviation of the detrended time series in order to                       could by far not compensate the defoliation increase in other
increase spatial comparability.                                                       years. Hence, the capacity of Scots pines to recover has been
   The impact of elevation on climate trend signals was estimated                     generally low and seems even to have decreased over time
with linear regression. Correlation between atmospheric                               (hardly any mean defoliation reduction since 2009). As a
parameters were quantified with the Pearson’s product-moment                          result, the average defoliation increased between 1996 and
correlation coefficient.                                                              2018 by 5.7% per year with an average annual mortality rate
                                                                                      of 7.0%. The number of living Scots pines on the forest
Identification of Atmospheric Impacts on                                              plot near Visp decreased by 72% from 78 to 22 within 22
Scots Pine Vitality                                                                   years. The Pearson product moment correlation coefficient
The impacts of anomalies of atmospheric parameters and                                between defoliation change and mortality rate was 0.73 (p-
indices on defoliation change were identified and quantified                          value < 0.005). The mortality of individual trees occurred
with simple and multiple linear regression models. A large                            abruptly, as they had a median defoliation of only 25% until
number of atmospheric variables and indices on different time                         the median defoliation increased to 40% in the year before the
scales and in different combinations were tested as explanatory                       reported tree death.
variables. Because of the limited amount of suitable observational                       At the forest plot in Pfynwald, the defoliation increased
data, the models were kept relatively simple in order to                              annually by 1.5% between 2003 and 2018 with a mean mortality
reduce the risk of randomly inflating the explanatory power.                          rate of 1.7%, resulting in a total decrease of living Scots pines
Furthermore, we corroborated the findings of the regression                           by 13% from 290 to 251 within 15 years. Compared to Visp, the
analyses by the evidence of additional data sources and                               decline occurred much more evenly distributed in time. Because
analyses. To avoid biased conclusions due to overfitting, the                         of the low variability of defoliation change and mortality rate,
models were evaluated by comparing their Bayesian information                         the two parameters were not significantly correlated (r = 0.44,
criteria (BIC). For a more comprehensive model evaluation,                            p-value = 0.10). In contrast to the forest plot near Visp, the
we additionally included the Akaike information criteria (AIC),                       defoliation of individual trees that died was clearly elevated
which penalize a higher number of explanatory variables                               (median of 60%) on a longer term before increasing to 65% 3
less heavily. The explanatory power was quantified by the                             years and to 75% in the last year before mortality.
adjusted R2 , which also accounts for the number of explanatory                          The forest plots at higher altitudes near Saillon and Lens
variables. Mortality time series were not used for regression                         were dominated by short-term oscillations between defoliation
analyses because defoliation change was found to react more                           increase and decrease. This pattern and the relatively high
directly and immediately to atmospheric stressors. Instead, we                        magnitudes of annual defoliation change and occasional
investigated the relationship between defoliation change and                          mortality may be partly explainable by the low number of
mortality as the ultimate and most obvious state of non-                              annually monitored Scots pines on these two forest plots. Still,
vitality.                                                                             there are no clear indications for pronounced defoliation and
                                                                                      mortality events. Because of the rare mortality of single trees,
                                                                                      correlations between defoliation change and mortality rate were
RESULTS                                                                               low and not significant.

Temporal Development of Scots Pine                                                    Climatic Changes in the Region of the
Vitality and Mortality                                                                Rhône Valley
The magnitude and temporal development of Scots pine                                  Reference Evapotranspiration and Vapor Pressure
defoliation changes and mortality rates in the Swiss Rhône                            Deficit
valley strongly varied spatially (Figure 2). Of the four forest                       On the annual time scale, the ETo increased at all weather
plots analyzed, pronounced defoliation and mortality events                           stations except one (Figure 3A) with a median of +7.3% in the
only occurred near Visp, namely around 1999, 2004, 2011,                              38-year period from 1981 to 2018. However, there are strong

Frontiers in Forests and Global Change | www.frontiersin.org                      6                                            June 2022 | Volume 5 | Article 874100
Hunziker et al. Precipitation Anomalies Drive Tree Vitality
FIGURE 2 | Annual mean defoliation changes and mortality rates at the forest plots near Visp (mean n = 47), Pfynwald (mean n = 270), Saillon (mean n = 18) and
Lens (mean n = 8). The dark gray vertical bars represent the standard error of the mean of the annual defoliation change (average Visp = 2.1%, Pfynwald = 0.4%,
Saillon = 3.0%, Lens = 3.1%).
seasonal differences. Whereas percentual ETo trend signals valley was air temperature (Supplementary Figure 3). The 1981–
in winter were insignificant with a high spread between the 2018 temperature trends caused significant ETo increases at all
single stations, there was a pronounced significant increase investigated weather stations in spring, summer and on the
in spring at all stations with a median of +16.9%. Seasonal annual time scale. Temporal changes of relative humidity, in
trend patterns of the VPD were similar to those of the contrast, mostly resulted in positive and significant ETo trends
ETo, but VPD trend magnitudes and the spread of individual below 1,000 m a.s.l. and in negative ETo trends above 2,000
station trends were larger (Figure 3D). Same as for the m a.s.l. Therefore, relative humidity induced a pronounced
ETo, the strongest VPD increase occurred in spring with a elevation dependence of ETo trend signals, particularly in
median of +24.9%. summer (R2 = 0.86, p-value < 0.005) and on the annual time scale
On most time scales, percentual ETo trends were elevation (R2 = 0.91, p-value < 0.005). Changes of the sunshine duration
dependent (Figure 3A and Supplementary Figure 1). This mostly caused positive ETo trends in spring, summer, and on the
effect was particularly pronounced on the annual time scale annual time scale. Temporal wind speed changes affected ETo
(regression coefficient between elevation and the ETo = 0.76, trends only locally. The strongest impact occurred in Visp, where
p-value < 0.005) and in summer (R2 = 0.75, p-value < 0.005). decreasing wind speed caused negative ETo trends, and hence
Below 1,500 m a.s.l., the ETo increased significantly at all lowering the overall ETo increase driven by the other variables.
individual stations on the annual time scale, in summer and in For annual and seasonal ETo variability and extremes,
spring (with one exception). A similar but even stronger elevation temperature and relative humidity have the strongest overall
dependence was found for VPD trend signals (Figure 3D and impact (Supplementary Figure 4). Each of the two atmospheric
Supplementary Figure 1). variables explains between 20 and 40% of the total ETo variability
ETo trend signals of each meteorological station are based on at most station sites. Sunshine duration explains also 20–40%
the changes of the single atmospheric variables (Supplementary in spring and summer. Variability of wind speed is of minor
Figure 2) and their spatio-temporal impact and combination. importance but may locally still explain up to about 20% of the
The main driver of the increasing ETo in the Swiss Rhône seasonal ETo variability.
Frontiers in Forests and Global Change | www.frontiersin.org 7 June 2022 | Volume 5 | Article 874100Hunziker et al. Precipitation Anomalies Drive Tree Vitality FIGURE 3 | Trends of the atmospheric parameters and indices in the Swiss Rhône valley between 1981 and 2018. (A) Relative change of the reference evapotranspiration (ETo), (B) relative change of precipitation sums (PRCP), (C) normalized change (absolute values divided by the standard deviation of the detrended time series) of the climatic water balance (WB), (D) relative change of the vapor pressure deficit (VPD), (E) absolute change of the diurnal temperature range (DTR), (F) absolute change of the count of warm days (TX90p), (G) absolute change of the count of cool nights (TN10p), (H) relative change of the simple precipitation intensity index (SDII), (I) relative change of the count of wet days (WDcount), and (J) relative change of the duration of consecutive dry days (CDD). Trends are shown for winter (DJF), spring (MAM), summer (JJA), autumn (SON), and on the annual time scale (annual). Filled dots denote significant trends at a significance level of 0.05. Colors indicate the station elevation. The box plots show the median, the 25th and the 75th percentile. Precipitation and Climatic Water Balance PRCP sums decreased at most stations in winter, spring, and PRCP sum time series are highly variable in time, and autumn, whereas they increased in summer. The seasonal PRCP individual station trends are mostly insignificant except in trend cycle seems independent of the seasonal ETo trend cycle autumn (Figure 3B). On the annual time scale, there are negative (Figures 3A,B). Hence, a PRCP decrease does not imply an ETo PRCP trends at all stations (except one) with a median of -9.6%. increase nor vice versa. Frontiers in Forests and Global Change | www.frontiersin.org 8 June 2022 | Volume 5 | Article 874100
Hunziker et al.                                                                                             Precipitation Anomalies Drive Tree Vitality

   The climatic water balance as integrating factor of water in-           consequence of the trend-dominated characteristics of the ETo
and output generally decreased (Figure 3C). The strongest trend            and the variability-dominated characteristics of PRCP, annual
magnitudes occurred at low elevation sites and in autumn, but              and seasonal anomalies of the climatic water balance follow
individual station trends were mostly insignificant and spread             closely the variability of PRCP sums. In Visp, for example,
strongly. In summer, the generally increasing ETo and PRCP                 the regression coefficient between PRCP sums and the climatic
trends partly canceled each other out in the climatic water                water balance is 0.92 (p-value < 0.005) on the annual time
balance trend signal.                                                      scale with the strongest relationship in winter (R2 = 0.98,
                                                                           p-value < 0.005) and the weakest relationship in summer
Climate Change Indices                                                     (R2 = 0.86, p-value < 0.005). Correlations between PRCP sums
Trend signals of the diurnal temperature range (DTR)                       and the ETo are low and insignificant except for spring (r = -0.53,
spread strongly between the different meteorological stations              p-value < 0.005).
(Figure 3E). However, a pronounced and mostly significant                      The strong excess of potential water output over water
DTR increase occurred in spring at lower elevations, indicating            input in spring and summer in the central Rhône valley
a shift towards drier conditions (i.e., less cloudy conditions             leads to yearly recurring periods of low soil moisture between
and less water vapor in the air). The frequency of exceptionally           midsummer and autumn. From 2013 to 2018 on the forest
warm days (TX90p) increased mostly significantly in all                    plot near Visp, for example, the volumetric soil water content
seasons except for winter (Figure 3F). The strongest seasonal              fell regularly to low values around July (Figure 5). This drop
increase occurred in spring and summer. Trend magnitudes                   occurred mainly independently of soil moisture contents in
of the frequency of exceptionally cool nights (TN10p,                      winter and spring. Substantial PRCP events between midsummer
Figure 3G) are lower and mostly inverse to those of the                    and autumn resulted in sudden soil moisture increases and
frequency of warm days.                                                    prevented therefore prolonged and continuous periods of very
   The pronounced temporal and spatial variability of PRCP                 low volumetric soil water contents in 2013, 2014, 2015, and
manifests in the PRCP-based climate change indices by mostly               2017, but not in 2016 and 2018. Note that the annual tree
insignificant and strongly spreading individual station trends.            health inventories usually took place shortly before very low soil
On the annual time scale, the PRCP intensity (SDII) decreased              moisture contents were reached.
at most stations (Figure 3H). This decrease occurred largely
in winter and autumn. The frequency of wet days (WDcount)
also decreased on the annual time scale, with generally negative           Main Driver of Defoliation and Mortality
trends in spring and autumn but positive trends in summer                  Events
(Figure 3I). The duration of consecutive dry days (CDD) mostly             Negative July to September Precipitation Anomalies
increased in spring, particularly at elevations below 1,000 m a.s.l.       Negative anomalies of PRCP patterns from midsummer to early
(Figure 3J). In summer and autumn, in contrast, this duration              autumn were the main driver of defoliation events on the forest
generally decreased.                                                       plot near Visp from 1996 to 2018. Because crown defoliation
                                                                           assessments were mostly carried out in July, the effect of such
Impacts of Climatic Changes on Soil                                        PRCP anomalies did not manifest in the data of the same but
Water Availability                                                         the following year. We identified July to September as the most
Because Scots pine decline occurred on the low elevation forest            relevant period with wet day frequency (WDcount) and PRCP
plots in the Swiss Rhône valley, the seasonal cycle and temporal           intensity (SDII) explaining about 60% of the defoliation change
changes of soil water availability near Visp and in Pfynwald               occurring until the next defoliation assessment (Table 2). This
were investigated. Data of the weather station in Visp are                 model has the lowest BIC and AIC values (indicating a higher
representative for the forest plot near Visp, whereas Pfynwald             quality than the other models) as well as the highest adjusted
is located 20 km west of Visp, about halfway between the                   R2 (highest explanatory power). Also, on longer time periods
meteorological stations in Visp and Sion (Figure 1, see station            (estimated vegetation period from April to September, entire
abbreviations VIS and SIO). Climate characteristics and trends             year) or if shifted by a month (JJA), the performance of this model
in Pfynwald were therefore assumed to be in between the                    is the best or among the best.
observations from the two sites.                                               July to September PRCP sums explain about 50% of
   The general climate characteristics at lower altitudes are              the defoliation change observed in the next year (Table 2).
similar within the central Rhône valley, which is also reflected           Hence, considering the temporal distribution of PRCP
in the seasonal cycles of potential water in- and output in                events (i.e., using WDcount and SDII instead of PRCP
Visp and Sion (Figure 4 and Supplementary Table 2). At                     sums) may increase the explanatory power. There is an
both sites, the ETo clearly exceeds PRCP sums in spring                    inverse relationship between July to September PRCP
and summer. PRCP sum time series are characterized by a                    anomalies and the following annual defoliation change of
strong year-to-year variability, which clearly exceeds the mostly          Scots pines (Figure 6). Particularly, all four defoliation
insignificant 1981–2018 trend signals (Supplementary Table 2).             events followed clearly negative July to September PRCP
In contrast, the inter-annual variability of the ETo is rather             sum anomalies. Only the clearly below average July to
small, but the ETo increased strongly and significantly in time            September PRCP sums in 1996 and 2006 did not trigger
(in spring, summer, and on the annual time scale). As a                    defoliation increases in the following years 1997 and 2007,

Frontiers in Forests and Global Change | www.frontiersin.org           9                                      June 2022 | Volume 5 | Article 874100
Hunziker et al. Precipitation Anomalies Drive Tree Vitality FIGURE 4 | Reference evapotranspiration (ETo) and precipitation sums (PRCP) in Visp (VIS, top) and Sion (SIO, bottom) in winter (DJF), spring (MAM), summer (JJA), autumn (SON), and on the annual time scale (annual) from 1981 to 2018 (brightest to darkest colors). FIGURE 5 | Volumetric soil water content on the forest plot near Visp. Measurements of three soil moisture profiles with sensors at 15, 50, and 80 cm depth are shown. Vertical black lines indicate the dates of the annual tree crown condition assessments. respectively, which can be explained by an above average to 2017, the regression coefficient between PRCP sums and wet day frequency and an evenly distributed temporal the climatic water balance was 0.89 (p-value < 0.005) and the wet day occurrence. correlation coefficient between PRCP sums and the ETo -0.55 Except for the period July to September, the explanatory (p-value < 0.005). Adding the ETo as additional explanatory power of the climatic water balance (WB) is slightly lower variable to PRCP sums or to WDcount and SDII results in than the one of PRCP sums (Table 2). As demonstrated a decrease of the model quality. Hence, year-to-year ETo earlier, temporal anomalies of the climatic water balance anomalies did not or only marginally impact the defoliation of closely follow PRCP sums. In July to September from 1996 Scots pines in Visp. Frontiers in Forests and Global Change | www.frontiersin.org 10 June 2022 | Volume 5 | Article 874100
Frontiers in Forests and Global Change | www.frontiersin.org
Hunziker et al.
TABLE 2 | Most relevant explanatory variables for defoliation changes on the forest plot near Visp in various time periods.
Explanatory July to April to Complete MAM JJA SON April to June
variables September September previous year (previous year) (previous year) (previous year) (current year)
(previous year) (previous year)
WDcount + Adj. R2 : 0.59 Adj. R2 : 0.22 Adj. R2 : 0.26 Adj. R2 : 0.05 Adj. R2 : 0.46 Adj. R2 :-0.03 Adj. R2 :−0.01
SDII BIC: 161 BIC: 174 BIC: 173 BIC: 179 BIC: 166 BIC: 181 BIC: 180
AIC: 156 AIC: 170 AIC: 169 AIC: 175 AIC: 162 AIC: 176 AIC: 176
WDcount + Adj. R2 : 0.56 Adj. R2 : 0.18 Adj. R2 : 0.22 Adj. R2 : 0.00 Adj. R2 : 0.44 Adj. R2 :−0.08 Adj. R2 :−0.06
Multiple linear regression SDII + ETo BIC: 164 BIC: 177 BIC: 176 BIC: 182 BIC: 169 BIC: 184 BIC: 183
AIC: 158 AIC: 172 AIC: 171 AIC: 177 AIC: 163 AIC: 178 AIC: 178
PRCP sum + Adj. R2 : 0.49 Adj. R2 : 0.20 Adj. R2 : 0.17 Adj. R2 : 0.03 Adj. R2 : 0.27 Adj. R2 :−0.06 Adj. R2 : 0.00
ETo BIC: 165 BIC: 175 BIC: 176 BIC: 179 BIC: 173 BIC: 181 BIC: 180
AIC: 161 AIC: 171 AIC: 172 AIC: 175 AIC: 169 AIC: 177 AIC: 176
PRCP sum Adj. R2 : 0.50 (−) Adj. R2 : 0.24 (−) Adj. R2 : 0.21 (−) Adj. R2 : 0.12 Adj. R2 : 0.30 (−) Adj. R2 :−0.01 Adj. R2 : 0.04
BIC: 163 BIC: 172 BIC: 173 BIC: 176 BIC: 170 BIC: 178 BIC: 177
AIC: 160 AIC: 169 AIC: 170 AIC: 173 AIC: 167 AIC: 175 AIC: 174
Adj. R2 : 0.51 (−) Adj. R2 : 0.20 (−) Adj. R2 : 0.19 (−) Adj. R2 : 0.05 Adj. R2 : 0.26 (− Adj. R2 :−0.01 Adj. R2 : 0.03
11
WB
BIC: 163 BIC: 173 BIC: 173 BIC: 177 BIC: 172 BIC: 178 BIC: 177
AIC: 159 AIC: 170 AIC: 170 AIC: 174 AIC: 168 AIC: 175 AIC: 174
Simple linear regression WDcount Adj. R2 : 0.24 (−) Adj. R2 : 0.05 Adj. R2 :−0.03 Adj. R2 :−0.03 Adj. R2 : 0.31 (−) Adj. R2 :−0.05 Adj. R2 :−0.05
BIC: 172 BIC: 177 BIC: 179 BIC: 179 BIC: 170 BIC: 179 BIC: 179
AIC: 169 AIC: 174 AIC: 176 AIC: 175 AIC: 167 AIC: 176 AIC: 176
SDII Adj. R2 : 0.27 (−) Adj. R2 : 0.16 (−) Adj. R2 : 0.28 (−) Adj. R2 : 0.01 Adj. R2 : 0.15 (−) Adj. R2 : 0.01 Adj. R2 : 0.04
BIC: 171 BIC: 174 BIC: 171 BIC: 176 BIC: 174 BIC: 178 BIC: 177
AIC: 168 AIC: 171 AIC: 167 AIC: 173 AIC: 171 AIC: 174 AIC: 174
ETo Adj. R2 : 0.23 (+) Adj. R2 : 0.03 Adj. R2 : 0.00 Adj. R2 :−0.04 Adj. R2 : 0.01 Adj. R2 :−0.05 Adj. R2 :−0.03
BIC: 172 BIC: 177 BIC: 178 BIC: 179 BIC: 178 BIC: 179 BIC: 179
AIC: 169 AIC: 174 AIC: 175 AIC: 176 AIC: 175 AIC: 176 AIC: 176
Precipitation Anomalies Drive Tree Vitality
The best model [i.e., lowest Bayesian information criterion (BIC) and Akaike information criterion (AIC), highest adjusted R2 ]
is highlighted in green. Models with a BIC ≤ 164 are marked in dark gray, with a BIC ≤ 166 in
June 2022 | Volume 5 | Article 874100
gray, with a BIC ≤ 170 in light gray, and with a BIC ≤ 174 in very light gray. Adjusted R2 of models with p-values ≤ 0.05 are highlighted in bold font. For the simple linear regression models, the signs of the relationship
("+" for positive and "−" for negative) are shown in brackets in case of significance. The explanatory variables in the table include the count of wet days (WDcount), simple precipitation intensity index (SDII), reference
evapotranspiration (ETo), precipitation sum (PRCP sum) and climatic water balance (WB). April to September is the estimated vegetation period. MAM abbreviates the spring months, JJA the summer months, and SON
the autumn months. April to June of the current year is the vegetation period directly before the crown defoliation assessment. Note that many further explanatory variables, variable combinations and time periods were
tested, but the quality of these models was low (BIC > 172, AIC > 169, and adjusted R2 < 0.20).Hunziker et al. Precipitation Anomalies Drive Tree Vitality
FIGURE 6 | Annual defoliation change, mortality rates, precipitation sum (PRCP) anomalies from July to September of the previous year, and the fraction of severely
damaged living trees (≥ 75% defoliation) of the previous year on the forest plot near Visp. PRCP anomalies were normalized by dividing by the detrended standard
deviation of the time series and subtracting the 1996–2017 mean. The anomalies were multiplied by 15 in order to match the scale of the annual defoliation change.
Anomalies of PRCP sums and not anomalies of PRCP frequency and intensity (higher explanatory power) are shown in order to facilitate the visual interpretation.
Atmospheric conditions in time periods before midsummer
and after early autumn (i.e., spring and autumn of the previous
year, vegetation period before the defoliation assessment) have
no or only marginal impact on the defoliation variability of Scots
pines (Table 2). In the present study, the impact of longer-term
periods on defoliation change may be actually overestimated,
because the correlation of PRCP sums of the entire year and from
July to September was exceptionally high between 1996 and 2017
(r = 0.73, p-value < 0.005) compared to 1981–2018 (r = 0.31,
p-value = 0.06). Furthermore, annual PRCP anomalies on the
annual time scale and during the vegetation period strongly
deviated from July to September PRCP anomalies in single years
(Supplementary Figure 5). The extreme defoliation event in
2017, for instance, followed extremely low July to September
FIGURE 7 | Spatial interpolation of the 20th percentile of July to September
PRCP sums in 2016, but annual PRCP sums in 2016 were on precipitation sums between 1981 and 2018 in the Swiss Rhône valley. Black
average and PRCP sums in the vegetation period in 2016 were lines show the major rivers (most prominently the Rhône river) and black areas
only moderately low. mark water bodies. Abbreviations of the meteorological station names are
Same as in the Swiss Rhône valley, Scots pine dieback events shown in capital letters.
in other European regions directly followed strongly negative
July to September PRCP anomalies. This applies to other Alpine
areas with mortality events in 1997 in the Inn valley in Austria characteristics between the two sites are the lower PRCP sum
(Cech and Perny, 2000), 2003 in the Adige valley in Italy (Minerbi minima between midsummer and early autumn around Visp
et al., 2006), and 2005 in the Aosta valley in Italy (Gonthier (Figure 7). The forest plot near Visp is centrally located in
et al., 2010), but also to regions beyond the Alps such as 2000 the area where July to September PRCP sums of events with
and 2012 in Romania (Sidor et al., 2019), 2005 in the central a 5-year return period are lowest. July to September PRCP
Pyrenees in Spain (Galiano et al., 2010), and 2015 in Franconia sums < 100 mm occurred several times in Visp (VIS), but not
in Germany (Buras et al., 2018). In most of these cases, the July to further west in Sion (SIO) (see also Figure 4). A 20th percentile of
September PRCP sum anomalies were more negative than those July to September PRCP sums < 100 mm might therefore roughly
of the vegetation period (April to September) or the complete describe a critical threshold for the occurrence of regular Scots
year, which indicates a critical impact of low midsummer to early pine defoliation events in the Swiss Rhône valley since the 1990s.
autumn PRCP beyond the Swiss Rhône valley.
Local Climate Characteristics Further Impact Factors on Defoliation
Despite the similar water in- and output in the central Rhône and Mortality Events
valley (Figure 4), temporal defoliation patterns varied strongly Spring Frost
within short distances such as on the forest plots near Visp and Around April 20 in 2017, a strong multi-day spring frost
in Pfynwald (Figure 2). A notable difference of local climate occurred in large parts of Europe at a point of time when
Frontiers in Forests and Global Change | www.frontiersin.org 12 June 2022 | Volume 5 | Article 874100Hunziker et al. Precipitation Anomalies Drive Tree Vitality
the number of accumulated growing degree days was already Defoliation Exceedance Over a Point of No Return
high (Vitasse and Rebetez, 2018; Zohner et al., 2020). This In contrast to the defoliation change, tree mortality on the
frost event was unprecedented in terms of the damage risk for forest plot near Visp sometimes still occurred a few years after
vegetation since the start of instrumental weather observations negative July to September PRCP sum anomalies. This prolonged
in several regions in Switzerland (Vitasse and Rebetez, 2018). mortality can be largely explained by the fraction of severely
Its occurrence coincided with the time of the lowest frost damaged trees (Figure 6). A high fraction of severely damaged
hardiness of Scots pine needles of about −8◦ C (Bachofen et al., trees results in pronounced prolonged mortality (after the 1999
2016). At the meteorological station in Visp, temperatures fell and 2017 event), whereas mortality decreases quickly if only a
as low as −5.5◦ C. However, in clear and windless nights such small fraction of trees is severely damaged (after the 2004 and
as around the frost event, temperatures of plant tissues may 2011 event). If accounting for the fraction of severely damaged
be 4–8◦ C lower than temperatures measured at 2 m height trees (i.e., shifting the occurrence of mortality of the trees that
under sheltered conditions because of radiative cooling (Ducrey, died to the year when the defoliation threshold was exceeded), the
1998). Hence, there was a high risk for frost damage on correlation coefficient between defoliation change and mortality
the forest plot near Visp. CIR imagery derived from satellite rate increases from 0.73 to 0.94 (p-value < 0.005 in both cases)
earth observations before and after the frost event indicates (Supplementary Figure 5).
frost damages on Scots pines and other vegetation near Visp In this study, severely damaged trees were defined as trees that
(example shown in Supplementary Figure 6). Furthermore, exceeded a defoliation threshold (point of no return) that leads
extensive frost damage on shoot increments of Scots pines most likely to mortality within 2 years. Scots pines exceeding such
was observed on a forest stand between 800 and 950 m a.s.l. defoliation thresholds may not be able to maintain important
about 20 km west of Visp (personal communication with physiological functions and die likely from carbon starvation
Pierre Vollenweider). (Galiano et al., 2011; Guada et al., 2016; Schönbeck et al., 2018).
The spring frost in 2017 may have substantially contributed On the monitored forest plot near Visp, most Scots pines that
to the exceptionally high 44% Scots pine defoliation change reached a crown defoliation ≥ 75% died within 1 (70%) or 2 years
observed near Visp in July 2017 (Figure 6). From July to (83%) without being exposed to further water stress. This causes
September 2016, PRCP intensity and frequency anomalies were a pronounced bimodal distribution of the defoliation magnitude
strongly negative, and Scots pine dieback in the region of Visp in the last year before mortality. The defoliation before mortality
was already reported in October 2016 (Rigling et al., 2018). The of most trees was low (median of 35% if including defoliation
combination of water stress in 2016 and the spring frost 2017 values < 70%), whereas it was high for the trees that past
seems to have strongly deteriorated the vitality of Scots pines. the point of no return (median of 85% if including defoliation
values ≥ 70%).
Pests and Pathogens
On the forest plot near Visp, pests and pathogens intensified and
prolonged particularly one Scots pine defoliation and mortality
event. In 1999, 82% of the tree crowns were damaged by insects DISCUSSION
and 30% by fungi. Around Visp and in further areas in the
Rhône valley, Scots pines were strongly infested by the pine Atmospheric Pathways to Defoliation
shoot beetle (Tomicus piniperda) and the fungus Cenangium and Mortality Events
ferruginosum (information provided by Waldschutz Schweiz). Despite the critical importance of July to September PRCP on
These biotic factors increased the annual defoliation change the vitality of Scots pine from the 1990s onwards, the water
in 1999 by more than 10% and explain therefore about a input in summer mostly increased in the Swiss Rhône valley
third of the total 27% defoliation change (Figure 6). In 2000, from 1981 to 2018 (Figure 3). In Visp, for example, summer
the insect and fungus infestation was still intense with 76 PRCP sums increased by 23 mm. This trend cannot be explained
and 14% affected trees, respectively. Removing the impact of by a single factor such as more extreme PRCP events, because
these biotic factors from the defoliation change time series the wet day frequency (WDcount) increased as well as the
results in a more proportional reflection of the magnitude of PRCP intensity (SDII), whereas the consecutive dry day duration
negative July to September PRCP sum anomalies compared to (CDD) decreased. Hence, temporal changes of the water input
the other events. patterns in summer are not responsible for the emergence of July
The pest and pathogen infestation in 1999 and 2000 on the to September PRCP anomalies as the main driver of sudden Scots
forest plot near Visp was clearly the most severe biotic damage pine vitality declines on the forest plot near Visp.
impact between 1996 and 2018. In all other years, the percentage The most consistent change from 1981 to 2018 in the
of Scots pines with reported insect damage remained below Swiss Rhône valley’s climate regime occurred in spring with
20%, and the impact on defoliation change was therefore rather a pronounced shift toward drier conditions particularly at
small. Before the infestation in 1999, Scots pines were exposed lower altitudes. The ETo and the VPD increased strongly,
to four consecutive years with negative July to September PRCP whereas PRCP related parameters and indices consistently
sum anomalies (Supplementary Figure 5). This exceptionally indicate a decrease in spring water input (Figure 3). The
long stress period may have favored the intense insect and atmospheric water demand also increased in summer. These
fungi infestation. changes consequentially prolonged and intensified the annual
Frontiers in Forests and Global Change | www.frontiersin.org 13 June 2022 | Volume 5 | Article 874100You can also read