Pelagic primary production in the coastal Mediterranean Sea: variability, trends, and contribution to basin-scale budgets
←
→
Page content transcription
If your browser does not render page correctly, please read the page content below

Research article
Biogeosciences, 19, 47–69, 2022
https://doi.org/10.5194/bg-19-47-2022
© Author(s) 2022. This work is distributed under
the Creative Commons Attribution 4.0 License.

Pelagic primary production in the coastal Mediterranean Sea:
variability, trends, and contribution to basin-scale budgets
Paula Maria Salgado-Hernanz1,2 , Aurore Regaudie-de-Gioux3 , David Antoine4,5 , and Gotzon Basterretxea1
1 Department of Marine Ecology, IMEDEA (UIB-CSIC), Miquel Marquès 21, 07190 Esporles, Spain
2 CentroOceanográfico de Baleares, Instituto Español Oceanografía (COB – IEO), Muelle de Poniente s/n,
07015 Palma de Mallorca, Spain
3 ODE/DYNECO/Pelagos, Centre de Bretagne, IFREMER, I. Technopôle Brest-Iroise,

Pointe du Diable BP70 29280 Plouzané, France
4 Remote Sensing and Satellite Research Group, School of Earth and Planetary Sciences,

Curtin University, Perth, WA 6845, Australia
5 Sorbonne Université, CNRS, Laboratoire d’Océanographie de Villefranche, LOV, 06230 Villefranche-sur-Mer, France

Correspondence: Paula Maria Salgado-Hernanz (pmsalgadohernanz@gmail.com) and Gotzon Basterretxea
(gotzon@imedea.uib-csic.es)

Received: 4 December 2020 – Discussion started: 11 January 2021
Revised: 18 May 2021 – Accepted: 10 July 2021 – Published: 3 January 2022

Abstract. We estimated pelagic primary production (PP)              contribution of coastal waters to basin-scale carbon balances
in the coastal (< 200 m depth) Mediterranean Sea from               in the Mediterranean Sea while highlighting the importance
satellite-borne data, its contribution to basin-scale carbon fix-   of the different temporal and spatial scales of variability.
ation, its variability, and long-term trends during the period
2002–2016. Annual coastal PP was estimated at 0.041 Gt C,
which approximately represents 12 % of total carbon fixa-
tion in the Mediterranean Sea. About 51 % of this produc-           1   Introduction
tion occurs in the eastern basin, whereas the western and
Adriatic shelves contribute with ∼ 25 % each of total coastal       Coastal ocean waters (i.e., < 200 m depth) are an impor-
production. Strong regional variability is revealed in coastal      tant link between the land and the open ocean. They act as
PP, from high-production areas (> 300 g C m−2 ) associated          a buffer between terrestrial and human influences and the
with major river discharges to less productive provinces (<         open ocean (Liu et al., 2000). Despite their relatively re-
50 g C m−2 ) located in the southeastern Mediterranean. PP          duced extension (∼ 7 % of ocean surface area; Gattuso et
variability in the Mediterranean Sea is dominated by inter-         al., 1998), they behold some of the most productive habitats
annual variations, but a notable basin-scale decline (17 %)         on the planet. Therefore, they have a disproportionate im-
has been observed since 2012 concurring with a period of in-        portance in many basin-scale biogeochemical and ecological
creasing sea surface temperatures in the Mediterranean Sea          processes, including carbon and nitrogen cycling, and in the
and positive North Atlantic Oscillation and Mediterranean           maintenance of marine diversity (Cebrian, 2002; Coll et al.,
Oscillation climate indices. Long-term trends in PP reveal          2010; Dunne et al., 2007). Besides, biological production of
slight declines in most coastal areas (−0.05 to −0.1 g C m−2        continental shelves supports over 90 % of global fish catches
per decade) except in the Adriatic where PP increases at            (Pauly et al., 2002; Pauly and Christensen, 1995).
+0.1 g C m−2 per decade. Regionalization of coastal waters             Coastal seawaters support high primary production (PP),
based on PP seasonal patterns reveals the importance of river       contributing to some 10 % of global ocean PP and up to 30 %
effluents in determining PP in coastal waters that can region-      if estuarine and benthic production is considered (Ducklow
ally increase up to 5-fold. Our study provides insight into the     et al., 2001; Muller-Karger et al., 2005). These high rates of
                                                                    organic productivity occur in the coastal oceans due to the

Published by Copernicus Publications on behalf of the European Geosciences Union.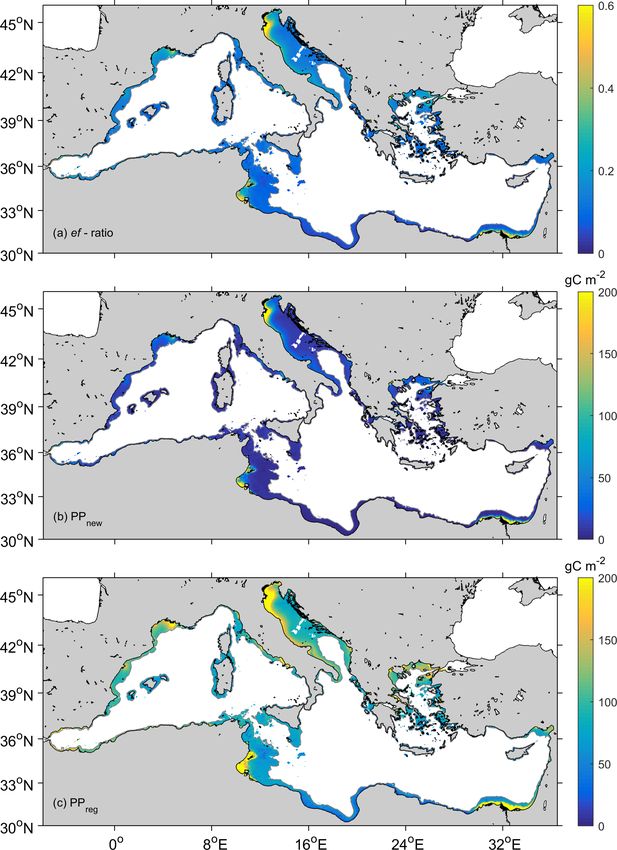
48                            P. M. Salgado-Hernanz et al.: Pelagic primary production in the coastal Mediterranean Sea

rapid turnover of the large inputs of nutrients and organic        fertilize the coastal waters (Goffart et al., 2002). Nutrient-
carbon from land. PP drives a significant carbon sink in the       rich effluents from human activities on the coast (domestic
ocean (Field et al., 1998; Laws et al., 2000) and is a key         wastewater, fertilizers, industry, etc.) and natural river dis-
regulator of ecological processes such as elemental cycling,       charges affect continental shelf productivity in this sea, sus-
trophic structure variabilities, and climate change (Bauer et      taining locally enhanced pelagic and benthic biomass. Nev-
al., 2013; Chavez et al., 2011). In coastal waters, physical and   ertheless, the influence of some river flows has been notably
biological processes enhance the carbon transport out of the       reduced by damming affecting water chemistry and sediment
continental margins into the deep layers of the oceans, thus       loads and, thereby, the productivity of coastal waters at local
connecting terrestrial with deep oceanic systems (Cai, 2011;       and regional scales (Ludwig et al., 2009; Tovar-Sánchez et
Carlson et al., 2001; Cole et al., 2007). The productivity of      al., 2016). Moreover, intensive agricultural practices and ur-
coastal sea areas is also of strategic socio-economic impor-       banization have brought unprecedented use and contamina-
tance for many countries considering that PP constrains the        tion of coastal groundwater (Basterretxea et al., 2010; Tovar-
amount of fish and invertebrates available to expanding fish-      Sánchez et al., 2014). For example, the use of fertilizers has
eries, a primary resource for many coastal human communi-          resulted in higher nutrient flow into the Adriatic and in the
ties (Chassot et al., 2010). The estimation and understanding      lagoons of the Nile River, which has led to eutrophication
of PP evolution and trends in the coastal seas is therefore        (Turley, 1999). However, the impact of this anthropogenic
essential to improve our knowledge of the oceanic carbon           nutrient enrichment may vary between regions, and model-
cycle.                                                             ing projections suggest spatial variations in PP as a result of
   Scaling up local measurements to estimate the contribu-         climate change.
tion of coastal regions to global carbon fluxes has been hin-         Accurate quantification of the coastal PP is fundamental
dered by the high spatial and temporal heterogeneity of these      for assessment of global carbon cycling in the Mediterranean
waters. Global models of oceanic systems produce carbon            Sea. Changes in PP have important effects on fish stocks that
fixation estimates with a high degree of uncertainty in coastal    are socially relevant because of the economical dependency
regions (Muller-Karger et al., 2005). Coastal waters are com-      of many Mediterranean coastal communities on marine food
plex because of the tight connection between terrestrial and       products. Several studies have assessed PP at the scale of the
oceanic systems. Terrestrial uploads of nutrients and organic      entire Mediterranean Sea from satellite remote sensing data
matter originating from groundwater discharges, flash floods,      (Bosc et al., 2004; Bricaud et al., 2002; Lazzari et al., 2012).
or river runoff as well as exchanges with the seafloor strongly    However, coastal areas were generally ignored in such stud-
control the productivity of these waters (Basterretxea et al.,     ies, so that their contribution to basin-scale budgets is still
2010; Woodson and Litvin, 2014). The amplitude of seasonal         largely unknown. Most coastal studies have a focus on spe-
variation in surface chlorophyll (chl) and surface temperature     cific regions and/or times (Estrada, 1996; Marty et al., 2002;
is often higher in coastal waters compared to the open ocean       Moutin and Raimbault, 2002; Rahav et al., 2013). Observed
(Cloern and Jassby, 2008). Furthermore, coastal topography         rates of climate change in the Mediterranean basin exceed
and its interaction with winds, waves, and currents generates      global trends (Cramer et al., 2018) and future warming in the
a high variety of physicochemical niches for phytoplankton         Mediterranean region is expected to be above global rates by
growth. Likewise, benthic–pelagic coupling allows the rem-         25 % (Lionello and Scarascia, 2018). Long-term responses of
ineralization of nutrients present in shelf sediments during       PP in coastal areas to climate forcing remain uncertain how-
most intense storms. These episodic variations may consti-         ever because of the scarcity of adequate field datasets (Gasol
tute an important contribution to the overall productivity of      et al., 2016).
shelf waters. Because of the high spatiotemporal heterogene-          In this study, we present major characteristics of pelagic
ity in the main coastal subsystems and the concomitant lack        PP in Mediterranean coastal waters based on satellite-borne
of data, most estimated carbon fluxes in these subsystems          observations for the period 2002–2016. First, we provide
have relatively high uncertainties (Bauer et al., 2013). In ad-    global estimations of PP in coastal waters, and we as-
dition, direct human activities and climate change lead to a       sess their contribution to basin-scale PP, their interannual
long-term variation in terrestrial fluxes and coastal biogeo-      variability, and long-term trends. Then, we regionalize the
chemistry that can potentially have important consequences         coastal waters based on their temporal patterns of pelagic PP
for the global carbon cycle (Gregg et al., 2003).                  using self-organizing maps (SOMs), and we analyze the con-
   In the Mediterranean Sea, coastal and shelf areas repre-        tribution of each region to total coastal PP.
sent about 21 % of the global basin (259 000 km2 ), which is
a higher contribution than for the global ocean (Pinardi et al.,
2006). Although the Mediterranean Sea is included amongst
the most oligotrophic areas of the world oceans, it can dis-
play marked spatial productivity variations related to the va-
riety of regional climate and oceanographic conditions as
well as related to the multiple land-derived fluxes that locally

Biogeosciences, 19, 47–69, 2022                                                         https://doi.org/10.5194/bg-19-47-2022
P. M. Salgado-Hernanz et al.: Pelagic primary production in the coastal Mediterranean Sea                                       49

2     Materials and methods                                     2.2   Primary production estimates

2.1    Remote sensing data                                      PP was estimated from satellite-derived chl, SST, and PAR
                                                                values using the time, depth, and wavelength-resolved light-
We used the Mediterranean Sea Level-3 reprocessed               photosynthesis model of Morel (1991). This model was pre-
surface chlorophyll concentration product (Chl L3) ob-          viously used for estimating PP in the Mediterranean Sea (An-
tained from the EU Copernicus Marine Environment                toine and André, 1995) and at global scale (Antoine et al.,
Monitoring Service (CMEMS). This product merges                 1996; Antoine and Morel, 1996) and performs well when
multi-satellite observations, and it is available at 1 d and    compared to in situ measurements (Campbell et al., 2002;
1 km resolution (https://resources.marine.copernicus.eu/        Friedrichs et al., 2009) or when compared to other similar
product-detail/OCEANCOLOUR_MED_CHL_L3_REP_                      algorithms designed for use with satellite observations (Carr
OBSERVATIONS_009_073/, last access: 2 August 2019).             et al., 2006; Saba et al., 2011). Instantaneous production at
Specifically, the dataset used is “dataset-oc-med-chl-multi-    depth z (m) of the water column, time t of the day, and for
l3-chl_1km_daily-rep-v02”, and the variable name used           absorption of irradiance at wavelength λ, P (λ, z, t) is calcu-
is      “mass_concentration_of_chlorophyll_a_in_sea_water       lated as
(Chl)” obtainable in a NetCDF-4 file format. This Chl L3        P (λ, z, t) = E(λ, z, t) chl(z) a ∗ (λ, z)Φ
dataset is derived with an updated version of the regional
algorithm MedOC4 (Mediterranean Ocean-Colour 4 bands            (g C m−3 s−1 ),                                                 (1)
MedOC4; Volpe et al., 2019) for deep pelagic Case-1 waters      where E(λ, z, t) is the spectral scalar irradiance
and the AD4 algorithm (ADriatic 4 band; Berthon and             for wavelength λ, depth z, and time t of the day
Zibordi, 2004; D’Alimonte and Zibordi, 2003) for Case-2         (mol photons m−2 s−1 ); a ∗ (λ, z) is the spectral chlorophyll-
coastal waters (generally shallow and turbid waters).           specific    absorption    coefficient      of    phytoplankton
   Level-2 sea surface temperature (SST, ◦ C) at 1 d and 1 km   (m2 mg chl−1 ); and Φ is the quantum yield of photo-
was obtained from every available orbit from the Moder-         synthesis for carbon fixation (mol C mol per photon; its
ate Resolution Imaging Spectroradiometer (MODIS) aboard         possible spectral changes are ignored). Note that chl, a ∗ , and
the Terra and Aqua satellites. Data were downloaded from        Φ are not made variable with time.
the National Aeronautics and Space Administration (NASA)           The triple integration of (1) with respect to wavelength,
archive website (http://oceancolor.gsfc.nasa.gov/, last ac-     depth, and time gives the daily column-integrated primary
cess: 18 July 2017). Only nighttime orbits were selected to     production, PP:
avoid problems with skin temperature during daylight. Or-
                                                                                   ZD   min(Z
                                                                                           Z p /Zb )Z700
bits with quality flags 0 (best), 1 (good), and 2 (question-
able) in SST were included after checking their validity and    daily PP = 12                           P(λ, z, t) dλ dz dt
accuracy in order to have a more complete dataset. Daily                           0        0     400
(24 h averaged) photosynthetically active radiation (PAR, in             −2
                                                                (g C m        ),                                                (2)
E m−2 ) was obtained as a Level-3 product at 9 km and 1 d
resolution. This is the best available resolution at the NASA   where the factor 12 is the conversion from moles to grams of
archive of MODIS and Medium Resolution Imaging Spec-            carbon, D is the day length or hours of daylight (h), Zp (m)
trometer (MERIS) data (https://oceancolor.gsfc.nasa.gov/l3/,    is the depth where the photosynthetically available radiation
last access: 30 December 2017).                                 (PAR) falls to 0.1 % of its value just below the sea surface
   All satellite-derived variables were remapped onto a reg-    (so approximately 1.5 times the euphotic depth), and Zb is
ular 1 km spatial grid over the study area, by averaging all    the bottom depth taken from the ETOPO1 database (Amante
available pixels within each grid cell. For each parameter,     and Eakins, 2009). The time integration used intervals equal
outliers were removed whenever they exceeded 3 times the        to 1/30 of the day length (about 20 to 30 min depending on
mean ± SD (standard deviation) of the time series. For the      season). The depth integration used intervals equal to 1/50
purpose of this study, coastal areas were defined as the wa-    of Zp and goes down to whichever is shallower between Zp
ters lying between 5 and 200 m depth. Only values at depths     and Zb . The spectral integration is performed over the visible
exceeding 5 m depth were considered in order to reduce          range (400 to 700 nm) with a 5 nm resolution.
the possible influence of seafloor vegetation reflectance in       The spectral irradiance at a given depth z, E(λ, z, t), is
chlorophyll concentration values (chl, mg m−3 ) at shallow      calculated as (starting from just below the sea surface)
waters. The analyzed time series covers the period from Jan-
                                                                E(λ, z, t) = E(λ, z − dz, t)e[−Kd (λ,z)dz] ,                    (3)
uary 2002 to December 2016 for the Mediterranean Sea (30
to 46◦ N and 6◦ W to 37◦ E, Fig. 1).                            where the diffuse attenuation coefficient for downward irra-
                                                                diance, Kd (λ, z) (m−1 ), is computed as a function of chloro-
                                                                phyll following Morel and Maritorena (2001):
                                                                Kd (λ, z) = Kw (λ, z) + χ (λ) chl(z)e(λ) .                      (4)

https://doi.org/10.5194/bg-19-47-2022                                                               Biogeosciences, 19, 47–69, 2022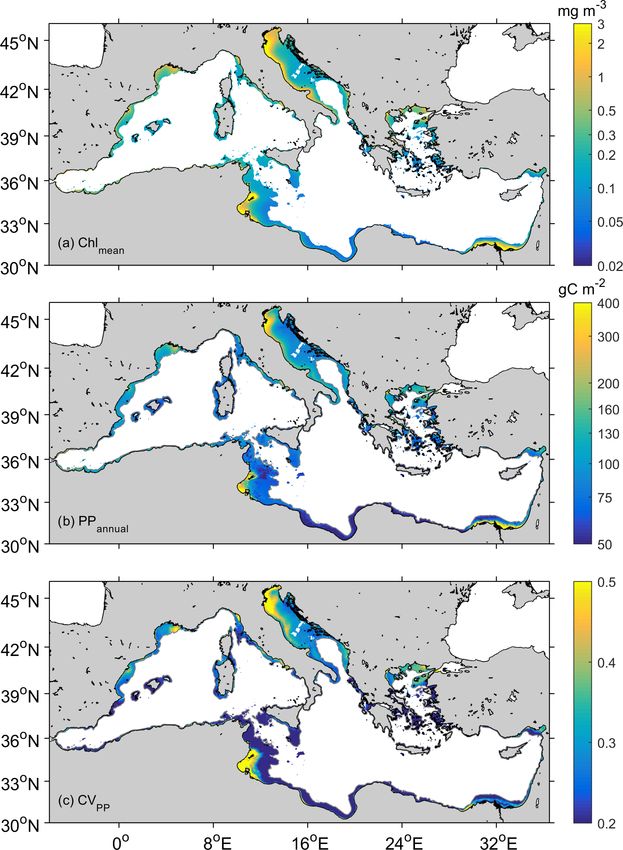
50                             P. M. Salgado-Hernanz et al.: Pelagic primary production in the coastal Mediterranean Sea

Figure 1. Map of the Mediterranean Sea showing the main basins, sea regions, surrounding countries and major rivers. Bathymetric data were
obtained from ETOPO1 (Amante and Eakins, 2009). The black contour indicates the 200 m isobath, the limit of coastal waters as defined in
the present study.

   Details about how values are assigned to the parameters a ∗
and Φ, their dependence on temperature, and other features
of this net primary production (NPP) model are to be found                     (0.5857 − 0.0165T ) PP
                                                                             ef =                     ,                               (5)
in Morel (1991) and Morel et al. (1996).                                            (51.7 + PP)
   Daily PP calculation was performed every 7 d (starting at           PPexp = PPnew = PP × ef ,                                      (6)
day 4), using the averaged chl for a 7 d window from day −3             PPreg = PP − PPnew ,                                          (7)
to day +3 and for one grid point out of three. Therefore, the
PP model was run with 8 d resolution and for one pixel out of          where T is temperature in degrees Celsius (◦ C) and PP is the
three pixels. Later, daily PP data were interpolated to a 1 d by       daily production (mg C m−2 ).
1 km grid. Monthly PP data and their anomalies were derived               As shown in Table 1, we report PP as vertically integrated
from the abovementioned dataset.                                       values (PP, in g C m−2 ), spatially integrated estimates for cer-
   The model was operated both for clear-sky conditions and            tain basins or regions (6PP, in Gt C), or mean volumetric val-
for the actual MODIS PAR values, in which case a reduc-                ues (PPVOL , in g C m−3 ). The coefficient of variation (CV)
tion of the clear-sky irradiance is uniformly applied across           has been estimated for PP as the ratio of the standard devi-
the entire day, as being the ratio of the daily satellite to clear-    ation to the mean. While some authors include the Adriatic
sky PAR values. Chl is assumed to be uniformly distributed             in the eastern basin (e.g., Bosc et al., 2004), we treated this
with depth and equal to the satellite-derived value. This sim-         region separately because its peculiarities (i.e., bathymetry,
plification was considered more appropriate for the generally          influence of rivers, eutrophic character) differentiate it from
shallow and well-mixed waters of coastal areas than the use            the rest of the Mediterranean Sea (Cushman-Roisin et al.,
of global parameterization of the shape of the vertical pro-           2001). Most of the Adriatic Sea has a shallow (< 200 m)
file as a function of the surface chl value (e.g., Morel and           bathymetry, and it collects some 30 % of the freshwater flow-
Berthon, 1989; Uitz et al., 2006), whose validity outside of           ing into the Mediterranean, acting as a dilution basin for the
open ocean waters is not established.                                  nutrients discharged by the Po and other Adriatic rivers and
   From PP estimates, new (PPnew ) and regenerated (PPreg )            becoming one of the most human-impacted regions of the
production were calculated using the ratio of export produc-           Mediterranean Sea (Ludwig et al., 2009; Micheli et al., 2013;
tion (PPexp ) to total production (PP) (i.e., ef-ratio) (Laws et       Raicich et al., 2013a).
al., 2000, 2011). Indeed, assuming a steady state, the export
production must equal the new production fueled by new nu-             2.3    Coastal regionalization
trients brought to the surface layers. The ef-ratio as a func-
tion of satellite-derived temperature and production can be            We used a two-step classification procedure to define coastal
obtained from the empirical relationship obtained by Laws              regions along the Mediterranean based on their temporal PP
et al. (2011):                                                         patterns. First, nine regions (R1 to R9) were identified using
                                                                       a classification technique based on an unsupervised learning
                                                                       neural network (self-organizing maps or SOMs; Kohonen,
                                                                       1982, 2001). Then, 18 alongshore marine ecoregions were

Biogeosciences, 19, 47–69, 2022                                                               https://doi.org/10.5194/bg-19-47-2022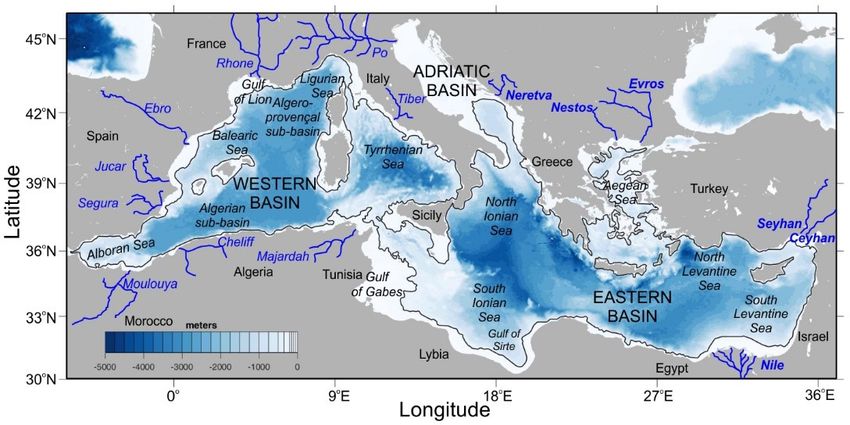
P. M. Salgado-Hernanz et al.: Pelagic primary production in the coastal Mediterranean Sea                                             51

Table 1. Primary production acronyms used in this study, their units, and their definitions.

        Variable     Units           Definition
        P            g C m−3 s−1     Instantaneous production at each depth (z) of the water column
        PP           g C m−2         Daily primary production per surface unit; integration of P over depth and day length
        PPannual     g C m−2         Annual mean production per surface unit
        6PP          Gt C            Total carbon fixation per year within a basin or specific region
        PPVOL        g C m−3         Mean volumetric primary production; column-integrated PP divided by whichever is shallower
                                     of the bottom depth or the productive layer
        PPnew        g C m−2         New production (i.e., from allochthonous sources)
        PPreg        g C m−2         Regenerated production

obtained considering the most relevant cross-shore limits of              2.4   Climate data
the SOM-derived regions (Z1 to Z18).
   SOM is an unsupervised neural network method that re-
duces the high-dimensional feature space of the input data to             To identify possible drivers of long-term PP variability, we
a lower-dimensional network of units called neurons. SOM                  searched for correlations with two climate indices, the North
is especially suited to extract patterns in large datasets of             Atlantic Oscillation (NAO) index and the Mediterranean Os-
satellite data (Ben Mustapha et al., 2014; Charantonis et al.,            cillation Index (MOI). The corresponding data were down-
2015; Farikou et al., 2015). Unlike other classification meth-            loaded from the Climate Research Unit at the University of
ods, like k-means, SOM tends to preserve data topology (i.e.,             East Anglia (https://crudata.uea.ac.uk/cru/data/, last access:
preserves neighboring regions), and, therefore, it is particu-            21 August 2018) in monthly resolution. Climate indices are
larly suited for pattern recognition (Liu and Weisberg, 2005).            defined either as anomalies of a climate variable, using the
It allows adequate classification of areas with high spatial              difference between two geographical points, or as principal
complexity and strong gradients. Similar neurons are mapped               components (Hurrell, 1995).
close together on the network, facilitating the visualization of             NAO is the central mode of climate variability of the
patterns and a topological ordination of the classified areas,            Northern Hemisphere atmosphere. It is based on the pres-
and the relative distance among neurons is obtained as a re-              sure difference between the middle of the North Atlantic
sult of the analysis.                                                     Ocean and Iceland, which affects winter conditions in the
   For typical satellite imagery, SOM can be applied to both              North Hemisphere (Hurrell and Van Loon, 1997; Marshall
space and time domains. Here, we have addressed the analy-                et al., 2001). Positive NAO results in a relatively dry win-
sis in the time domain of the datasets, which allows region-              ter in the Mediterranean but a warmer and wetter winter in
alization of the studied area on the basis of similitudes in              northern Europe, and vice versa. Because of its influence on
the time variation in PP. We chose a map size of (3 × 3),                 precipitation, Mediterranean river inflows are generally anti-
with nine neurons (for further details, see Basterretxea et al.,          correlated with the NAO (Trigo et al., 2006).
2018). We used a hexagonal map lattice in order to have                      MOI is the most widely used teleconnection index for
equidistant neighbors and to avoid introducing anisotropy                 the Mediterranean basin. It reflects differences in tempera-
artifacts. For the algorithm initialization, we opted for lin-            ture, precipitation, circulation, evaporation, and other param-
ear mode, batch training algorithm, and ep, or Epanechnikov               eters between the eastern and western basin. There are differ-
function, type neighborhood function since this parameter                 ent versions depending on the points of reference (Criado-
configuration produces the lower quantitative and topolog-                Aldeanueva and Soto-Navarro, 2013). We used the ver-
ical error and computational cost (Liu et al., 2006). This                sion obtained as the normalized pressure difference between
methodology was applied in Basterretxea et al. (2018) for                 Gibraltar and Israel (Palutikof, 2003). Positive MOI phases
satellite-derived chlorophyll time series. For further details            are associated with increased atmospheric pressure over the
of the methodology used, see Hernández-Carrasco and Or-                   Mediterranean Sea that promotes a shift of the wind trajecto-
fila (2018). These SOM computations were performed us-                    ries toward lower latitudes leading to milder winters (Criado-
ing the MATLAB toolbox of SOM v.2.0 (Vesanto et al.,                      Aldeanueva and Soto-Navarro, 2013). Under these condi-
2000a, b) provided by the Helsinki University of Technol-                 tions, reduced precipitation is observed in the southeastern
ogy (http://www.cis.hut.fi/somtoolbox/, last access: 12 April             Mediterranean region (Törnros, 2013). With some regional
2019).                                                                    differences, NAO and MOI express relatively similar climate
                                                                          patterns over the Mediterranean Sea. They are highly posi-
                                                                          tively correlated in winter and weakly but still significantly
                                                                          correlated in summer (Efthymiadis et al., 2011; Martínez-
                                                                          Asensio et al., 2014).

https://doi.org/10.5194/bg-19-47-2022                                                                 Biogeosciences, 19, 47–69, 2022
52                            P. M. Salgado-Hernanz et al.: Pelagic primary production in the coastal Mediterranean Sea

2.5    Statistical analyses

Linear temporal trends in the PP series were calculated us-
ing Theil–Sen slope adjustment (Sen, 1968) of the residu-
als of the de-seasonalized series. Time series have been de-
seasonalized by removing the 8 d climatological mean for the
original time series. Time series with > 12 % of missing val-
ues were excluded from the analysis, and the analysis was
calculated pixel by pixel. A Mann–Kendall statistics test is
applied to each pixel, and only pixels with a trend statisti-
cally significant at the 95 % level were considered (Salmi et
al., 2002). The use of this non-parametrical test is suitable for
non-normally distributed data and has been previously used
in the trend examination of remote-sensing chl time series
(Colella et al., 2016; Kahru et al., 2011; Salgado-Hernanz et
al., 2019).

3     Results

3.1    Coastal primary production

Annual primary production in coastal waters of the Mediter-
ranean Sea (6PPCoast ) is estimated to be 0.041 ± 0.004 Gt C,
which represents some 12 % of total carbon fixation in the
Mediterranean Sea (see Tables 2 and 3). Approximately,
80 % of this 6PPCoast is sustained by recycling processes,
and, the rest, PPnew , is exported to the seafloor or to nearby
areas. Although average surface chl concentration is 3-fold
                                                                    Figure 2. Mean distribution of (a) chlorophyll (chlmean , in
higher in coastal areas (0.3 mg m−3 ) than in open areas            mg m−3 ), (b) annual PP (PPannual , in g C m−2 ), and (c) coefficient
(0.11 mg m−3 ), the annual carbon fixation per surface area         of variation in PP values (CVPP ).
(PPannual ) over the shelf is, on average, 26 % lower than in the
open ocean (100±91 and 136±40 g C m−2 , respectively; see
Tables 2 and 3). The lower PPannual values on the coast are         coastal regions of the eastern basin like the Gulf of Gabès pri-
due to depth integration quite often being stopped at shallow       mary production is also outstandingly high (> 300 g C m−2 ).
depths, i.e., Zb < Zp .                                             Along the western North African coast, PPannual also displays
   Figure 2 reveals the differences in PPannual between the         values > 150 g C m−2 ; however, since the shelf is narrow, its
more productive shelf waters in the western basin and those         contribution to 6PPCoast is marginal (Figs. 1 and 2). The an-
in the eastern basin (90±39 and 73±86 g C m−2 , p < 0.001).         nual volumetric productivity follows a similar pattern than
The Adriatic shelf is by far the most productive, particu-          the annual integrated production, with most values varying
larly if mean values are considered (124 ± 76 g C m−2 , Ta-         between 1–3 g C m−3 but reaching up to > 10 g C m−3 in the
ble 2). Annual carbon fixation is 97 % higher in the east-          most productive coastal regions of the Adriatic Sea and the
ern (6PPeast = 0.021 ± 0.002 Gt C) than in the western shelf        Gulf of Gabès (Fig. 3a).
(6PPwest = 0.011±0.001 Gt C), which is due to greater east-
ern surface area (about twice the western surface area; Ta-         3.2   Long-term variability and trends
ble 2). PPannual varies spatially from 90 to 250 g C m−2 in
the western shelf and from 50 to 400 g C m−2 in the east-           As shown in Fig. 4, variability in annual PP is dominated
ern basin. Contrastingly, PPannual exceeds 100 g C m−2 in the       by short-scale variations (i.e., sub-decadal). The interan-
Adriatic basin, reaching values above 400 g C m−2 on the            nual variability is indicated by the low-frequency signal of
northwestern Adriatic coast (Fig. 2b). The most productive          the monthly mean anomalies. The filtered low-frequency
coastal regions (> 150 g C m−2 ) are located in regions en-         signal to the anomalies of 6PP and chl has been calcu-
riched by major river outflows. Indeed, the highest values          lated using the MATLAB smooth function and applying the
of the coefficient of variation in primary production (CVPP )       sgolay filter, which uses the Savitzky–Golay method, with
are observed at the mouth of the Nile, Ebro, Rhône, Tiber,          a polynomial span degree of 17. This degree was there-
Po, Neretva, or Nestos–Evros rivers. Nevertheless, in some          fore filtering about 8 months before and after every time

Biogeosciences, 19, 47–69, 2022                                                            https://doi.org/10.5194/bg-19-47-2022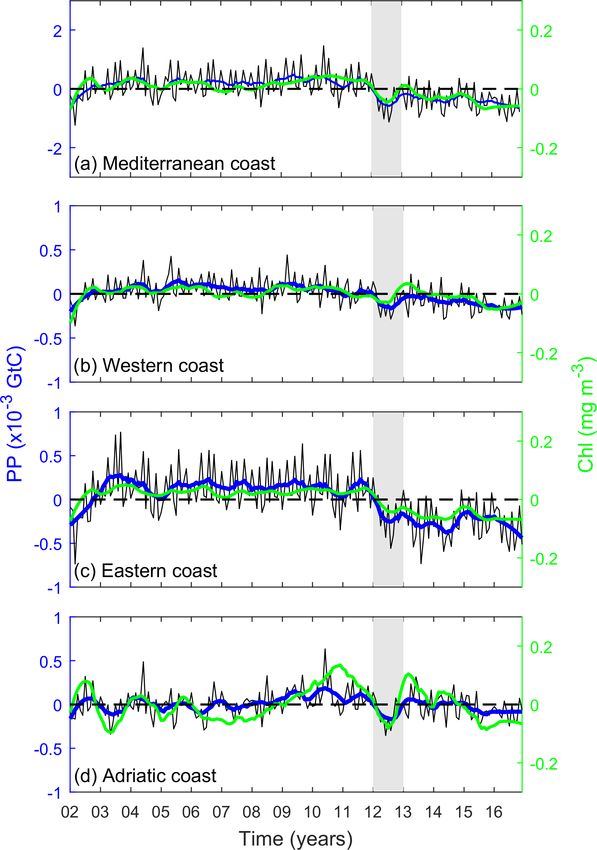
P. M. Salgado-Hernanz et al.: Pelagic primary production in the coastal Mediterranean Sea                                                                                  53

Table 2. Surface area and the corresponding basin percentage to surface area, (chl) ± standard deviation (SD), 6PP, the corresponding
basin percentage to 6PPCoast (% 6PPCoast ), PPannual median ± SD (PPannual mean), and PPVOL median ± SD (PPVOL mean) for the
Mediterranean Sea, open ocean waters, and coastal waters during the period 2002–2016. For 6PP and PPannual , Mediterranean Sea values
were obtained summing open ocean water values and coastal water values.

                                      Surface area                      Chl                   6PP             % of             PPannual                     PPVOL
                                  (103 km2 )       (%)          (mg m−3 )                   (Gt C)      6PPCoast              (g C m−2 )                 (g C m−3 )
      Mediterranean Sea                  2504               0.19 ± 0.78a         0.349 ± 0.118c                             140 ± 40b
      Open ocean waters                  1975               0.11 ± 0.18a          0.308 ± 0.118                             136 ± 40b
      Coastal waters                      529      100       0.30 ± 0.17          0.041 ± 0.004                 100      83 ± 75 (100)        1.16 ± 9.60 (2.93)
           Western coast                  141       27       0.21 ± 0.14          0.011 ± 0.001                  25       90 ± 39 (98)        1.23 ± 2.61 (1.59)
           Eastern coast                  287       54       0.30 ± 0.16          0.021 ± 0.002                  51       73 ± 86 (93)        1.01 ± 11.8 (3.34)
           Adriatic coast                 101       19       0.39 ± 0.23          0.010 ± 0.001                  24      99 ± 76 (124)        1.50 ± 7.23 (3.27)
    a Mean surface chl values obtained by averaging the 8 d and 4 km resolution of surface satellite chl values obtained from CMEMS (Salgado-Hernanz et al., 2019). b PP
    estimated by averaging published satellite data shown in Table 3. c 6 PP estimated adding coastal water data from this study to open ocean water data obtained from
    Table 3.

                                                                                         three basins (0.037 for the whole basin, 0.010 for the west-
                                                                                         ern basin, 0.019 for the eastern basin, and 0.009 Gt C yr−1
                                                                                         for the Adriatic basin). This negative anomaly marked the
                                                                                         beginning of a less productive period, particularly noticeable
                                                                                         in the eastern basin (Figs. 4, A1 and A2). PPannual (g C m−2 )
                                                                                         and 6PP (Gt C) in every year are shown in Figs. A1 and A2.
                                                                                            As revealed by Fig. 5a, some regionally coherent patches
                                                                                         of significant trend in PP are observed along the coast.
                                                                                         Most of these regions presented declining PP trends, partic-
                                                                                         ularly along the North African coast where SST is increas-
                                                                                         ing at a higher rate (Fig. 5b). Typical PP trend magnitudes
                                                                                         observed along the Spanish Mediterranean and the North
                                                                                         African coast from the Gulf of Gabès range from −0.05 to
                                                                                         +0.05 g C m−2 per decade. Some positive PP trends, exceed-
                                                                                         ing +0.1 g C m−2 per decade, can be determined in some
                                                                                         coastal regions north of the Adriatic Sea.
                                                                                            A significant negative correlation was observed between
                                                                                         monthly coastal anomalies of 6PP and SST at the whole
                                                                                         Mediterranean basin scale (r = −0.66, p < 0.001; Fig. 6a,
                                                                                         Table A1), revealing a decrease in phytoplankton biomass as
Figure 3. Mean distribution of (a) volumetric PP (PPVOL , in                             the sea warms up. In addition, we observed evidence of an
g C m−3 ) and (b) coefficient of variation in volumetric PP values
                                                                                         inverse relationship between PP variability and the phase of
(CVPP ).
                                                                                         the climate indices NAO and MOI (r = −0.46, p < 0.001,
                                                                                         and r = −0.24, p < 0.001, respectively; Fig. 6b and c, Ta-
                                                                                         ble A1). A similar relationship is observed between monthly
step (about 1.5 years), then showing interannual variability.                            coastal chl anomalies with SST (r = −0.64, p < 0.001) and
6PPCoastal exhibits moderate interannual variability (up to                              climate indices NAO and MOI (r = −0.60, p < 0.001, and
25 %) whereas basin-scale interannual variations range from                              r = −0.35, p < 0.001, respectively; see Appendix Fig. A3)
26 % in the Adriatic basin up to 28 % in the western basin and                           at the whole Mediterranean basin scale.
29 % in the eastern basin. This value of interannual variabil-                              Additionally, the response of PP to climate variations var-
ity was calculated subtracting the year with the minimum an-                             ied seasonally. Indeed, NAO influenced coastal PP in sum-
nual PP from the year with the maximum annual PP and then                                mer, both in the western and in the eastern basin (r = 0.25,
dividing this value by the mean annual PP. Positive anoma-                               p = 0.06; r = 0.22, p = 0.08, respectively) and MOI vari-
lies in 6PPCoastal extended between 2004 and 2011 (mean                                  ations were better correlated with PP global variations in
6PPCoastal = 0.044±0.001 Gt C yr−1 for the whole basin be-                               spring (r = 0.28, p = 0.04), showing a higher impact in the
tween those years, Fig. 4a and Appendix Fig. A1a). Con-                                  Adriatic basin (r = 0.37, p = 0.02). No significant correla-
versely, the year 2012 was particularly unproductive in all                              tion was found during the winter or fall season for any index

https://doi.org/10.5194/bg-19-47-2022                                                                                          Biogeosciences, 19, 47–69, 2022
54 P. M. Salgado-Hernanz et al.: Pelagic primary production in the coastal Mediterranean Sea
Table 3. Compilation of published values of PPannual and 6PP for the different Mediterranean basins.
Region Period PPannual 6PP Method Reference
(years) (g C m−2 ) (Gt C)
Whole – 80–90 In situ (14 C method) Sournia (1973)
Mediterranean 1981 94 ± 60–117.5 ± 75a Satellite (CZCS) Morel and André (1991)
estimation 1979–1983 125–156a 0.308–0.385a Satellite (CZCS) Antoine and André (1995)
1997–1998 190 Satellite (SeaWiFS) Bricaud et al. (2002)
1998–2001 79.1–88.4 Satellite (SeaWiFS) Colella et al. (2003)
1998–2001 130–140 Satellite (SeaWiFS) Bosc et al. (2004)
1998–2007 0.5 Satellite (SeaWiFS) Uitz et al. (2010)
1998–2013 116 Satellite (five sensors) O’Reilly and Sherman (2016)
Western 1980–1985 120 In situ (Oxygen) Bethoux (1989)
basin 1981 157.7 Satellite (CZCS) Morel and André (1991)
1979–1983 157–197a Satellite (CZCS) Antoine and André (1995)
1996 140–150 In situ (14 C data) Conan et al. (1998)
1997–1998 198 Satellite (SeaWiFS) Bricaud et al. (2002)
1991–1999 83–235 In situ (14 C method) Marty et al. (2002)
1996 175 In situ (14 C method) Moutin and Raimbault (2002)
1997–1998 123 In situ (14 C method) Van Wambeke et al. (2004)
1997–1998 152 In situ (14 C method) Lefèvre unpubl. (2001)∗
1998–2001 93.8–98.8 Satellite (SeaWiFS) Colella et al. (2003)
1998–2001 163 ± 7 Satellite (SeaWiFS) Bosc et al. (2004)
2006–2007 858c,d In situ (dark–light method) Regaudie-De-Gioux et al. (2009)
Eastern 1980–1985 137–150b In situ (Phosphorous) Béthoux et al. (1998)
basin 1981 109.4 Satellite (CZCS) Morel and André (1991)
(including 1979–1983 110–137a Satellite (CZCS) Antoine and André (1995)
Adriatic) 1997–1998 183 Satellite (SeaWiFS) Bricaud et al. (2002)
1996 96 In situ (14 C data) Moutin and Raimbault (2002)
1998–2001 69.1–81.5 Satellite (SeaWiFS) Colella et al. (2003)
1998–2001 121 ± 5 Satellite (SeaWiFS) Bosc et al. (2004)
2006–2007 521c,d In situ (dark–light method) Regaudie-De-Gioux et al. (2009)
Adriatic 1978–1983 241–301a 0.0235 Satellite (CZCS) Antoine and André (1995)
basin 1998–2001 92.4–104.4 Satellite (SeaWiFS) Colella et al., (2003)
a The estimates from Antoine et al. (1995) and Morel and André (1991) have been corrected by a factor of 1.25 as recommended by Morel et al. (1996). b From Colella
et al. (2003), who estimated it using f -ratios (the ratio between new and total PP) obtained from Boldrin et al. (2002). c Daily PP (mg C m−2 d−1 ) converted to annual
PP (mg C m−2 yr−1 ) multiplied by 365. d Conversion to carbon unit using photosynthetic quotient P Q = 1. ∗ Data included in the Data Published for Earth and
Environmental Science PANGAEA data collection.
(see Table A1 in Appendix). Correlation analyses were per- ality (PPannual = 44 ± 17 and 69 ± 22 g C m−2 , respectively;
formed using the Pearson product moment correlation. Dif- Table 4) typically occurring in the southern and eastern
ferences between means were tested using the Kolmogorov– Mediterranean (12 % and 29 % of the total surface area).
Smirnov test (Massey et al., 1951). They are representative of the productivity patterns in vast
shelf regions in the Gulf of Gabès and Sirte and in the cen-
3.3 Coastal regionalization tral Aegean (Z17, Z16, Z14 and Z11). R3 and R4 corre-
spond to higher production and a wider range of variation
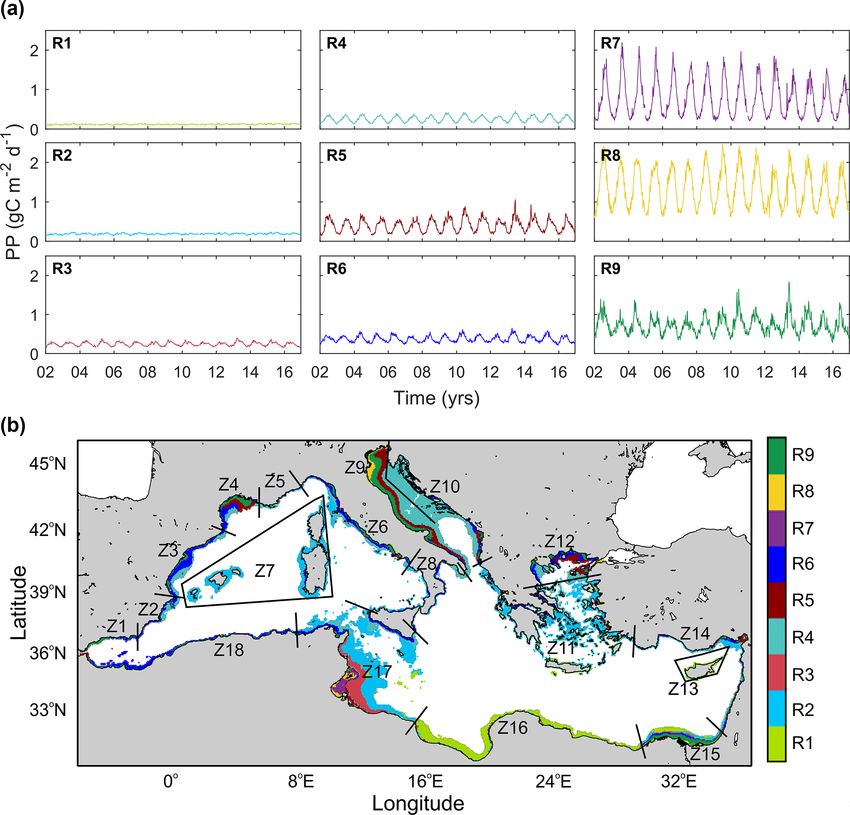
The nine characteristic temporal PP patterns, their corre- (PPannual = 90±32 and 98±39 g C m−2 ; Table 4 and Fig. 7).
sponding spatial distribution obtained from the SOM anal- While R3 (18.6 % of total coastal surface) is frequent in shelf
ysis, and the 18 zones in which the coastal region was classi- regions of the western basin (Z2, Z3, Z5, and Z7), R4 extends
fied are shown in Fig. 7. Generally, wider shelves present over the deepest areas of the Adriatic Sea (Z9 and Z10). Both
higher spatial complexity manifested as a larger number patterns are representative of variations observed in 36.9 %
of SOM patterns. About 78 % of the shelf waters include of the coastal waters.
R1, R2, R3, and R4 patterns. In particular, R1 and R2 As shown in Table 4, areas of low production with sea-
characterize areas of low production, with scarce season- sonal patterns R1 to R4 contribute to more than 62 % of
Biogeosciences, 19, 47–69, 2022 https://doi.org/10.5194/bg-19-47-2022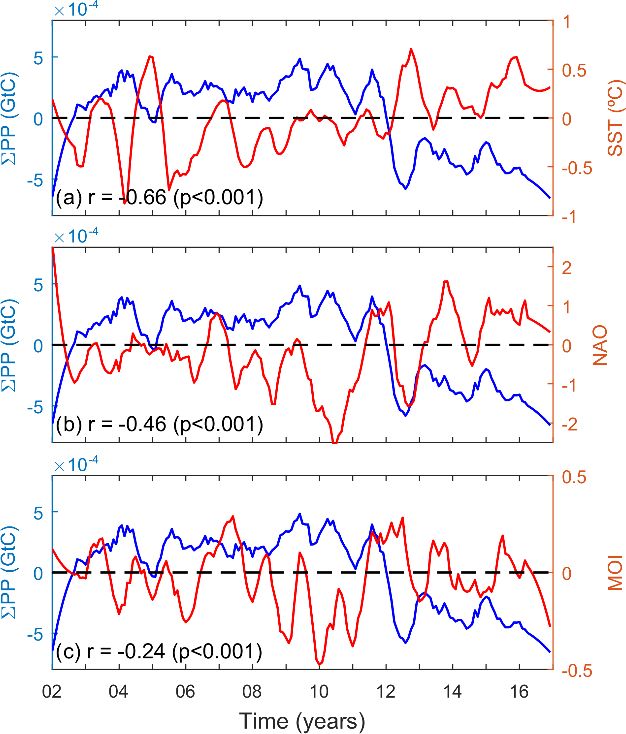
P. M. Salgado-Hernanz et al.: Pelagic primary production in the coastal Mediterranean Sea                                              55

                                                                       Figure 5. Trends in primary production and sea surface tempera-
                                                                       ture. Values correspond to the change per decade. (a) Theil–Sen
                                                                       trend in pelagic primary production (PP trend) estimated from daily
                                                                       values for the 2002–2016 period. (b) Trend in sea surface tempera-
                                                                       ture (SST trend). Only significant trends (p < 0.05) are shown.

Figure 4. PP variability and trends for coastal waters in (a) the
whole Mediterranean Sea, (b) western basin, (c) eastern basin, and
(d) Adriatic coast. Black solid lines indicate the original monthly
6PPCoastal anomalies, and the filtered low-frequency signal is over-
laid in blue (16-month width sgolay filter). Green solid lines indi-
cate the filtered low-frequency signal for chl anomalies (mg m−3 ).
The red line indicates the PP trend during the analyzed period
(2002–2016), and the gray band indicates the year 2012.

total pelagic carbon fixation in Mediterranean coastal ar-
eas. In contrast, systems of higher production (PPannual >
280 g C m−2 d−1 ) barely contribute to 17 % of total produc-
tion. These regions of enhanced production are generally
constrained to regions of freshwater influence (ROFIs; Simp-
son, 1997) where terrestrial nutrients fuel coastal produc-
tion. Indeed, R8 is almost exclusively restricted to the river
mouths, and it presents elevated PPannual values (1.29 ±
0.50 g C m−2 d−1 ) and a wide range of variation of 0.67 to
2.14 g C m−2 d−1 . An exception is the R7 pattern, which is
exclusively located in the shallowest inner shelf of the Gulf          Figure 6. Relationship between coastal pelagic primary production
of Gabès, and it is bounded by R5, a transition region be-             (6PP anomalies, blue lines) and (a) SST anomalies, (b) NAO index,
tween the inner and outer shelf. Unlike the other regions,             and (c) MOI index (red lines).
where PP peaks in late winter–spring, maximum PP in R7
occurs in fall. Finally, R5 and R6 patterns correspond to
transition regions accounting for 20.4 % of the total pro-

https://doi.org/10.5194/bg-19-47-2022                                                                Biogeosciences, 19, 47–69, 2022
56 P. M. Salgado-Hernanz et al.: Pelagic primary production in the coastal Mediterranean Sea
Figure 7. Regionalization of the coastal waters in the Mediterranean Sea based on their temporal patterns of pelagic primary production.
(a) Characteristic temporal patterns of PP obtained from SOM classification (R1 to R9) and (b) coastal regions defined from alongshore
variations in the SOM – regions (Z1 to Z18).
Table 4. Extension and primary production for each of the SOM- The SOM-based regionalization reveals two groups of
defined regions (R1 and R9). Mean annual PP is estimated by aver- coastal waters: those with low cross-shore variability and in-
aging mean daily PP and then multiplying it by the number of days cluding only one or two SOM regions (i.e., Z1, Z13, Z16,
of the year, i.e., 365. and Z18) and those with strong cross-shore gradients includ-
ing several SOM regions (i.e., Z4, Z9, Z12, Z15). The first
Area PPannual 6PP pattern is typically observed in narrow continental shelf ar-
(km2 ) (%) (g C m−2 ) (10−3 Gt C) (%) eas with low influence of river inputs whereas the second
group is found in regions with a wider continental shelf such
R1 61 052 12.2 44 ± 17 1.98 ± 0.24 4.8
as ROFIs (the Rhône delta, the north and western coastline
R2 149 766 29.0 69 ± 22 8.89 ± 0.66 21.5
of the Adriatic Sea, and the Nile Delta) and in the Gulf of
R3 94 562 18.6 90 ± 32 7.31 ± 0.54 17.6
R4 93 103 18.3 98 ± 39 7.81 ± 0.45 18.8 Gabès. The western Adriatic (Z9) and the Gulf of Gabès
R5 22 566 5.0 154 ± 102 2.95 ± 0.27 7.1 (Z17) are the largest contributors to 6PPCoast , together con-
R6 47 977 9.8 140 ± 70 5.50 ± 0.58 13.3 tributing 35.9 % of shelf production in the Mediterranean
R7 5816 1.8 288 ± 217 1.41 ± 0.24 3.4 Sea, but, in the case of Z17, it is mainly due to its large ex-
R8 7822 2.2 508 ± 283 2.67 ± 0.67 6.5 tension (Table 5). PP is also high in the northern Alboran Sea
R9 13 181 3.2 281 ± 175 2.95 ± 0.38 7.1 (Z1), Nile delta (Z15), the western Adriatic (Z9), and Gulf of
Lion (Z4; Table 5). With the exception of Z1, influenced by
the entrance of waters from the Atlantic Ocean and by lo-
duction and 14.8 % of the Mediterranean coast. While R5 cal coastal upwelling, these zones receive important riverine
mainly occurs in deltas, R6 is characteristic of the west- fluxes (Q).
ern Mediterranean shelf, including the North African coast
(0.36–0.08 g C m−2 d−1 ; Fig. 7).
Biogeosciences, 19, 47–69, 2022 https://doi.org/10.5194/bg-19-47-2022P. M. Salgado-Hernanz et al.: Pelagic primary production in the coastal Mediterranean Sea 57
4 Discussion the Nile, and the northern Aegean Sea may explain greater
coastal PP in the eastern basin than in the western basin. Ad-
4.1 Coastal primary production ditionally, due to the lack of large shallow and productive ar-
eas in the western basin, we observed few volumetric PP val-
In this study we focused on the contribution of coastal waters ues above 30 g C m−3 in the western Mediterranean whereas
to the overall pelagic PP in the Mediterranean Sea. While the high volumetric PP is more frequent in the Adriatic Sea and
mean coastal values for the Mediterranean (100±91 g C m−2 ) in the eastern Mediterranean, in shallow waters of the Gulf
are somewhat lower than the mean values over the continen- of Gabès, and in the Nile delta. Furthermore, carbon fixation
tal shelves of the world ocean (160 ± 40 g C m−2 ; Smith and from the Adriatic Sea represents 24 % of total coastal pro-
Hollibaugh, 1993), the impact of coastal pelagic PP on to- duction, which is significant considering the area of this sea
tal basin production (12 %) is in the high range of the es- (19 % of Mediterranean coastal waters). The relevance of the
timations for other seas (Muller-Karger et al., 2005). This contribution of the Adriatic Sea in overall coastal PP lies in
estimation is subject to the uncertainties inherent to using two main characteristics: (1) coastal waters (< 200 m) con-
satellite ocean color, which is limited to the upper ocean stitute a large part of the Adriatic Sea, and (2) about one-third
(down to 20 m at best in clear waters) and has poor per- of the river discharge in the Mediterranean is concentrated in
formance in some areas (i.e., Case-2 waters). It neverthe- the Adriatic Sea (see Table 5). Indeed, patterns in the north-
less provides an assessment of net rates of carbon fixation ern Adriatic Sea reflect a variation in the drivers of PP with
in coastal areas that is consistent with global estimations of respect to other regions. For example, while internal pro-
the contribution of coastal areas to oceanic production (Gat- cesses (i.e., vertical diffusion and mixing) and atmospheric
tuso et al., 1998; Ducklow and McCallister, 2004; Muller- deposition drive PP in most coastal waters, production in the
Karger et al., 2005). Bias in coastal chl estimations is mainly north Adriatic is mainly driven by fluvial sources of carbon
due to the presence of non-phytoplankton components such and regeneration through bacterial pathways (Powley et al.,
as colored dissolved organic matter (CDOM) or other ter- 2016; Rodellas et al., 2015; Umani et al., 2007). Moreover,
restrial substances (Morel et al., 2006). These compounds distinctive dynamics in this sea is driven by the influence of
originate from coastal erosion, resuspension in shallow areas, river outflows on stratification and general circulation pat-
river inputs, or anthropogenic effluents. Likewise, they af- terns (Djakovac et al., 2012; Giani et al., 2012).
fect the propagation of photosynthetic radiation through the Regionally, the Alboran Sea, the Gulf of Lion, the Adri-
water column (Morel, 1991). However, the possible uncer- atic Sea, the Aegean Sea, the Nile delta, and particularly the
tainties and biases caused by chl estimation through satellite Gulf of Gabès (up to 23 % of total coastal production) are
data might very weakly alter our estimation of coastal PP. In- the most productive zones. While some of these productive
deed, previous studies agreed that Case-1 waters are largely (i.e., PPVOL > 3 g C m−3 ) coastal regions are located in ar-
predominant in the coastal Mediterranean regions whereas eas affected by river outflows, this type of production rapidly
Case-2 waters are reduced to less than 5 % of the whole decreases in the offshore direction (see Fig. 3). Exceptions
basin (Antoine and André, 1995; Bosc et al., 2004; Bricaud are the Rhône and the Po and less so the Nile, the influence
et al., 2002). This constitutes some 23 % of the coastal wa- of which extends far along the shelf. Other processes like
ters with prevalence in the north Adriatic Sea, Gulf of Gabès, mesoscale circulation are also important in some of these
and around the Nile delta. In particular, they are confined to regions (i.e., Gulf of Lion), as demonstrated by Macias et
the north Adriatic Sea, Gulf of Gabès, and around the Nile al. (2017). Additionally, the exchanges with the more pro-
delta where our PP estimations may present larger uncertain- ductive Atlantic and Black Sea waters in Alboran and in the
ties (Antoine and André, 1995). However, PPannual values off northern Aegean and local enrichment processes in the Gulf
the Nile River delta, > 100 g C m−2 estimated here, are only of Gabès are major contributors to coastal productivity. In-
slightly higher than those reported by Antoine et al. (1995) deed, the Gulf of Gabès constitutes an anomaly in the east-
(80–100 g C m−2 ). The highest values have been reported for ern Mediterranean basin. Its shallowness (< 50 m depth at
this region (> 300 g C m−2 ), but, as shown in Fig. 2, they are 110 km off the coast), unique tidal range (maximum > 2 m)
restricted to a narrow coastal band. In the case of the Adri- promoting vertical mixing, and the lack of summer nutrient
atic Sea, Umani (1996) reported values of PP from 50 to exhaustion undoubtedly contribute to its high productivity
200 g C m−2 yr−1 , while Zoppini et al. (1995) estimated PP (Béjaoui et al., 2019).
rates from 210 to 260 g C m−2 yr−1 in the northern coastal ar- Notwithstanding the importance of land inputs in the pro-
eas. Our estimations range between 100 and > 350 g C m−2 duction of coastal Mediterranean waters, from ef-ratios, we
(with mean values of 123 ± 106 g C m−2 ). estimated that on average only 22 % ± 20 % of the produc-
Contrary to what we would have expected, we observed tion is new, and the rest is sustained via regenerated sources
that the eastern basin contributes more than the western basin (Fig. 8a–c). This PPnew value (Fig. 8b) is comparable to the
to overall coastal production (51 % and 25 %, respectively; mean organic carbon that sinks to the sea floor (28 %) esti-
Table 2). Its great extension (twice higher than the western mated from Muller-Karger et al. (2005) and Pace et al. (1987)
basin) and the increased productivity in regions like Gabès, but higher than PPnew estimations provided by Vidussi et al.
https://doi.org/10.5194/bg-19-47-2022 Biogeosciences, 19, 47–69, 202258 P. M. Salgado-Hernanz et al.: Pelagic primary production in the coastal Mediterranean Sea
Table 5. Surface, river discharge flow (Q), annual mean PP (PPannual ), annual integrated PP (6PP), and its contribution with respect to the
total coastal Mediterranean Sea PP for each of the 18 alongshore zones characterized in the Mediterranean Sea. Mean and standard deviation
(SD) are calculated from 15-year averages (2002–2016). River discharge flow was extracted from Tockner et al. (2008).
Area Q PPannual 6PP
(km2 ) (%) (km3 yr−1 ) (g C m−2 ) (10−3 Gt C) (%)
Z1 1869 0.4 0.5 215 ± 124 0.22 ± 0.05 0.4
Z2 7226 1.4 1.2 107 ± 58 0.62 ± 0.08 1.4
Z3 18 870 3.6 21.4 104 ± 47 1.71 ± 0.16 3.6
Z4 15 196 2.9 57.7 128 ± 72 1.61 ± 0.12 2.9
Z5 878 0.2 1.9 84 ± 33 0.04 ± 0.02 0.2
Z6 20 392 3.9 14.6 101 ± 64 1.62 ± 0.20 3.9
Z7 29 666 5.7 0.5 74 ± 26 1.66 ± 0.20 5.7
Z8 8178 1.6 3.7 81 ± 34 0.40 ± 0.09 1.6
Z9 64 780 12.4 70.5 140 ± 124 7.63 ± 0.66 12.4
Z10 40 997 7.8 35.8 89 ± 37 2.81 ± 0.25 7.8
Z11 58 252 11.1 21.5 81 ± 59 2.95 ± 0.67 11.1
Z12 25 720 4.9 21.2 123 ± 76 2.25 ± 0.33 4.9
Z13 30,71 0.6 0 53 ± 18 0.09 ± 0.02 0.6
Z14 16 814 3.2 21.3 97 ± 61 1.21 ± 0.14 3.2
Z15 28 544 5.5 17 170 ± 182 4.02 ± 0.50 5.5
Z16 46 065 8.8 0 48 ± 17 1.85 ± 0.12 8.8
Z17 123 071 23.5 1.1 90 ± 87 9.72 ± 0.80 23.5
Z18 13 411 2.6 6.1 125 ± 56 1.24 ± 0.18 2.6
(2001) for oceanic waters in the eastern basin (15 % of to- Barale et al. (2008), using chl anomalies derived from
tal production). Contrarily to Vidussi et al. (2001), who esti- SeaWiFS data, observed a general decrease in chl biomass
mated PPnew in the eastern basin, the coastal PPnew average in the Mediterranean Sea over the period 1998–2003. How-
here includes both eastern and western basins of the Mediter- ever, some coastal areas in their study displayed the opposite
ranean, but also the highly productive areas in the northern tendency. Macias et al. (2015) anticipated no future global
Adriatic. This could explain why the PPnew observed here changes of integrated PP in the Mediterranean Sea from
is higher than the one observed for oceanic waters in the modeling results. They predicted a tendency to oligotroph-
eastern basins. Additionally, high ef-ratios (> 0.3) are ob- ication in the western basin and increase in the productivity
served in our case in the areas where nutrient inputs from of the eastern basin. Our study reveals that 6PPCoastal in the
the Atlantic and river effluents significantly enhance PPnew Mediterranean Sea varies nonlinearly, and a reduction of car-
(Fig. 8a). Furthermore, ef-ratios present significant season- bon fixation rates has been observed since 2012 (Fig. 4a).
ality, varying between 0.26 ± 0.04 in the most productive Overall negative coastal PP trends are reported here in both
winter–spring season and 0.15 ± 0.02 in summer, when the the western and in the eastern basin (−10.70 and −25.39 TC
water column is strongly stratified and the food web shifts to per decade; Fig. 4b and c). A spatial analysis of the long-
a more recycling-dominated system. term decadal variability reveals weak but spatially coherent
and significant tendencies (p < 0.05; Fig. 5). In particular,
4.2 Long-term variability and trends PP declines along the coasts of Spain and Africa. Conversely,
trends in some areas of the Adriatic Sea are markedly posi-
tive (> 0.1 g C m−2 per decade), mainly in the proximity of
Available satellite ocean color data span about 20 years, so
the Po River. While negative tendencies seem to fit with the
that temporal trends derived from their analysis highly de-
assumed model of PP limitation associated with increasing
pend on decadal variability (Henson et al., 2010). Despite
temperatures, the origin of the positive trend in the Adriatic
these limitations, satellite observations of ocean color over
basin is more uncertain. A plausible explanation is the vari-
the past 2 decades suggest a relationship between warm-
ation in the flux and loads of the northern Adriatic rivers.
ing and reduced productivity in permanently stratified areas
For example, Giani et al. (2012) observed an increase in
(Behrenfeld et al., 2006). Since clear tendencies of warm-
the Po River flow with increasing phosphate and dissolved
ing are observed in the Mediterranean Sea (Nykjaer, 2009;
nitrogen concentrations in the Po delta and its surrounding
Pastor et al., 2018), intensification of stratification would de-
shelf waters. Alternatively, the Bimodal Oscillating System
crease nutrient supply to phytoplankton and, thus, decrease
(BiOS), i.e., the feedback mechanism between the Adriatic
PP (Behrenfeld et al., 2006; Stambler, 2014).
Biogeosciences, 19, 47–69, 2022 https://doi.org/10.5194/bg-19-47-2022P. M. Salgado-Hernanz et al.: Pelagic primary production in the coastal Mediterranean Sea 59
2012. From our analysis, we infer that this climate-related
event had a strong influence on the global coastal PP of the
Mediterranean Sea.
Several studies have reported influence of climate varia-
tions on the coast (Belgrano et al., 2008; Cloern et al., 2007;
Tiselius et al., 2016). In agreement, we observed an influence
of climate-scale variability on coastal productivity as sug-
gested by the inverse correlations between 6PP and SST and,
more loosely, by NAO and MOI (Fig. 6). While these correla-
tions emphasize the pre-eminent role of climate variability in
the regulation of interannual to decadal-scale coastal produc-
tivity, the pathways through which this control of the atmo-
sphere over coastal productivity is exerted are complex and
may regionally differ (Grbec et al., 2009). Climate can influ-
ence phytoplankton growth by the direct effect of tempera-
ture on algal metabolism, by changes in basin-scale circula-
tion (including exchanges with adjacent seas), by regulating
nutrient supply through variations in the thermocline inten-
sity, by changes in wind patterns affecting mixing and dust
deposition pathways, or through changes in precipitation that
have direct influence on wet deposition and on river runoff.
These effects are modulated by changes in the biota and
in the interaction between organisms (e.g., Molinero et al.,
2005). The relative importance of climate-driven processes
relative to other productivity-enhancing processes depends
on regional characteristics and may be seasonally varying.
For example, variations in dust deposition, which may sus-
tain up to 50 % of new production in the Levantine basin
(Kress and Herut, 2001; Herut et al., 2002), are expected
Figure 8. (a) ef-ratio in coastal waters (< 200 m) of the Mediter- to be more important on the eastern and southern Mediter-
ranean Sea and estimated values of (b) new (PPnew ) and (c) regen- ranean coasts because of their proximity to the Saharan dust
erated production (PPreg ). Mean values for the period 2002–2016.
sources. Likewise, variations in cooling and vertical mixing
are expected to be more effective during late winter when
PP peaks and when diatoms dominate in the Mediterranean
and Ionian (Civitarese et al., 2010) peaking between 2004 Sea (Lacroix and Nival, 1998; Marty, 2002; Marty and Chi-
and 2006, could have affected mass and nutrient exchanges avérini, 2010).
between the Adriatic and the north Ionian Sea (Font et al., Our results reveal that, in contrast to other regions like the
2007; Schroeder et al., 2008; Šolić et al., 2008; Viličić et al., North Sea (Capuzzo et al., 2018) or the Arctic Ocean (Gregg
2012). et al., 2003), the coastal Mediterranean Sea did not globally
Long-term decadal variations in the eastern and western display a marked decline in PP during the last decades. We
basins are mostly coupled, suggesting that they share the suggest that in some coastal areas, a decrease in vertical nu-
same PP drivers at this basin scale (Fig. 4b and c). A ma- trient supply though the thermocline may be compensated
jor feature in the interannual pattern is a global decrease in for by other nutrient sources. Variations in atmospheric de-
production in 2012 that is extended to the following years position, groundwater and river outflows, and the influence
in the eastern basin. Durrieu de Madron et al. (2013) re- of human activities through changes in landscape use and
ported peculiar atmospheric conditions in the Mediterranean domestic wastewater management are important sources of
Sea during 2012 that triggered a massive formation of dense nutrients in the ecosystem and thus act as major drivers of
water on the continental shelf and in the deep basin of the PP in these waters (e.g., Paerl et al., 1999; Powley et al.,
Gulf of Lion. A similar anomaly was described in the Adri- 2016). As a consequence of human activities, both terrestrial
atic shelf where unprecedented dense water generation was and coastal ecosystems have experienced progressive nutri-
preconditioned by a dry and warm year, resulting in a signifi- ent enrichment (Conley et al., 2009; Deegan et al., 2012).
cant reduction of coastal freshwaters and basin-wide salinity However, while this effect is evidenced in shallow nearshore
increase (Mihanović et al., 2013; Raicich et al., 2013b). Ad- waters, its influence in the ocean is estimated to be minimal
ditionally, Pastor et al. (2018) observed an anomalous tem- (Wang et al., 2018). In the Mediterranean Sea, high coast
perature increase in the Mediterranean Sea during summer population growth rates and concomitant food demand have
https://doi.org/10.5194/bg-19-47-2022 Biogeosciences, 19, 47–69, 2022You can also read