Total OH reactivity over the Amazon rainforest: variability with temperature, wind, rain, altitude, time of day, season, and an overall budget ...
←
→
Page content transcription
If your browser does not render page correctly, please read the page content below
Atmos. Chem. Phys., 21, 6231–6256, 2021
https://doi.org/10.5194/acp-21-6231-2021
© Author(s) 2021. This work is distributed under
the Creative Commons Attribution 4.0 License.

Total OH reactivity over the Amazon rainforest: variability with
temperature, wind, rain, altitude, time of day, season,
and an overall budget closure
Eva Y. Pfannerstill1,a , Nina G. Reijrink1,2 , Achim Edtbauer1 , Akima Ringsdorf1 , Nora Zannoni1 , Alessandro Araújo3 ,
Florian Ditas1,b , Bruna A. Holanda1 , Marta O. Sá4 , Anywhere Tsokankunku1 , David Walter1 , Stefan Wolff1 ,
Jošt V. Lavrič5 , Christopher Pöhlker1 , Matthias Sörgel1 , and Jonathan Williams1,6
1 Atmospheric   Chemistry and Multiphase Chemistry Departments, Max Planck Institute for Chemistry,
55128 Mainz, Germany
2 Département Sciences de l’Atmosphère et Génie de l’Environnement (SAGE), IMT Lille Douai, 59508 Douai, France
3 Empresa Brasileira de Pesquisa Agropecuária (Embrapa) Amazonia Oriental, CEP 66095-100, Belém, Brazil
4 Instituto Nacional de Pesquisas da Amazônia (INPA), CEP 69067-375, Manaus, Brazil
5 Biogeochemical Processes Department, Max Planck Institute for Biogeochemistry, 07745 Jena, Germany
6 Energy, Environment and Water Research Center, The Cyprus Institute, 1645 Nicosia, Cyprus
a now at: Department of Environmental Science, Policy, and Management, University of California, Berkeley, CA 94720, USA
b now at: Hessisches Landesamt für Naturschutz, Umwelt und Geologie, 65203 Wiesbaden, Germany

Correspondence: Eva Y. Pfannerstill (eva.pfannerstill@mpic.de)

Received: 22 July 2020 – Discussion started: 8 October 2020
Revised: 18 March 2021 – Accepted: 19 March 2021 – Published: 26 April 2021

Abstract. The tropical forests are Earth’s largest source of   now an underestimated contributor to the OH sink above the
biogenic volatile organic compounds (BVOCs) and thus also      Amazon forest.
the largest atmospheric sink region for the hydroxyl radical      By day, total OH reactivity decreased towards higher alti-
(OH). However, the OH sink above tropical forests is poorly    tudes with strongest vertical gradients observed around noon
understood, as past studies have revealed large unattributed   during the dry season (−0.026 s−1 m−1 ), while the gradient
fractions of total OH reactivity. We present the first total   was inverted at night. Seasonal differences in total OH re-
OH reactivity and volatile organic compound (VOC) mea-         activity were observed, with the lowest daytime average and
surements made at the Amazon Tall Tower Observatory            standard deviation of 19.9 ± 6.2 s−1 during a wet–dry transi-
(ATTO) at 80, 150, and 320 m above ground level, cover-        tion season with frequent precipitation; 23.7 ± 6.5 s−1 during
ing two dry seasons, one wet season, and one transition sea-   the wet season; and the highest average OH reactivities dur-
son in 2018–2019. By considering a wide range of previ-        ing two dry-season observation periods with 28.1 ± 7.9 s−1
ously unaccounted for VOCs, which we identified by pro-        and 29.1 ± 10.8 s−1 , respectively. The effects of different en-
ton transfer reaction time-of-flight mass spectrometry (PTR-   vironmental parameters on the OH sink were investigated,
ToF-MS), the unattributed fraction was with an overall aver-   and quantified, where possible. Precipitation caused short-
age of 19 % within the measurement uncertainty of ∼ 35 %.      term spikes in total OH reactivity, which were followed
In terms of seasonal average OH reactivity, isoprene ac-       by below-normal OH reactivity for several hours. Biomass
counted for 23 %–43 % of the total and oxygenated VOCs         burning increased total OH reactivity by 2.7 to 9.5 s−1 . We
(OVOCs) for 22 %–40 %, while monoterpenes, sesquiter-          present a temperature-dependent parameterization of OH re-
penes, and green leaf volatiles combined were responsible      activity that could be applied in future models of the OH sink
for 9 %–14 %. These findings show that OVOCs were until        to further reduce our knowledge gaps in tropical-forest OH
                                                               chemistry.

Published by Copernicus Publications on behalf of the European Geosciences Union.
6232                                                E. Y. Pfannerstill et al.: Total OH reactivity over the Amazon rainforest

1   Introduction                                                   a complete understanding of local atmospheric chemistry and
                                                                   of the OH sink. This directly measurable quantity is called
The Amazon rainforest, with its area of over 5.8 × 10⁶ km2 ,       total OH reactivity, and its value determines the OH loss fre-
contains more than half of Earth’s tropical forests (Morley,       quency in reciprocal seconds. By comparing to the OH reac-
2000), a quarter of global biodiversity (Dirzo and Raven,          tivity calculated from all individually measured compounds
2003), and nearly 15 % of terrestrial biomass (Houghton et         (termed the speciated OH reactivity), total OH reactivity can
al., 2001; Bar-On et al., 2018). The Amazon biome is thus of       reveal the presence of VOCs that were not measured (termed
global relevance for cycling of water, energy, carbon and nu-      the unattributed or “missing” OH reactivity).
trients (Andreae, 2002; Malhi, 2002; Werth, 2002; Aragão et           The tropical forests are the regions of the world with the
al., 2014). Understanding its interaction with the atmosphere      largest total OH reactivities in the air, with modeled annual
is highly important for understanding global biogeochemical        averages of 30–50 s−1 (Ferracci et al., 2018; Safieddine et al.,
cycles.                                                            2017). Total OH reactivity in Amazonia is thought to be dom-
   The emission of biogenic volatile organic compounds             inated by isoprene and other reactive BVOCs (Nölscher et al.,
(BVOCs) by vegetation plays a fundamental role in atmo-            2016; Safieddine et al., 2017), which are emitted as a func-
spheric chemistry. Global BVOC emissions are, according to         tion of light and temperature (e.g., Jardine et al., 2015; Kuhn
recent estimates, a factor of ∼ 6 higher than anthropogenic        et al., 2004a; Rinne et al., 2002). However, a significant part
volatile organic compound (VOC) emissions (Guenther et             of tropical rainforest OH reactivity remains unexplained by
al., 2012; Sindelarova et al., 2014; Hoesly et al., 2018). Trop-   speciated trace gases measurements (Nölscher et al., 2016;
ical forests are Earth’s largest BVOC source, contributing         Williams et al., 2016; Edwards et al., 2013) and by usual
65 % of the global isoprene emissions and 77 % of the global       global atmospheric chemistry models (Ferracci et al., 2018)
monoterpene emissions (Guenther et al., 2012; Sindelarova          with unattributed fractions of 5 %–15 % in the wet and 79 %
et al., 2014). The relevance of BVOCs for atmospheric pro-         in the dry season (Nölscher et al., 2016). The unattributed
cesses stems from their high chemical reactivity. Once re-         fraction of OH reactivity in tropical forests is assumed to be
leased to the atmosphere, BVOCs undergo oxidation reac-            due to unmeasured oxygenated intermediates (Edwards et al.,
tions within seconds to days, mainly reacting with OH rad-         2013) or to a combination of oxygenated VOCs (OVOCs)
icals, which are formed during the daytime from the ozone          and multiple primary BVOCs (Nölscher et al., 2016). Atmo-
photoproduct O1 D and water as well as through recycling re-       spheric chemistry models do not usually consider this addi-
actions (Taraborrelli et al., 2012). This oxidation pathway in-    tional, unattributed OH sink, with significant implications for
fluences regional tropospheric ozone and secondary organic         the lifetime of the hydroxyl radical and of methane (Ferracci
aerosol formation (Palm et al., 2018; Wyche et al., 2014;          et al., 2018).
Hamilton et al., 2013; Goto et al., 2008; Schulz et al., 2018),       In this work, we used comprehensive VOC information,
thereby impacting oxidative stress to ecosystems, as well as       including compounds with uncertain chemical structure mea-
cloud formation and global climate (Bates and Jacob, 2019;         sured by proton transfer reaction time-of-flight mass spec-
Scott et al., 2018; Engelhart et al., 2011; Pöschl et al., 2010;   trometry (PTR-ToF-MS), for comparison with total OH re-
Heald and Spracklen, 2015). Additionally, the reaction of          activity for the first time at a tropical rainforest site. The
BVOCs with OH affects the regional atmospheric oxidation           only previous Amazon rainforest reactivity budget exercise
capacity, which in turn controls the residence times of longer-    was reported by Nölscher et al. (2016) from a smaller 80 m
lived greenhouse gases (e.g., CH4 ) and pollutants (e.g., CO)      tower. It was based on data from a proton transfer reaction–
(Bates and Jacob, 2019; Arneth et al., 2010; Peñuelas and          quadrupole mass spectrometer (PTR-QMS). The PTR-ToF-
Staudt, 2010).                                                     MS system used in this study is more sensitive and has a sig-
   More than 30 000 different BVOCs are thought to be re-          nificantly higher mass resolution allowing more compounds
leased from vegetation (e.g., Harley, 2013) including a wide       to be measured. In this way, we have attempted to obtain clo-
range of chemical classes, such as terpenoids, alkenes, al-        sure on apportioning OH reactivity and to identify the pre-
cohols, aldehydes, and ketones (Guenther et al., 2012). One        viously unidentified OH sinks. Presented here are the first
measurement survey found 264 BVOC species emitted from             measurements of total OH reactivity at the 320 m high tower
tropical trees in French Guiana (Courtois et al., 2009). How-      at the remote Amazon rainforest site ATTO (Amazon Tall
ever, for technical reasons, most studies of BVOCs in tropi-       Tower Observatory), covering one wet season, one wet–dry
cal forests to date have been limited to a modest number of        transition season, and two dry seasons in 2018–2019. We dis-
known, abundant species such as isoprene and monoterpenes          cuss vertical gradients between 80 and 320 m above the rain-
and few oxygenated compounds (e.g., Yáñez-Serrano et al.,          forest floor, as well as seasonality and diel cycles of total
2015; Langford et al., 2010; Rizzo et al., 2010; Kuhn et al.,      OH reactivity and its composition. The influence of environ-
2007; Karl et al., 2007; Saxton et al., 2007; Rottenberger et      mental parameters such as precipitation and biomass burning
al., 2004; Rinne et al., 2002; Kesselmeier et al., 2000).          is investigated, and a seasonal parameterization for total OH
   Therefore, a measure of the combined effect of all VOCs         reactivity dependence on temperature is developed.
and other OH reactive species in ambient air is necessary for

Atmos. Chem. Phys., 21, 6231–6256, 2021                                              https://doi.org/10.5194/acp-21-6231-2021
E. Y. Pfannerstill et al.: Total OH reactivity over the Amazon rainforest                                                    6233

2     Materials and methods                                        ter, 0.5 in. = 1.27 cm; material, fluorinated ethylene propy-
                                                                   lene) were heated (∼ 45 ◦ C) and insulated with flexible elas-
2.1    Study site – Amazon Tall Tower Observatory                  tomeric foam covering. A valve system was constructed to
                                                                   switch between the different heights, beginning with the low-
The Amazon Tall Tower Observatory (Andreae et al., 2015)           est height at the full hour and switching to the next height ev-
is situated ∼ 150 km northeast of Manaus, Brazil, in a dense,      ery 5 min. Thus, each height was sampled four times an hour.
non-flooded terra firme (plateau) forest at ∼ 120 m above          In order to avoid underpressure at the end of the long inlet
sea level. The average rainfall at the site reaches its monthly    lines, the laboratory container was downstream of a chemi-
maximum of ∼ 335 mm in the wet season (February to May)            cally inert pump with a Teflon membrane (KNF Neuberger,
and its minimum of ∼ 47 mm in the dry season (August to            Freiburg, Germany) with a sampling flow of ca. 17 L min−1 .
November) (Pöhlker et al., 2019). The wet–dry transition           The inlet residence time from 320 m was ∼ 80 s. The inlet
season covers June to July and the dry–wet transition sea-         response time, i.e., the time for all species to reach a steady
son December to January (Andreae et al., 2015; Pöhlker et          signal, determined by sampling a calibration gas mixture in-
al., 2016). The main wind directions at the site are north-        troduced at the 320 m inlet entrance, ranged between 88 s (for
east during the wet season and east during the dry season          methanol) and 96 s (for acetaldehyde, benzene, trimethylben-
(Pöhlker et al., 2019). The site is equipped with several tow-     zene, methacrolein), with an average of 93 s. Consequently,
ers. The tall tower with a total height above ground level         the data measured in the first 100 s after each valve switch
(a.g.l.) of 325 m is located at 02◦ 08.6020 S, 59◦ 00.0330 W. It   were not included in the data analysis.
has been in operation since 2018 with continuous measure-
ments of VOCs, ozone, particles, and basic meteorological          2.4   Inlet effects
data. During intensive observation periods, these were com-
plemented by total OH reactivity observations and sampling         Due to the length of the inlet tubing of more than 320 m from
of VOCs for offline analysis. A walk-up tower (height a.g.l.       the top of the ATTO tall tower to the instrumentation, po-
80 m) located ∼ 1 km from the tall tower has been equipped         tential sampling losses have to be considered. Losses can be
with instrumentation for continuous measurements of meteo-         irreversible due to oxidation with ozone or reversible due to
rology, micrometeorology, greenhouse gases, phenology, in-         interactions with the tubing. The most ozone-reactive VOCs
organic trace gases, and aerosol particles since 2012. Maxi-       observed in this study are sesquiterpenes, and the sesquiter-
mum canopy top height of the trees surrounding the towers          pene mixture at 80 m a.g.l. and higher was relatively unreac-
is ca. 35 m.                                                       tive, as can be seen in the thermodesorption (TD)-gas chro-
                                                                   matography (GC)-ToF-MS-derived speciation in Table S1.
2.2    Measurement periods
                                                                   The most reactive sesquiterpene mixture observed (lowest
Continuous total OH reactivity measurements were con-              height, dry season) had an average reaction rate coefficient
ducted in March 2018 (7 d; 9–15 March 2018), Octo-                 of 1.23×−16 cm3 molecules−1 s−1 towards ozone and thus a
ber 2018 (6 d; 20–26 October 2018), June 2019 (13 d; 10–           lifetime of ca. 5.5 h for peak diel ozone concentrations of
23 June 2019), and September 2019 (5 d; 22–26 Septem-              17 ppb (dry season). The inlet residence time of 80 s is there-
ber 2019). These campaigns cover several seasons with              fore not considered to be long enough for significant losses in
March in the wet season (median soil moisture at 10 cm             sesquiterpenes. Potential chemical losses due to ozone being
depth 0.169 m3 m−3 ) and September and October in the dry          present in the inlet tube are thus considered negligible.
season (median soil moisture 0.160 and 0.161 m3 m−3 , re-             VOCs, especially polar compounds, can partition re-
spectively). June is part of the wet–dry transition season.        versibly from the gas phase to Teflon tubing walls (Deming et
However, June 2019 was particularly wet with flooding at           al., 2019; Pagonis et al., 2017; Liu et al., 2019). This causes
the riverbanks in the study region (median soil moisture           a delay in the time profile of the VOCs, similar to the effect
0.218 m3 m−3 ; see Fig. S1).                                       a chromatographic column (Pagonis et al., 2017). In con-
                                                                   sequence, concentration peaks are smeared and broadened,
2.3    Sampling                                                    which causes an underestimation of observed concentrations
                                                                   (Deming et al., 2019). The ATTO inlet tubing was constantly
Total OH reactivity, ozone, and VOC measurement devices            flushed even when not being sampled, so surfaces were as-
shared an inlet system. Measurement heights at the ATTO            sumed to be saturated or near equilibrium so that inlet inter-
tall tower were 80, 150, and 320 m a.g.l., each equipped with      actions were minimized. We determined inlet losses in peak
its own, constantly flushed (15 L min−1 ) inlet tube which         concentrations from the 320 m inlet to the instrument by in-
brought air from aloft to a temperature-controlled laboratory      troducing a calibration gas mixture from the top of the tower.
container located adjacent to the tower. At the entry of each      The losses in peak concentration ranged between 11 % and
inlet, a regularly changed polytetrafluoroethylene (PTFE) fil-     30 % for all substances in the calibration mixture. We did not
ter (5 µm pore size) prevented contamination by particles          correct final data for inlet losses in order to keep VOC and
or insects. The non-transparent inlet tubes (outer diame-          total OH reactivity data, which were both measured from the

https://doi.org/10.5194/acp-21-6231-2021                                            Atmos. Chem. Phys., 21, 6231–6256, 2021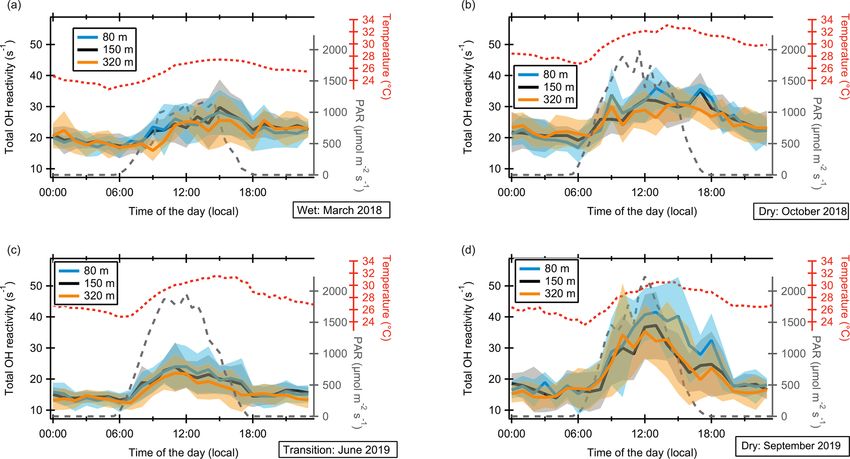
6234                                                E. Y. Pfannerstill et al.: Total OH reactivity over the Amazon rainforest

same inlet, comparable (inlet loss correction for total OH re-    ously fed into the sample stream for mass-scale calibration.
activity would change according to its composition, which is      The time resolution of the measurement was 20 s. The mass
not entirely known) and because loss fractions for substances     resolution (full width at half maximum) ranged between
not included in the calibration mixture are not known. This       3000 and ∼ 3500. A complete list of the trace gases mea-
means that the total OH reactivity and VOC concentrations         sured by PTR-ToF-MS can be found in Table S1.
observed in this study may be underestimated in their peak           CO and methane were sampled at the walk-up tower at
values and smeared towards later times of the day but that the    80 m a.g.l. using a cavity ring-down spectroscopy instrument
overall daytime sum should be unaffected.                         (Picarro Inc., Santa Clara, California, USA). From prelimi-
                                                                  nary CO and methane measurements at the 320 m tower, ver-
2.5    Total OH reactivity, trace gas, and black carbon           tical gradients were taken to calculate approximate concen-
       measurements                                               trations for 150 and 320 m from the 80 m observations. For
                                                                  CO, 10 and 30 ppb were subtracted from the 80 m values to
During all four campaigns, total OH reactivity was deter-         derive lower-limit mixing ratios for 150 and 320 m, respec-
mined using the comparative reactivity method (CRM; Sinha         tively. Methane values measured at 80 m were assumed to be
et al., 2008). The method was recently compared to other          valid for all heights, because the small height-related differ-
OH reactivity measurement devices (Fuchs et al., 2017) and        ences observed are not on an order of magnitude that affects
has been applied in various regions of the world (Yang et         OH reactivity (Botía et al., 2020).
al., 2016). Briefly, CRM uses the known OH reactivity of a           For monoterpene and sesquiterpene speciation, air sam-
pyrrole gas standard (Westfalen AG, Münster, Germany) and         ples were collected on adsorbent filled tubes equipped with
compares it with the reactivity of all compounds found in         ozone scrubbers at different heights on the ATTO tall tower
ambient air in a competitive reaction. OH radicals are cre-       (Zannoni et al., 2020a). Sampling occurred every 3 h for
ated inside a glass reactor by flushing humidified nitrogen       2 weeks at 80 and 150 m (March 2018) and every hour for
(6.0 grade, Westfalen AG, Münster, Germany) over a Hg–            3 d at 80, 150, and 320 m (October 2018). Samples were an-
Ar UV lamp (LOT-QuantumDesign, Darmstadt, Germany).               alyzed in the laboratory by a TD-GC-ToF mass spectrometer
CRM uses three different modes: C1 (OH scavenger + pyr-           (Markes International, Llantrisant, United Kingdom).
role + UV light at ∼ ambient humidity), C2 (OH + pyrrole,            Measurements of black carbon mass concentrations were
ambient humidity), and C3 (ambient air + pyrrole + OH)            obtained at the 325 m inlet of the ATTO tall tower using
level. For a more detailed description, see Sinha et al. (2008)   a multi-angle absorption photometer (MAAP; model 5012,
and Michoud et al. (2015).                                        Thermo Fisher Scientific, Waltham, Massachusetts, USA), as
   In our study, the C2 level was measured for 15 min             described in Holanda et al. (2020).
at the beginning of each hour, followed by 45 min of
C3 measurement. C1 level determinations and calibrations          2.6   Total OH reactivity data analysis
with a pyrrole gas standard (Westfalen AG, Münster, Ger-
many) were performed at least twice during each cam-              CRM data analysis and corrections were conducted follow-
paign. The C1 level was typically 68 ± 1 ppb (parts per           ing the procedures described in Pfannerstill et al. (2019). The
billion = nmol mol−1 ). The system was operated at a pyr-         humidity correction amounted to an average of 5 % and the
role / OH ratio of 2.76 ± 0.23 (average ± standard devia-         ozone correction to an average of 2 % of the measured OH re-
tion). As is typical in the CRM, this ratio deviates from the     activity. An NO / NO2 correction was not performed due to
pseudo-first-order conditions assumed in the CRM equation         the low NOx levels at the site (Pfannerstill et al., 2018; Wolff,
(Sinha et al., 2008). Therefore, a correction had to be applied   2015) with maximum NO and NO2 mixing ratios of 0.36
(see Sect. 2.5).                                                  and 0.62 ppb in the dry season (October 2018), respectively.
   The pyrrole mixing ratio was monitored by a proton trans-      The correction for pseudo-first-order deviation was derived
fer reaction–quadrupole mass spectrometer (PTR-QMS; Ion-          from tests using propene, isoprene, and propane, resulting
icon Analytik, Innsbruck, Austria; Lindinger et al., 1998) at     in a weighted correction factor in dependence on the alkene
m/z = 68. The instrument was operated at 60 ◦ C drift tem-        fraction in calculated OH reactivity and the pyrrole / OH ra-
perature, 2.2 mbar drift pressure, 600 V drift voltage, and       tio (Eq. 1):
137 Td.                                                           F = F1 Xalkenes + F2 (1 − Xalkenes ),                        (1)
   Simultaneously, VOC measurements up to m/z ≈ 300
were conducted using a PTR ToF mass spectrometer (Ion-            where F is the total correction factor and the
icon Analytik, Innsbruck, Austria; Jordan et al., 2009), op-      weighted, pyrrole / OH-dependent correction factors
erated at 60 ◦ C drift temperature, 3.5 mbar drift pressure,      were F1 = −0.53 × pyrrole / OH + 2.98 and F2 = 0.63
850 V drift voltage, and 120 Td. The instrument was cali-         for March 2018, F1 = −1.20 × pyrrole / OH + 4.73 and
brated with a gravimetrically prepared multicomponent VOC         F2 = −0.20× pyrrole / OH + 1.55 for October 2018,
standard (Apel-Riemer Environmental Inc., Colorado, USA)          F1 = −1.1× pyrrole / OH +4.50 and F2 = 0.94 for
once during each campaign. Diiodobenzene was continu-             June 2019, and −0.52× pyrrole / OH +3.05 and F2 = 0.94

Atmos. Chem. Phys., 21, 6231–6256, 2021                                             https://doi.org/10.5194/acp-21-6231-2021
E. Y. Pfannerstill et al.: Total OH reactivity over the Amazon rainforest                                                   6235

for September 2019. Xalkenes is the speciated OH reactivity       penes measured by PTR-ToF-MS was derived from TD-GC-
fraction of alkenes. This correction increased OH reactivity      ToF-MS data as specified in Table S1.
by a factor of 1.12 ± 0.10 (average ± standard deviation).            Periods influenced strongly by biomass burning were iden-
   The dilution of ambient air with humidified nitrogen was       tified using an index defined as the 3∗ acetonitrile mixing
accounted for with a dilution factor of 1.3.                      ratio in parts per billion + black carbon mass in micro-
   The 5 min detection limits (LODs), derived from the            grams per cubic meter. If this index was > 1 in the dry
2σ standard deviation of background (C2) measurements,            season or > 0.75 in the wet and transition season, the re-
ranged between 4.0 and 7.0 s−1 (depending on PTR-QMS              spective data point was defined as strongly biomass burn-
performance). Total uncertainty (1σ ) of the measurements         ing influenced, whereas other data points were categorized
was 35 % (median), with a precision of 16 %–41 % over             as low biomass burning influenced. This index was tested
5 min depending on the quantity of reactivity.                    against the pristine-conditions index PRBC ∪ CO from Pöhlker
                                                                  et al. (2018) for March 2018. In this period, ∼ 80 % of the
2.7   Calculated OH reactivity from individually                  data points were categorized in the same way by both indices.
      measured compounds (speciated OH reactivity)

Table S1 lists the 83 VOCs and 3 inorganic trace gases and
                                                                  3     Results and discussion
their reaction rate constants considered for calculating speci-
ated OH reactivity. The speciated OH reactivity is the sum of
                                                                  3.1     Vertical, diel, and seasonal variation in total OH
the OH reactivities attributed to individual (measured) trace
                                                                          reactivity
gases (Eq. 2):

R = 6kVOCi +OH [VOC]i .                                    (2)    3.1.1    Total OH reactivity profiles and diel cycles

   Contributions of VOCs and inorganic trace gases (where         Profiles of total OH reactivity between 80 and 320 m a.g.l.
[VOC] is their respective concentrations in molecules cm−3 )      at the ATTO tall tower are shown for different seasons and
to OH reactivity (R in s−1 ) are calculated using the gas-phase   times of the day in Fig. 1. Generally, noontime OH reactiv-
reaction rate constants (kVOC+OH in cm3 molecule−1 s−1 ) of       ity was higher in the dry seasons than in the wet or transi-
the respective compounds with the OH radical. The differ-         tion seasons, which is consistent with earlier studies at lower
ence between the sum of individual trace gas contributions        heights (Nölscher et al., 2016). The overall lowest noon-
to OH reactivity and measured total OH reactivity is termed       time (11:00–15:00 LT (local time)) OH reactivity average
“unattributed” or missing OH reactivity. Out of a total of 86     was observed with 23.2 s−1 at 80 m during the wettest pe-
chemical species that were considered for the calculation of      riod (June 2019, Fig. S1), and the highest noontime average
speciated reactivity here, 13 VOCs (specified in Table S1),       was observed with 39.4 s−1 during the driest period of mea-
including the most important known contributors to OH re-         surements (September 2019).
activity in the tropical forest, were calibrated with gas stan-      Nighttime (00:00–05:00 local time) averages were lower,
dards and therefore have low uncertainties in their concen-       at between 14.1 and 20.2 s−1 . Interestingly, the noontime–
trations as well as in their reaction rate coefficients (5 %–     nighttime difference was with 12.4–22.5 s−1 much larger in
15 %). A further 70 exact masses (specified in Table S1)          the dry season than in the wet season (6.7 s−1 ). The nighttime
monitored by PTR-ToF-MS were attributed to molecular for-         values appear to be relatively consistent over the different
mulae, and their concentrations were derived using a the-         measurement periods, whereas the noontime values are sub-
oretical approach (Lindinger and Jordan, 1998), which has         ject to larger seasonal differences. This is probably related to
an uncertainty of ca. 50 %. In cases where several chemical       larger temperature differences between day and night in the
structures could be attributed to the measured mass, an aver-     dry season (see Sect. 3.3.1).
age of the known reaction rate coefficients with OH was used         In all seasons, there was a negative vertical gradient of
for calculating the speciated OH reactivity. In the few cases     OH reactivity towards higher levels around noon. This is ex-
where rate coefficients were unknown in the literature, the       pected, because noon and early afternoon is the time when
rate coefficient of a VOC with comparable functional groups       the vegetation reaches its emission maximum (Sarkar et al.,
was applied (see Table S1). Due to the occasional large dif-      2020). Reactive VOCs emitted by the vegetation become
ferences in rate coefficients between possible structures, the    oxidized to less reactive compounds while they are trans-
uncertainty in the reaction rate coefficients kVOC+OH is es-      ported aloft (see Sect. 3.2). The vertical OH reactivity gra-
timated to be 100 %. The uncertainty in the resulting speci-      dient was strongest in the driest period observed (September
ated (i.e., calculated) OH reactivity depends on the fraction     2019; noontime gradient −0.026 s−1 m−1 ; see Fig. S3), with
of gas-standard-calibrated compounds in the ambient air at        a maximum difference between 80 and 320 m of 6.8 s−1 , and
any given point of time and varied between 15 % and 65 %,         weakest in the wet season (March 2018; noontime gradient
with an average (± standard deviation) of 36 % ± 9 %. The         −0.005 s−1 m−1 ), with a maximum difference between 80
relative composition of the total monoterpenes and sesquiter-     and 320 m of 1.3 s−1 . The dry season vertical gradient was

https://doi.org/10.5194/acp-21-6231-2021                                            Atmos. Chem. Phys., 21, 6231–6256, 2021
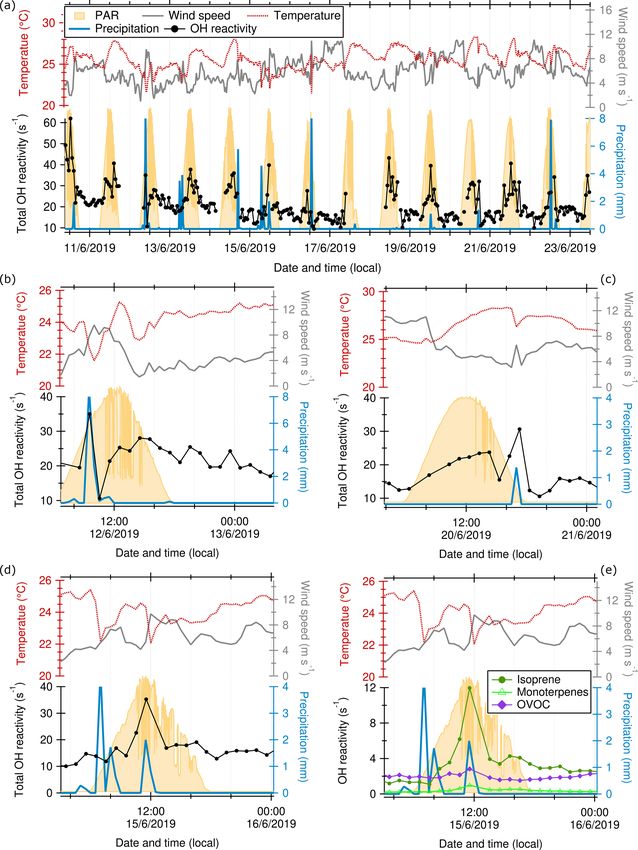
6236                                                   E. Y. Pfannerstill et al.: Total OH reactivity over the Amazon rainforest

Figure 1. Profiles of total OH reactivity at the ATTO tall tower for two dry seasons, one wet season, and one transition season. Values are
averages of several days of measurement (5–13 d; see Sect. 2.2). The shaded areas represent the standard deviation of the data. The left part
of the figure illustrates the tower and the canopy height at the same scale as the OH reactivity profiles. Wet s. is wet season; Trans. s. is
transition season. All times are local time.

here approximately a factor of 4 lower than the OH reactivity            cuticles has been observed in the past (Niinemets et al., 2014;
gradient observed directly above the rainforest canopy from              Karl et al., 2010; Park et al., 2013; Langford et al., 2010;
24 up to 80 m in the 2013 dry season (Nölscher et al., 2016).            Cappellin et al., 2017). A study conducted at the ATTO site
This behavior was also observed in aircraft measurements of              found strong nighttime canopy deposition of monoterpenes
isoprene and monoterpenes, where vertical gradients inside               which was a function of surface wetness (Yáñez-Serrano et
the boundary layer above the rainforest decreased with height            al., 2018). Deposition can thus partly explain the weaker ver-
(Karl et al., 2007; Kuhn et al., 2007). In the wet season, the           tical gradients in the wet season, when the overcast condi-
gradients measured here were comparable to those seen di-                tions led to weaker irradiation and therewith lower OH levels,
rectly above the canopy in the 2013 wet season (Nölscher et              while deposition continued or was even increased due to pre-
al., 2016).                                                              cipitation. Soils can act as an additional VOC sink (Tang et
   Between 80 and 320 m, the variability in the data (shown              al., 2019; Pegoraro et al., 2005; Cleveland and Yavitt, 1997).
as standard deviations) was often as large as the gradient                  Total OH reactivity diel cycles (Fig. 2) reflect the typical
(Fig. 1). This suggests that turbulent mixing above the forest           diurnal behavior of BVOC concentrations previously mea-
was often strong enough to transport reactive VOCs to higher             sured in the rainforest (Langford et al., 2010; Yáñez-Serrano
levels faster than the majority of the reactants could become            et al., 2015; Rizzo et al., 2010), which is broadened towards
oxidized to less reactive species. This observation reflects the         the evening hours in comparison to emission fluxes (Sarkar
well-mixed nature of air above rainforest canopies in the day-           et al., 2020; Kuhn et al., 2007). Sunrise was around 06:00 lo-
time (Freire et al., 2017; Fuentes et al., 2016).                        cal time (LT) and sunset around 18:00, independent of the
   At nighttime, vertical gradients in total OH reactivity were          season. In the mornings, OH reactivity started to increase
barely discernable. The data suggest a slightly lower (by                in the 1–2 h following sunrise, in parallel with temperature.
up to 1.8 s−1 ) OH reactivity at the lowest observation level            The OH reactivity maximum occurred between 12:00 and
(80 m) than at 150 m and/or 320 m in all observation periods             15:00 LT. At the end of the day, OH reactivity decreased with
except September. The OH radical, the dominant VOC sink,                 PAR (photosynthetically active radiation) but, following the
is not available during the night to any significant degree,             pattern of temperature more closely than that of PAR, did not
although some can be generated by the reaction of ozone                  reach nighttime levels until 2–4 h after sunset. Note that the
with terpenoids (Pfeiffer et al., 1998; Aschmann et al., 2002;           OH reactivity maximum may be a lower limit due to inlet-
Taraborrelli et al., 2012). Potentially, deposition to the sur-          related smearing of peak concentrations (Sect. 2.4).
faces of the forest canopy or to the soil becomes a relevant                Minimum total OH reactivity values were generally ob-
VOC sink visible in the 80 m values at night, while surfaces             served in the early morning before sunrise, coinciding with
for dry deposition are less available at higher altitudes. VOC           the lowest diel temperatures. The dependence of OH reactiv-
deposition on ecosystems and plants and even uptake to the               ity on temperature is discussed in more detail in Sect. 3.3.1.

Atmos. Chem. Phys., 21, 6231–6256, 2021                                                     https://doi.org/10.5194/acp-21-6231-2021

E. Y. Pfannerstill et al.: Total OH reactivity over the Amazon rainforest                                                          6237

Figure 2. Diel cycles of total OH reactivity at 80, 150, and 320 m height a.g.l. at the ATTO tall tower for four measurement periods:
(a) March 2018 (wet season), (b) June 2019 (wet–dry transition season), (c) October 2018 (dry season), and (d) September 2019 (dry
season). Values are hourly diel averages over each measurement period. The shaded areas represent the standard deviation of the data. PAR
(photosynthetically active radiation) and temperature were measured at 81 m height a.g.l. at the 80 m walk-up tower.

   In both dry seasons and the wet season, a second peak of            (Bracho-Nunez et al., 2012) or by a potential delay of leaf
OH reactivity, smaller than the noontime maximum, occurred             flushing that usually starts in many trees during the wet-to-
during sunset. Potentially, this was related to a combination          dry transition season (Lopes et al., 2016), which would have
of a transport effect and terpenoid emissions spread out until         influenced leaf phenology, another driver of tropical BVOC
the evening (Pfannerstill et al., 2018).                               emissions (Alves et al., 2018; Wei et al., 2018). Also, wet
   The differences in OH reactivity diel cycles between                deposition was enhanced in June, contributing to reduced
heights were often within the standard deviation of diel               OVOC concentrations (see Sect. 3.2). Influence of rainfall on
hourly averages, usually with slightly higher values at 80 m           OH reactivity is further discussed in Sect. 3.3.3. During the
during the day as discussed above.                                     dry seasons, the diel hourly maxima of OH reactivity were
                                                                       35.9 and 41.5 s−1 for October 2018 and September 2019, re-
3.1.2   Total OH reactivity seasonality                                spectively. The larger daytime OH reactivity in September
                                                                       was accompanied by higher PAR than in October.
The lowest temperatures and PAR values were observed dur-                 In contrast to the daytime values, the nighttime OH reac-
ing the wet season (March; hourly diel maxima 27.4 ◦ C                 tivity in September 2019 was significantly lower than in Oc-
and 1166 µmol m−2 s−1 ), followed by the wet–dry transi-               tober 2018. One potential reason is found in enhanced night-
tion season (June: 31.5 ◦ C, 1955 µmol m−2 s−1 ), and the two          time ozone levels in September 2019, when nighttime av-
dry season periods (October, 33.1 ◦ C, 1987 µmol m−2 s−1 ;             erage ozone mixing ratios were 39 % (4.3 ± 1.7 ppb) higher
September, 30.6 ◦ C, 2230 µmol m−2 s−1 ). Surprisingly, we             than in October 2018 (Fig. 3). Ozone is a direct sink for ter-
observed the lowest daytime OH reactivity in the wet–dry               penoid compounds but also generates secondary OH from
transition season (June) with a diel hourly maximum at 80 m            the reaction with terpenes and sesquiterpenes (Pfeiffer et al.,
of 24.0 s−1 when temperature and irradiation were higher               1998; Aschmann et al., 2002; Taraborrelli et al., 2012). This
than in March (28.2 s−1 ). However, as mentioned previ-                might have led to a larger nighttime VOC loss in Septem-
ously, the June 2019 transition season was particularly wet            ber 2019. However, other potential explanations such as
with frequent rainfall and with a higher soil moisture than            inter-annual differences in nighttime deposition cannot be
March 2018 (Fig. S1). These conditions appear to have in-              ruled out.
fluenced BVOC concentrations, e.g., due to root inundation

https://doi.org/10.5194/acp-21-6231-2021                                                 Atmos. Chem. Phys., 21, 6231–6256, 2021
6238                                                    E. Y. Pfannerstill et al.: Total OH reactivity over the Amazon rainforest

Figure 3. Diel cycles of ozone mixing ratios (left axis) and total OH reactivity (right axis) at ∼ 80 m height a.g.l. for the two dry seasons,
October 2018 and September 2019. Values shown are the hourly (reactivity) or half-hourly (ozone) diel averages over the measurement
periods.

   The seasonal behavior in total OH reactivity observed                 3.2     OH reactivity budget
here, with a maximum in September and a minimum in
June, is consistent with satellite-derived isoprene observa-             3.2.1    OH reactivity speciation overview and
tions from 2010 to 2011 (Alves et al., 2016). A comparison of                     unattributed reactivity
the values presented here with OH reactivity measurements
made in 2013 at the same site (at 79 m a.g.l. at the walk-up             In forested environments, the total OH sink is generally less
tower; Nölscher et al., 2016) shows very similar values be-              well understood than in urban air masses (Yang et al., 2016;
tween June 2013 and June 2019. In March 2013, the observed               Williams and Brune, 2015; Zannoni et al., 2017). Previ-
values were lower and in September 2013 they were higher                 ous total OH reactivity observations in tropical forests re-
than in the same months in 2018–2019. A potential reason                 vealed large unattributed OH reactivity fractions of 50 %–
for these differences could be inter-annual variability. For ex-         79 % (Nölscher et al., 2016; Edwards et al., 2013; Sinha
ample, March 2018 was less humid than March 2013 with                    et al., 2008). The unattributed fraction in these past stud-
median soil moisture of 0.169 m3 m−3 vs. 0.233 m3 m−3 ,                  ies was largest in the dry season at night (around 80 %),
and it was relatively strongly influenced by biomass burn-               while it was smallest in the wet season around noon (5 %–
ing (Sect. 3.3.4). As discussed above, OH reactivity is gener-           50 %) (Nölscher et al., 2016). However, the number of trace
ally higher under drier rainforest conditions (Fig. S1). Other           gases included in these earlier investigations was restricted
factors not monitored, such as herbivore activity, can vary              to only 15 to 19 species due to technical limitations. As the
strongly between years (Velasque and Del-Claro, 2016) and                unattributed fraction depends on the number and relevance
can elicit the release of certain BVOCs that might contribute            of trace gases included, we investigate here how well we can
to inter-annual differences. Additionally, the VOC compo-                explain the OH reactivity budget by measuring a larger num-
sition measured at the same height can differ between the                ber of VOCs by PTR-ToF-MS. As a comparison to a pre-
walk-up tower used in 2013 and the tall tower used in 2018–              vious OH reactivity study at the ATTO site, the compounds
2019 due to local emissions (Zannoni et al., 2020a). The                 included in Nölscher et al. (2016) were marked with a “*” in
walk-up tower is built directly adjacent to trees, which might           Table S1.
increase the influence and amount of very local, momentary                  We used 83 VOCs (for a complete list see Table S1) mon-
BVOC emissions that could have led to the higher OH reac-                itored by PTR-ToF-MS to compare with measured total OH
tivities in September 2013, while the tall tower has a much              reactivity. The VOCs which were calibrated by a theoreti-
larger footprint (Pöhlker et al., 2019) and is built on a small          cal approach (see Sect. 2.6 and Table S1) contributed be-
clearing.                                                                tween 29 % and 39 % of total OH reactivity. The unattributed
                                                                         fraction resulting from the inclusion of both gas-standard-
                                                                         calibrated VOCs and those calibrated by the theoretical ap-
                                                                         proach was usually in the range of the measurement un-
                                                                         certainty (Fig. 4) and within the between-day variability

Atmos. Chem. Phys., 21, 6231–6256, 2021                                                     https://doi.org/10.5194/acp-21-6231-2021
E. Y. Pfannerstill et al.: Total OH reactivity over the Amazon rainforest 6239 Figure 4. Diel cycles of total OH reactivity, speciated OH reactivity by class of compounds, photosynthetically active radiation (PAR), temperature and unattributed OH reactivity at 80 m a.g.l. for four measurement periods: (a) March 2018, (b) October 2018, (c) June 2019, (d) September 2019. The individual compounds included in each class are listed in Table S1. Values are averages of several days of measurement (5–13 d; see Sect. 2.2). Error bars (for measured OH reactivity) and shaded areas (for unattributed reactivity) represent the standard deviation of the data. The unattributed fraction does not depend on height (see Fig. S2); therefore data from 80 m are shown as a representative example. Note that the axis range of (a) and (b) differs from that of (c) and (d) for better visibility of the reactivity contributions. (shown as standard deviation). Applying a more compre- a higher OVOC-attributed speciated OH reactivity fraction of hensive VOC measurement technique, we can thus close the 34 %–46 % (22 %–40 % of the total OH reactivity), attributed OH reactivity budget within the uncertainty. The unattributed to 45 OVOC species. These include reactive oxygenates that fraction was independent of measurement height (Fig. S2); were not included in earlier observations, e.g., 3-methyl- therefore data from 80 m are shown in Fig. 4 as a representa- furan (an isoprene oxidation product; Atkinson et al., 1989; tive example. Jardine et al., 2013), and monoterpene oxidation products The PTR-ToF-MS measurements revealed that an unex- with the chemical formula C9 H14 O (identified as nopinone pectedly large fraction of total OH reactivity above the rain- and sabinaketone by TD-GC-ToF-MS). Our findings support forest was due to oxygenated VOCs (OVOCs). Only five modeling results of Taraborrelli et al. (2012) which predicted OVOC species (methanol, acetaldehyde, acetone, methyl that half of the OH reactivity associated with the presence of ethyl ketone, sum of methacrolein + methyl vinyl ketone + isoprene would be due to its oxidation products. ISOPOOH) could be monitored in previous studies, amount- The smallest daytime average OVOC OH reactivity at ing to 10 %–15 % of speciated and 4 %–5 % of total OH re- 80 m a.g.l. (4.2 s−1 , 21 % of the total) was observed in the activity (Nölscher et al., 2016). A model has subsequently rainiest observation period (June 2019, with an average of attributed 19 % of Amazon OH reactivity to OVOCs (Safied- 4.4 mm of rain per day), in contrast to the highest average in dine et al., 2017). In addition to the aforementioned gas- the dry season (October 2018, 0.7 mm of rain per day) with standard-calibrated OVOC species, here we include OVOCs 8.8 s−1 (31 % of the total). This difference can be explained calibrated by a theoretical approach. As a result, we observe by a lower OVOC formation rate associated with lower irra- https://doi.org/10.5194/acp-21-6231-2021 Atmos. Chem. Phys., 21, 6231–6256, 2021
6240                                               E. Y. Pfannerstill et al.: Total OH reactivity over the Amazon rainforest

diation and a higher tendency for wet deposition of OVOCs           Previous studies explained unattributed OH reactivity frac-
associated with the higher precipitation rates in June (Lang-    tions in the rainforest with a mixture of unmeasured pri-
ford et al., 2010).                                              mary BVOCs (e.g., green leaf volatiles, sesquiterpenes) and
   In this study, isoprene accounted for 38 %–46 % of cal-       BVOC photooxidation products (Nölscher et al., 2016) or
culated and 23 %–43 % of total OH reactivity, and it was         with oxidation products alone (Edwards et al., 2013). Ed-
thereby the single chemical species with the largest contribu-   wards et al. (2013) created a box model to account for
tion to OH reactivity. However, this percentage is lower than    unattributed OH reactivity in a Southeast Asian rainfor-
the 70 % of calculated OH reactivity found at the Z14 station    est, which included ∼ 900 oxidized intermediates that con-
in central Amazonia (Karl et al., 2007) and the 54 %–70 %        tributed 47 % of the calculated OH reactivity. Our data, with
of calculated OH reactivity inside the canopy at the ATTO        23 %–43 % of total OH reactivity attributed to 45 OVOC
site in 2013 (Nölscher et al., 2016). However, Nölscher et       species and ∼ 10 % to several previously unaccounted for
al. (2016) already noted that isoprene accounted for only        primary BVOCs (including green leaf volatiles, oxygenated
∼ 20 % of the total OH reactivity during dry-season after-       and aromatic monoterpenes, and sesquiterpenes), indicate
noons.                                                           that previously unattributed OH reactivity fractions were due
   Our PTR-ToF-MS measurements also revealed several di-         to both primary BVOCs and oxidation products, with oxida-
rectly emitted BVOC species which were not included in           tion products dominating. Our analysis shows that the pre-
earlier rainforest OH reactivity studies – e.g., the sum of      viously unattributed OH reactivity cannot be explained by a
sesquiterpenes, oxygenated (e.g., citronellol, thymol) and       few key species but rather that a multitude of relatively small
aromatic monoterpenes (e.g., p-cymene, cymenene), and sev-       contributions, in particular from OVOC, explain the sum of
eral green leaf volatiles (GLVs; e.g., hexenol, hexenyl ac-      OH reactivity. As illustrated in Fig. S4 and Table S1, no VOC
etate, hexanal), some of which are highly reactive towards       exceeds an average OH reactivity of 1 s−1 except for both
OH. In total, we found 31 BVOCs that are probably direct         isoprene and its oxidation product measured on m/z = 71
emissions according to the literature, which is a large number   (MVK/MACR/ISOPOOH).
compared to previous rainforest OH reactivity studies but a         Assuming that the remaining unattributed OH reactivity
small number in comparison with a study that found 264 dif-      fraction here is significant despite being within the measure-
ferent VOCs in the emissions of tropical trees directly mea-     ment uncertainty (Fig. 4), 7 %–35 % of the total OH reactiv-
sured at the leaf/bark level (Courtois et al., 2009). However,   ity (seasonal averages) remains unexplained here. This frac-
the most reactive among the directly emitted BVOCs are not       tion was lowest in the dry season afternoons (4 %–11 %) –
expected to live long enough to reach the 80 m and higher        interestingly, the time of the day with the largest unattributed
observation platforms.                                           OH reactivity in Nölscher et al. (2016). This is also the time
   The sum of GLVs contributed 5 %–8 % of total OH reac-         with the largest OVOC reactivity, which explains why clo-
tivity. Monoterpenes and sesquiterpenes contributed on av-       sure could be significantly improved for the afternoons here
erage 2 %–7 % and 0.1 %–0.9 % of total OH reactivity, re-        compared to in previous studies.
spectively. In summary, all groups of primary BVOCs ex-             Over all seasons, the unattributed fraction was largest and
cept for isoprene were smaller OH sinks than the summed          most variable in the early morning (Fig. 4, 28 %–39 %). This
OVOCs. However, it has to be noted that some OVOCs can           is when vegetation starts its diurnal photosynthetic activity
be primary plant emissions and do not necessarily have to be     with the largest CO2 uptake and stomatal conductance of the
the result of atmospheric oxidation processes (Harley et al.,    day (Pfannerstill et al., 2018). At this time of the day, emis-
2007; Schade and Goldstein, 2002; Rottenberger et al., 2004;     sion of primary BVOCs from storage pools and from buildup
Bracho-Nunez et al., 2013; Niinemets et al., 2014). Even iso-    within the leaf while the stomata are closed is likely, suggest-
prene oxidation products can be directly emitted to a certain    ing that part of the remaining unaccounted for OH reactiv-
extent (Jardine et al., 2013).                                   ity in this work could be due to direct plant emissions. The
   The OH reactivity of CO and methane (grouped as “inor-        number of different VOCs emitted by vegetation is poten-
ganics”, Fig. 4) amounted to 3 %–4 % of the total, with CO       tially much larger than the number we were able to measure
mainly varying under biomass burning influence. The OH           (Courtois et al., 2009). A peak in sesquiterpene mixing ra-
reactivity attributed to aromatics and sulfur- and nitrogen-     tios co-occurs with the early-morning peak in unattributed
containing VOCs (grouped under “others”) was small with          OH reactivity (Zannoni et al., 2020b), perhaps indicating a
0 %–1 % of the total.                                            common source of the sesquiterpenes and the unidentified
   The three individual species that contributed most to day-    reactants.
time OH reactivity were in both dry seasons and in the tran-        As the PTR-ToF-MS is not able to separate or identify
sition season isoprene > sum of methacrolein (MACR) +            all OVOC species and misses unstable intermediates, fur-
methyl vinyl ketone (MVK) + ISOPOOH > monoterpenes.              ther unmeasured secondary oxygenates could be responsible
In the wet season they were isoprene > sum of MACR +             for the remaining unattributed OH reactivity in this study.
MVK + ISOPOOH > sum of hexenol + hexanal.                        The fact that the unattributed OH reactivity fraction appears
                                                                 to be independent of altitude (Fig. S2) may be an indicator

Atmos. Chem. Phys., 21, 6231–6256, 2021                                            https://doi.org/10.5194/acp-21-6231-2021
E. Y. Pfannerstill et al.: Total OH reactivity over the Amazon rainforest 6241
Figure 5. (a) Average total OH reactivity and speciation at the ATTO tall tower by season and height a.g.l., daytime. (b) Same as (a),
nighttime. (c) VOC carbon concentration by compound class by season and height, daytime. (d) Same as (c), nighttime. (e) Summed VOC
mixing ratio (MR) by compound class, season, and height, daytime. (f) Same as (e), nighttime. The individual compounds included in each
class are listed in Table S1. Daytime was defined as PAR > 0 and nighttime as PAR = 0. S: September 2019; O: October 2018; J: June 2019;
M: March 2018.
for long-lived OVOC species contributing to the remaining In all seasons during the daytime, the OH reactivity con-
unattributed fraction. However, it has to be noted again that tribution of directly emitted BVOCs (isoprene, terpenoids)
the uncertainty in the measurement was generally larger here decreased with height (e.g., for isoprene from 51 % at 80 m
than the unattributed fraction. to 39 % at 320 m in October 2018), while the fraction
of oxidation products, i.e., OVOCs, increased (e.g., from
3.2.2 Vertical and diel trends in OH reactivity 31 % to 39 % in October 2018). Also, the number of oxy-
speciation gen atoms in OVOCs increased with height, while the
OH reactivity fraction of non-oxygenated Cx Hy VOCs de-
OH reactivity speciation at the ATTO tall tower reveals creased, as shown in Fig. 6a–d. This is due to the in-
height-related trends (Fig. 5a, b; Table 1). creasing average photochemical age of the air mass with
https://doi.org/10.5194/acp-21-6231-2021 Atmos. Chem. Phys., 21, 6231–6256, 20216242 E. Y. Pfannerstill et al.: Total OH reactivity over the Amazon rainforest
Table 1. Overview of average measured total and speciated OH reactivity and unattributed (missing) fraction of total OH reactivity by season
and measurement height, separated by day and night. Values shown are averages ± standard deviations. The chemical species attributed to
each group are listed in Table S1. For an explanation of unattributed or speciated OH reactivity, refer to Sect. 2.5. MTs: monoterpenes; SQTs:
sesquiterpenes; GLVs: green leaf volatiles; OVOCs: oxygenated VOCs.
OH reactivity (s−1 )
Inorganic Unattributed Measured total OH
Isoprene MTs SQTs GLVs OVOCs Other VOCs trace gases fraction reactivity (s−1 )
March 2018
Day- 80 m 8.69 ± 3.90 1.62 ± 0.29 0.16 ± 0.02 1.11 ± 0.15 5.56 ± 0.70 0.15 ± 0.02 0.66 ± 0.02 24 ± 19 % 23.70 ± 6.52
time 150 m 7.65 ± 3.64 1.56 ± 0.27 0.12 ± 0.02 1.12 ± 0.17 5.61 ± 0.62 0.15 ± 0.02 0.62 ± 0.02 28 ± 21 % 23.51 ± 6.86
320 m 6.33 ± 2.93 1.47 ± 0.25 0.11 ± 0.01 1.12 ± 0.17 5.92 ± 0.68 0.15 ± 0.02 0.56 ± 0.02 26 ± 21 % 21.56 ± 6.18
Night- 80 m 5.42 ± 1.93 1.43 ± 0.17 0.14 ± 0.02 1.12 ± 0.06 5.55 ± 0.88 0.15 ± 0.03 0.66 ± 0.01 27 ± 23 % 20.02 ± 4.64
time 150 m 6.13 ± 2.12 1.42 ± 0.13 0.11 ± 0.01 1.12 ± 0.06 6.89 ± 0.59 0.15 ± 0.03 0.62 ± 0.00 23 ± 24 % 20.10 ± 3.40
320 m 5.92 ± 2.10 1.36 ± 0.13 0.10 ± 0.01 1.12 ± 0.06 6.26 ± 0.55 0.16 ± 0.03 0.56 ± 0.00 23 ± 23 % 20.00 ± 3.82
October 2018
Day- 80 m 14.27 ± 7.23 1.21 ± 0.58 0.09 ± 0.05 1.48 ± 0.50 8.78 ± 3.07 0.75 ± 0.12 0.80 ± 0.05 2 ± 25 % 28.05 ± 7.92
time 150 m 12.51 ± 5.67 0.97 ± 0.44 0.06 ± 0.03 1.37 ± 0.38 9.13 ± 2.65 0.72 ± 0.10 0.69 ± 0.03 7 ± 22 % 27.50 ± 6.71
320 m 9.98 ± 5.05 0.74 ± 0.39 0.04 ± 0.03 1.42 ± 0.38 10.06 ± 2.38 0.72 ± 0.10 0.63 ± 0.04 11 ± 26 % 25.64 ± 6.04
Night- 80 m 7.80 ± 5.28 0.58 ± 0.30 0.06 ± 0.04 1.45 ± 0.52 7.91 ± 3.52 0.72 ± 0.07 0.82 ± 0.07 13 ± 32 % 22.20 ± 5.12
time 150 m 7.26 ± 3.94 0.48 ± 0.22 0.04 ± 0.03 1.38 ± 0.40 8.59 ± 3.09 0.67 ± 0.07 0.72 ± 0.05 16 ± 27 % 22.80 ± 5.21
320 m 6.99 ± 3.92 0.46 ± 0.23 0.03 ± 0.02 1.38 ± 0.38 9.21 ± 3.09 0.65 ± 0.09 0.65 ± 0.05 15 ± 29 % 22.94 ± 4.75
June 2019
Day- 80 m 6.92 ± 3.88 1.13 ± 0.75 0.16 ± 0.12 1.41 ± 0.72 4.17 ± 1.94 0.07 ± 0.05 0.62 ± 0.03 27 ± 27 % 19.85 ± 6.15
time 150 m 5.59 ± 3.37 1.02 ± 0.77 0.14 ± 0.11 1.40 ± 0.79 4.17 ± 1.77 0.07 ± 0.05 0.59 ± 0.03 34 ± 28 % 19.55 ± 5.50
320 m 4.78 ± 3.26 0.99 ± 0.77 0.14 ± 0.11 1.37 ± 0.70 4.51 ± 1.70 0.07 ± 0.05 0.52 ± 0.03 30 ± 32 % 17.64 ± 5.48
Night- 80 m 3.33 ± 1.81 0.83 ± 0.69 0.15 ± 0.12 1.26 ± 0.68 3.38 ± 1.47 0.06 ± 0.04 0.62 ± 0.02 35 ± 35 % 14.93 ± 2.95
time 150 m 3.07 ± 1.61 0.77 ± 0.67 0.13 ± 0.11 1.24 ± 0.66 3.72 ± 1.44 0.06 ± 0.04 0.58 ± 0.02 37 ± 36 % 15.19 ± 2.16
320 m 2.73 ± 1.61 0.74 ± 0.64 0.13 ± 0.10 1.23 ± 0.63 4.13 ± 1.38 0.06 ± 0.04 0.51 ± 0.02 33 ± 38 % 14.32 ± 2.42
September 2019
Day- 80 m 13.22 ± 6.98 1.21 ± 0.46 0.09 ± 0.02 1.67 ± 0.41 7.85 ± 2.44 0.03 ± 0.01 0.79 ± 0.03 15 ± 22 % 29.13 ± 10.78
time 150 m 10.69 ± 5.81 1.02 ± 0.41 0.08 ± 0.02 1.40 ± 0.36 7.14 ± 2.02 0.03 ± 0.00 0.75 ± 0.03 14 ± 29 % 24.68 ± 9.80
320 m 8.80 ± 5.04 0.87 ± 0.37 0.07 ± 0.02 1.43 ± 0.51 7.17 ± 1.88 0.03 ± 0.01 0.68 ± 0.03 18 ± 31 % 23.20 ± 9.59
Night- 80 m 5.57 ± 3.37 0.67 ± 0.25 0.07 ± 0.02 1.43 ± 0.41 5.98 ± 1.85 0.03 ± 0.01 0.78 ± 0.05 17 ± 36 % 17.85 ± 5.96
time 150 m 6.12 ± 3.32 0.66 ± 0.22 0.07 ± 0.02 1.38 ± 0.37 6.27 ± 1.84 0.03 ± 0.01 0.74 ± 0.06 9 ± 41 % 17.24 ± 5.45
320 m 4.94 ± 2.68 0.57 ± 0.19 0.06 ± 0.02 1.35 ± 0.36 6.27 ± 1.44 0.03 ± 0.01 0.68 ± 0.06 9 ± 45 % 15.67 ± 4.55
height, which increases the abundance of OVOCs relative (March 2018) and higher in the transition season (June 2019)
to primary BVOCs such as isoprene (Karl et al., 2009). and dry seasons (October 2018, September 2019). This sea-
Figure 6e illustrates the increasing photochemical age of sonality in ratio corresponds to the seasonal differences
air towards the top of the tower by showing ratios of in solar irradiation with a higher OH production rate in
isoprene and monoterpene oxidation products vs. precur- the dry season and thus increased photochemistry. The low
sors. The monoterpene oxidation products / monoterpenes MTO / MT ratio in September 2019 was due to similar con-
(MTO / MT) ratios are generally lower than the isoprene centrations of oxidation products despite higher monoter-
oxidation products / isoprene ratios (IsopO / Isop) because pene concentrations than in June 2019.
the oxidation of isoprene with OH is faster than that of the In order to compare the relevance of the different VOC
average monoterpene. For the ATTO monoterpene mixture classes for the carbon cycle with their relevance as OH sinks,
as identified by TD-GC-ToF-MS (Table S1), the ratio of Fig. 5c and d show carbon concentration. If the carbon con-
k(OH + isoprene) / k(OH + monoterpenes) was around 1.38. centration is considered instead of the OH reactivity, the frac-
In agreement with this difference in OH oxidation veloc- tion of OVOCs (daytime 52 %–66 %) dominates over the iso-
ity, the ratio (IsopO / Isop) / (MTO / MT) was between 1.01 prene fraction (daytime 12 %–27 %) at every height. The in-
(80 m, rainy season) and 2.34 (80 m, dry season). tense solar irradiation, high temperature, and humidity in the
Figure 6 also shows seasonal variability in the oxidation tropical rainforest environment lead to rapid conversion of
state and oxidation product / precursor ratios. Fractions of primary BVOCs to secondary oxygenated compounds (Karl
highly oxygenated VOCs (Fig. 6a–d) and oxidation prod- et al., 2009). Our results indicate that a considerable part of
uct / precursor ratios (Fig. 6e) were lowest in the rainy season the BVOCs directly emitted by vegetation is already oxidized
Atmos. Chem. Phys., 21, 6231–6256, 2021 https://doi.org/10.5194/acp-21-6231-2021You can also read