Photocatalytic Detoxication of Antibiotic- and Bacteria-Contaminated Water using Cobalt-Doped Ni-Zn Ferrites Magnetic Separable Nanopowders
←
→
Page content transcription
If your browser does not render page correctly, please read the page content below
Photocatalytic Detoxi cation of Antibiotic- and Bacteria-Contaminated Water using Cobalt-Doped Ni–Zn Ferrites Magnetic Separable Nanopowders Faisal Suleiman Mustafa Eastern Mediterranean University: Dogu Akdeniz Universitesi Akeem Adeyemi Oladipo ( akeem.oladipo@gmail.com ) Dogu Akdeniz Universitesi https://orcid.org/0000-0003-3715-5922 Zirar M Mizwari Erbil Polytechnic University Mustafa Gazi Eastern Mediterranean University: Dogu Akdeniz Universitesi Research Article Keywords: Environmental pollution, antibiotic decontamination, Ni-Zn spinel ferrites, bactericidal e ciency, UV-photocatalysis, Cobalt doped nanopowders DOI: https://doi.org/10.21203/rs.3.rs-650772/v1 License: This work is licensed under a Creative Commons Attribution 4.0 International License. Read Full License
1   Photocatalytic Detoxification of Antibiotic- and Bacteria-Contaminated Water
 2   using Cobalt-Doped Ni–Zn Ferrites Magnetic Separable Nanopowders
 3
 4   Faisal Suleiman Mustafa1, Akeem Adeyemi Oladipo1*, Zirar M Mizwari2,3, Mustafa Gazi1
     1
 5     Polymeric Materials Research Laboratory, Department of Chemistry, Faculty of Arts and
 6   Sciences, Eastern Mediterranean University, Famagusta TR North Cyprus, via Mersin 10,
 7   Turkey.
     2
 8     Department of Medical Laboratory Technology, Shaqlawa Technical College, Erbil Polytechnic
 9   University, Erbil, Iraq
     3
10     Rwandz Private Technical Institute, Erbil, Iraq.
11
12   *Corres. authors: akeem.oladipo@emu.edu.tr | akeem.oladipo@gmail.com (AA Oladipo)
13   AA Oladipo: https://orcid.org/0000-0003-3715-5922
14   FS Mustafa: https://orcid.org/0000-0003-0685-0025
15   M Gazi: https://orcid.org/0000-0001-7736-752X

16   Abstract

17   Here, metronidazole (MZ) antibiotic degradation and bactericidal efficacy of Co–Ni0.5Zn0.5Fe2O4
18   (Co–NZF) with and without photoactivation by UV light is reported as a viable cost-competitive
19   water disinfection solution. Co–NZF has a total pore volume of 0.298 cm3 g−1, a specific surface
20   area of 70.2 m2 g−1 and sufficiently high magnetic properties (80.35 emu g−1). After 360 min of
21   UV–assisted irradiation at pH 3, 10 mg Co–NZF, and 4 mM H2O2, the maximum MZ degradation
22   was reached (92.8%). The adsorption result of 10 mg Co–NZF in the dark for 12 h resulted in
23   70.2% MZ removal, whereas MZ self-degradation was significantly minimal in a blank trial. In
24   the presence of interfering anions and very high molecular weight tylosin antibiotic, Co–NZF
25   maintained 51.7–75.4% degradation efficiency. The effect of the Co–NZF dosage on the viability
26   of Staphylococcus aureus and Escherichia coli strains showed that 15 mg of the catalyst was
27   sufficient to cause bactericidal activity after 180 min in the presence of UV light, while 25 mg is
28   needed under dark conditions. In addition, when compared to Escherichia coli strains, Co–NZF
29   showed higher inhibition against Staphylococcus aureus in time-kill experiments under dose
30   variation.

31

32   Keywords: Environmental pollution; antibiotic decontamination; Ni-Zn spinel ferrites;
33   bactericidal efficiency; UV-photocatalysis; Cobalt doped nanopowders
34
35

                                                     1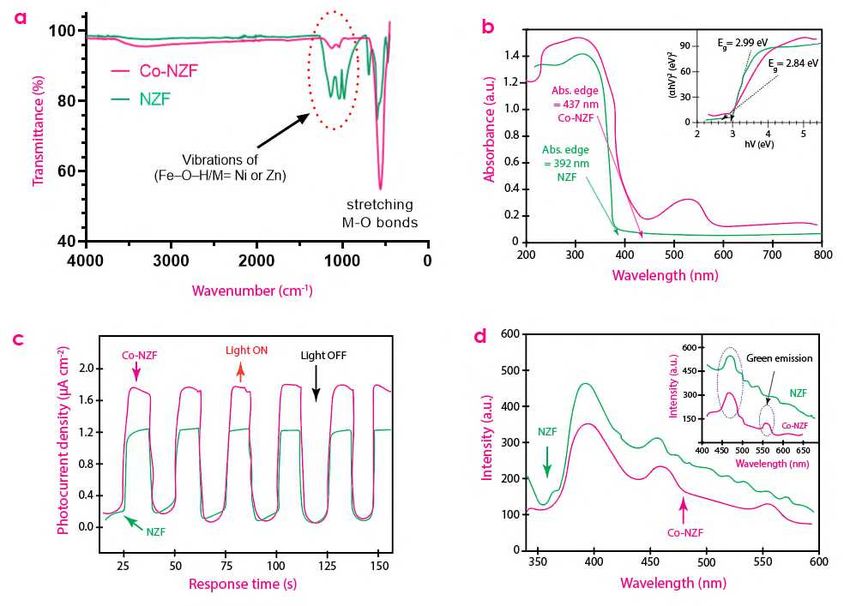
36   Introduction
37
38   Pharmaceutical antibiotics are becoming increasingly important globally due to their effectiveness

39   in preventing or treating infections in humans and promoting animal growth (Serna-Galvis et al.

40   2017; Tran et al. 2019; Azalok et al. 2021ab). The increasing demand for veterinary antibiotics is

41   worrying (Roberts and Zembower 2021), considering the rise in the number of people owning pets

42   like dogs and cats during this pandemic, numerous human diseases, and growing global demand

43   for animal protein for human consumption. Since most antibiotics are poorly absorbed by humans

44   and livestock, this widespread use of antibiotics raises the risk of significant quantities of residual

45   antibiotics ending up in the environment (Li et al.2015; Estrada-Flórez et al. 2020; Chan et al.

46   2020).

47            Antibiotic resistance bacteria and antibiotic-resistant genes are becoming more common

48   as antibiotics and their residues become more prevalent in the ecosystem (Luo et al. 2010;

49   Abureesh et al. 2018). This is in line with the findings of Luo et al. (2010), who noted that the

50   relative abundance of antibiotic-resistant genes (i.e., sul1&2/16S-rDNA) in the China Haihe River

51   is linked to total sulfonamide antibiotic concentrations. The key threat posed by these antibiotic-

52   resistant bacteria and genes is a rise in pathogenic bacteria, posing a serious threat to humans.

53   According to the World Health Organization (WHO, 2019), at least 700,000 people die each year

54   as a result of drug-resistant diseases, and the United States CDC (Centers for Disease Control and

55   Prevention) estimates that at least 30,000 people die each year in the United States as a result of

56   antibiotic-resistant diseases (Dadgostar 2019).

57            Metronidazole (MZ) is one of these antibiotics that is commonly used to treat anaerobic

58   bacterial infections, various protozoa, and Giardia infections in dogs and cats, as well as being

59   mixed with poultry and fish feeds to aid weight gain (Bashiri et al. 2020; Fakhravar et al. 2020;

                                                       2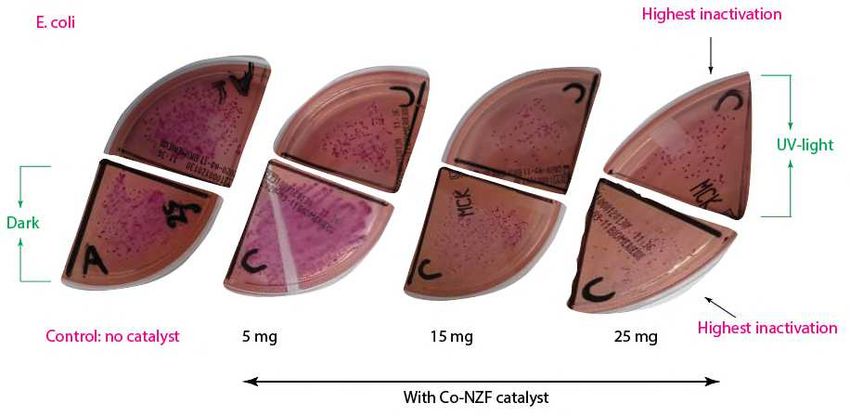
60   Azalok et al. 2021a). MZF has been detected at concentrations ranging from 0.65 to 28.4 μg/L in

61   surface water and groundwater in recent years (Oladipo et al. 2018). Its excessive use by humans

62   and pets, as well as its high solubility (~10 mg L−1 at 25oC in water) and emission of residues and

63   metabolites, has resulted in its saturation in the environment (Tran et al. 2019; Hena et al. 2020,

64   2021). The removal of MZ residues and metabolites from aqueous environments is critical because

65   antibiotic resistance caused by the overuse of antibiotics is becoming a global health threat,

66   resulting in higher medical costs and mortality (Varma et al. 2020a). Physical and biological

67   methods have been used in the past to eliminate antibiotics. However, physical methods such as

68   adsorption can adsorb the pollutant and then move it to an adsorbent surface, which involves more

69   disposal (Oladipo et al. 2018). MZ's antibacterial properties, complex structure, and high

70   molecular weight limit the effectiveness of biological methods for its removal.

71          Because of its low cost, higher performance, strong oxidation potential, and faster reaction

72   rates, semiconductor photocatalysis is a viable and environmentally friendly solution for removing

73   antibiotic and bacteria contamination from water (Aali et al. 2019; Asadi et al., 2019; Tran et al.

74   2019ab; Varma et al. 2020b; Azalok et al. 2021ab). In recent years, single metal oxide

75   semiconductors such as In2O3, TiO2 and ZnO have been widely applied and considered efficient

76   to eliminate hazardous contaminants in wastewater owing to their cost-effectiveness, oxidative

77   potential and catalytic stability for widespread environmental applications (Elmolla et al. 2010;

78   Bokare et al. 2013; Tran et al. 2019b). However, the wide bandgap (3.2 eV) and high

79   recombination rate of the aforementioned single metal oxide semiconductors limit their

80   photoresponses in the UV region (4–5% of solar spectrum) and minimize photocatalytic reactions,

81   respectively (Oladipo et al. 2019; Zhao et al. 2020). Apart from that, their separation from the

82   reaction system after spent is a problem.

                                                     3
83                In recent years, mixed metal oxide spinel ferrites (MxM1-xFe2O4, where M is a

 84   different metal cation i.e. Ni, Mg, Ca, Zn, Ag, Co, Cr)-based semiconductors have sparked a lot

 85   of interest in the field of photocatalysis because of their diverse optoelectronic properties and

 86   topological metal sites structure (Manikandan et al. 2015; Kefeni and Mamba 2020); and have

 87   been applied to decompose varieties of organic pollutants and inactivate bacteria during water

 88   treatment of wastewater (Chen et al. 2017; Asadi and Moeinpour 2019; Tsvetkov et al. 2019).

 89   Particularly, spinel Ni–Zn ferrites are particularly appealing for wastewater decontamination

 90   because of their small bandgap (2–2.5 eV), intrinsic redox chemistry, tunable electronic properties,

 91   and topologically organized metal sites (Qasim et al. 2015; Aali et al. 2019; Nag et al., 2020). Aali

 92   et al. (2019) synthesized Ni0.5Zn0.5Fe2O4 photocatalyst using a solution combustion synthesis

 93   technique and observed 85% methylene blue dye photodegradation and 100% bacteria growth

 94   inhibition against E. coli and S. aureus strains, respectively, with a minimum inhibitory

 95   concentration of 0.25 mg/mL and 0.125 mg/mL.

 96            Ferrites are also chemically stable, magnetically simple to separate, and inexpensive. It

 97   was discovered that doping or combining with other metal oxide semiconductors improved the

 98   ferrites' adsorption ability, specific surface area, and light-driven photoactivity (Qasim et al. 2015;

 99   Ifebajo et al. 2020; Nag et al. 2020). Doping the photocatalyst with high conductivity metal ions

100   like Co, Ag, and Pt induces highly efficient electron mobility and delays the recombination step

101   of photo-generated electrons/holes, resulting in increased photocatalyst degradation operation

102   (Sinha 2021; Asadi and Moeinpour 2019; Chahal et al. 2020). For example, Sinha 2021 reported

103   that by doping Bismuth-based ferrite with Co dopant, the crystallite size of the nanostructured

104   material was reduced and the bandgap energy was increased from 2.07 eV to 2.43 eV, resulting in

105   increased photocatalysis and remarkable optoelectronic activity. Motivated by the above

                                                        4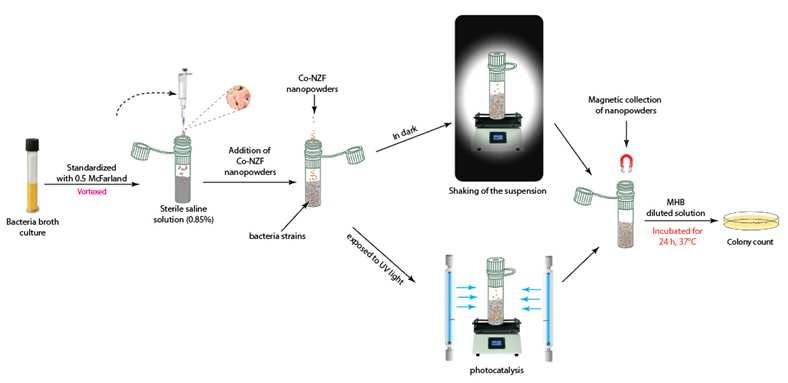
106   considerations, we designed a high-performance light responsive photocatalyst for antibiotic water

107   remediation by doping Co onto Ni0.5Zn0.5Fe2O4 nanoparticles. Since cobalt is a hard magnetic

108   material with larger atomic radii, it affects the oxygen position, the vacancy parameter, and the

109   magneto-crystalline anisotropy constant (Debnath et al. 2021), charge transfer efficiency (Sinha

110   2021), and intrinsic coercivity of the pristine ferrite.

111          For the first time, a Co-doped Ni0.5Zn0.5Fe2O4 (Co–NZF) photocatalyst was synthesized

112   through two-step but simple protocols to decontaminate metronidazole antibiotic water and

113   inactivate bacteria strains under UV irradiation. In the presence of other antibiotics or salts as

114   interference, the photocatalytic activity of Co–NZF was investigated. Based on the experimental

115   findings, active species trapping, and theoretical electronic structure estimation, the results

116   obtained are remarkable, and a potential degradation mechanism is highlighted. Since it can

117   degrade organics and inactivate bacterial strains, Co–NZF is expected to have a bright future in

118   the water treatment industry, reducing human reliance on chlorine. It's also worth noting that,

119   because of its magnetic properties, Co–NZF was easily and quickly isolated by an external magnet

120   after repeated reuse cycles.

121

122   Experimental section

123   Reagents

124   Analytical grade reagents were used without purification. Cobalt (II) nitrate hexahydrate

125   (Co(NO3)2.6H2O), Nickel (II) sulfate hexahydrate (NiSO4.6H2O), hydrochloric acid (HCl, 37%),

126   Zinc (II) sulfate heptahydrate (ZnSO4.7H2O), ethanol, Iron (III) chloride hexahydrate

127   (FeCl3.6H2O), acetic acid, metronidazole antibiotic (MZ) and sodium hydroxide (NaOH).

128

                                                         5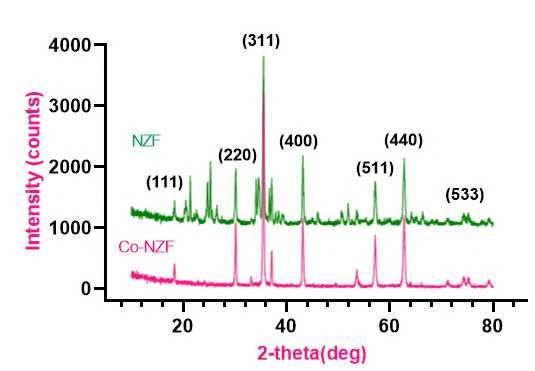
129 Synthesis of Co-doped Ni0.5Zn0.5Fe2O4
130 To start, the co-precipitation method was used to synthesize Ni0.5Zn0.5Fe2O4 (NZF) nanoparticles
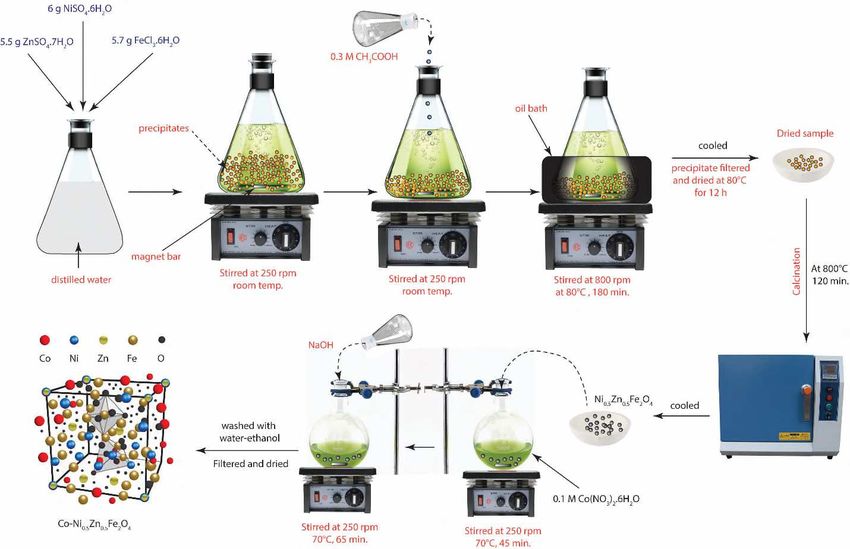
131 as shown in Scheme 1 (Mustafa and Oladipo, 2021). In 120 mL distilled water, 5.5 g ZnSO4.7H2O,
132 6 g NiSO4.6H2O, and 5.7 g FeCl3.6H2O were dissolved. The solution was stirred at 250 rpm
133 continuously until it became homogeneous, then 20 mL of 0.3 M acetic acid was added to prevent
134 particle aggregation. The reaction flask was then transferred to an oil bath and vigorously stirred
135 at 800 rpm for 180 min at 80°C. The solution was cooled and dried overnight at 80°C before being
136 calcined in a muffle furnace for 120 min at 800°C. Ni0.5Zn0.5Fe2O4 obtained was washed several
137 times with distilled water and dried. The chemical reaction for the formation of Ni0.5Zn0.5Fe2O4 is
138 shown as follows:
139 Co-precipitation stage:
140 0.5Ni 2 0.5Zn 2 2.0Fe 3 8OH 0.5 Ni(OH)2 0.5Zn(OH)2 2.0 Fe(OH)3
141 Ferritization stage:
142 0.5 Ni(OH)2 0.5Zn(OH)2 2.0 Fe(OH)3 Ni 0.5 Zn 0.5 Fe 2 O 4 nH 2 O 4 n H 2 O
143 Following that, Co–Ni0.5Zn0.5Fe2O4 was prepared by mixing 5 g of NZF with 50 mL of 0.1
144 M Co(NO3)2.6H2O; then stirred the solution at 250 rpm at room temperature for 45 min. The
145 reaction temperature was then raised to 70°C, and 30 mL of 75 mM NaOH was added dropwise to
146 the mixture and stirred for another 60 min. The precipitate was filtered, washed with water-50%
147 ethanol mixture several times then dried at 100°C for 24 h. The final product was ground and
148 sieved to a uniform size then labelled (Co–NZF).
6149
150 Scheme 1: Schematic illustration of the synthesis of Co–Ni0.5Zn0.5Fe2O4
151 Characterizations
152
153 The Co–NZF was characterized by UV–vis diffuse reflectance spectroscopy (DRS) using a UV–
154 2450 spectrometer (Shimadzu, Japan) from 200 nm to 800 nm. The SEM-EDX was acquired by
155 JSM-6390 scanning electron microscope-coupled EDX (JEOL, Japan). The X-ray powder
156 diffraction (XRD) patterns were recorded using X-ray diffractometer Bruker D8 (Bruker-AXS,
157 Ettlingen, Germany) with a Cu Kα (λ = 1.54187 Å) monochromatic radiation at 40 kV and 30 mA.
158 The measurement was recorded at 2θ = 5−70° at a rate of 2° min−1 and the crystalline phases were
159 clarified using standard JCPDS files. The electrochemical impedance spectroscopy (EIS) was
160 investigated using the Palmsens Sensit smart potentiostat (PalmSens BV, Netherlands) in the
161 frequency range of 50 Hz–200 kHz at room temperature. Fourier Transform Infrared (FTIR)
7162 spectra were recorded in the range 4000–400 cm−1 using an FTIR-8700 spectrophotometer
163 (Perkin-Elmer, Japan). Photoluminescence spectrum (PL) was collected by fluorescence
164 spectrophotometer F-7000 (Hitachi High-Tech, Japan) with optical radiation at λ= 340 nm. At
165 room temperature, a MicroSense Vibrating Sample Magnetometer (Model 10, MicroSense USA)
166 was used to investigate the magnetic properties of samples ranging within ±10,000 Oe.
167
168 Photocatalytic degradation procedure
169
170 A 200 mg/L stock solution of the metronidazole antibiotic was prepared by dissolving it in
171 deionized water. The stock solution was kept at 5°C until it was required. Diluting the stock
172 solution with a background solution yielded working solutions with concentrations ranging from
173 10 to 100 mg/L. The Co–NZF photocatalytic activity was investigated in a batch-type customized-
174 stirred pyrex-flask reactor under UV light (18 W, 385 nm; T8W5, China).
175 To investigate the effect of pH (3–10) on the performance of the catalyst, desired Co–NZF
176 dose was dispersed in 25 mL of 50 mg L–1 MZ solution in the reactor, which was then stirred for
177 30 min under darkness to achieve the adsorption/desorption state before UV light irradiation for
178 360 min. The initial pH values of the solutions were adjusted with 0.1 M HCl/NaOH. The Co–
179 NZF particles were separated from the solution using an external magnet periodically, and 2 mL
180 of the sample was taken and analyzed for residual MZ concentration using UV–vis spectroscopy
181 (T90+ UV-vis spectrophotometer PG Instruments Ltd, UK) at the λmax=320 nm with a 1 cm path
182 length quartz cell. The concentrations were determined using a linear regression equation (y
183 =0.0375x + 0.1967) derived from a calibration curve of MZ absorption plotted over a range of
184 concentrations with an R2 of 0.998. The photocatalytic performance of MZ was examined by
185 varying parameters such as initial MZ concentration (10–100 mg/L), oxidant concentration
8186 (H2O2/K2S2O4; 4–7 mM) and dosage of Co–NZF (10–50 mg). To test the stability and reusability
187 of Co–NZF, the spent photocatalyst was eluted with base-spiked distilled water, dried at 40oC, and
188 reused several times.
189 During the photocatalytic reaction, trapping experiments were carried out to
190 investigate the contribution of radicals and active species. Before adding the Co–NZF, the MZ
191 solution was spiked with 5 mM 1,4-benzoquinone (BQ), tert-butyl alcohol (t-BuOH), methanol
192 and sodium oxalate (NaOx) to scavenge •O2−, •OH, •SO4− and h+ scavengers, respectively. The
193 catalytic activity of Co–NZF was also studied when 50 mg L–1 MZ interfered with antibiotics (1
194 mg L–1 Tylosin and tetracycline) and various salts (0.1 M of NaCl, KNO3 and Na2SO4).
195 Bacterial inactivation activities of Co–Ni0.5Zn0.5Fe2O4 via time-kill assays
196 Time-kill assays were used to investigate the antimicrobial efficacy of Co–NZF against
197 Staphylococcus aureus (S. aureus, ATCC 2921) and Escherichia coli (E. coli, ATCC 25922) as
198 shown in Scheme 2. In Muller Hinton Agar (MHA, Biomerieux, France) and MacConkey agar
199 (MCA, Biomerieux, France), S. aureus and E. coli cultures were incubated overnight at 37°C,
200 respectively. Mueller Hinton Broth (MHB, Merck, Germany) was used to prepare the bacterial
201 stock solutions, then standardized using 0.5 McFarland scale and diluted to 1 × 10⁷ CFU mL–1
202 using sterile saline solution (0.85%) as shown in Scheme 2. 5–25 mg of Co–NZF was mixed with
203 the bacterial solutions and agitated at 200 rpm either in the dark, or were exposed to the UV light
204 (λmax= 365 nm) at a distance of 4 cm. Flasks containing bacterial solutions that did not contain Co–
205 NZF were used as a control group. Periodically, 10 mL of each sample was withdrawn and diluted
206 with 90 mL of MHB. Finally, the diluted solutions were dropped onto the agar plate and incubated
207 for 24 h at 37°C. Following that, the colonies were counted, and the bacteria concentrations (CFU
208 per mL) and bacteria-killing efficacy (A%) were calculated using Eqs. 4 and 5.
9209
210
211 Scheme 2: Outline of the bacteria killing due to the catalytic reaction of Co–Ni0.5Zn0.5Fe2O4
212
213
214 Data analysis
215
216 Each experiment was replicated twice, with an average outcome of ±1.5% error. The photocatalytic
217 degradation efficiency, η (%), degradation kinetics and the electrical energy per order, EEO (kWh
218 m−3 order−1) required to decrease the concentration of MZ were calculated following Eqs. 1–3:
1 Ct
219 100 (1)
C0
Ct
220 ln kobst (2)
Co
1000Pt C
221 EEO log o (3)
V 60 Ct
10No.of colonies dilution factor
222 CFUmL1 (4)
Volume of culture plated
No.of CFUs in control group No.of CFU in exp.group
223 A (%) 100 (5)
No.of CFU(control group)
224 where Ct and Co (mg/L) denote the MZ concentrations at time t (min) and before the reaction,
225 respectively; while k (min−1) is the apparent rate constant, V (L) denotes the reaction volume, P is
226 the electrical power consumed during the process (kW) and t represents reaction time (min).
227 GraphPad Prism (ver.7, USA) was employed for data visualization.
228
229 Results and discussion
230 The NZF and Co−NZF FTIR spectra are shown in Fig. 1a. We used the abbreviations ν and δ to
231 denote stretching and bending vibrations, respectively, when interpreting infrared (IR) spectra.
232 Main assignments of IR wave-numbers are listed accordingly for NZF and Co−NZF;
233 NZF: 1145 – 983 cm−1 δ (Fe–O–H/M= Ni or Zn); 845−832 cm−1 ν (Fe–O–M); 578 cm−1 ν (M –
234 O/metal-oxygen tetrahedral (Fe ↔O)); 465 cm−1 ν (M – O/octahedral (Ni ↔ O and Zn ↔ O)); 415
235 – 600 cm−1 (characteristics bands of the spinel structure).
236 Co–NZF: 1153–1089 cm−1 δ (Fe–O–H); 476–469 cm−1 ν (M – O/octahedral and tetrahedral (Ni
237 ↔ O and Zn ↔ O)); 445 cm−1 ν (Co–O); 415 – 600 cm−1 (characteristics bands of the spinel
238 structure).
239 As previously stated, the tetrahedral and octahedral sites are strongly preferred by Zn and Ni atoms,
240 respectively. Fe3+ cations, on the other hand, can occupy octahedral and tetrahedral sites (Thakur
241 et al. 2016; Debnath et al. 2021). According to Fig.1a, the changes of IR spectra of the doped
242 catalyst compared to the undoped catalyst can be outlined as follows. The Fe–O–H absorption
243 bands in Co−NZF deviated marginally to long-wave regions and decreased in intensity, which is
11244 likely due to the transformation of bond lengths or particle enlargement and crystal structure
245 perfection as a result of Co doping onto NZF (Sivaranjani et al.2019; Ivanovskaya et al. 2009).
246 Furthermore, in the Co−NZF spectrum; the Fe ↔ O tetrahedral and the octahedral bands (Ni ↔ O
247 and Zn ↔ O) merged into a sharp peak centred at 473 cm−1. A new peak at 445 cm−1 was observed,
248 which was due to the stretching of the Co–O and confirmed the existence of Co atoms in the
249 Ni0.5Zn0.5Fe2O4 lattice. When the sample was sintered at 800°C, the stretching vibrations induced
250 by the C–O bond with peaks around 1091 –1143 cm−1 were noticeably weakened which is similar
251 to the observation reported by Thakur et al. 2016.
252
253 Fig.1: Characterization of NZF and Co−NZF (a) FTIR (b) UV–vis DRS (inset: band
254 energy gap from Tauc plots) (c) Transient photocurrent response (d) PL spectra.
255
12256 The UV–vis DRS absorption spectra of the NZF and Co−NZF over the wavelength range
257 of 200–800 nm are represented in Fig.1b. Both samples have high absorption in the ultraviolet
258 range; NZF, in particular, has an absorption in the UV region (345–396 nm) due to intrinsic band
259 transitions between the M+ cations and M+ – O2−, which is consistent with other studies (Qasim et
260 al. 2015; Asadi and Moeinpour 2019; Aali et al. 2019; Nag et al., 2020). NZF has an absorption
261 edge at 392 nm. The absorption edge of the Co−NZF wavelength region extends into the visible
262 region (437 nm), with an absorption enhancement in the region of 450–595 nm, which is due to
263 the interaction of the localized d–electrons of Co2+ and s– and p– electron of the host NZF (Kaphle
264 et al. 2019). The absorption intensity of Co−NZF is greater than that of NZF in the 300–800 nm
265 range, implying that it may have better catalytic activity in the UV and visible regions. The optical
266 band gap (Eg) of the samples was calculated using Eq.6 (Oladipo et al.2019; Oladipo 2021ab) to
267 be 2.84 eV and 2.99 eV for Co−NZF and NZF respectively.
1240
268 Eg (6)
AbsorpEdge
269 Note that doping with Co ions generates oxygen vacancies, which promotes the formation of Mx−1
270 from Mx (host metal ions) (Chahal et al. 2020; Kaphle et al. 2019). This raises the number of Mx−1
271 states, resulting in the creation of localized energy states closer to the conduction band and thus
272 lowering the bandgap (Saranya et al. 2014).
273 Fig.1c displays the light response profiles of the NZF and Co−NZF during multiple
274 irradiations of On/Off light. The photocurrent density increased rapidly when the irradiation light
275 was activated for both samples, then decreased to a constant value when the light was shut off. The
276 light response profiles of the NZF and Co−NZF during multiple irradiations of On/Off light are
277 shown in Fig.1c. When the irradiation light was turned on for both samples, the photocurrent
13278 density increased rapidly but decreased to a constant value when the light was turned off. Co−NZF,
279 in particular, showed a photocurrent response of 1.73 A cm–2, which is 1.4 times higher than NZF.
280 The photoluminescence (PL) technique was used to investigate the transfer and
281 recombination rate of the photogenerated charge carrier. Both samples had two emission bands
282 about ~360–485 nm, as shown in Fig.1d. The broad 389 nm emission originates from an exciton-
283 exciton collision mechanism from the recombination of the free excitons and is typically referred
284 to as UV band edge emission (Ahmad et al. 2020). At 468 nm, the broad blue-green emission band
285 is possibly due to the direct recombination of electrons in CB and holes in VB and oxygen defects
286 (Saranya et al. 2014). On doping NZF with Co, the emission peaks redshifted and more oxygen
287 defects were formed which resulted in a weak green emission band observed at ~559 nm. In
288 contrast to NZF, Co−NZF had a lower PL intensity; note that the lower the PL intensity, the lower
289 the e– and h+ recombination rate.
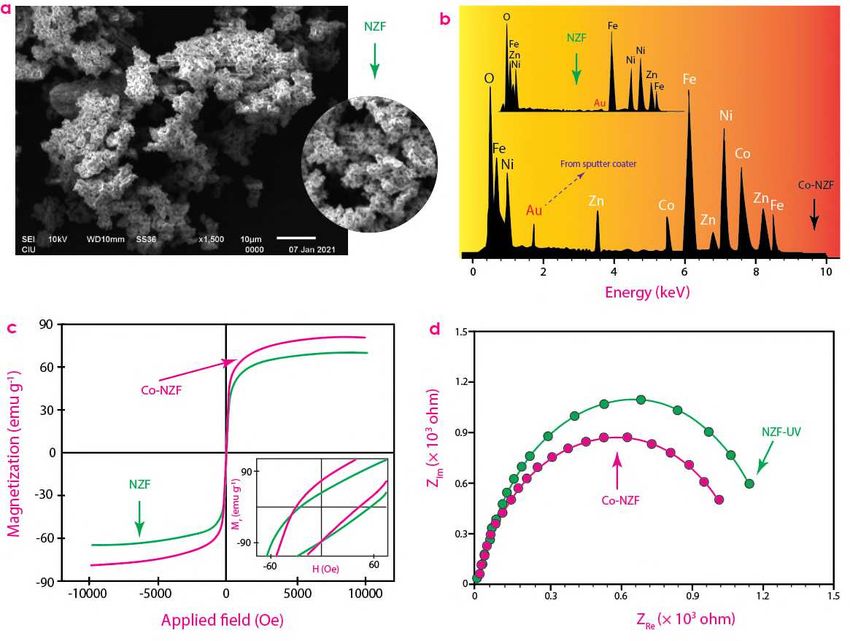
290 SEM micrographs of NZF and Co−NZF are shown in Fig.2a. When examined closely,
291 the Co−NZF has a spongy morphology with agglomerated irregular grain shapes which is
292 consistent with the SEM of Ni–Zn ferrite reported by Džunuzović et al 2015. The crystallites'
293 dipole interactions might have caused the agglomeration. The crystals are not completely
294 monodisperse, and the average particle size of the samples is found to be between 23 and 28 nm.
295 In both samples, several grain surfaces have hexagonal shapes and distorted edges, which is the
296 basic crystal cell unit of ferrites (Thakur et al. 2016; Mustafa and Oladipo 2021). The presence of
297 metal ions with compositions consistent with the predicted stoichiometry of Ni0.5Zn0.5Fe2O4 was
298 verified by energy-dispersive X-ray spectroscopy (EDX) analysis of the samples (Fig.2b). It's
299 worth noting that the Pd and Au peaks in the spectra correspond to the metallic coater used in the
300 experiments.
14301 Fig.2c depicts the magnetic hysteresis loop for NZF and Co−NZF samples at room
302 temperature. The magnetization results revealed ferromagnetic activity which is common for soft
303 magnetic material (Džunuzović et al 2015). NZF's saturation magnetization (Ms) is 79.28 emu g−1,
304 which is less than Co−NZF's (85.94 emu g−1); while these values are higher than the 57−78 emu
305 g−1 stated previously (Džunuzović et al 2015; Thakur et al. 2016). Because of the Co doping,
306 Co−NZF has a higher crystallinity and saturation magnetization moment than NZF. The Co which
307 is magnetic caused Fe3+ ions to migrate from tetrahedral to octahedral sites, disrupting ion
308 equilibrium and increasing magnetization. Co doping, on the other hand, resulted in a slight
309 increase in grain size in Co−NZF, with a lower coercivity (Hc) of 57.94 Oe than NZF (61.21 Oe).
310 The Mr/Ms varies from 0.935 to 0.969 for both samples, which is closer to the average value of 1
311 for single-domain ferromagnetic particles. An external magnet can easily extract Co−NZF from
312 aqueous solutions due to its high magnetic properties.
313 The electrochemical properties of the samples were investigated using impedance
314 spectroscopy. Semicircular arcs were observed in both NZF and Co−NZF due to grain boundary
315 conduction at low frequencies and high frequencies. The radius of the arc represents the interfacial
316 charge transfer resistance (Rct) in the EIS Nyquist plots in Fig.2d. Co doping resulted in increased
317 defects (vacancies), which led to a decrease in Co−NZF's resistance, as predicted by the PL study.
318 The decrease in resistivity can also be due to the reduction in the number of grain boundaries
319 caused by the increase in grain size in the Co−NZF (Džunuzović et al 2015; Mustafa and Oladipo
320 2021). The Co−NZF has a lower Rct value, indicating that it has a higher charge transfer efficiency
321 than NZF. Under UV irradiation, Co−NZF had the smallest semi-circle diameter and a
322 significantly lower Rct value than NZF, implying a greater separation of photogenerated electron-
15323 hole pairs and transfer efficiency, resulting in the highest photocatalytic activity against MZ
324 degradation.
325
326
327 Fig.2: (a) SEM images (b) EDX spectra (c) magnetic parameters and (d) EIS Nyquist plots of
328 NZF and Co−NZF.
329
330 Fig.3 shows the XRD pattern of NZF, with all major diffraction peaks corresponding to
331 the standard pattern of the cubic spinel structure of Ni0.5Zn0.5Fe2O4 ferrite (JCPDS# 52-0278,
332 JCPDS# 10-0325 and JCPDS# 08−0234) at the position of 2θ = 18.36°, 30.14°, 35.58°, 37.11°,
333 43.18°, 51.94°, 57.18°, 62.88°, 71.5° and 75.14° matching (111), (220), (311), (222), (400), (422),
16334 (511), (440), (620) and (533) Miller indices (Qasim et al. 2015; Džunuzović et al 2015; Thakur et
335 al. 2016; Nag et al. 2020).
336 Similar diffraction peaks were observed in Co−NZF. As a result, cobalt (Co2+) ion doping
337 in NZF ferrite does not affect the NZF spinel phase because cobalt occupies interstitial space in
338 the ferrite's cubic structure. However, other unidentified peaks between 21.14° − 27.5° disappeared
339 and there was a minor change towards the lower angle in the 2θ position for each peak, which may
340 be due to the replacement of Fe3+ having ionic radii of 0.65 Å by Co2+ with higher ionic radii of
341 ~0.74 Å (Debnath et al. 2021; Sinha 2021). According to the Debye Scherrer equation (D=0.9λ/β
342 cos θ), the average crystallite size of NZF and Co−NZF was estimated from the intense peaks
343 (220), (311) and (440) as 19.9 and 25.6 nm, respectively.
344
345 Fig.3: XRD patterns of the Co−NZF and NZF
346
347 Also, note that the Co−NZF exhibited higher crystallinity, slightly lower X-ray density,
348 decreased dislocation density and increased average lattice constant (Table 1) due to the
349 substitution of ions with smaller ionic radii in the ferrite structure by cobalt with larger atomic
17350 radii (~0.74 Å) (Debnath et al. 2021; Mustafa and Oladipo 2021). In addition, the strain has been
351 induced in the system as a result of lattice expansion, and the positive sign indicates tensile stress
352 (Chahal et al. 2020). Table 1 lists the textural characteristics of Co−NZF and NZF. According to
353 the findings, both samples have meso and micropores. However, the mesopore volume of Co−NZF
354 is ~1.4 times larger than that of NZF and its specific surface area is slightly lower which is likely
355 due to (i) the aggregation of small cobalt particles into larger bulk particles of Co during the doping
356 process (ii) owing to the doping of Co2+ (which is magnetic) onto NZF, the Co−NZF has a higher
357 magnetization saturation than the NZF, which further enhances its agglomeration. Ali et al. (2016)
358 also found that doping Ag onto a FeAlO sample reduced its surface area. Also, the specific surface
359 areas of NZF and Co−NZF were determined as 56.2 m2 g−1 and 44.0 m2 g−1 respectively based on
360 crystallite size. Since most of the grain boundaries in the crystallite are not accessible, these values
361 are significantly lower than those obtained using the BET. Since the particle size increased with
362 Co doping, the surface area of Co−NZF is less than that of NZF, which is consistent with the BET
363 results.
364
365 Table 1: Surface and crystal characteristics of NZF and Co−NZF
Parameters Notes a
NZF Co−NZF
Surface area and pore volume
SBET (m2g−1) Brunauer–Emmett–Teller specific surface area 73.5 70.2
obtained via N2 adsorp. isotherm at P/Po = 0.05–
0.35.
Vt (cm3g−1) Total pore volume measured at P/Po~ 0.99. 0.287 0.298
Vmic (cm3g−1) Micropore pore volume. 0.158 0.117
Vmes (cm3g−1) Mesopore volume obtained by deducting Vmic from 0.129 0.181
Vt.
XRD structural data
D (nm) Average crystallite size calculated through Debye 19.9 25.6
Scherer’s formula = k cos , k= 0.94; β=
FWHM.
δ×10−3 (nm−2) Dislocation density calculated from δ=1/D2 2.52 1.52
18ε×10−3 (nm−2) Lattice strain = 4 tan 2.11 2.56
X (%) % Crystallinity = Icrystal. peaks /(Icrystal. peaks + Iamorph. peaks). 66.8 69.9
a (nm) Average lattice constant 0.838 0.840
d (nm) Average lattice spacing 0.206 0.209
V (nm3) Volume of the cubic unit cell = a3 0.588 0.593
ρ (g cm−3) X-ray density = 8M N avogadro * V , M: molecular 5.37 5.33
mass
S (m2g−1) Specific surface area based on crystallite particle size 56.2 44.0
= 6000 D *
366
Magnetic parameters EDX parameters Wt. (%)
Samples Ms Mr Hc Mr/Ms Co Fe Ni Zn O
(emu g−1) (emu g−1) (Oe)
Co−NZF 85.94 80.35 57.94 0.935 7.2 49.7 12.9 13.3 16.9
a
NZF 79.28 76.81 61.21 0.969 0 51.3 13.7 15.6 19.4
a
367 Mustafa and Oladipo 2021
368
369
370
371
372
373
374 Evaluation of Co−NZF under varying experimental conditions
375 Note that NZF's performance is noticeably lower than Co−NZF's, which was achieved at a longer
376 reaction time in a series of tests. As a consequence, only Co−NZF findings are presented in this
377 article.
378 Effect of pH variation
379 When the pH of 50 mgL–1 MZ solution was varied in the absence and presence of oxidants (4 mM
380 H2O2 or 5 mM K2S2O8) at 200 rpm, a preliminary test was performed to evaluate the photocatalytic
381 degradation of MZ using 25 mg Co−NZF. The pH-dependent speciation of MZ (pKa =2.5) and
382 the surface chemistry of Co−NZF (pHpzc = 6.69; Fig.4a) are used to explain the MZ degradation
383 behaviour here. The Co−NZF degradation efficiency reached a maximum of 74.9% without an
384 oxidant at pH 3 then decreased steadily with increasing pH. MZ degradation reached 93.4% at pH
385 3 in the presence of H2O2 and Co−NZF, while when the solution pH was increased beyond pH 3,
386 MZ degradation decreased remarkably and reached 16.3% at pH 9. In the K2S2O8/Co−NZF system,
19387 maximum degradation was observed at pH 3 which decreased to 32.6% at pH 9 (Fig.4b). Except
388 in the presence of K2S2O8, the pH of the final solutions increased before remaining marginally
389 stable at pH 6.87.
390 The following is an interpretation of the removal behaviour as a function of pH variation:
391 the anionic MZ–, which are electron-deficient species, are dominant in the solution at pH 3 due to
392 its pKa and are electrostatically attracted to the positively charged Co−NZF+ (since the pH is less
393 than the pHpzc = 6.69), resulting in higher degradation efficiency (Fakhravar et al. 2020). The
394 higher degradation of MZ at acidic pH compared to that at pH 6 may likely be attributed to the
395 hydrolysis of MZ (Azalok et al. 2021b). The formation of •OH radicals, which can boost the
396 reaction rate and photocatalytic efficiency of the Co−NZF, is responsible for the higher
397 degradation observed in the presence of H2O2. MZ adsorption on the surface of Co−NZF (during
398 photocatalytic degradation) can occur through a combination of processes such as electrostatic
399 attraction, hydrogen bonding, and complex formation between MZ π-electrons and the Co−NZF
400 metal ions between pH 3 and 7. At pH 9, lower degradation efficiency occurred due to repulsion
401 between the negatively charged MZ–, hydroxyl ions and the negatively charged Co−NZF–. Other
402 researchers have identified similar photodegradation activities for MNZ (Farzadkia et al. 2015;
403 Bashiri et al. 2020); hence, subsequent studies were conducted at pH 3.
20Co−NZF
Co−NZF/H2O2
Co−NZF/K2S2O8
404
405 Fig.4: (a) pH point zero charge determination, and variation in (b) solution pH (c) Co−NZF dosage
406 (d) oxidant concentration. Reaction conditions: reaction time = 360 min; initial MZ conc. =
407 50 mgL–1 and MZ vol. =25 mL.
408
409
410
411 Variation in Co−NZF dosage and oxidant concentration
412 The degradation efficiency of 50 mgL–1 MZ and the final concentration as the dose of Co−NZF
413 was varied at pH 3 in the presence of 4 mM H2O2 are shown in Fig.4c. When the Co−NZF dosage
414 was increased from 10 mg to 35 mg, the degradation efficiency increased marginally from 92.8%
415 to 93.9%. When the Co−NZF dose was increased to 50 mg, the degradation efficiency decreased
416 slightly to 87.7%. The observed decreasing trend in degradation efficiency when the Co−NZF
417 dosage reached 50 mg is most likely due to one of three factors: (i) increased suspension turbidity
418 due to increased catalyst in the bulk, which resulted in decreased UV light penetration and
21419 photoactivation efficiency (Sathya et al. 2017; Bajorek et al. 2019; Oladipo 2021ab); (ii) the
420 aggregation of excess Co−NZF might decrease its effective surface area and adsorption of the MZ
421 species (Aram et al. 2020) or (iii) as the amount of catalyst in the suspension increased, photon-
422 activated Co−NZF species were deactivated by collision with excess Co−NZF, as shown in Eq. 7.
423
424 Co NZFactivated Co NZFexcess Co NZFdeactivated Co NZF (7)
425 Arghavan et al. 2021 reported a similar phenomenon when they used a nickel ferrite-
426 based nanocomposite to degrade metronidazole under simulated sunlight irradiation. They
427 observed an increase in activity from 0.005 to 0.04 gL−1 in catalyst dose, then a decrease at higher
428 catalyst loadings. In this study, further experiments were carried out using 10 mg of Co−NZF per
429 25 mL of MZ because there were no major variations in Co−NZF performance when 10 mg and
430 35 mg were used.
431 When the oxidants' initial concentrations were varied from 4 mM to 7 mM, the MZ
432 degradation efficiency is shown in Fig.4d. When H2O2 concentration was increased from 4 mM to
433 6 mM, MZ degradation efficiency decreased from 92.8% to 73.3%, then remained nearly
434 unchanged when 7 mM H2O2 was used. The decreasing trend is most likely due to an excess of
435 H2O2 in the system scavenging the produced •OH radicals, potentially resulting in less reactive
436 hydroperoxyl radicals (•OOH) (Azalok et al. 2021ab). Based on the findings, a concentration of 4
437 mM of H2O2 was chosen for subsequent experiments.
438 When the concentration of K2S2O8 was increased from 4 mM to 5 mM, MZ degradation
439 increased from 30.2% to 50.8%. Increased K2S2O8 concentration resulted in more oxidative
440 radicals (•SO4− and •OH), which favoured MZ degradation. However, the degradation efficiency
441 decreased to 25.8% when K2S2O8 concentration was elevated to 7 mM. This is likely due to the
22442 competitive consumption of the free •SO4− radicals by the excess K2S2O8 or generation of
443 comparatively weaker •SO5− (1.1 eV) (Chen et al. 2018); hence, the rate of degradation reduced.
444 Subsequent studies were carried out using 5 mM K2S2O8.
445
446 Variation in initial MZ concentration
447 The photocatalytic degradation efficiencies of MZ when the concentration was varied from 10 to
448 100 mgL–1 in the presence of 10 mg Co−NZF/4mM H2O2 per 25 mL of MZ at pH 3 are shown in
449 Fig.5a. The degradation efficiency shows an increasing pattern as the initial concentration of MZ
450 was increased from 10 to 50 mgL–1, and then dramatically decreased. The degradation efficiency
451 reached 92.8% after a 6 h reaction with a 50 mgL–1 MZ concentration; however when the MZ
452 concentration was increased to 100 mgL–1, it decreased to 52.3%. The lower degradation efficiency
453 observed at 100 mgL–1 of MZ is due to an insufficient number of reaction sites or active radicals
454 to satisfy the increasing MZ species, as the Co−NZF dosage remained constant.
455 The MZ degradation was investigated under optimized conditions. In preliminary
456 adsorption experiments conducted in the dark for 12 h using 10 mg Co−NZF, 70.2% MZ
457 adsorption was observed while MZ self-degradation was significantly negligible in a blank
458 experiment (without Co−NZF in the dark). As shown in Fig.5b, without the catalyst, 5.86% of MZ
459 was photolytically degraded (under UV irradiation alone), but when 4mM H2O2 and 5 mM K2S2O8
460 were added within 360 min, the degradation increased to 33.9% and 44.8%, respectively. After 6
461 h of UV irradiation in the presence of 10 mg Co−NZF and no oxidant, the MZ degradation
462 efficiency reached a peak of 68.6%. Even though the degradation efficiency in the dark is higher
463 than under UV, the UV synergistically stimulated Co−NZF, causing it to generate photoinduced
464 charge carriers and aided the degradation rate as compared to when it was dark.
23465 The 10 mg Co−NZF/H2O2/UV and 10 mg Co−NZF/K2S2O8/UV systems reached 92.8%
466 and 50.8% degradation, respectively. However, according to the kinetic studies shown in Fig.5c,
467 the Co−NZF/H2O2/UV system had a faster degradation rate and reached the maximum before 6 h.
468 When compared to photolysis (UV alone), H2O2/UV and K2S2O8/UV systems, the
469 photodegradation activity of Co−NZF/H2O2/UV increased remarkably by 15.8, 2.74 and 1.74
470 times, respectively. The increased performance is attributed to Co−NZF's activation of H2O2 that
471 generated •OH radicals to enhance the degradation of MZ as represented in Eqs. 8−10.
472 Co NZF(Eg 2.84eV) h Vb
UVlight
eCb (8)
473 eCb H2O2 OH OH (9)
474 hVb OH OH (10)
475 In comparison to using Co−NZF alone, the Co−NZF/K2S2O8 system showed less
476 degradation. K2S2O8 is available in the form of S2O82− in a wide pH range between 2 and 14 due
477 to its low pKa = −1.30 and may firmly attach to the positively charged catalyst's surface (pHpzc
478 =6.69) at pH 3, decreasing MZ adsorption for photocatalytic degradation. Based on these findings,
479 we can deduce that while photolysis and oxidants play minor roles in MZ degradation individually,
480 the synergistic effects of photocatalysis (Co−NZF/H2O2/UV) are critical.
24481
482
483 Fig.5: (a) Degradation efficiencies of Co−NZF based on initial MZ concentration (b) degradation
484 efficiencies of various processes (c) degradation of MZ as a function of UV irradiation time using
485 Co−NZF/H2O2 (inset: kinetic linear simulation curve). Reaction conditions: K2S2O8 = 5 mM;
486 H2O2 = 4 mM; Co−NZF dosage = 10 mg; MZ vol.= 25 mL; pH = 3 and 360 min.
487
488 The electrical energy consumed per order, coefficient of determination (R2) values,
489 treatment cost, half-life (t50%) corresponding to 50% MZ degradation efficiency and rate constant
490 (kobs, min−1) of the pseudo-first order model are listed in Table 2. The R2 values in the MTZ
491 concentration range studied were greater than 0.97, showing that the photocatalytic degradation of
492 MZ using Co−NZF follows pseudo-first-order kinetics. When the MZ concentration was increased
493 from 50 to 100 mg L−1, the rate constant reduced from 0.0117 to 0.0074 min−1. This decrease,
494 according to Arghavan et al. 2021, is due to a larger concentration of intermediate products, which
25495 limits interaction with active hydroxyl radicals, decreasing the rate constant. In addition, a cost
496 estimate based on a 0.05$ per kWh electricity price in the Turkish Republic of Northern Cyprus in
497 2021 shows that the EEO value for 50 mg L−1 MZ solution is roughly 2 times lower than that for
498 100 mg L−1.
499
500 Table 2: Comparative MZ degradation efficiency of Co−NZF and other catalysts
501
# MZ Conc. #
Time kobs #
t50% η E
Process pH R2
(mg L−1) (min) (min−1) (min) (%) (kWh m−3)
Co−NZF/H2O2 3 50 360 0.0093 74.5 0.987 92.8 17.11
Co−NZF/H2O2 3 100 360 0.0062 111.8 0.976 52.3 25.78
i
Ag−d-NZF/H2O2 3 50 360 0.0103 67.3 0.997 99.9 26.84
ii
MnFe-LDO–biochar/K2S2O8 3 20 240 0.212 3.27 0.996 92.1 11.31
ii
MnFe-LDO–biochar/H2O2 3 20 240 0.0868 7.98 0.987 99.0 10.26
iii
UV/BiOI–MWCNTs 7 10 90 0.0740 9.36 0.952 99.9 32.09
iv
FeNi3/chitosan/BiOI 7 20 200 0.0092 75.3 0.983 100 –
v
N-TiO2/ZnFe2O4/zeolite/O3 5 100 120 0.0196 35.6 0.998 94 –
vi
25% BiVO4/BiPO4 – 5 120 0.0203 34.1 – 90 –
#
502 Each process is under UV irradiation at a given reaction time. t50%=0.693/kobs.
503 i: Mustafa and Oladipo 2021; ii: Azalok et al.2021b; iii: Balarak et al. 2019; iv: Arghavan et al. 2021;
504 v: Aram et al. 2020; vi: Yunhui et al.2019.
505
506
507
508
509 Active radicals trapping test and metronidazole UV-catalytic degradation mechanism
510 The radical trapping test, shown in Fig.6a, was used to validate each radical's contribution to the
511 MZ degradation process. The application of BQ under the same optimum conditions significantly
512 hampered the Co−NZF degradation efficiency, resulting in 64.7% MZ degradation compared to
513 92.8% without the BQ. In the presence of t-BuOH and Na-Ox, respectively, the degradation
514 efficiency decreased to 77.6% and 81.7%. The results revealed that •O2− was the most prevalent
515 radical; this is most likely owing to active defects in the Co−NZF structure, which are responsible
516 for O2 adsorption and reduction to generate reactive oxygen species (ROS) •O2−. Both •OH radicals
517 and photoinduced holes (h+) contributed to the decomposition processes.
26Degradation efficiency (%)
518
519 Fig.6: (a) Active radicals quenching during degradation process (b) performance of Co−NZF in
520 presence of interfering species (c) Co−NZF reuse studies. Reaction conditions: pH =3, catalyst
521 dosage = 10 mg and MZ initial concentration = 50 mgL–1 under 360 min UV illumination.
522
523 Considering the radical scavenging results and UV–vis DRS data, the likely mechanism of MZ
524 photodegradation by Co−NZF is postulated. Eqs. 11 and 12 were used to calculate the conduction
525 band (Cb) and valence band (Vb) potentials of Co−NZF, which were found to be –0.53 eV and 2.31
526 eV, respectively; and χ represents the calculated absolute electronegativity of Co−NZF.
527 Cb Vb Eg (11)
528 Vb 0.5Eg 4.5 eV (12)
27529 In the initial dark adsorption step, the reactive sites of Co−NZF absorbed both MZ species
530 and oxygen. Electrons are promoted from the Vb to the Cb when the Co−NZF was irradiated with
531 photon energy greater than that of its bandgap. As indicated in Eq.8, this mechanism produces
532 electron (e−)−holes (h+) in the exterior shell of Co−NZF, which generates extremely reactive
533 radicals by oxidizing O2 and H2O molecules as shown in Eqs. 13−14.
534 Co NZF O2 (adsorbed) eCb O2 (13)
535 hVb H2O OH H (14)
536 This is thermodynamically feasible because Co−NZF's Cb is more negative than the reduction
537 potential of O2/•O2− (−0.33 eV vs. NHE) and its Vb is more positive than (•OH/H2O, 2.10 eV vs.
538 NHE) (Karimi et al. 2019; Ekande and Kumar, 2021; Oladipo 2021ab). If no suitable charge carrier
539 scavengers are available, the generated e− and h+ pairs recombine, generating heat; however, MZ
540 molecules can be degraded if charge separation is established. Because of its localized surface
541 plasmon resonance effect (Braik et al. 2021; Sinha 2021; Debnath et al. 2021), the Co dopant can
542 act as an electron reservoir and delayed the recombination of photoinduced charge carriers as
543 validated by the results of the PL investigation. Also, the conversion between Co3+ and Co2+ (1.81
544 V vs NHE) gives priority to capture electrons, hence can inhibit electron-hole pair recombination
545 (Hu et al. 2018). Based on the results of the radical quenching studies, the •O2− radicals and the
546 photogenerated charge carriers can either directly degrade the adsorbed MZ or react with H2O2 in
547 the system to form •OH radicals, as represented in Eqs. 15−16 and Scheme 3.
548
549 O2 H2O2 OH OH O2 (15)
550 hVB / O2 /OH MZ
degradedproducts
MZ
(16)
28551
552
553
554
555 Scheme 3: Probable MZ degradation and bacterial disinfection mechanisms of Co−NZF
556
557
558
559 Effect of interference on degradation performance and reusability of Co−NZF
560
561 Under optimal conditions, different salts (Na2SO4, KNO3 and NaCl) and antibiotics (tetracycline
562 and tylosin) were added into the system as interference. In the presence of ionic salts and
563 antibiotics, the Co−NZF degradation efficiency decreased to 53.3–75.4% (SO42− > NO3− > Cl−)
564 and 51.7–67.3%, respectively, after 360 min of interaction (Fig.6b). The size of the interfering
565 species, the magnitude of the surface charge, and the generation of less reactive species may all
566 contribute to the inhibition of Co−NZF. Tylosin and tetracycline, in particular, have a molecular
29567 weight of ~5.4 and 2.6 times that of the MZ, respectively. As a result, their adsorption on the
568 surface of Co−NZF could prevent MZ from adsorbing further. The hydroxyl radicals are
569 scavenged by sulphate, chloride, and nitrate ions, resulting in the formation of less reactive
570 inorganic species such as NO2•, Cl•−, SO4•− and Cl2•− (Devi et al. 2013); hence, MZ degradation
571 was subsequently reduced as a result of this. The Co−NZF was effectively recycled for five
572 photocatalytic reuse cycles and retained more than 50% after the third cycle but the performance
573 decreased remarkably beyond this stage (Fig. 6c). This decrease in degradation efficiency could
574 be related to the diminishing reactive sites and Co−NZF concentration in the bulk solution as a
575 result of sequential separation, filtration, and washing operations.
576
577
578 Bacterial disinfection activity performance of Co−NZF
579 The in vitro antibacterial activity of Co−NZF against S. aureus and E. coli at different dosages are
580 shown in Fig.7; the viability curves were created by counting colony-forming units (CFU).
581 Co−NZF displayed bacteriostatic and bactericidal effects after 60−180 min of UV light irradiation
582 against the bacterial colonies, as seen in time-kill studies in Fig.7a−b. At 5−25 mg mL−1, Co−NZF
583 was bacteriostatic against both bacterial species for the first 180 min afterwards then exhibited
584 bactericidal effects. In comparison to the control (without Co−NZF), 41.1, 66.8, and 74.1% E. coli
585 degradation were obtained in the first 60 min in the presence of 5, 15, and 25 mg mL−1
586 Co−NZF/UV system, respectively. But when the time was extended to 120 min; both 15 and 25
587 mg mL−1 of Co−NZF inactivated nearly 98% of the E. coli colonies (Fig.7a). After 120 min
588 (Fig.7b), 5 mg of Co−NZF had a bactericidal effect against S. aureus, which was most likely owing
589 to the interaction of the positively charged Co−NZF+ with the bacteria proteins or/and the induction
590 of ROS, which resulted in bacterial death.
30CFU/mL
E.coli 2×10 5
4×10 5 S. aureus
5 mg
3×10 5 1.5×10 5 15 mg
25 mg
1×10 5 Control
2×10 5
1×10 5 5×10 4
0 0
Dark UV-light Dark UV-light
591
592
593
594 Fig.7: Time-kill assays as a function of Co−NZF doses for inhibition of E. coli and S. aureus
595 under UV-light assisted inhibition (a and b); c and d show antibacterial inhibition performance
596 of Co−NZF in the dark and under UV in 60 min.
597
598
599 The performance of Co−NZF was examined after 60 min in the absence and presence of UV light
600 to further understand the contribution of UV light during the bacteria degradation process (Fig.8).
601 After 60 min, without UV light irradiation, 5, 15, and 25 mg mL−1 of Co−NZF showed 22.2, 28.1,
602 and 76.9% degradation efficiency, respectively, as shown in Fig.7c for E. coli. When the Co−NZF
603 dosage was increased from 5 to 15 mg mL−1, the degradation efficiency of S. aureus in the dark
604 decreased from 94.4% to 72.9%. Only 23.4% bacterial degradation efficiency was attained when
605 the dose was increased to 25 mg mL−1 (Fig.7d). Suggesting that 5 mg of Co−NZF is sufficient to
606 remarkably inactivate S. aureus in the dark condition. It is worthy to note that under both the dark
31607 and UV-light conditions; Co−NZF demonstrated better antibacterial action against S. aureus
608 strains than E. coli strains, which could be attributed to differences in their composition and cell
609 membrane structure.
610
611
612 Fig.8: Comparative performance of varying doses of Co−NZF against Escherichia coli in the
613 dark and UV-light after 60 min catalyst exposure.
614
615 Different mechanisms for the bactericidal effects of ferrites and metal oxides have been
616 proposed in previous investigations (Asadi et al. 2019; Aali et al. 2019; Mizwari et al. 2021;
617 Mmelesi et al. 2021). According to Méndez-Pfeiffer et al. 2019, atomic force microscopy images
618 revealed damage to the E. coli cellular wall in the presence of photoactivated Ag nanoparticles.
619 They believe that the Ag NPs' positive charge can easily interact with the phosphate groups of the
620 bacteria membrane's phospholipids and penetrate the bacteria, causing the membrane to rupture
621 and release the cellular contents. In line with their report, the antibacterial activity of the Co−NZF
622 in the dark, herein, is likely due to the interaction of positively charged metal ions in the catalyst's
623 external shell with sulfhydryl groups and phosphorus-containing compounds in the bacterial cell
32624 membrane, causing damage to the DNA's replication potential. The enhanced antibacterial activity
625 of Co−NZF under UV light could be related to the production of reactive oxygenated species,
626 which damaged the membrane and caused cell death.
627
628 Conclusion
629 Ni-Zn ferrites (NZF) were synthesized using a slightly modified co-precipitation procedure and
630 then doped with Co2+ ions to produce an effective photocatalyst (Co−NZF) for decontamination
631 of bacterial-contaminated and metronidazole antibiotic (MZ) water. Both NZF and Co−NZF were
632 characterized using various spectroscopic and electrochemical tools. Co−NZF has a bandgap of
633 2.84 eV, an average crystallite size of 25.6 nm, a specific surface area of 70.2 m2 g−1, total pore
634 volume of 0.298 cm3g−1, spongy morphology with agglomerated irregular grain, and can be easily
635 separated from the solution by an external magnet, according to the results. The use of Co doping
636 resulted in an increase in impurity levels, which helped to separate and transport photogenerated
637 electron-hole pairs more effectively. Also, Co−NZF had the highest photocurrent intensity and
638 smallest arc radius (Rct) which decreased its electron transfer impedance with increased charge
639 mobility due to the variation in ionic and electronic conductivity induced by Co incorporation.
640 Under optimal conditions (4 mM H2O2, 360 min reaction time, 50 mgL–1 MZ, and pH 3);
641 10 mg of Co−NZF degraded 92.8% of the MZ with a rate constant of 0.0093 min−1 and consumed
642 total electrical energy of 17.11 kWh m−3. Even in the presence of very high molecular weight
643 antibiotic interferences, the catalyst retained more than 50% of its performance with adequate
644 reuse efficiency. Notably, 15 mg Co−NZF achieved a complete inhibition of both E. coli and S.
645 aureus strains when photoactivated for 180 min. In the dark, 5 and 25 mg of Co−NZF exhibited
646 94.4% and 77% bacteriostatic effects on S. aureus and E. coli, respectively within 60 min.
647
33648 Authors' contributions All authors contributed to the conceptualization, read and approved the
649 final manuscript. FSM performed the experiments, collected and analyzed the data. AAO
650 formulated the research ideas, designed the methodology, interpreted the data and was a major
651 contributor in writing the manuscript. ZMM characterized the synthesized materials and
652 interpreted results. MG provided reagents, instrumentation and administration.
653
654 Data availability The datasets used and/or analysed during the current study are available from
655 the corresponding author on reasonable request.
656 Declarations
657
658 Competing interests The authors declare that they have no competing interests.
659
660 Ethics approval and consent to participate Not applicable.
661
662 Consent for publication Not applicable.
663 Funding Not applicable.
664
665 References
666 Aali H, Azizi N, Baygi NJ, et al (2019) High antibacterial and photocatalytic activity of solution
667 combustion synthesized Ni0.5Zn0.5Fe2O4 nanoparticles: Effect of fuel to oxidizer ratio and
668 complex fuels. Ceram Int 45: 19127–19140.
669 https://doi.org/10.1016/j.ceramint.2019.06.159
670
671 Abureesh MA, Oladipo AA, Mizwari ZM, Berksel E (2018) Engineered mixed oxide-based
672 polymeric composites for enhanced antimicrobial activity and sustained release of
673 antiretroviral drug. Int J Biol Macromol 116: 417–425.
674 https://doi.org/10.1016/j.ijbiomac.2018.05.065
675
676 Ahmad M, Ahmad I, Ahmed E, et al (2020) Facile and inexpensive synthesis of Ag doped
34You can also read


