Pre- and post-production processes increasingly dominate greenhouse gas emissions from agri-food systems
←
→
Page content transcription
If your browser does not render page correctly, please read the page content below
Earth Syst. Sci. Data, 14, 1795–1809, 2022
https://doi.org/10.5194/essd-14-1795-2022
© Author(s) 2022. This work is distributed under
the Creative Commons Attribution 4.0 License.

              Pre- and post-production processes increasingly
                 dominate greenhouse gas emissions from
                             agri-food systems
                Francesco N. Tubiello1 , Kevin Karl1,2 , Alessandro Flammini1,3 , Johannes Gütschow4 ,
                      Griffiths Obli-Laryea1 , Giulia Conchedda1 , Xueyao Pan1 , Sally Yue Qi2 ,
       Hörn Halldórudóttir Heiðarsdóttir1 , Nathan Wanner1 , Roberta Quadrelli5 , Leonardo Rocha Souza6 ,
      Philippe Benoit2 , Matthew Hayek7 , David Sandalow2 , Erik Mencos Contreras8,9 , Cynthia Rosenzweig8,9 ,
                            Jose Rosero Moncayo1 , Piero Conforti1 , and Maximo Torero1
                                        1 Food and Agriculture Organization, Rome, Italy
                         2 Center   on Global Energy Policy, Columbia University, New York, USA
            3 Department of Environment, United Nations Industrial Development Organization, Vienna, Austria
       4 Department of Transformation Pathways, Potsdam Institute for Climate Impact Research, Potsdam, Germany
                                           5 International Energy Agency, Paris, France
                                      6 United Nations Statistics Division, New York, USA
                       7 Department of Environmental Studies, New York University, New York, USA
                        8 Center for Climate Systems Research, Columbia University, New York, USA
                   9 Climate Impacts Group, NASA Goddard Institute for Space Studies, New York, USA

                          Correspondence: Francesco N. Tubiello (francesco.tubiello@fao.org)

                               Received: 29 October 2021 – Discussion started: 8 November 2021
                         Revised: 10 February 2022 – Accepted: 6 March 2022 – Published: 14 April 2022

      Abstract. We present results from the FAOSTAT emissions shares database, covering emissions from agri-food
      systems and their shares to total anthropogenic emissions for 196 countries and 40 territories for the period
      1990–2019. We find that in 2019, global agri-food system emissions were 16.5 (95 %; CI range: 11–22) billion
      metric tonnes (Gt CO2 eq. yr−1 ), corresponding to 31 % (range: 19 %–43 %) of total anthropogenic emissions. Of
      the agri-food system total, global emissions within the farm gate – from crop and livestock production processes
      including on-farm energy use – were 7.2 Gt CO2 eq. yr−1 ; emissions from land use change, due to deforesta-
      tion and peatland degradation, were 3.5 Gt CO2 eq. yr−1 ; and emissions from pre- and post-production processes
      – manufacturing of fertilizers, food processing, packaging, transport, retail, household consumption and food
      waste disposal – were 5.8 Gt CO2 eq. yr−1 . Over the study period 1990–2019, agri-food system emissions in-
      creased in total by 17 %, largely driven by a doubling of emissions from pre- and post-production processes.
      Conversely, the FAOSTAT data show that since 1990 land use emissions decreased by 25 %, while emissions
      within the farm gate increased 9 %. In 2019, in terms of individual greenhouse gases (GHGs), pre- and post-
      production processes emitted the most CO2 (3.9 Gt CO2 yr−1 ), preceding land use change (3.3 Gt CO2 yr−1 ) and
      farm gate (1.2 Gt CO2 yr−1 ) emissions. Conversely, farm gate activities were by far the major emitter of methane
      (140 Mt CH4 yr−1 ) and of nitrous oxide (7.8 Mt N2 O yr−1 ). Pre- and post-production processes were also signif-
      icant emitters of methane (49 Mt CH4 yr−1 ), mostly generated from the decay of solid food waste in landfills and
      open dumps. One key trend over the 30-year period since 1990 highlighted by our analysis is the increasingly
      important role of food-related emissions generated outside of agricultural land, in pre- and post-production pro-
      cesses along the agri-food system, at global, regional and national scales. In fact, our data show that by 2019,
      pre- and post-production processes had overtaken farm gate processes to become the largest GHG component
      of agri-food system emissions in Annex I parties (2.2 Gt CO2 eq. yr−1 ). They also more than doubled in non-
      Annex I parties (to 3.5 Gt CO2 eq. yr−1 ), becoming larger than emissions from land use change. By 2019 food

Published by Copernicus Publications.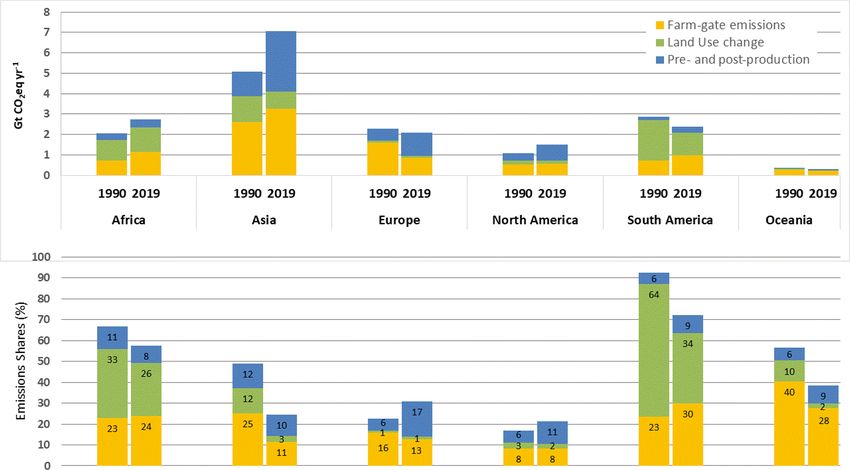
1796 F. N. Tubiello et al.: GHG emissions from pre- and post-production
supply chains had become the largest agri-food system component in China (1100 Mt CO2 eq. yr−1 ), the USA
(700 Mt CO2 eq. yr−1 ) and the EU-27 (600 Mt CO2 eq. yr−1 ). This has important repercussions for food-relevant
national mitigation strategies, considering that until recently these have focused mainly on reductions of non-
CO2 gases within the farm gate and on CO2 mitigation from land use change. The information used in this
work is available as open data with DOI https://doi.org/10.5281/zenodo.5615082 (Tubiello et al., 2021d). It is
also available to users via the FAOSTAT database (https://www.fao.org/faostat/en/#data/EM; FAO, 2021a), with
annual updates.
1 Introduction lands on agricultural land (Conchedda and Tubiello, 2020;
IPCC, 2014b) and by energy use in farm operations (FAO,
Agriculture is a significant contributor to climate change 2011, 2014, 2020b; Flammini et al., 2022, Sims and Flam-
as well as one of the economic sectors most at risk from mini, 2014). Secondly, it usefully disaggregates the land use,
it. Greenhouse gas (GHG) emissions generated within the land use change and forestry (LULUCF) of IPCC (2003)
farm gate by crop and livestock production and related land by separating out the emissions directly linked to food and
use change contribute about one-fifth to one-quarter of to- agriculture activities, such as those generated by deforesta-
tal emissions from all human activities, when measured in tion (Curtis et al., 2018; Tubiello et al., 2021c) and peat
CO2 equivalents (Mbow et al., 2019; Smith et al., 2014; Ver- fires (Prosperi et al., 2020), from carbon removals, which are
meulen et al., 2012). The impacts are even starker in terms largely associated with processes in managed forests rather
of individual GHG emissions. Agriculture contributes nearly than on agricultural land (Grassi et al., 2021).
50 % of global anthropogenic methane (CH4 ) and 75 % of the We present herein and discuss results from the first agri-
total nitrous oxide (N2 O) emissions (FAO, 2021b; Gütschow food system emissions database in FAOSTAT. The new
et al., 2021; Saunois et al., 2020). Once pre- and post- database covers, as in previous versions (Tubiello et al.,
production activities along agri-food systems supply chains 2013), agriculture production activities within the farm gate
are included, food and agriculture activities generate up to and associated land use and land use change emissions on
one-third of all anthropogenic emissions globally (Crippa et agricultural land. Importantly, it also includes estimates of
al., 2021a, b; Rosenzweig et al., 2020; Tubiello et al., 2021a). emissions from pre- and post-production processes along
This larger food system perspective expands the potential for food supply chains, including fertilizer manufacturing, en-
designing GHG mitigation strategies across the entire food ergy use within the farm gate, food processing, domestic
system, i.e., over and above the more traditional focus on and international food transport, retail, packaging, household
agricultural production and land use management that is cur- consumption, and food system waste disposal. The database
rently found within countries’ nationally determined contri- provides emissions data for four main GHG gases/categories
butions (Crumpler et al., 2021). (CO2 , CH4 , N2 O and fluorinated gases) and their combined
Significant progress has recently resulted in the develop- CO2 equivalent (CO2 eq.) levels. Data are available by coun-
ment of novel databases with global coverage of country- try, over the period 1990–2019, as well as by regional and
level data on agri-food system emissions (Crippa et al., other relevant aggregations. Importantly, data are provided
2021a, b; Tubiello et al., 2021a). Tubiello et al. (2021a), in in both IPCC and FAO classifications, facilitating the identi-
particular, provided a mapping of emission categories of the fication of national mitigation strategies across agri-food sys-
Intergovernmental Panel on Climate Change (IPCC) – used tems in countries, regionally and globally.
by countries for reporting their national GHG inventories
(NGHGI) to the United Nations Framework Convention on 2 Materials and methods
Climate Change (UNFCCC) – unto internationally accepted
food and agriculture concepts that are more easily understood Recent work (Rosenzweig et al., 2021; Tubiello et al., 2021a)
by farmers and planners in countries, including in ministries helped to characterize agri-food system emissions into three
of agriculture. By providing a correspondence between IPCC components: (1) farm gate, (2) land use change and (3) pre-
and FAO terminology, we seek to help countries to more and post-production. Emissions estimates from the first two –
adequately capture important aspects of food and agricul- generated by crop and livestock production activities within
ture activities within existing climate reporting, so that they the farm gate and by the conversion of natural ecosystems to
can better identify effective climate actions across their agri- agriculture, such as deforestation and peatland degradation –
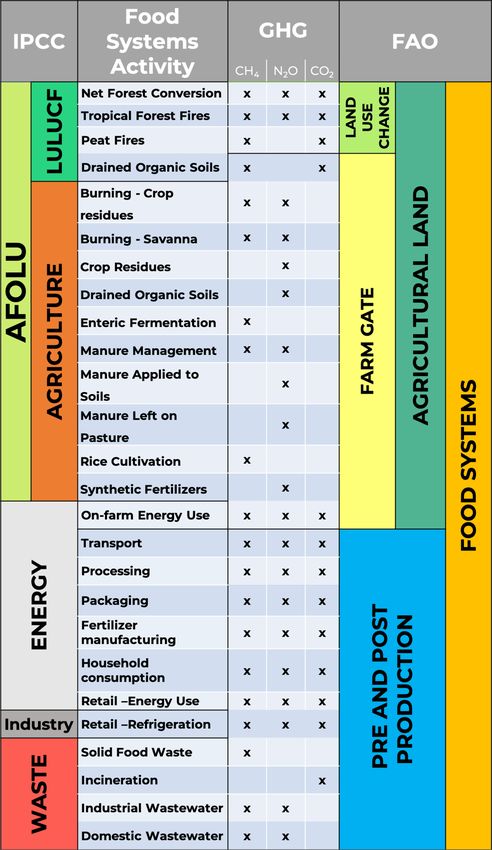
food systems (Fig. 1, adapted from Tubiello et al., 2021a). are well established (IPCC, 2019). In particular, FAO dissem-
Firstly, the correspondence mapping expands the IPCC “agri- inates annual updates in FAOSTAT (FAO, 2021a, b; Tubiello,
culture” definition to include, in addition to non-CO2 emis- 2019). This paper expands the available FAOSTAT data to in-
sions from the farm, also the CO2 generated in drained peat- clude estimates of emissions from pre- and post-production
Earth Syst. Sci. Data, 14, 1795–1809, 2022 https://doi.org/10.5194/essd-14-1795-2022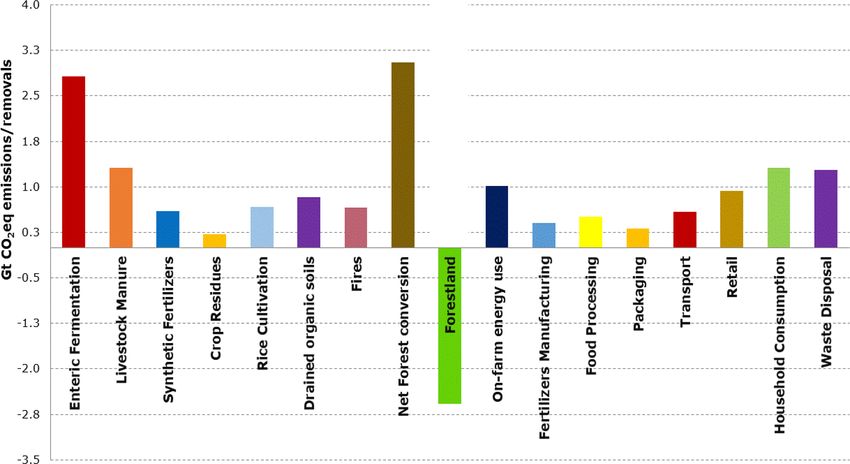
F. N. Tubiello et al.: GHG emissions from pre- and post-production                                                                 1797

                                                                        systems. On the other hand, through the IPCC to FAO map-
                                                                        ping discussed above and extending previous work (Tubiello
                                                                        et al., 2021a), data can also be downloaded in relevant FAO
                                                                        categories, covering emissions from farm gate, land use
                                                                        change, and pre- and post-production processes (Fig. 1).
                                                                           The FAOSTAT emissions estimates follow the
                                                                        IPCC (2006) “territorial approach”; i.e., they are as-
                                                                        signed to the countries where they occur, independently of
                                                                        production or consumption considerations. For example,
                                                                        CO2 emissions from energy use in fertilizer manufacturing
                                                                        are accounted for in the producing country, while the N2 O
                                                                        emissions from fertilizer used on a country’s agricultural
                                                                        land for crop production are accounted for in that country.
                                                                        Similarly, emissions from energy use in agri-food sys-
                                                                        tem activities are accounted for in countries where fuel
                                                                        combustion for that particular activity occurs, including
                                                                        electricity generation. The methods applied herein do not
                                                                        cover additional, upstream emissions associated with fuel
                                                                        supply chains, which are therefore not assigned to agri-food
                                                                        systems. More details on the scope of this work are found in
                                                                        Sect. 2.3.

                                                                        2.2   Emissions estimates
                                                                        FAO regularly disseminates emissions data for 15 sub-
                                                                        domains in relation to the farm gate and land use change
                                                                        components of agri-food system emissions, with published
                                                                        methodologies and results (i.e., Tubiello et al., 2021a). This
                                                                        paper relies in addition on new methods for computing emis-
                                                                        sions from pre- and post-production processes. Specifically,
                                                                        methods for emissions from energy use in fertilizer manu-
                                                                        facturing, food processing, retail, and household consump-
                                                                        tion as well as refrigeration in retail are presented in Tubiello
                                                                        et al. (2021b), while Karl and Tubiello (2021a, b) presented
                                                                        methods for estimating agri-food system emissions in trans-
Figure 1. Mapping of emissions across agri-food systems. Left:          port and waste disposal. Finally, emissions from on-farm en-
IPCC sectors and processes used in national GHG emissions inven-        ergy use were developed by Flammini et al. (2022). We refer
tories. Right: food and agriculture sectors and categories aligned to   the interested reader to those original publications for full
FAO’s definitions.                                                      details, while for completeness we also provide a sufficiently
                                                                        detailed summary of methods and coefficients as the Supple-
                                                                        ment of this paper.
processes, including energy use in fertilizer manufacturing,               More generally, a step-wise approach was followed for the
food processing, packaging, transport, retail, household con-           estimation of agri-food system emissions, as follows.
sumption, and waste disposal.
                                                                          – Step 1. Identify, for each food system component the
                                                                            relevant international statistics needed to characterize
2.1   Mapping agri-food system components                                   country-level activity data (AD).

The new FAOSTAT data are provided, for each country, in                   – Step 2. Determine the food-related shares of the activity
both IPCC and FAO classifications. Specifically, on the one                 data (ADfood ) and assign relevant GHG emission factors
hand, data can be downloaded using the following IPCC                       (EFs) to each activity.
emissions categories: energy; industrial processes and prod-              – Step 3. Implement the generic IPCC method for estimat-
uct use (IPPU, henceforth referred to as industry); waste;                  ing GHG emissions (Efood ), using inputs of activity data
agriculture; land use, land use change and forestry (LU-                    and emission factors from the first two steps, as follows:
LUCF); and other. The total emissions from IPCC sectors are
provided, as well as the portion directly related to agri-food                Efood = EF × ADfood .                                  (1)

https://doi.org/10.5194/essd-14-1795-2022                                              Earth Syst. Sci. Data, 14, 1795–1809, 2022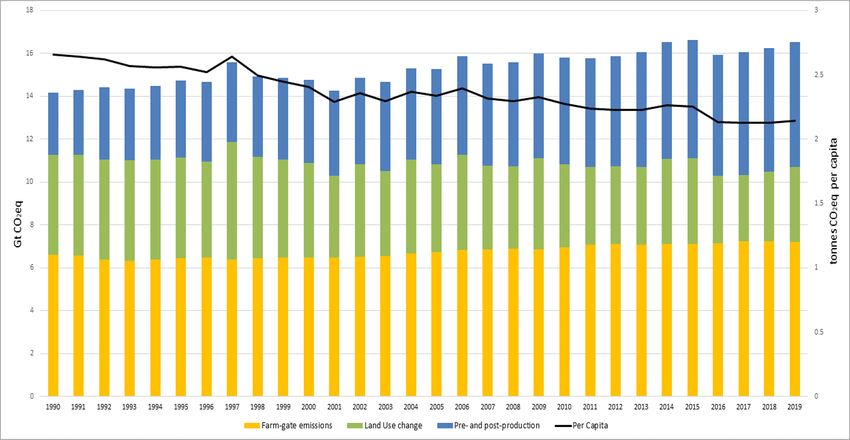
1798                                                       F. N. Tubiello et al.: GHG emissions from pre- and post-production

  – Step 4. Impute missing agri-food systems GHG emis-             level data for disaggregated cold chain elements. However,
    sions data by component. This step was limited to              one estimate suggests that the majority (over 60 %) of global
    pre- and post-production processes and applied where           food-related F-gas emissions occur in the retail stage, which
    country-specific activity data were lacking. The imputa-       is accounted for here in this work (International Institute of
    tion method used PRIMAP, a complete dataset of emis-           Refrigeration, 2021). Emissions from pesticide manufactur-
    sions estimates for all IPCC sectors, by country, cover-       ing were also not included due to the paucity of information
    ing the period 1990–2019 (Gütschow et al., 2021). The          and methodologies for their estimation at the country level, in
    PRIMAP dataset is already available in FAOSTAT for             contrast to advanced work in fertilizer manufacturing (Bren-
    the computation of emissions shares of agriculture to the      trup et al., 2016, 2018; IFS, 2019). Bellarby et al. (2008) esti-
    total anthropogenic total (FAO, 2021c; Tubiello et al.,        mated global emissions from pesticides manufacturing to be
    2021a). It compiles all available information on GHG           roughly 72 (range: 3–140) Mt CO2eq yr−1 , roughly 1 %–2 %
    emissions by country, including from official reporting.       of the pre- and post-production total estimated in this work.
    It was used internationally as the basis for an early,
    first-order estimate of agri-food system shares in total
    GHG emissions (IPCC, 2019). Additionally, it was re-           2.4.2   Uncertainty
    cently used in a UNFCCC synthesis report (UNFCCC,
    2021) to assess world GHG emissions from all sectors           Uncertainties in FAOSTAT farm gate and land use change
    in preparation of a stock take exercise that will be un-       emissions estimates have been characterized elsewhere and
    dertaken in 2022–2023 to assess countries’ performance         computed in line with IPCC (2000, 2006) guidelines as rang-
    against their mitigation commitments under the Paris           ing 30 %–70 % across component processes. For the purpose
    Agreement. The imputations in equation (1) were per-           of this analysis, we assigned uncertainties of 30 % and 50 %
    formed by applying to the PRIMAP sectoral emissions            respectively to the farm gate and land use change compo-
    country-specific food system emissions shares (Tubiello        nents of the FAOSTAT agri-food system emissions, in line
    et al., 2021b, for more details).                              with previous work (i.e., Tubiello et al., 2013, 2021b). The
                                                                   uncertainties in the estimates of pre- and post-production ac-
2.3     Global warming potentials used                             tivities described herein are by contrast less documented. On
                                                                   the one hand, uncertainties in underlying energy activity data
The estimated emissions data expressed in CH4 and N2 O             and emissions factors are typically lower than for the other
gases were converted to CO2 equivalents by using the 100-          two components, ranging 5 %–20 % (Flammini et al., 2022).
year global warming potentials (GWPs) of the IPCC (2014)           On the other hand, the relative novelty in estimating food sys-
Fifth Assessment Report and specifically GWP-CH4 = 28;             tem shares for a range of activity data across many processes
GWP-N2 O = 265; GWP-F-gases = 5195. The value for fluo-            makes our estimates more uncertain, with heavy reliance on
rinated gases (F-gases) was obtained as an average of several      literature results from a subset of countries and regions that
distinct products (Tubiello et al., 2021b).                        are necessarily extended to the rest of the world (Karl and
                                                                   Tubiello, 2021a). For this reason, we assigned an overall un-
2.4     Data uncertainty and limitations                           certainty of 30 % to the pre- and post-production compo-
                                                                   nent. This is higher than the uncertainty of the underlying
2.4.1    Boundaries
                                                                   energy processes but more in line with values used in recent
The processes covered herein do not span all processes at-         work (Crippa et al., 2021a). As shown below, considering
tributable to agri-food systems. In particular, the scope of       a roughly equal, one-third contribution of the three compo-
this work does not include, by design, upstream GHG emis-          nents and their assigned uncertainties, an overall uncertainty
sions in the fuel chain, such as petroleum refining, as well as    of 40 % was estimated for the agri-food system emissions to-
methane leaks during extraction processes and piping. These        tals, applicable to countries and regional aggregates.
are expected to be not negligible if considered. While emis-          The above uncertainties are meant only as first rough es-
sions from such sources can be estimated using a fixed fuel        timates, useful to determine tentative 95 % confidence inter-
chain coefficient for certain fuel supply chains (see Crippa       vals for the overall agri-food system component of FAOSTAT
et al., 2021a), the authors do not consider such sources to        emissions. Significantly more research is needed for further
be within scope of this work. GHG emissions attributable           refinements in future studies, in particular on better charac-
to electricity generation are included in the scope of this        terizing sub-regional and regional activity data and emissions
work, which itself excludes upstream GHG emissions in the          coefficients, given the diversity in agri-food system typology
fuel chain used to generate electricity (Flammini et al., 2022;    and their dependence on physical geography and national
Tubiello et al., 2021b).                                           socio-economic drivers. These limitations nonetheless reflect
   Conversely, emissions of fluorinated gases (F-gases) from       the paucity of activity data available to describe agri-food
household refrigeration and from climate-controlled trans-         system components and their trends, globally and regionally.
portation were not included for lack of available country-         While knowledge and data exist for regions and countries

Earth Syst. Sci. Data, 14, 1795–1809, 2022                                         https://doi.org/10.5194/essd-14-1795-2022
F. N. Tubiello et al.: GHG emissions from pre- and post-production 1799
such as the EU, USA China and India, much remains to be and emissions from pre- and post-production processes –
done in terms of regional and country-specific coverage. manufacturing of fertilizers, food processing, packaging,
transport, retail, household consumption and food waste dis-
2.4.3 Areas for advancement
posal – were 5.8 (range: 4–8) Gt CO2 eq. yr−1 . Over the study
period 1990–2019, agri-food system emissions increased
Work towards estimating agri-food system emissions at the in total by 17 %, though they have remained rather con-
country level can be advanced in several ways. The present stant since about 2006 (Fig. 2). These trends were largely
approach could be expanded on by including other country- driven by a doubling of emissions from pre- and post-
and region-specific studies that estimate trends in energy production processes, while land use emissions decreased
consumption across a range of similar activities as proxies by 25 % and farm gate increased only 9 %. In terms of sin-
– regardless of whether or not they are distinctly related to gle GHG, pre- and post-production processes emitted the
food. Furthermore, other data sources could help explain and most CO2 (3.9 Gt CO2 yr−1 ) in 2019, preceding land use
estimate variations in agri-food systems between countries, change (3.3 Gt CO2 yr−1 ) and farm gate (1.2 Gt CO2 yr−1 )
such as GDP per capita, urbanization levels, proxies for in- emissions. Conversely, farm gate activities were by far the
frastructure and industrial development, and geographic and major emitter of methane (140 Mt CH4 yr−1 ) and of nitrous
climate considerations. The development of a methodology oxide (7.8 Mt N2 O yr−1 ). Pre- and post-processes were also
to estimate emissions from pesticides could be explored, as significant emitters of methane (49 Mt CH4 yr−1 ), mostly
it would help complement the understanding of emissions as- generated from the decay of solid food waste in landfills and
sociated with chemical use in agriculture, in addition to fer- open dumps.
tilizers. Emissions from machinery manufacturing and from Emissions from within the farm gate and those due to
upstream GHG emissions in the fuel chain could also be related land use processes, including details of their sub-
added to further refine the analysis. This work could be fur- components, have been discussed in Tubiello et al. (2021a)
ther expanded by focusing on specific food commodities – and are regularly presented within FAOSTAT statistical
requiring an additional focus on international trade and on briefs (e.g., FAO, 2020a, 2021b). Here we provide a de-
supply and demand patterns (Dalin and Rodríguez-Iturbe, tailed discussion of the components of agri-food sys-
2016). Such analysis would ultimately enable consumers to tem emissions from pre- and post-production activities
understand the full carbon footprint of particular commodi- along supply chains and their relative contribution to the
ties across global supply chains, which can facilitate GHG food system totals (Fig. 3). Considering that the un-
mitigation actions taken at the consumer level (Poore and certainties used above are rough estimates, we will not
Nemecek, 2018). Furthermore, it would be also useful to fur- report uncertainties in the following analysis. Our data
ther investigate the increasing role of bioenergy and renew- show that in 2019 emissions from deforestation were the
ables as important mitigation opportunities in the food sector single largest emission component of agri-food systems,
(Clark et al., 2020, Monforti et al., 2015; Pablo-Romero et at 3.1 Gt CO2 yr−1 , having decreased 30 % since 1990.
al., 2017; Wang, 2014). The second most important components were non-CO2
emissions from enteric fermentation (2.8 Gt CO2 eq. yr−1 ),
with increases of 13 %. These were followed by emis-
3 Results
sions from livestock manure (1.3 Gt CO2 eq. yr−1 ) and sev-
3.1 Global trends
eral pre- and post-production emissions, including CO2
from household consumption (1.3 Gt CO2 eq. yr−1 ), CH4
The FAOSTAT dataset considered in this study estimates from food waste disposal (1.3 Gt CO2 eq. yr−1 ), mostly
in 2019 total anthropogenic emissions at 52 Gt CO2 eq. yr−1 CO2 from fossil-fuel combustion for on-farm energy use
without land use, land use change and forestry emissions (1.0 Gt CO2 eq. yr−1 ), and CO2 and F-gases emissions from
(LULUCF), as well as 54 Gt CO2 eq. yr−1 with LULUCF – food retail (0.9 Gt CO2 eq. yr−1 ). Importantly, our data show
consistently with recent estimates (IPCC, 2019). We use the that growth in pre- and post-production components was par-
latter figure to compute emissions shares. In 2019 world to- ticularly strong, with emissions from retail increasing from
tal agri-food system emissions, expressed in terms of 95 % 1990 to 2019 by more than 7-fold, while emissions from
confidence intervals (CI) determined using an overall un- household consumption more than doubled over the same pe-
certainty of 40 %, were 16.5 (CI range: 10–23) billion met- riod.
ric tonnes (Gt CO2 eq. yr−1 ), corresponding to 31 % (range: Finally, while emissions from agri-food systems increased
19 %–42 %) of total anthropogenic emissions (Table 1). Of globally by 16 % between 1990 and 2019, their share in total
the food system total, global emissions within the farm gate emissions decreased, from 40 % to 31 %, as did the per capita
– from crop and livestock production processes including emissions, from 2.7 to 2.1 t CO2 eq. per capita (Fig. 2).
on-farm energy use – were 7.2 (range: 5–9) Gt CO2 eq. yr−1 ;
emissions from land use change, due to deforestation and
peatland degradation, were 3.5 (range: 2–5) Gt CO2 eq. yr−1 ;
https://doi.org/10.5194/essd-14-1795-2022 Earth Syst. Sci. Data, 14, 1795–1809, 20221800 F. N. Tubiello et al.: GHG emissions from pre- and post-production
Table 1. GHG emissions (Mt CO2 eq.) by agri-food system component for all processes considered in this work. Data on forestland removals
are provided for completeness of land-based emissions available in FAOSTAT. Uncertainties (not shown) are estimated at 30 % for farm gate
and pre- and post-production components and at 50 % for land use change processes.
Activity Category 1990 2019 Change
Net forest conversion Land use change 4392 3058 −30 %
Enteric fermentation Farm gate 2494 2823 13 %
Livestock manure Farm gate 1101 1315 19 %
Household consumption Pre- and post-production 541 1309 142 %
Waste disposal Pre- and post-production 984 1278 30 %
On-farm energy use Farm gate 757 1021 35 %
Food retail Pre- and post-production 128 932 631 %
Drained organic soils Pre- and post-production 736 833 13 %
Rice cultivation Farm gate 621 674 9%
Fires Land use change 558 654 17 %
Synthetic fertilizers Farm gate 422 601 42 %
Food transport Pre- and post-production 327 586 79 %
Food processing Pre- and post-production 421 510 21 %
Fertilizer manufacturing Pre- and post-production 152 408 168 %
Food packaging Pre- and post-production 166 310 87 %
Crop residues Farm gate 161 226 40 %
Forestland −3391 −2571 −24 %
Figure 2. World total GHG emissions from agri-food systems, 1990–2019. Color bars show contributions by emissions within the farm
gate (yellow); land use change (green) and pre- and post-production along food supply chains (blue). Source: FAOSTAT (FAO, 2021a). Also
shown are emissions per capita (authors’ own calculations).
3.2 Regional trends South America (2.4 Gt CO2 eq. yr−1 ) and Europe
(2.1 Gt CO2 eq yr−1 ). North America (1.5 Gt CO2 eq yr−1 )
Our results indicate significant regional variation in terms of and Oceania (0.3 Gt CO2 eq yr−1 ) were the smallest emitters
the composition of agri-food system emissions by compo- among regions (Fig. 4). Focusing on GHG emissions beyond
nent (Fig. 4). Specifically, in terms of total agri-food system agricultural land, pre- and post-production emissions in
emissions in 2019, Asia had the largest contribution, at 2019 were largest in Asia (2.9 Gt CO2 eq. yr−1 ), followed
7 Gt CO2 eq. yr−1 , followed by Africa (2.7 Gt CO2 eq. yr−1 ), by Europe and North America (0.8–1.1 Gt CO2 eq. yr−1 ).
Earth Syst. Sci. Data, 14, 1795–1809, 2022 https://doi.org/10.5194/essd-14-1795-2022F. N. Tubiello et al.: GHG emissions from pre- and post-production 1801
Figure 3. World total 2019 GHG emission from agri-food systems, showing contributions on agricultural land (left panel) and from pre- and
post-production along food supply chains (right panel). Net removals on forest land are also shown, for completeness. The sum of emissions
from agricultural land and forest land correspond to the IPCC AFOLU category. Source: FAOSTAT (FAO, 2021a).
The data show which pre- and post-production process
was most important by region (Table 2). In 2019, food house-
hold consumption was the dominant process outside of agri-
cultural land emissions in Asia (0.9 Gt CO2 eq. yr−1 ) and
Africa (0.2 Gt CO2 eq. yr−1 ). Conversely, Europe, Oceania
and North America pre- and post-production processes were
led by emissions from food retail (0.3–0.4 Gt CO2 eq. yr−1 ),
while South America was dominated by emissions from food
waste disposal (0.2 Gt CO2 eq. yr−1 ).
3.3 Country trends
Our estimates show a marked variation among countries in
terms of total emissions as well as the composition of contri-
butions across farm gate, land use change, and pre- and post-
Figure 4. Total GHG emission from agri-food systems by FAO re-
processing components (Fig. 5). China had the most emis-
gions, 2019. Color bars show contributions by emissions within the sions (1.9 Gt CO2 eq. yr−1 ), followed by India, Brazil, In-
farm gate (yellow), land use change (green), and pre- and post- donesia and the USA (1.2–1.3 Gt CO2 eq. yr−1 ). The Demo-
production along food supply chains (blue). Source: FAOSTAT cratic Republic of the Congo (DRC) and the Russian Fed-
(FAO, 2021a). eration followed with 0.5–0.6 Gt CO2 eq. yr−1 , followed by
Pakistan, Canada and Mexico with 0.2–0.3 Gt CO2 eq yr−1 .
The contribution of the three main agri-food system com-
ponents to the national total differed among countries sig-
Regions also varied in terms of how agri-food system com- nificantly (Fig. 5). For instance, China and India had virtu-
ponents contributed to the total (Table 2). In 2019, pre- and ally no contribution from land use change to agri-food sys-
post-production emissions were the largest food system con- tem emissions. The land use contribution was also minor in
tributor in Europe (55 %), North America (52 %) and Asia the USA, the Russian Federation and Pakistan. Conversely,
(42 %). Conversely, they were smallest in Oceania (23 %), the latter was the dominant emissions component in Brazil,
Africa (14 %) and South America (12 %). Additionally, the Indonesia and the DRC. Additionally, the new database al-
contribution of pre- and post-production processes along lowed for an in-depth analysis by country of pre- and post-
food supply chains significantly increased since 1990, when production emissions along the agri-food chain, highlighting
in no region were they the dominant emissions component. a significant variety in most relevant sub-process contribu-
Since then, they doubled in all regions except in Africa – tion (Table 3). For the year 2019, pre- and post-production
where it remained below 15 %. emissions were dominated in China by food household
https://doi.org/10.5194/essd-14-1795-2022 Earth Syst. Sci. Data, 14, 1795–1809, 20221802 F. N. Tubiello et al.: GHG emissions from pre- and post-production
Table 2. Regional GHG emissions (Gt CO2 eq.) by agri-food system component, showing farm gate, land use change (LUC), pre- and post-
production processes (PPPs), and total emissions percentage contribution of PPPs shown for the year 1990 and 2019. The last two columns
show the largest estimated contributing PPP activity by region. Uncertainties are estimated to be 30 % for farm gate and PPP activities and
50 % for land use change.
Region Farm gate LUC PPP Total % PPP % PPP (1990) Highest PPP note
Asia 3.2 0.9 2.9 7.0 42 % 24 % 0.9 Household
Africa 1.1 1.2 0.4 2.7 14 % 16 % 0.2 Household
South America 1.0 1.1 0.3 2.4 12 % 6% 0.1 Waste
Europe 0.9 0.1 1.1 2.1 55 % 26 % 0.4 Retail
Northern America 0.6 0.2 0.8 1.5 52 % 35 % 0.3 Retail
Oceania 0.2 0.0 0.1 0.3 23 % 11 % 0.0 Retail
consumption processes (463 Mt CO2 eq. yr−1 ), whereas food (Fig. 4), as well as more consistent with observed population
waste disposal was the dominant pathway in Brazil, Indone- growth, an important determinant of household consumption
sia (77 Mt CO2 eq. yr−1 ), DRC (8 Mt CO2 eq. yr−1 ), Pak- trends (Tao et al., 2018).
istan (33 Mt CO2 eq. yr−1 ) and Mexico, (56 Mt CO2 eq yr−1 ).
Emissions from food retail dominated the pre- and post-
4.2 Trends
production component in the USA (292 Mt CO2 eq. yr−1 ),
the Russian Federation (177 Mt CO2 eq. yr−1 ) and Canada One notable trend over the 30-year period since 1990 is
(20 Mt CO2 eq. yr−1 ). Finally, on-farm energy use was the increasingly important role of food-related emissions
the largest pre- and post-production component in India generated outside of agricultural land, in pre- and post-
(205 Mt CO2 eq. yr−1 ). production processes along food supply chains, at all global,
regional and national scales. Our data show that by 2019, pre-
and post-production processes had overtaken farm gate pro-
4 Discussion
cesses to become the largest GHG component of agri-food
4.1 Comparisons with previous work system emissions in Annex I parties (2.2 Gt CO2 eq. yr−1 ).
While farm gate emissions still dominated food system pro-
The overall assessment of total agri-food system emissions cesses in non-Annex I parties, emissions from pre- and
found in this work confirms recent previous findings by the post-production were closing the gap in 2019, surpass-
IPCC (2019) and Crippa et al. (2021a, b). With regards ing land use change and having doubled since 1990 to
to pre- and post-production, the FAOSTAT estimates were 3.5 Gt CO2 eq. yr−1 . By 2019, pre- and post-production pro-
consistent (Table 4) with previous findings (i.e., Crippa et cesses had become the largest agri-food system component in
al., 2021a, b; Vermuelen et al., 2012; Poore and Nemecek, China (1.1 Gt CO2 eq. yr−1 ), the USA (0.7 Gt CO2 eq. yr−1 )
2018). In particular, emissions estimates for food transport, and the EU-27 (0.6 Gt CO2 eq. yr−1 ). This has important
processing, waste and retail were consistent with EDGAR- repercussions for food-relevant national mitigation strate-
FOOD (Karl and Tubiello, 2021b), and estimates for fer- gies, such as those included in countries’ nationally deter-
tilizer manufacturing were in line with previous work by mined contributions, considering that until recently these
Vermeulen et al. (2012). Conversely, FAOSTAT estimates have focused mainly on reductions of non-CO2 gases within
were higher than EDGAR-FOOD for household consump- the farm gate and on CO2 mitigation from land use change
tion and lower for food packaging, with the latter possibly (Hönle et al., 2019).
linked to FAOSTAT estimates excluding indirect emissions Importantly, the FAOSTAT database presented here allows
from fuel supply chains, which were instead included in pre- for an estimation of the percentage share contribution of food
viously published estimates. Finally, our estimates of F-gas system emissions in total anthropogenic emissions, by coun-
emissions from retail agreed well with those published in try as well as at regional and global levels, over the period
EDGAR-FOOD. 1990–2019. A number of important issues can be highlighted
The most important disagreement with previous work to this end (Table 5 and Fig. 6). First, in terms of CO2 eq., the
was observed in relation to household consumption emis- share of world total agri-food system emissions decreased
sions. FAOSTAT estimates in this work, 1.2 Gt CO2 eq., were from 40 % in 1990 to 31 % in 2019. Thus, while it is impor-
nearly 3 times those of EDGAR-FOOD (with reference to tant to note that one-third of all GHG emissions today are
2015, the last year for which EDGAR data were available). generated by agri-food systems, their shares in total emis-
While much more research is needed to refine estimates in sions may continue to decrease in the near future. This de-
this important agri-food system component, our estimates creasing trend was driven by trends in large regions, con-
were in fact well aligned with earlier FAO (2011) work sistently with transformations in their agri-food systems and
Earth Syst. Sci. Data, 14, 1795–1809, 2022 https://doi.org/10.5194/essd-14-1795-2022F. N. Tubiello et al.: GHG emissions from pre- and post-production 1803
Figure 5. Total GHG emission from agri-food systems by country, top 10 emitters, 2019. Color bars show contributions by emissions within
the farm gate (yellow), land use change (green), and pre- and post-production along food supply chains (blue). Source: FAOSTAT (FAO,
2021a).
Table 3. Top 10 country GHG emissions (Mt CO2 eq.) by agri-food system component and total food system emissions, 2019. The last
two columns show the dominant sub-component of pre- and post-production processes. Agri-food system GHG emissions from the top 10
countries represent 55 % of global agri-food system emissions. Country-level uncertainties are those used for global and regional estimates.
Country Farm gate LUC PPP Total Main PPP Main PPP name
China 792 0 1102 1894 469 Household consumption
India 768 0 618 1386 205 On-farm
Brazil 553 663 144 1360 79 Waste disposal
Indonesia 491 658 132 1281 76 Waste disposal
USA 477 60 696 1232 292 Retail
DRC 28 624 9 660 8 Waste disposal
Russian Federation 146 35 362 542 177 Retail
Pakistan 205 7 71 283 33 Waste disposal
Canada 97 96 81 274 20 Retail
Mexico 115 15 116 246 56 Waste disposal
land use change patterns. For instance, in South America, regions, leading to increases in the relative contributions to
the region with the highest food system share over the en- agri-food systems of this component, except for Africa.
tire study period (Fig. 6), food shares decreased from 96 % An analysis on agri-food system impacts on total GHG
in 1990 to 72 % in 2019, in Africa from 67 % to 57 %, in emissions would not be complete without a focus on compo-
Asia from 49 % to 24 %, and in Oceania from 57 % to 39 %. nent gases in addition to quantities expressed in CO2 eq.. The
In contrast to these trends, our data suggested that in regions FAOSTAT data confirm the trends form 1990 to 2019 seen for
dominated by modern agri-food systems, such as Europe and total CO2 eq. emissions, with important features (Table 6).
North America, the overall share of agri-food system emis- First, the impact of agri-food systems on world total CO2
sions in fact increased from 1990 to 2019, specifically from emissions was 21 % in 2019 (down from 31 % in 1990), a re-
24 % to 31 % in Europe and from 17 % to 21 % in North spectable share considering the importance of carbon dioxide
America. Such increases could be explained by increases in in any effective long-term mitigation strategy. While most
absolute emissions from pre- and post-production activities regions had contributions around this value, ranging 13 %–
(Table 5), re-enforced by concomitant emissions decreases 23 % for North America, Oceania, Europe and Asia, the
in the non-food sector, especially energy systems (Lamb et CO2 contribution of agri-food systems was highest in Africa
al., 2022). The noted increase in absolute emissions from (52 %) and South America (70 %), largely in relation to land
pre- and post-production activities was in fact present in all use change emissions, still significant therein. Europe and
https://doi.org/10.5194/essd-14-1795-2022 Earth Syst. Sci. Data, 14, 1795–1809, 20221804 F. N. Tubiello et al.: GHG emissions from pre- and post-production
Table 4. Overview of pre- and post-food production GHG emission estimates from selected studies, Gt CO2 eq. Adapted from Tubiello et
al. (2021b).
Food system FAO (2011)1 Vermeulen et Poore and Nemecek Ritchie (2019)4 Tubiello et al. (2021a)5 Crippa et This
component al. (2012)2 (2018)3 al. (2021a, b) analysis6
EDGAR-FOOD6
Reference year Mid-2000s 2004–2007 2009–2011 2017 2019 2015 2019
Fertilizer – 0.3–0.6 – – – – 0.4
manufacturing
Food processing 0.2 0.6 0.5 4.3 (including retail and 0.5 0.5
Food packaging 0.6 0.7 household consumption) 1.0 0.3
2.1 0.4
Food transport 0.8 0.8 0.5 0.9 0.6
Food retail 0.7 0.4 0.4 0.8 0.9
Food household 1.2 0.2 – – 0.5 1.3
consumption
Waste disposal – 0.1 – – 1.0 1.6 1.3
On-farm electricity – – – – – – 0.5
generation
TOTAL 3.3 1.9–2.2 2.4 2. 4 5.8 5.3 5.8
1 Includes emissions from indirect energy inputs (e.g., manufacturing of machinery). Global estimate based on literature. 2 Global estimate based on Chinese and British emission patterns and literature. 3 Meta-analysis of
life-cycle assessments. 4 Global estimate based on literature. 5 Global estimate largely based on country-level (bottom-up) analysis (relying on FAOSTAT and EDGAR-FOOD). 6 Global estimate largely based on
country-level (bottom-up) analysis.
Table 5. Regional GHG emissions (Mt CO2 eq.) by agri-food system component and total food system emissions, 2019. The last two columns
show the dominant sub-component of pre- and post-production processes. Uncertainties (not shown) are estimated at 30 % for farm gate and
pre- and post-production components and at 50 % for land use change processes.
Farm gate Land use change Pre- and post-production Agri-food system total
1990 2019 1990 2019 1990 2019 1990 2019
Africa 705 1139 1017 1220 323 388 2045 2747
23 % 24 % 33 % 26 % 11 % 8% 67 % 57 %
Asia 2595 3250 1273 865 1223 2930 5091 7044
25 % 11 % 12 % 3% 12 % 10 % 49 % 24 %
Europe 1603 854 88 83 589 1140 2280 2077
16 % 13 % 1% 1% 6% 17 % 23 % 31 %
North America 538 574 175 156 376 777 1089 1507
8% 8% 3% 2% 6% 11 % 17 % 21 %
South America 728 982 1974 1106 176 281 2878 2369
23 % 30 % 64 % 34 % 6% 9% 93 % 72 %
Oceania 267 223 65 16 42 71 374 309
40 % 28 % 10 % 2% 6% 9% 57 % 39 %
World 6604 7214 4676 3503 2886 5827 14 165 16 544
19 % 13 % 13 % 6% 8% 11 % 40 % 31 %
North America were the only regions where the CO2 share Finally, the data highlight a very large increase in agri-
of agri-food systems actually increased from 1990 to 2019, food system contributions of F-gas emissions, which went
confirming the growing weight of pre- and post-production from near zero in 1990 to more than one-quarter of the world
processes, which typically involve fossil-fuel energy use and total in 2019 – with larger contributions in many regions.
thus emissions of CO2 gas through combustion. Second, the Such a marked increase is consistent with the growth in use
data highlight the significant contribution of agri-food sys- of hydrofluorocarbons (HFCs) as refrigerants in the food re-
tems to 2019 world total emissions of CH4 (53 %) and N2 O tail and other sectors, following the banning of chloroflu-
(78 %), also confirmed at regional levels (Table 6), linked to orocarbons (CFCs) in 1990 (Fang et al., 2018; Hart et al.,
farm gate production processes (Tubiello, 2019). 2020; International Institute of Refrigeration, 2021; Tubiello
Earth Syst. Sci. Data, 14, 1795–1809, 2022 https://doi.org/10.5194/essd-14-1795-2022F. N. Tubiello et al.: GHG emissions from pre- and post-production 1805
Figure 6. Top panel: agri-food system emissions (Gt CO2 eq. yr−1 ). Bottom panel: shares of agri-food systems in total anthropogenic emis-
sions (%). Data shown by region, 1990–2019. Color bars show contribution components: farm gate (yellow), land use change (green), and
pre- and post-production along food supply chains (blue). Source: FAOSTAT (FAO, 2021a).
Table 6. World total and regional GHG agri-food system emissions shares (%), 1990–2019, by single gas and CO2 eq.. Uncertainties in
shares (not shown) are the same as those estimated for absolute emissions. See Crippa et al. (2021a) for a specific list of hydrofluorocarbons
(HFCs) used in agri-food systems, which form the basis of the F-gas emissions data estimated in this work.
1990 2019 1990 2019 1990 2019 1990 2019 1990 2019
CO2 eq. CO2 CH4 N2 O F-gases
World 40 31 31 21 60 53 79 78 0 27
Africa 67 57 65 52 63 58 90 87 0 20
Northern America 17 21 11 13 36 42 60 70 0 56
South America 93 72 97 70 82 75 94 92 0 6
Asia 49 24 38 16 66 49 84 80 0 9
Europe 23 31 13 23 46 47 70 74 0 28
Oceania 57 39 38 22 76 64 93 77 0 63
et al., 2021b)). Our findings are furthermore consistent with for instance, LULUCF and AFOLU emissions contributed
the strong growth in F-gas emissions reported in recent stud- respectively 4 % and 15 % of the total.
ies (Minx et al., 2021; Park et al., 2021).
An important aspect of the dataset presented in this study
5 Data availability
is its provision of information mapped across IPCC and FAO
categories alike. Specific IPCC sectors include agriculture
The GHG emission data presented herein cover the pe-
and land use, land use change and forestry (LULUCF). The
riod 1990–2019 at the country level, with regional and
IPCC further considers the agriculture, forestry and other
global aggregates. They are available as open data, with
land use (AFOLU). While countries report their agriculture
DOI https://doi.org/10.5281/zenodo.5615082 (Tubiello et
and food emissions to the UNFCCC within national GHG
al., 2021d), and via the FAOSTAT emissions shares database
inventories, our findings highlight the importance of expand-
(https://www.fao.org/faostat/en/#data/EM, FAO, 2021a).
ing that reporting to a fuller agri-food systems view, one that
properly weights the contribution of food to the global econ-
omy. Indeed, our results show that agri-food system emis- 6 Conclusions
sions in 2019 were one-third of total anthropogenic emis-
sions. This important picture does not emerge from NGHGI This paper provided details of a new FAOSTAT database on
reporting aligned to IPCC categories, according to which, GHG emissions along the entire agri-food systems chain, in-
cluding crop and livestock production processes on the farm,
land use change activities from the conversion of natural
https://doi.org/10.5194/essd-14-1795-2022 Earth Syst. Sci. Data, 14, 1795–1809, 20221806 F. N. Tubiello et al.: GHG emissions from pre- and post-production
ecosystems to agricultural land, and processes along food and analyzed data. FNT led the writing of the manuscript with input
supply chains, from input manufacturing to food processing, from GC, KK, EMC and CR. PB commented on an earlier version
transport and retail, including household consumption and of the manuscript. All authors contributed critically to the drafts and
waste disposal. gave final approval for the publication. The views expressed in this
The data are provided in open-access mode to users world- paper are the authors’ only and do not necessarily reflect those of
FAO, UNSD and IEA.
wide and are available by country over the time period 1990–
2019, with plans for annual updates. The major trends iden-
tified in this work help locate GHG emissions hotspots in
Competing interests. At least one of the (co-)authors is a mem-
agri-food systems at the country, regional and global level.
ber of the editorial board of Earth System Science Data. The peer-
This can inform the process of designing effective mitigation review process was guided by an independent editor, and the authors
actions in food and agriculture. This work adds to knowledge also have no other competing interests to declare.
on GHG emissions from agriculture and land use – generally
well established in the literature – by adding critical informa-
tion on emissions from a range of pre- and post-production Disclaimer. The views expressed in this paper are the authors’
processes. The new data highlight the increasingly important only and do not necessarily reflect those of FAO, UNSD, UNIDO
role that pre- and post-production processes along supply and IEA.
chains play in the overall GHG footprint of agri-food sys-
tems, globally and in most countries, providing new insights Publisher’s note: Copernicus Publications remains neutral with
into food and agriculture development trends and future mit- regard to jurisdictional claims in published maps and institutional
igation options. affiliations.
The granularity of the dataset allows us, for the first
time, to highlight specific processes of importance in spe-
Acknowledgements. FAOSTAT is supported by FAO’s member
cific countries or groups of countries with similar character-
countries. We acknowledge the efforts of national experts who pro-
istics. The relevance of the information being provided cuts vide the statistics on food and agriculture, as well as statistics on
across several national and international priorities, specifi- energy use, that are the basis of this effort. All authors contributed
cally those aiming at achieving more productive and sustain- critically to the drafts and gave final approval for the publication.
able food systems, including in relation to climate change. We are grateful for overall support by the Food Climate Partnership
To this end, the work presented herein completes a mapping at Columbia University.
of IPCC categories, used by countries for reporting to the
climate convention, to food and agriculture categories that
are more readily understandable by farmers and ministries Review statement. This paper was edited by David Carlson and
of agriculture in countries. This helps better identify agri- reviewed by two anonymous referees.
food system entry points within existing and future national
determined contributions. Finally, the methodological work
underlying these efforts complements and extends recent pi-
oneering efforts by FAO and other groups in characteriz- References
ing technical coefficients to enable quantifying the weight of
Bellarby, J., Foereid, B., and Hastings, A.: Cool Farm-
agri-food systems within countries’ emissions profiles. The
ing: Climate Impacts of Agriculture and Mitigation
next steps in such efforts would need the involvement of in-
Potential, https://abdn.pure.elsevier.com/en/publications/
terested national and international experts in compiling a first cool-farming-climate-impacts-of-agriculture-and-mitigation-potent
set of coefficients for agri-food systems as a practical agri- (last access: 15 March 2022), 2008.
food systems annex to the existing guidelines of the Inter- Brentrup, F., Hoxha, A., and Christensen, B.: Carbon foot-
governmental Panel on Climate Change, providing guidance print analysis of mineral fertilizer production in Europe and
to countries on how to better characterize food and agricul- other world regions, in: 10th International Conference on
ture emissions within their national GHG inventories. Life Cycle Assessment of Food, University College Dublin,
19–21 October 2016, https://www.researchgate.net/profile/
Frank-Brentrup-2/publication/312553933_Carbon_footprint_
Supplement. The supplement related to this article is available analysis_of_mineral_fertilizer_production_in_Europe_and_
online at: https://doi.org/10.5194/essd-14-1795-2022-supplement. other_world_regions/links/5881ec8d4585150dde4012fe/
Carbon-footprint-analysis-of-mineral-fertilizer-product (last
access: 15 March 2022), 2016.
Brentrup, F., Lammel, J., Stephani, T., and Christensen, B.:
Author contributions. FNT and CR conceived the ideas and to-
Updated carbon footprint values for mineral fertilizer from dif-
gether with GC and KK designed the methodology. LRS, AF and
ferent world regions, in: 11th International Conference on Life
RQ provided pre- and post-production data. NW provided forest
Cycle Assessment of Food, Kasetsart University, 17–19 Octo-
data. GOL, KK, XP, SYQ, HHH, RQ, LRS, AF and JG compiled
ber 2018, https://www.researchgate.net/publication/329774170_
Earth Syst. Sci. Data, 14, 1795–1809, 2022 https://doi.org/10.5194/essd-14-1795-2022F. N. Tubiello et al.: GHG emissions from pre- and post-production 1807
Updated_carbon_footprint_values_for_mineral_fertilizer_from_ Flammini, A., Pan, X., Tubiello, F. N., Qiu, S. Y., Rocha Souza, L.,
different_world_regions (last access: 1 January 2022), 2018. Quadrelli, R., Bracco, S., Benoit, P., and Sims, R.: Emissions
Clark, M. A., Domingo, N. G. G., Colgan, K., Thakrar, S. of greenhouse gases from energy use in agriculture, forestry
K., Tilman, D., Lynch, J., Azevedo, I. L., and Hill, J. D.: and fisheries: 1970–2019, Earth Syst. Sci. Data, 14, 811–821,
Global food system emissions could preclude achieving the https://doi.org/10.5194/essd-14-811-2022, 2022.
1.5◦ and 2 ◦ C climate change targets, Science, 370, 705–708, Grassi, G., Stehfest, E., Rogelj, J., van Vuuren, D., Cescatti, A.,
https://doi.org/10.1126/science.aba7357, 2020. House, J., Nabuurs, G.-J., Rossi, S., Alkama, R., Viñas, R. A.,
Conchedda, G. and Tubiello, F. N.: Drainage of organic soils Calvin, K., Ceccherini, G., Federici, S., Fujimori, S., Gusti, M.,
and GHG emissions: validation with country data, Earth Syst. Hasegawa, T., Havlik, P., Humpenöder, F., Korosuo, A., Perugini,
Sci. Data, 12, 3113–3137, https://doi.org/10.5194/essd-12-3113- L., Tubiello, F. N., and Popp, A.: Critical adjustment of land mit-
2020, 2020. igation pathways for assessing countries’ climate progress, Nat.
Crippa, M., Solazzo, E., Guizzardi, D., Monforti-Ferrario, F., Clim. Change, 11, 425–434, https://doi.org/10.1038/s41558-
Tubiello, F. N., and Leip, A.: Food systems are responsible for 021-01033-6, 2021.
a third of global anthropogenic GHG emissions, Nature Food, 2, Gütschow J., Jeffery L., and R. Gieseke: The PRIMAP-hist national
198–209, https://doi.org/10.1038/s43016-021-00225-9, 2021a. historical emissions time series v2.3 (1850–2017), GFZ Data
Crippa, M., Guizzardi, D., Solazzo, E., Ferrario-Monforti, F., Services [data set], https://doi.org/10.5880/pik.2019.001, 2021.
Tubiello, F. N., and Leip, A.: EDGAR-FOOD emission data, Hart, M., Austin, W., Acha, S., Le Brun, N., Markides, C. N., and
figshare, https://doi.org/10.6084/m9.figshare.13476666, 2021b. Shah, N.: A roadmap investment strategy to reduce carbon inten-
Crumpler, K., Federici, S., Meybeck, A., Salvatore, M., Damen, B., sive refrigerants in the food retail industry, J. Clean. Prod., 275,
Gagliardi, G., Bloise, M., Wolf, J., and Bernoux, M.: Assess- 123039, https://doi.org/10.1016/j.jclepro.2020.123039, 2020.
ing policy gaps and opportunities in the nationally determined Hönle, S. E., Heidecke, C., and Osterburg, B.: Climate
contributions – A sectoral methodology for agriculture and land change mitigation strategies for agriculture: An analysis
use, Environment and Natural Resources Management Working of nationally determined contributions, biennial reports
Papers No. 86, Rome, FAO, https://doi.org/10.4060/cb1579en, and biennial update reports, Clim. Policy, 19, 688–702,
2021. https://doi.org/10.1080/14693062.2018.1559793, 2019.
Curtis, P. G., Slay, C. M., Harris, N. L., Tyukavina, A., and Hansen, International Fertiliser Society (IFS): The carbon foot-
M. C.: Classifying drivers of global forest loss, Science, 361, print of fertiliser production: regional reference values,
1108–1111, https://doi.org/10.1126/science.aau3445, 2018. https://www.fertilizerseurope.com/wp-content/uploads/
Dalin, C. and Rodríguez-Iturbe, I.: Environmental impacts of 2020/01/The-carbon-footprint-of-fertilizer-production_
food trade via resource use and greenhouse gas emissions, Regional-reference-values.pdf (last access: 25 October 2021),
Environ. Res. Lett., 11, 035012, https://doi.org/10.1088/1748- 2019.
9326/11/3/035012, 2016. International Institute of Refrigeration: The Carbon Footprint
Fang, X., Ravishankara, A. R., Velders, G. J. M., Molina, M. J., of the Cold Chain, 7th Informatory Note on Refrigeration
Su, S., Zhang, J., Hu, J., and Prinn, R. G.: Changes in Emissions and Food, https://iifiir.org/en/fridoc/the-carbon-footprint-of-the-
of Ozone-Depleting Substances from China Due to Implementa- cold-chain-7-lt-sup-gt-th-lt-sup-gt-informatory-143457 (last ac-
tion of the Montreal Protocol, Environ. Sci. Technol., 52, 11359– cess: 25 October 2021), 2021.
11366, https://doi.org/10.1021/acs.est.8b01280, 2018. IPCC: Good practice guidance and uncertainty management in na-
FAO: Energy-smart food for people and climate, FAO, Rome, tional greenhouse gas inventories, in: IPCC National Greenhouse
http://www.fao.org/3/i2454e/i2454e00.pdf (last access: 25 Octo- Gas Inventories Programme, Technical Support Unit, Hayama,
ber 2021), 2011. Japan, edited by: Penman, J., Kruger, G., Hiraishi, T., Nyenzi,
FAO: Opportunities for Agri-Food Chains to become Energy- B., Emmanul, S., Buendia, L., Hoppaus, R., Martinsen, T., Mei-
Smart, FAO, Rome, http://www.fao.org/3/a-i5125e.pdf (last ac- jer, J., Miwa, K., and Tanabe, K., http://www.ipcc-nggip.iges.
cess: 25 October 2021), 2014. or.jp/public/gp/english/gpgaum_en.html (last access: 25 Octo-
FAO: Emissions due to agriculture. Global, regional and country ber 2021), 2000.
trends 2000–2018, FAOSTAT Analytical Brief Series No 18, IPCC: Good practice guidance for land use, land-use
FAO, Rome, https://www.fao.org/3/cb3808en/cb3808en.pdf (last change and forestr, https://www.ipcc.ch/publication/
access: 25 October 2021), 2020a. good-practice-guidance-for-land-use-land-use-change-and-forestry/
FAO: FAOSTAT Energy Use, FAO, https://www.fao.org/faostat/en/ (last access: 25 October 2021), ISBN 4-88788-003-0, 2003.
#data/GN (last access: 25 October 2021), 2020b. IPCC: 2006 IPCC Guidelines for National Greenhouse Gas Inven-
FAO: FAOSTAT Emissions Shares, FAO, https://www.fao.org/ tories, Prepared by the National Greenhouse Gas Inventories Pro-
faostat/en/#data/EM (last access: 25 October 2021), 2021a. gramme, edited by: Eggleston, H. S., Buendia, L., Miwa, K.,
FAO: FAOSTAT Emissions Totals, FAO, https://www.fao.org/ Ngara, T., and Tanabe, K., IGES, Japan, https://www.ipcc-nggip.
faostat/en/#data/GT (last access: 25 October 2021), 2021b. iges.or.jp/public/2006gl/vol5.html (last access: 25 October 2021
FAO: The share of food systems in total greenhouse gas emissions. ), 2006.
Global, regional and country trends 1990–2019, FAOSTAT An- IPCC: Climate Change 2014: Synthesis Report. Contribution
alytical Brief Series No. 31, FAO, Rome, https://www.fao.org/ of Working Groups I, II and III to the Fifth Assess-
3/cb7514en/cb7514en.pdf (last access: 15 March 2022), ISSN ment Report of the Intergovernmental Panel on Climate
2709-0078, 2021c. Change, https://www.ipcc.ch/site/assets/uploads/2018/02/SYR_
AR5_FINAL_full.pdf (last access: 25 October 2021), 2014a.
https://doi.org/10.5194/essd-14-1795-2022 Earth Syst. Sci. Data, 14, 1795–1809, 2022You can also read