UC Merced Frontiers of Biogeography - eScholarship
←
→
Page content transcription
If your browser does not render page correctly, please read the page content below
UC Merced
Frontiers of Biogeography

Title
Species richness and composition of Caribbean aquatic entomofauna: role of climate,
island area, and distance to mainland

Permalink
https://escholarship.org/uc/item/3x90p6rp

Journal
Frontiers of Biogeography, 0(0)

Authors
Cineas, Chevelie
Dolédec, Sylvain

Publication Date
2022

DOI
10.21425/F5FBG54479

Supplemental Material
https://escholarship.org/uc/item/3x90p6rp#supplemental

Copyright Information
Copyright 2022 by the author(s).This work is made available under the terms of a
Creative Commons Attribution License, available at
https://creativecommons.org/licenses/by/4.0/

Peer reviewed

 eScholarship.org                              Powered by the California Digital Library
                                                               University of California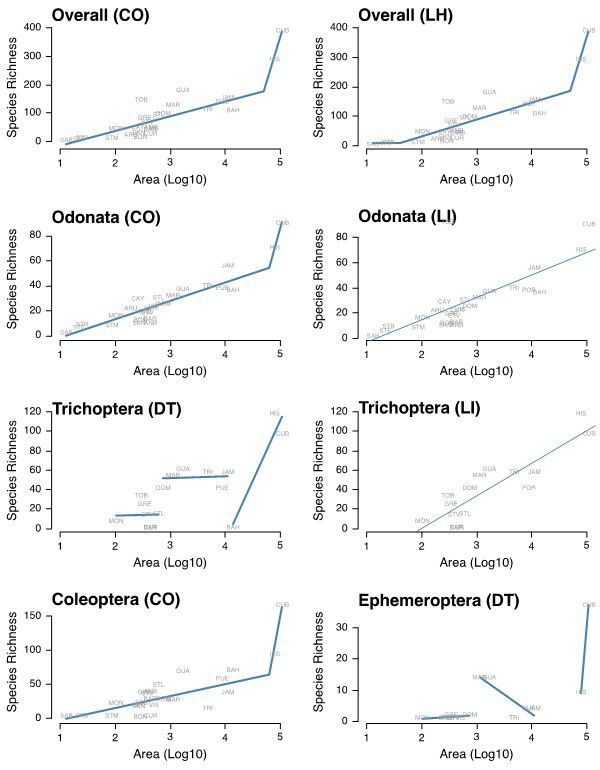
a
Frontiers of Biogeography 2022, 14.3, e54479
Frontiers of Biogeography
RESEARCH ARTICLE the scientific journal of
the International Biogeography Society
Species richness and composition of Caribbean aquatic entomofauna:
role of climate, island area, and distance to mainland
Chevelie Cineas1,2 and Sylvain Dolédec1*
1
Univ Lyon, Université Claude Bernard Lyon 1, CNRS, ENTPE, UMR 5023 LEHNA, F-69622, Villeurbanne, France
2
Université d’Etat d’Haiti, Ecole Normale Supérieure, Laboratoire des Sciences de l’Energie et de l’Environnement (LS2E),
Port -au-Prince, Haiti.
*Correspondence: Sylvain Dolédec, sylvain.doledec@univ-lyon1.fr
Abstract Highlights
From a literature review, we constructed a database • Little is known about aquatic invertebrate
comprising >1000 freshwater insect species (especially biogeography in the Caribbean.
Odonata, Coleoptera, Trichoptera, Ephemeroptera;
OCTE) in 26 Geographical Caribbean Units (GCU) and • We present the first database of aquatic insect
quantified local filtering (climate heterogeneity, annual collections made in the Caribbean archipelago over
rainfall, annual temperature), geography (area, distance the last 50 years.
from the mainland) and emergence age as a proxy
for island ontogeny. We investigated the relative role • 2/3 of the aquatic insects recorded were endemic.
of these variables on the species richness, endemism • Continuous one-threshold models fitted the overall,
and composition of the units using island species-area Odonata and Coleoptera species richness
relationship (ISAR), generalised linear modelling (GLM) and
nonmetric multidimensional scaling (NMDS). In addition, • Discontinuous two-threshold models fitted the
we analysed the spatial patterns of species richness Trichoptera and Ephemeroptera species richness
and composition using Moran’s I index. ISAR generally
demonstrated one or two thresholds and continuous or • Geographical and local climate variables and
discontinuous responses according to OCTE groups. A dispersal abilities combine together for explaining the
small island effect could be detected for Trichoptera and richness and composition of the Caribbean aquatic
Ephemeroptera richness, whereas Odonata and Coleoptera entomofauna
only demonstrated differences in slope between smaller
and larger GCUs. Area, climate heterogeneity, maximal
rainfall and distance from mainland were major drivers
of species composition in GCUs, whereas local climate
variables were of main importance for the endemism
rate. Due to the potential complexity of the Caribbean
island ontogeny, middle-stage islands had an expected
higher freshwater invertebrate richness than younger
ones but an unexpected lower richness compared to
older islands. Finally, the degree of colonization of
islands was linked to the dispersal ability of species,
with Odonata and Coleoptera having larger distribution
ranges than Trichoptera and Ephemeroptera, which were
more restricted by their comparatively narrow ecological
niches. The high endemism (>60%) found in the Caribbean
freshwaters calls for more conservation effort in managing
these highly threatened freshwater environments.
Keywords: aquatic insects, Caribbean archipelago, climate, dispersal ability, endemic species, species composition,
species richness
Introduction “laboratories of evolution” (Whittaker et al. 2008).
One of the most influential theories is MacArthur and
Oceanic islands have inspired the development of Wilson’s (1967) theory of island biogeography (TIB).
several theories in ecology and evolution (Valente et al. Based on the premise that island species richness
2014), and many scientists consider these regions as depends on a dynamic balance between species
e-ISSN: 1948-6596 https://escholarship.org/uc/fb doi:10.21425/F5FBG54479
© the authors, CC-BY 4.0 license 1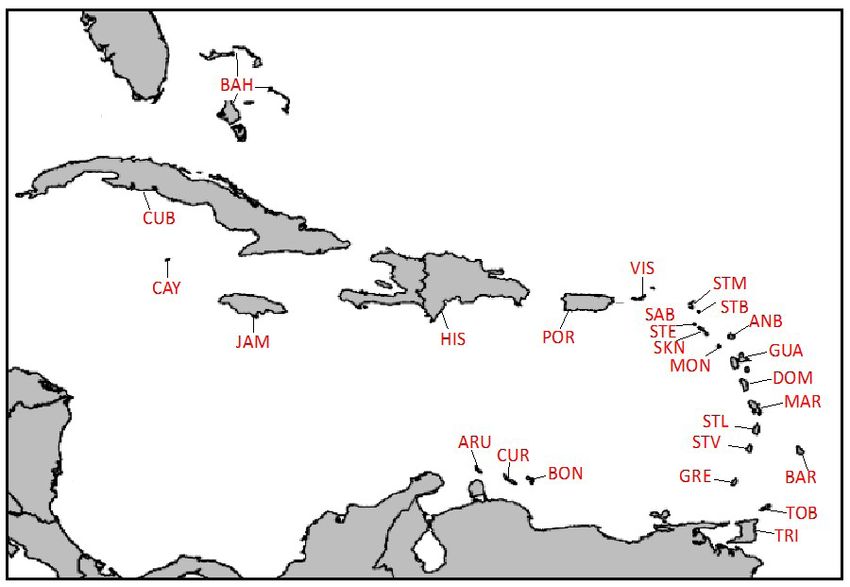
Cineas & Dolédec                                                        Aquatic entomofauna of the Caribbean archipelago

colonization and extinction processes, TIB assumes           island, creates varied climates, which are favourable
that larger islands or islands close to the mainland         to species richness. In addition, it may create barriers
should contain a greater number of species than small        that favour endemism. For example, the Caribbean
islands or more distant islands. However, this dynamic       biota presents exceptionally high biodiversity with
balance between immigration and extinction alone             an endemism rate of up to 95.4% in some taxonomic
cannot explain the richness of insular communities, and      groups of some islands, such as amphibians in Cuba
local environmental filtering and biotic interactions are    (Rivalta-Gonzalez et al. 2014). Biogeographic studies
also seen as significant evolutionary drivers of island      in the Caribbean archipelago are numerous but do not
species richness (Lack 1976, Gros-Désormeaux 2012).          concern all taxa. Most studies so far have focused on
In addition, not all species are ecologically equivalent,    vertebrates (Hedges et al. 1992, Tavares and Simmons,
and their colonization of an island may be successful        2000, Dávalos 2004, Camargo et al. 2009, Alonso et al.
or unsuccessful depending on their ecological                2011) and terrestrial arthropods (Hollocher and
requirements and dispersal ability (Nekola and               Williamson 1996, Oneal et al. 2010, McHugh et al.
White 1999). Therefore, Lomolino (2000) proposed a           2014, Crews and Esposito 2020). These studies have
biogeographic conceptual model, i.e., the Immigration-       shown that nonflying vertebrates (mammals, reptiles
Extinction-Evolution model, which includes the degree        and amphibians) have close relatives in South America,
of isolation and the area of ecosystems as well as           that freshwater fish and flying vertebrates (birds and
the characteristics of immigration filters (e.g., wind       bats) have strong ties to North and Central America
direction and speed, current velocity), geology and          (Hedges 1996), and that terrestrial arthropods originate
climate.                                                     mainly from South America (McHugh et al. 2014)
    Whittaker et al. (2008) further developed the            and partly from Central and North America (Crews
General Dynamic Model of Ocean Island Biogeography           and Esposito 2020, Davies and Bermingham 2002).
(GDM), which broadened and updated MacArthur                 Rodriguez-Silva and Schlupp (2021) demonstrated
& Wilson’s TIB by integrating the processes of               that after reaching the Caribbean archipelago, new
immigration, speciation and extinction in a time             colonizers experienced high speciation because of the
frame related to the dynamic, transient nature of            new habitat conditions they had to adapt to, which
volcanic islands (island ontogeny). Island ontogeny          led to significant endemism. The adaptive radiation of
is very important for the evolution of the diversity         species in the Caribbean archipelago is probably best
of island habitats. After their complete emergence,          illustrated by Anolis lizards, with more than 150 species
islands are transformed by erosion processes, which          (Losos and Ricklefs 2009). In addition, Calisto spp., a
causes a reduction in topographical complexity and           Lepidoptera Nymphalidae endemic to the Caribbean
habitat diversity affecting the rate of immigration,         archipelago, shows remarkable radiation, with ~52
speciation and species extinction (Fernández‐Palacios        species distributed across Hispaniola (36 species),
de Nascimento et al. 2011, Whittaker et al. 2007). As        Cuba (11), Puerto Rico (1), Anegada (1), Jamaica (1),
a result, lower richness should occur on the newly           and the Bahamas (2) (Aguila et al. 2017).
formed as well as on the sinking and eroding late                In contrast, little is known about the spatial
stage islands, whereas higher richness is expected           distribution of aquatic invertebrates in the Caribbean.
in the middle-stage islands (Kraemer et al. 2022,            This is surprising since a majority of Caribbean islands
Whittaker et al. 2017, Whittaker et al. 2008). Likewise,     include a variety of large lowland and mountain
endemism rate should decrease with the increase in           rivers and many lakes and wetlands (CEPF 2010).
extinction resulting from ontogenetic changes (Chen          Despite their small size, some of these remote islands
and He 2009, Whittaker et al. 2007). Finally, below a        are recognized for their high species richness. For
certain size, island area becomes a poor predictor of        example, the Virgin and Cayman Islands are exhibiting
species richness, whereas habitat (stochastic events,        a particularly high level of biodiversity/endemism
natural disturbances) may be more influential on             (CEPF 2010). A majority of biogeographical research on
species richness (Triantis et al. 2006). The difference in   Caribbean aquatic invertebrates consists of scattered
the island area-species richness relationship between        taxonomic studies providing species checklists. The
small and larger islands is known as the small island        only study dealing with aquatic insect biogeography
effect (SIE, Lomolino and Weiser 2001, Matthews and          in the Caribbean islands was by Flint (1978) and was
Rigal 2021).                                                 limited to Trichoptera and Odonata. The author showed
    Due to its geological history and geographic             that Trichoptera species were very highly endemic,
location, the Caribbean archipelago is an excellent          with 80% of the species being known from only one
study system to ask certain biogeographic questions.         island, whereas the Odonata species were much more
In this region, islands are the result of various            widespread, with only 15% of the species restricted
geological events (e.g., sediment uplift, accretion          to a single island. It should be noted, however, that
prism and volcanic eruption; Cruse 2014) occurring           this study was restricted to the Greater Antilles (Cuba,
at distinct geological time scales. They are located         Hispaniola, Jamaica and Puerto Rico) and the medium-
close to the American continent (Central, North and          sized islands (Guadeloupe, Martinique, Grenada,
South America) and include a variety of landscapes           Dominique and St Vincent). Flint (1978) speculated
associated with a wide range of island areas (from           that Trichoptera had only poorly colonized the other
13 to >110,000 km2) and elevations (from 20 to 3087          Caribbean islands not included in the study because
m). This topographical variability, even within a single     of island isolation and low elevation, i.e. two major

Frontiers of Biogeography 2022, 14.3, e54479                                     © the authors, CC-BY 4.0 license     2
Cineas & Dolédec Aquatic entomofauna of the Caribbean archipelago
factors conditioning Trichoptera species distribution. weaker dispersers (e.g. Ephemeroptera). (4) Local
Indeed, Odonata are known to be good dispersers environmental variables should secondarily influence
in other parts of the world, whereas Trichoptera are species richness, endemism and composition of the
weaker dispersers (Bonada et al. 2012). This variation Caribbean islands.
in species dispersal among taxa may partly explain the
large-scale distribution of species and constitute a Materials and Methods
source of variation in the taxonomic composition and
richness among Caribbean island aquatic communities The Caribbean archipelago
(Bonada et al. 2012, Marquèz and Kolosa 2013). The Caribbean is a vast archipelago that extends
The main aim of this study was to quantify the between Florida and Venezuela and consists of
relative contributions of geographical situation (area, approximately 7,000 islands and islets of varying sizes
distance from the mainland) and time of emergence of covering an area of 234,000 km2 (Ridvan (2007) (Fig. 1).
the islands, local environmental conditions (elevation, The Caribbean archipelago encompasses three groups
air temperature, rainfall) and dispersal ability of taxa of islands: (1) the Greater Antilles (Cuba, Hispaniola,
in determining the overall species richness, endemic Puerto Rico and Jamaica), located at the north end and
species richness and species composition of the aquatic which represent 90% of the total area (GA in Table 1);
entomofauna of the Caribbean islands. We achieved (2) the Lesser Antilles, located at the centre and
this based on a database of 1027 aquatic insect species southern end, include small and medium-size islands,
across 26 GCUs assembled from the literature. Based which are subdivided into middle stage (early emerged)
on island biogeographic models and theories discussed and younger (lately emerged) islands (noted LAa and
above, we used our data to test four predictions: (1) LAb respectively in Table 1); and (3) the Cayman Islands,
Following TIB, we expected island area and distance to the Bahamas and the Turks and Caicos Islands (OT in
island to be the main driver of species richness with a Table 1). Note that Aruba, Bonaire, Curacao, Trinidad
higher richness in larger islands and a lower richness for and Tobago are usually included in the Lesser Antilles
remote islands. In addition, due to the SIE, if speciation only due to their size, but here they were included into
rate increases with island area, a transition zone the third group for the purpose of our study (OT in
(threshold) should occur with a steeper relationship for Table 1). Most Caribbean islands arose from volcanic
larger than for smaller islands. (2) Due to ontogenetic activities, with the exceptions of Barbados (accretion
changes (see GDM), we expected older and younger prism), Bahamas (accumulation of carbonate marine
islands (higher rate of extinction) to exhibit lower sediment) and Trinidad (fragmentation of South
species richness than middle-stage islands. (3) The American continent) (Cruse 2014), and emerged at
size of the distribution ranges of species should reflect distinct geological times (Graham 2003; Table 1).
their varying dispersal abilities, with good dispersers Relief greatly varies across the Caribbean archipelago,
(e.g. Odonata) having larger spatial distribution than comprising low-altitude islands (e.g., Cayman Islands
Figure 1. Map of the Caribbean archipelago showing the 26 selected GCUs. The acronyms of GCUs are given in Table 1.
Frontiers of Biogeography 2022, 14.3, e54479 © the authors, CC-BY 4.0 license 3Table 1. Geographical and local variables gathered for this study in each GCU with their acronyms, their geological origin and emergence period (AGE) and geographical
grouping (GA=Greater Antilles, LAa = ancient Lesser Antilles, LAb= recent Lesser Antilles, OT = Other) (DFM = distance from mainland; AREA = unit area; CLIM= climate
heterogeneity, classes 4 and 5 were grouped; TMax and TMin = maximum and minimum annual air temperature; RMax and RMin = maximum and minimum annual rainfall;
see Appendix S3 for references).
AGE DFM AREA ELEV TMax TMin RMax RMin
Cineas & Dolédec
Unit Grouping Acronym Origin CLIM PERM
(1006 y.) (km) (km2) (m) (°C) (°C) (mm) (mm)
Antigua and Barbuda LAa ANB Volcanic 50-20 692.0 442 402 2 31 22 1,708 667 0
Aruba OT ARU Volcanic 125-80 27.3 193 184 1 30 27 800 200 0
Bahamas OT BAH Sedimentary uplift 0.1 202.1 13,943 64 3 34 15 1,600 600 0
Barbados LAb BAR Accretion prism 50-0.12 356.7 432 336 2 31 20 1,875 1,500 0
Bonaire OT BON Volcanic 125-80 90.0 288 239 1 32 26 1,050 200 0
Cayman OT CAY Volcanic 40-30 493.8 259 20 1 29 25 1,800 300 0
Frontiers of Biogeography 2022, 14.3, e54479
Cuba GA CUB Volcanic 125-80 200.0 110,992 1,972 4 31 25 2,518 1,279 200
Curaçao OT CUR Volcanic 125-80 67.0 444 375 1 32 26 1,100 220 0
Dominica LAb DOM Volcanic 20-1.6 497.8 754 1,447 1 32 26 9,000 1,245 365
Grenada LAb GRE Volcanic 50-20 137.6 344 840 2 32 19 3,500 1,500 71
Guadeloupe LAb GUA Volcanic 33.3-1.6 574.9 1707 1,467 3 32 20 4,000 1,000 55
Hispaniola GA HIS Volcanic 125-80 572.0 80,000 3,087 5 35 15 3,000 400 152
Jamaica GA JAM Volcanic 125-80 668.0 11,264 2,255 3 31 15 5,800 762 100
Martinique LAb MAR Volcanic 20-1.6 416.0 1,128 1,397 3 31 25 4,000 1,200 70
Montserrat LAa MON Volcanic 20-1.6 657.0 104 915 1 31 22 2,000 1,250 0
Puerto Rico GA PUE Volcanic 125-80 732.4 8,959 1,338 1 31 22 4,500 850 100
Saba LAb SAB Volcanic 20-1.6 773.5 13 887 1 29 24 2,250 490 0
St Kitts and Nevis LAb SKN Volcanic 20-1.6 706.3 269 1,156 2 32 18 3,800 1,000 1
St Barth LAa STB Volcanic 50-20 787.8 25 273 1 32 23 1,300 450 0
St Eustatius LAb STE Volcanic 20-1.6 741.9 22 870 1 28 25 1,300 520 0
St Lucia LAb STL Volcanic 20-1.6 341.4 616 951 1 33 20 3,420 1,265 37
St Martin LAa STM Volcanic 50-20 802.2 87 484 1 31 22 1,150 450 0
St Vincent and LAb STV Volcanic 20-1.6 272.2 389 1,234 1 31 24 3,800 1,500 15
Grenadines
Tobago OT TOB Continental 125-80 105.1 300 567 3 31 22 2,500 400 15
fragmentation
Trinidad OT TRI Continental 125-80 14.8 4,828 940 3 31 21 2,980 570 55
© the authors, CC-BY 4.0 license
fragmentation
Virgin Islands LAa VIS Volcanic 125-80 791.3 505 521 1 29 24 1,580 450 0
4
Aquatic entomofauna of the Caribbean archipelagoCineas & Dolédec Aquatic entomofauna of the Caribbean archipelago
with an elevation of 20 m maximum) and islands with distance of each unit from South America, North
peaks beyond 3000 m a.s.l. (e.g., Hispaniola, 3087 m; America and Central America using Google Earth™. For
countrystudies.us; https://www.worldatlas.com). In each GCU, we also documented the maximum elevation
addition, climatic conditions vary from arid tropical (ELEV in Table 1; Meditz and Hanratty 1987; https://
to humid tropical with temperatures ranging between www.countrystudies.us; https://www.worldatlas.
15°C and 35°C and rainfall ranging between 200 and com), climate heterogeneity by counting the number
9000 mm per year (https://www.meteo.cw/; http:// (from 1 to 5) of different climates occurring in each
en.climate-data.org). GCU (CLIM in Table 1, see Appendix S3 for references),
annual minimum and maximum air temperature (TMin
Study sites and TMax, respectively, in Table 1), annual minimum
Since there is a large number of very small islands and maximum rainfall (RMin and RMax, respectively,
in the Caribbean archipelago, we combined groups in Table 1), number of permanent streams (PERM
of islands into GCU. For example, we considered in Table 1; see Appendix S3 for references), and the
Cuba and its 4,194 satellite islands and islets as one approximate period of emergence of units (AGE in
GCU. Likewise, the Bahamas, which comprises 700 Table 1; see Appendix S3 for references).
secondary islands, was considered a single GCU. Finally,
twin islands such as St Kitts and Nevis, St Vincent and Data analyses
Grenadines, and Antigua and Barbuda were considered We investigated the island species area-relationships
together. In total, we retained 26 GCUs (omitting (ISAR) using piecewise regression models (Matthews
Anguilla and the Turks and Caicos Islands due to a lack and Rigal 2021). Seven models were considered:
of available data and not shown on Fig. 1). continuous one- and two-threshold, discontinuous
Species inventories one- and two-threshold, left-horizontal one- and
two-threshold and linear. Models with the smallest
We gathered species inventories on each island BIC were selected as the best models for depicting
based on research works including doctoral theses the ISAR of overall OCTE species richness and of each
and scientific papers, Proceedings and United Nations OCTE order separately, respectively.
Convention on Biological Diversity (CBD) reports To analyse the spatial patterns in species richness
and checklists using “Caribbean aquatic insects” as and composition, we constructed a neighbouring graph
keywords. Several online databases (e.g., https://www. (Fig. S1) from a spatial matrix that contained as many
odonatacentral.org; https://sites.google.com/site/ rows and columns as the number of GCUs, assigning a
distributionaldatabase) or Web portal (e.g., https:// value of ‘1’ if two units were neighbours among the 26
www.gbif.org; https://www.dutchcaribbeanspecies.
org, especially for ARU, BON, CUR, SAB, STE and STM) GCUs and ‘0’ for ‘otherwise’ in the ith row and the jth
were also considered to complete our database. Part column of the matrix. We linked a unit to its nearest
of the gathered information was verified by a leading neighbour considering the shortest path between
scientist (F. Meurgey, pers. com.). References that were units. We further quantified the spatial autocorrelation
used to gather data are available as Supplementary among GCUs in terms of species richness using Moran’s
Information (Appendix S1). Ten orders of aquatic I (1950) statistics (Cliff and Ord 1973). Positive and
insects were initially considered: Coleoptera, significant Moran’s I values indicate that nearby GCUs
Diptera, Ephemeroptera, Hemiptera, Hymenoptera, have similar spatial patterns, whereas negative values
Lepidoptera, Megaloptera, Odonata, Plecoptera and indicate the opposite. All Moran’s I values were further
Trichoptera. Due to insufficient information for all tested using Monte Carlo permutations (999 runs).
groups in all GCUs (Appendix S2), we retained only The above computations were performed for the
the four best documented orders, namely, Odonata, whole OCTE data and for each OCTE order separately,
Coleoptera, Trichoptera and Ephemeroptera (OCTE), respectively.
which also represented different dispersal abilities (see We computed both overall OCTE species richness
Bonada et al. 2012). The validity of the name of each and species richness of each OCTE group separately
species was checked using the Interagency Taxonomic using the species presence-absence table elaborated
Information System (ITIS) to avoid synonymous species from our literature review. In addition, to assess
names, and we checked whether each species lived patterns of endemism, we calculated the number of
in aquatic habitats with the Catalogue of Life (https:// species that were unique to each GCU, i.e., endemic
www.catalogueoflife.org/) and the Dutch Caribbean species. We calculated the endemism rate for
Species Register (https://www.dutchcaribbeanspecies. combined OCTE and for each OCTE order separately,
org). respectively, as the ratio between the number of
endemic species and total number of species.
Geographical and local variables Prior to statistical analyses, we used a variance
We documented two variables associated with inflation factor (VIF) to assess multicollinearity in our
TIB: unit area (AREA in Table 1, Meditz and Hanratty variables (Zuur et al. 2010). We separated the variable
1987; https://www.countrystudies.us; https://www. AGE (Table 1) into three components, i.e. the start of
worldatlas.com) and the minimum distance from the emergence (not used in analysis, see below), the end of
mainland (DFM in Table 1). This value was obtained emergence and the duration of emergence (difference
from the measurement of the shortest approximate between the two previous values).
Frontiers of Biogeography 2022, 14.3, e54479 © the authors, CC-BY 4.0 license 5Cineas & Dolédec Aquatic entomofauna of the Caribbean archipelago
We used generalized linear modelling (GLM) to described in the material and methods (see above) and
assess the effects of area, distance from the mainland, a grouping provided by cutting the tree generated with
time of emergence, and local variables and their Jaccard distance according to the Ward’s maximization
interactions on freshwater insect species richness. criterion (Murtagh and Legendre 2014). We further
We used a negative binomial error for overall OCT computed an Analysis of Similarities (ANOSIM), which
and each OCT order separately, and Poisson error for provided an ANOSIM R statistic for each grouping and
Ephemeroptera, which gave a more normal distribution an associated simulated probability (permutation
of residuals. Models were selected using a stepwise procedure) to assess the strength of groupings.
approach based on Akaike’s information criterion Geographical variables (area, distance from mainland)
(AIC). Likelihood ratio tests allowed us to compare and environmental variables (climate heterogeneity,
the deviance of each selected model and a null model temperature and rainfall), as well as the end and
(no effect). To assess the effects of area, distance from duration of emergence were fitted to the NMDS
mainland, time of emergence, and local variables on ordination to allow visualisation of their contribution
overall OCTE endemism rate and on the endemism to the NMDS ordination. The goodness of fit was
rate of each OCTE order, we used the logit model assessed by a squared correlation coefficient and the
with a quasi-binomial error distribution to account significance of the variance explained was obtained
for potential overdispersion (see McCullagh and from the permutation of environmental variables.
Nelder 1989). For model selection here, we used the All data analyses were carried out using R
quasi-likelihood form of Akaike’s information criterion software version 4.0.3 (R Development Core Team
(QAIC). The statistical significance of model parameters 2020) and the ade4 (Thioulouse et al. 2018), vegan
was estimated by an analysis of deviance (validated (Oksanen et al. 2016) and MASS (Venables and Ripley
by “F” tests, McCullagh and Nelder 1989) between a 2002) packages. Specific graphics were displayed using
null model (no effect) and a model that included the the adegraphics (Siberchicot et al. 2017), pixmap
selected explanatory variables. To address the strength (Bivand et al. 2011), spdep (Bivand and Wong 2018)
of variables in models, we computed effect sizes as and sars (Matthews et al. 2019, Matthews and Rigal
the exponential of GLM coefficients, which represents 2021) packages.
incidence rate ratios (IRR) for negative binomial
regression and odds ratios (OR) for quasi-poisson or
poisson regression. A value close to 1 represented a Results
small effect size for a given variable. The magnitude
of a value above 1 demonstrated a proportional size Species richness
effect of the variable. Our database of OCTE Caribbean aquatic
Finally, for assessing the similarity of GCUs in entomofauna included 1027 species comprising
terms of species composition, we used nonmetric 192 Odonata, 360 Coleoptera, 405 Trichoptera, and
multidimensional scaling with the Jaccard distance 70 Ephemeroptera. Cuba was the richest GCU (390
index (NMDS, Minchin 1987). We further considered species, Fig. 2), followed by Hispaniola (290), whereas
two types of grouping: the three groups of GCUs as some islands, such as St Eustatius or Saba, hosted
Figure 2. Mapping of the overall species richness of combined Odonata, Coleoptera, Ephemeroptera and Trichoptera
(OCTE) in each studied GCU centered on the mean richness across GCUs. The size of squares is proportional to the absolute
scaled richness. Open and closed symbols represent values below and above the mean, respectively.
Frontiers of Biogeography 2022, 14.3, e54479 © the authors, CC-BY 4.0 license 6Cineas & Dolédec Aquatic entomofauna of the Caribbean archipelago
only a few species (6 and 4 species, respectively). of Odonata richness in TOB, the model turned to a
Odonata were present in all GCUs, whereas Coleoptera, linear relationship with island area. Discontinuous
Trichoptera and Ephemeroptera were absent from 2, two-threshold models fitted Trichoptera species
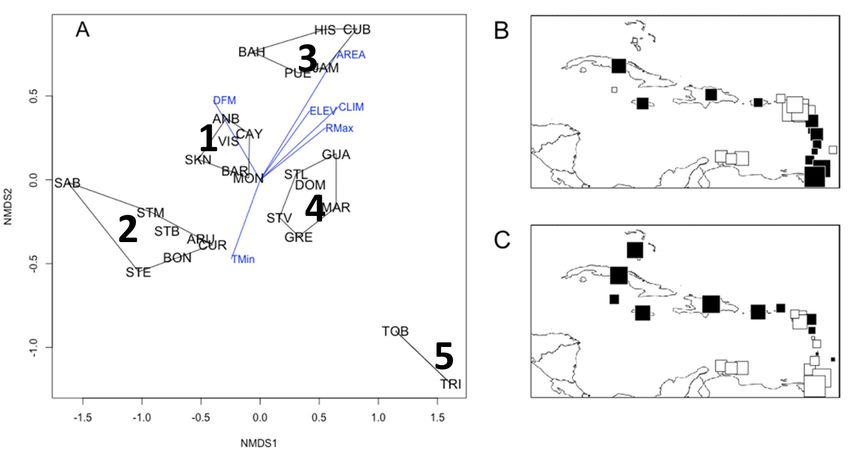
10, and 12 GCUs, respectively (Fig. 3). ISAR analyses richness but when omitting the extremely low value
demonstrated at least one threshold for overall OCTE of Trichoptera richness in BAH, the best fitted model
species richness and for each OCTE insect orders for this order was linear (Fig. 4, Table 2).
(Fig. 4, Table 2). Continuous one-threshold models
fitted overall OCTE and Coleoptera species richness, Looking at spatial patterns, the overall richness
respectively, whereas discontinuous two-threshold had a significantly positive Moran’s I value (MI=0.473,
models fitted Ephemeroptera species richness, simulated P=0.020). Coleoptera and Odonata had
respectively (Fig. 4, Table 2). Continuous one-threshold significant positive Moran’s I values (MI=0.425,
model fitted Odonata species richness if accounting P=0.016, MI=0.463, P=0.008, respectively), whereas
for all GCUs but if omitting the extremely high value Ephemeroptera and Trichoptera demonstrated no
Figure 3. Mapping of the Odonata (A), Coleoptera (B), Trichoptera (C) and Ephemeroptera (D) species richness in each
studied GCU.
Table 2. Results of the best fit piecewise regression model (according to BIC (Bayesian Information Criterion) for the overall
and for each taxonomic group of aquatic invertebrates studied (CO = Continuous One-Threshold, DT=Discontinuous Two-
Thresholds, LI=Linear, LT=Left-Horizontal Two-Threshold). A second model is given (in parenthesis) for Overall OCTE, and
for Odonata and Trichoptera after omitting Tobago (TOB) and BAH (Bahamas) values respectively. The log likelihood (LL),
quality (AIC (Akaike Information Criterion), AICc (Akaike Information Criterion with a correction for small sample sizes),
BIC), r-squared (R2) and adjusted r-squared (R2adj) are given for each model as well as the log values of area threshold
(Th1, Th2).
Overall Coleoptera Odonata Trichoptera Ephemeroptera
Model CO (LT) CO LI (CO) DT (LI) DT
LL -127.1 (126.8) -97.4 -108.9 (-80.6) -61.4 (-62.0) -27.2
AIC 264.1 (265.6) 204.8 223.9 (171.1) 140.8 (130.0) 72.3
AICc 267.1 (270.0) 208.1 225.0 (174.3) 170.8 (132.2) 117.3
BIC 270.4 (273.2) 210.7 227.6 (177.2) 147.7 (132.2) 78.1
R2 0.87 (0.87) 0.85 0.54 (0.91) 0.89 (0.79) 0.97
R2adj 0.86 (0.86) 0.83 0.52 (0.90) 0.83 (0.77) 0.95
Th1 11.0 (3.7) 11.2 - (11.0) 6.4 (-) 6.6
Th2 - (11.0) - - 9.3 (-) 9.3
Frontiers of Biogeography 2022, 14.3, e54479 © the authors, CC-BY 4.0 license 7Cineas & Dolédec Aquatic entomofauna of the Caribbean archipelago large-scale spatial patterns (MI=0.111, P=0.189 and significantly correlated with ELEV (r=0.767, P
Cineas & Dolédec                                                            Aquatic entomofauna of the Caribbean archipelago

in Table 3) was a main driver of the overall and                rate ranged between 1.8% (e.g., Jamaica) and
Odonata and Coleoptera species richness. The end                42.4% (Tobago), whereas the Trichoptera endemism
of island emergence (AGE_END in Table 3) had a                  rate ranged between 2.4% (Dominica) and 75.4%
significant positive effect on the overall richness and         (Hispaniola) if Curaçao was omitted, which included
separate groups with the exception of Coleoptera                only one Trichoptera species. Ephemeroptera species
and Ephemeroptera Among local variables, climate                were restricted to the larger GCUs (Greater Antilles,
heterogeneity (CLIM in Table 3) was a main driver of            Grenada, Guadeloupe and Martinique), and the
the overall and separate insect group richness, with            endemism rate of this group ranged between 35.7%
the exception of Coleoptera. In addition, a minor               (Martinique) and 89.2% (Cuba). Grenada hosted only
interaction occurred between DFM and CLIM for the               two Ephemeroptera species, among which one was
overall richness suggesting that the effect of CLIM             endemic, leading to a 50% endemism rate. Finally,
was less important if DFM increased and vice versa              the Coleoptera endemism rate ranged between 5.6%
(Table 3). Other local variables had a less pronounced          (Caymans Islands) and 61.9% (Tobago) and Cuba hosted
effect. Elevation (ELEV in Table 2) influenced the overall      the highest number of endemic Coleoptera species.
richness and separate insect group species richness                According to GLM results, geographical variables
with the exception of Odonata and Trichoptera.                  had no or minor effects (DFM for Odonata and
Minimum rainfall (RMin in Table 3) significantly                Coleoptera) on the endemism rate (Table 5). Climate
influenced the overall and Odonata. Minimum air                 heterogeneity was prominent in terms of explaining
temperature (TMin in Table 3) had a very marginal               the endemism rate overall and that for separate insect
effect on Ephemeroptera species richness.                       groups, with exception of Trichoptera. The other local
                                                                variables had no or minor effects (ELEV and RMin in
Endemism                                                        Table 5) on the endemism rate.
   A total of 657 OCTE species were endemic to
one GCU (i.e., 64% of the total number of species;              Species composition
Appendix S4). Trichoptera and Coleoptera had the                   NMDS performed on the species presence/absence
highest number of endemic species [297 (28.9%)                  provided a fairly good representation of units into two
and 228 (22.2%), respectively], whereas Odonata                 dimensions (Stress= 0.113). Grouping units into five
and Ephemeroptera had a lower number of endemic                 groups provided a better separation (ANOSIM r=0.857;
species [75 (7.3%) and 57 (5.6%), respectively, see             P=0.001) than using the four groups presented in
Table 4]. Cuba demonstrated the highest overall OCTE            Table 1 (r=0.272; P=0.001). To interpret the grouping,
endemism (49.2%), followed by Hispaniola (44.8%)                geographical and local variables were fitted to the
and Tobago (39.5%). For some GCUs, we found a                   NMDS ordination (Fig. 5A and Table 5). Island area
much lower rate of endemism (e.g., Dominica, 3.1%;              (AREA in Table 5), climate heterogeneity (CLIM)
Cayman Islands, 2.1%) or even no endemic species                and maximum precipitation (RMax) were the main
in Saba, St Barthelemy, St Eustatius, St Martin, and            variables associated to NMDS1. They were positively
the Virgin Islands (0%). The Odonata endemism                   correlated with elevation (ELEV) and negatively

Table 3. Effect sizes (IRR (Incident Rate Ratio)) and confidence intervals of variables (in brackets) and their interactions
explaining species richness overall and for each order of aquatic invertebrates studied obtained from GLM. Akaike’s
information criterion (AIC), the likelihood ratio (statistics with *) and the associated probability (P) are given for each
GLM model except Ephemeroptera. For this latter group a Poisson model gave a better fit and we considered analysis
of deviance (statistics with **). Taxonomic groups are arranged by decreasing dispersal ability (DFM, distance from the
mainland; AREA, covered by the GCU; AGE_END, end of emergence process; ELEV, elevation; CLIM, climate heterogeneity;
TMin, minimum air temperature; RMin and RMax minimum and maximum rainfall, respectively).
  Variable            Overall               Odonata           Coleoptera            Trichoptera         Ephemeroptera
DFM                       -                     -                   -               1.0 [1.0,1.0]         1.0 [1.0,1.0]
AREA                1.7 [1.3,2.2]         1.4 [1.0,1.7]       2.3 [1.8,2.9]               -                     -
AGE_END             3.2 [1.4,7.2]         2.9 [1.5,5.4]             -               3.2 [1.3,8.4]               -
ELEV                0.9 [0.9,1.0]         0.9 [0.9,1.0]             -               1.0 [1.0,1.1]               -
CLIM                2.7 [1.5,4.7]         1.4 [1.1,1.7]             -               1.6 [1.2,2.0]         3.6 [2.7,5.1]
TMin                      -                     -                   -                     -               1.0 [1.0,1.0]
RMax                1.0 [1.0,1.0]         1.0 [1.0,1.0]             -                     -                     -
RMin                1.1 [1.0,1.2]               -             1.1 [1.0,1.1]               -               1.1 [1.0,1.2]
DFM:CLIM            0.9 [0.9,1.0]               -                   -                     -                     -
AIC                    245.7                 201.8               195.5                 136.1                  61.3
Statistics             58.4*                 36.6*               32.5*                 28.6*                126.8**
P                     3.2 10-10             7.3 10-07           8.7 10-08             9.4 10-06
Cineas & Dolédec Aquatic entomofauna of the Caribbean archipelago
correlated with minimum air temperature (TMin). End or duration of emergence (AGE_END and DURA
Distance from the mainland (DFM) and area (AREA) in Table 5) were not related to the NMDS ordination.
The four variables having the highest fit (R2 values
were the main variables significantly and positively
in Table 5) included by decreasing order AREA, CLIM,
related to NMDS2, whereas minimum air temperature RMax and DFM. As a result, two gradients could be
(TMin) was negatively related to NMDS1 and NMDS2. put to the fore from the NMDS ordination (Fig. 5A). A
Table 4. Number of endemic species and species richness in each GCU. Values are given for overall and for each OCTE
group. The number before “/” represents the number of endemic species, and the number after “/” represents the total
richness (see acronyms of units in Table 1)
Unit Overall Odonata Coleoptera Trichoptera Ephemeroptera
ANB 3/49 0/10 3/39 -/- -/-
ARU 2/22 2/22 -/- -/- -/-
BAH 22/107 3/36 19/70 0/1 -/-
BAR 3/42 0/13 3/28 0/1 -/-
BON 1/13 1/12 0/1 -/- -/-
CAY 1/47 0/29 1/18 -/- -/-
CUB 192/390 13/90 73/166 73/97 33/37
CUR 4/25 3/22 0/2 1/1 -/-
DOM 3/96 0/25 2/28 1/41 0/2
GRE 17/83 0/19 11/37 5/25 1/2
GUA 41/180 0/37 20/68 15/61 6/14
HIS 130/290 8/70 27/93 89/118 6/9
JAM 47/155 1/56 4/37 39/58 3/4
MAR 32/126 1/32 10/26 16/54 5/14
MON 6/46 1/16 4/22 1/7 0/1
PUE 34/140 0/38 8/57 23/41 3/4
SAB 0/4 0/2 0/2 -/- -/-
SKN 2/28 0/10 2/17 -/- 0/1
STB 0/11 0/9 0/2 -/- -/-
STE 0/6 0/6 -/- -/- -/-
STL 16/93 0/30 15/48 1/15 -/-
STM 0/10 0/8 0/2 -/- -/-
STV 9/68 0/18 7/35 2/14 0/1
TOB 58/147 39/92 13/21 6/33 0/1
TRI 34/113 3/40 6/14 25/58 0/1
VIS 0/43 0/23 0/19 -/- 0/1
Table 5. Effect size (OR (Odd Ratios) and associated confidence intervals (in brackets) of geographical and local variables
explaining overall endemism rate and that for each order of aquatic invertebrates studied obtained from GLM. Taxonomic
groups are arranged by decreasing dispersal ability (see Table 1 for the acronyms of variables). The quasi-likelihood form
of Akaike’s information criterion (QAIC), the value of the analysis of deviance (F) and associated probability (P) are given
for each GLM model.
Variable Overall Odonata Coleoptera Trichoptera Ephemeroptera
DFM - 1.0 [1.0,1.0] 1.0 [1.0,1.0] - -
ELEV - - - 1.1 [1.0,1.2] -
CLIM 2.3 [1.7,3.0] 1.9 [1.1,3.1] 1.9 [1.4,2.7] - 3.4 [1.4,11.4]
RMin - - - 0.9 [0.8,1.0] -
QAIC 13.5 8.7 17.5 18.2 20.7
F 37.7 10.0 14.4 8.8 7.2
P 2.4 10-06 7.6 10-04 1.1 10-04 3.8.10-03 0.012
Frontiers of Biogeography 2022, 14.3, e54479 © the authors, CC-BY 4.0 license 10Cineas & Dolédec Aquatic entomofauna of the Caribbean archipelago Figure 5. Results of NMDS performed on the species presence/absence. (A) Position of GCUs (acronyms are available in Table 1) along the first and second NMDS dimensions (noted NMDS1 and NMDS2, respectively). Blue vectors correspond to the position of geographical and local variables (see acronyms in Table 1) having a statistically significant r-squared (see Table 6). The five clusters are identified by a number (see text for further details). Mapping of the first (B) and second (C) NMDS unit scores. The size of squares is proportional to the absolute value. Open and closed symbols represent values below and above zero, respectively. Table 6. Relative contributions of the geographical and distance from mainland. A second gradient separated local variables to NMDS ordination arranged by decreasing the smallest islands (group 2;
Cineas & Dolédec                                                        Aquatic entomofauna of the Caribbean archipelago

confirm other authors’ work showing a taxonomic              pattern should compensate and even exceed the
and context dependency of the ISAR (e.g. Gao et al.          rate of extinction on the larger islands (Chen and He
2019). Trichoptera and Ephemeroptera demonstrated            2009, Valente et al. 2014). Given this complexity, only
no increase in richness with increasing area suggesting      phylogenetic studies could shed light on the effects of
the existence of a small island effect (SIE, Lomolino and    ontogenetic changes by estimating colonization and
Weiser 2001) for island below ~760 km2 surface area.         speciation times.
When considering the second “best model”, overall OCTE
species richness also shows such a SIE. SIEs have been       Dispersal abilities of the Caribbean aquatic
observed several times in the literature and are generally   entomofauna
associated with stochastic events that structure small           The values of Moran’s I obtained by our analyses
island communities (Gao et al. 2019) contrasting with        were consistent with our predictions on the
communities of medium-sized and large islands mainly         distribution patterns of our study groups associated
determined by ecological processes and speciation,           to their varying dispersal abilities. Odonata and
respectively (Lomolino and Weiser 2001). In contrast,        Coleoptera are considered good dispersers, whereas
overall species richness across OCTE taxa (if considering    Ephemeroptera are weak dispersers and Trichoptera
the first “best” model), as well as of Odonata and           are moderate dispersers (Bonada et al. 2012,
Coleoptera demonstrated an initial slow rate of species      Sarremejane et al. 2020), and our study showed that
richness increase (below ~79,000 km2) with increasing        Odonata and Coleoptera had higher Moran’s I values
area followed by a steeper slope concerning essentially      than Trichoptera or Ephemeroptera. Species richness
Hispaniola (HIS) and (Cuba).                                 of all OCTE taxa combined as well as each OC order
    These differences in ISAR models among taxonomic         displayed a significant positive spatial autocorrelation
groups may reflect ecological differences among the          in the Caribbean archipelago, suggesting that close
orders. Differences in relief (elevation) regardless         GCUs generally have similar freshwater invertebrate
of area can specifically explain the SIEs observed           species richness. This resemblance in species richness
for Trichoptera since elevation is known for driving         among close GCUs suggests easier dispersal, which
Trichoptera species distribution (Bass 2003). For            facilitates the movement of individuals from one
example, though being the third largest island, BAH          GCU to another (Bass 2003) since good dispersers
being the second lowest GCU in elevation (see Table 1)       are generally good colonizers (e.g., McLachlan 1985).
had only one Trichoptera species. In addition, the           Geographically close units may also share a range of
Cayman Islands having the lowest elevation do not            similar ecological niches that favour the establishment
contain any Trichoptera species. For Ephemeroptera,          of species after arrival (Nekola and White 1999). The
differences in climate among GCUs regardless of area         fact that the statistical test for Trichoptera gave a
can specifically explain the observed SIEs, since most       positive Moran’s I value, whereas Ephemeroptera
Ephemeroptera species present in the Caribbean               did not, may be due to their wider range of ecological
were found on GCU with high climate heterogeneity            requirements (Bonada et al. 2004). Indeed, Trichoptera
(see Table 1).                                               are known to colonize springs, small streams, large
                                                             rivers, lakes and wetlands (Hering et al. 2009), whereas
Ontogenetic changes                                          many Ephemeroptera require more specific habitats
    The emergence of Caribbean islands occurred at           (Sartori and Brittain 2015). In our study, among the
different geological periods and their initial areas         two taxa with lower dispersal abilities, the taxon with
depended on the magma production rate and the                the highest ecological requirements (Ephemeroptera)
magnitude of eruptions (Jackson 2013). This geological       had fewer species than the richer group (Trichoptera).
complexity makes it difficult to detect the effect of        Thus, we can assume that there is a combination of
ontogenetic changes on species richness as expected          endogenous (dispersal ability of taxa) and exogenous
in our study. For example, our results showed that the       (environmental conditions, topographical variables)
older volcanic islands had a greater specific richness       factors that regulate the species composition of the
than the younger islands. This is in contradiction           Caribbean OCTE groups, in agreement with the findings
with island biogeographical models, which generally          of Bonada et al. (2012).
predict progressive increase in species richness from
younger volcanic islands (early colonisation) toward         Relative contribution of variables
middle-age islands and a decrease in species richness
in older islands due to a progressive decrease in area       Species richness and endemism
through time (erosion leading to reduction in habitat           Our results partially confirm the theory of classical
diversity) (Valente et al. 2014). Given their ongoing        biogeography in that island area is a major driver of
volcanic activities, the small recent volcanic islands       species richness of OCTE insect communities, whereas
are considered by some authors at the beginning of           the smallest distance to the mainland has only a
their emergence (Jackson 2013). As a result, their           marginal effect on Trichoptera and Ephemeroptera
young age could explain their lower specific richness.       richness. As a first explanation, the geographical
Alternatively, the positive relationship between age         conformation of the Caribbean archipelago adjoining
and overall species richness on larger islands may           three main lands may cause the OCTE species to have
be due to a high speciation rate common in insular           diverse origins. For instance, Crews and Esposito (2020)
tropical environments (Whittaker et al. 2008). This          found that of the 10 genera of terrestrial arthropods

Frontiers of Biogeography 2022, 14.3, e54479                                     © the authors, CC-BY 4.0 license    12
Cineas & Dolédec Aquatic entomofauna of the Caribbean archipelago
studied, five originated from South America, one periodic disturbance by tropical storms, island age
from North America, one from Central America, and and geological origin, which drive the physical and
three from two or all three of these main lands. As chemical properties of freshwater bodies (Bass 2003).
another example, in a biogeographical study of two NMDS analysis revealed a spatially organized OCTE
species of Caribbean Heliconiidae (Lepidoptera), D. species composition among Caribbean GCUs according
iulia was shown to originate from South America, to geographical and local filtering conditions, but not
whereas Heliconius charithonia originated from island age as expected from our fourth hypothesis.
Central America (Davies and Bermingham 2002). Only The initial grouping based on area and emergence
a phylogeographic study of the taxonomic composition age hardly separated groups of GCUs. In contrast,
of Caribbean aquatic entomofauna and of the adjacent the species composition of the largest GCUs, with
mainland would allow us to clarify this issue, and this high climatic diversity and elevation, was clearly
was out of the scope of this research. distinct from that of the smallest GCUs. In addition,
Among local variables, climate heterogeneity was the species composition of islands closer to South
a fairly good predictor for the overall OCTE species America differed significantly from those farther (see
richness and for separated OTE orders and the major Fig. 4). We found that the species composition may
predictor of the overall and separated endemism of the greatly vary among smaller islands, as already observed
Caribbean OCE orders. This result that was somewhat by Bass (2003), which underlines the uniqueness of
expected because several studies have already shown these environments. This difference among groups
that tropical climatic conditions are one of the major of geographic units is expected since differences in
elements responsible for diversification and speciation environmental conditions favour the establishment
on islands (Hua and Wiens 2013) as shown for reptiles and diversification of species on larger and more
(Gifford and Larson 2008), amphibians (Rodríguez et al. heterogeneous units (Schluter 2000). Oceanic
2010, Alonso et al. 2011), and freshwater fishes barriers may also limit the movement of individuals
(Doadrio et al. 2009). according to their dispersal ability (see above), as
The absence of influence of climate heterogeneity it has been shown that island isolation limits gene
on the Coleoptera richness may result from their flow among populations and favours differentiation,
stronger resistance to environmental constraints due (Benavides et al. 2007).Whereas geographical variables
to their physiological and morphological adaptations, (area and distance from mainland) are usually seen
such as sclerotization (Hammond 1979, Lawrence as major drivers of island fauna (MacArthur and
and Britton 1994), and they are known to display a Wilson 1967), we found that local filtering (climate
large variety of ecologies and life habits (Miller and heterogeneity and maximum rainfall) explained as
Bergsten 2016). We found a positive minor relationship much of the species composition. These results are
between elevation and Trichoptera species richness, in the line of the findings of other authors (Lack 1976,
which suggests a decrease in richness similar to that Gros-Désormeaux 2012). In addition, the amount of
observed elsewhere (Miserendino and Brand 2007, freshwater environment is obviously linked to rainfall
Blinn and Ruiter 2009, Maltchik et al. 2009). Indeed, (Bass 2003).
as indicated above, Trichoptera are known to colonize
high elevation habitats (Haidekker and Hering 2008, Limitation of the study
Cogo et al. 2020) with higher dissolved oxygen content Our study provides an analysis of the four best
and lower temperature (Serna et al. 2015) that may documented insect groups (Appendix S2). Only the
favour species diversification (e.g. Bass 2003, Statzner information for 26 GCUs could be gathered. From the
and Dolédec 2011). The almost total lack of effects species accumulation curves computed for the OCTE
of temperature on the richness of OCTE insects may groups, Odonata and Coleoptera seem rather well
be explained by the common low temperature range documented in our database, whereas the three other
in tropical regions. Only Ephemeroptera species groups seem far from reaching a “plateau”, suggesting
richness was positively but marginally influenced by the need for including more sites (Fig. S2). However,
the minimum air temperature. Ephemeroptera species we accumulated species by GCU, which represented
are sensitive to high temperatures and droughts various sampling units. As a result, the plateau may be
(Sartori and Brittain 2015). This result may explain their reach if considering all sampling units. Unfortunately,
narrower distribution and their absence from small it is very difficult from checklists, reports or even
Caribbean islands with more severe climatic conditions. papers to get the exact locality of samplings, which
For example, Callibaetis floridanus (Baetidae), known to would have helped to provide more accurate species
live in lentic and even temporary habitats (Merritt et al. accumulation curves. We collected information on 6
2008), was the only Ephemeroptera species present additional insect orders, using the same documents as
on the Virgin Islands, which have no or few permanent for OCTE orders (Diptera, Hemiptera, Hymenoptera,
water courses. Barber-James (2007) also recorded the Lepidoptera, Megaloptera, Plecoptera). Only one
absence of Ephemeroptera on remote islands such as Hymenoptera family occurred on one unit (DOM).
the Tristan da Cunha Archipelago and Gough Island. Lepidoptera identified at the family or genus level
appeared on 8 units, and one Megaloptera species
Species composition on one unit (CUB) was found in our literature review.
The species composition of Caribbean islands The data that we gathered for Diptera concerned only
is the product of multiple factors, including their species known as vectors of disease, which may bias
Frontiers of Biogeography 2022, 14.3, e54479 © the authors, CC-BY 4.0 license 13Cineas & Dolédec Aquatic entomofauna of the Caribbean archipelago
the distribution among islands. Diptera has long been remains preliminary since our database needs to be
considered as indicating poor water quality whereas further developed by completing our database with
this group has a large range of sensitivity to impairment other insect groups and conducting phylogeographic
(Serra et al. 2017) and could be given more focus in research. Such research would allow confirming
the area. The two Plecoptera species found in our endemic species and specifying the level and nature
literature review concerned only Trinidad and Tobago, of speciation to better understand the origin of
and should be given more focus as this group is known Caribbean biota, which is still under debate. Our
to be highly sensitive to water quality impairment results confirm that the observation that climatic
of (Lenat 1988). In contrast Hemiptera species were conditions are one of the major elements responsible
well documented and inhabited nearly all GCUs. We for diversification and speciation on islands holds for
decided not to include them in this study to keep a freshwater invertebrates. The high overall endemism
balance between good (Odonata, Coleoptera) and rate found in the Caribbean freshwater biota urges for
weak dispersers (Trichoptera and Ephemeroptera). In
addition, the GCUs were variously documented (see more conservation effort of this area under the threat
Appendix S2). Cuba was the best documented followed of rising anthropogenic disturbances.
by Guadeloupe, Puerto-Rico, Jamaica, Martinique,
Hispaniola and Dominique which cumulate more than Acknowledgements
50% of the documents covered. Notably, the island
area hardly affected our results since these GCUs Chevelie Cineas received funds from the French
represent a range between small (Dominique) and Embassy in Haiti in the context of a co-tutelle PhD
large (Cuba) GCUs. thesis between the University of Lyon 1 (France) and
Another limitation of our study is that we did the State University of Haiti (Haiti). This work was also
not account for the effect of human populations on performed under the auspice of the EUR H2O’Lyon
species richness patterns in our GCUs. Gao et al. (2019) (ANR-17-EURE-0018) of Université de Lyon (UdL) within
explained that because larger islands are generally the program ‘Investissements d’Avenir’ operated by the
more populated, human-mediated dispersal of species French National Research Agency (ANR). This article
among large islands are facilitated resulting in a slope was previously edited for proper English language,
lowering of SAR. However, this seemed not to affect grammar, punctuation, spelling and overall style by
our results because the slope of SAR for larger islands two highly qualified native English-speaking editors
was steep. In addition, Hispaniola (HIS) comprises two at American Journal Experts (certification verification
countries (Haiti and Dominican Republic). Haiti has
been highly deforested, which could have affected the key: 747A-2FFD-117D-C8B5-6BC3).
integrity of rivers whereas the Dominican Republic has
better preserved its forested areas. In spite of this, in Author Contributions
our data set, Hispaniola remains the second richest CC and SD conceived the ideas; CC elaborated the
island in OCTE. database; CC and SD analysed the data; and CC led
Building a database like ours was time consuming
and we advocate aquatic entomologists working in the writing with assistance from SD.
the Caribbean to implement a database of freshwater
invertebrates such as those developed elsewhere Data Accessibility
(e.g. Schmidt-Kloiber et al. 2019). There is an urgent The database supporting the findings presented in
need to collect this information since freshwater
ecosystems are among the most endangered in this study are accessible via the Dryad digital repositery
the world (Dudgeon et al. 2015) and due to its high at https://doi.org/10.5061/dryad.vhhmgqntx.
endemism, the Caribbean rivers require the highest
concern. Supplementary Material
The following materials are available as part of the
Conclusions online article at https://escholarship.org/uc/fb
Finally, the combination of geographical and local Figure S1: Location of the 26 selected GCUs with a
filtering variables in our study, with the exception of blue line joining them by considering the shortest path
Coleoptera that was mainly influenced by island area
and Ephemeroptera that was mainly influenced by Figure S2. Species accumulation curves for each insect
local variables, partially supports the biogeographic order under study. Sites stands for GCUs. [[Q2: Q2]]
conceptual model of Lomolino (2000). This result is Appendix S1. List of references and websites used to
also in line with a recent study by Vilmy et al. (2021), elaborate the database of aquatic Caribbean insects
who showed a generally more balanced situation Appendix S2. Number of documents considered for
between dispersal and niche processes for aquatic each freshwater invertebrate group in each GCU
macroinvertebrates in comparison to other taxa.
However, in our study, the local variables were Appendix S3. List of documents and websites used to
restricted to climate, but other variables, such as elaborate the environmental data set
the chemical properties of water and the nature Appendix S4. List of endemic species of the four insect
of the substrate, require consideration. Our study orders under study and their GCU
Frontiers of Biogeography 2022, 14.3, e54479 © the authors, CC-BY 4.0 license 14Cineas & Dolédec Aquatic entomofauna of the Caribbean archipelago
References larvae in Mediterranean streams: implications
for bioassessment methods. Environmental
Aguila, R.N., Pérez-Asso, A.R. & Genaro, J.A.
Pollution, 132, 509–521. https://doi.
(2017) Taxonomic reassessment of species
org/10.1016/j.envpol.2004.05.006
within the Chrysaoros group of Callisto
(Lepidoptera: Nymphalidae: Satyrinae). Camargo, A., Heyer, W.R. & de Sá, R.O. (2009)
Invertebrate Systematics, 31, 747–764. Phylogeography of the frog Leptodactylus
https://doi.org/10.1071/is17001 validus (Amphibia: Anura): patterns
and timing of colonization events in the
Alonso, R., Crawford, A.J. & Bermingham, E. (2011)
Lesser Antilles. Molecular Phylogenetics
Molecular phylogeny of an endemic radiation
and Evolution, 53, 571–579. https://doi.
of Cuban toads (Bufonidae: Peltophryne)
org/10.1016/j.ympev.2009.07.004
based on mitochondrial and nuclear genes.
Journal of Biogeography, 39, 434–451. https:// CEPF, Critical Ecosystem Partnership Fund (2010)
doi.org/10.1111/j.1365-2699.2011.02594.x Profil d’écosystème. Hotspot de la biodiversité
B a r b e r - J a m e s , H . M . ( 2 0 0 7 ) Fre s hwa te r des îles des Caraïbes. BirdLife International
invertebrate fauna of the Tristan da Cunha Report. Available at: https://www.cepf.net/
islands (South Atlantic Ocean), with new sites/default/files/final_french_caribbean_
records for Inaccessible and Nightingale ep.pdf
Islands. Transactions of the Royal Society Chen, X.Y. & He, F. (2009) Speciation and endemism
of South Africa, 62, 24–36. https://doi. under the model of island biogeography.
org/10.1080/00359190709519194 Ecology, 90, 39–45.
Bass, D. (2003) A comparison of freshwater Cliff, A.D. & Ord, J.K. (1973) Spatial autocorrelation.
macroinvertebrate communities on small London, Pion.
Caribbean islands. BioScience, 53, 1094–1100. Cogo, G.B., Martínez, J., Santos, S. & Graça,
https://www.cepf.net/sites/default/files/ M.A. (2020) Caddisflies growth and size
final_french_caribbean_ep.pdf along an elevation/temperature gradient.
Benavides, E., Baum, R., McClellan, D. & Sites Jr, J.W. Hydrobiologia, 847, 207–216. https://doi.
(2007). Molecular phylogenetics of the lizard org/10.1007/s10750-019-04082-3
genus Microlophus (Squamata: Tropiduridae): Crews, S.C & Esposito, L.A. (2020) Towards a
aligning and retrieving indel signal from synthesis of the Caribbean biogeography of
nuclear introns. Systematic Biology, 56, 776– terrestrial arthropods. BMC Evolutionary
797. https://www.cepf.net/sites/default/ Biology, 20, 1–27. https://doi.org/10.1186/
files/final_french_caribbean_ep.pdf s12862-019-1576-z
Bivand, R.S. & Wong, D.W.S. (2018) Comparing Cruse, R. (2014) La géologie des îles de la Caraïbe
implementations of global and local indicators et son influence sur les sociétés humaines.
of spatial association. TEST, 27, 716–748. In: Caribbean Atlas (ed. by R. Cruse and K.
https://doi.org/10.1007/s11749-018-0599-x Rhiney), pp. 1–27. Available at http://www.
Bivand, R.S., Leisch, F. & Maechle, M. (2011) Pixmap: caribbean-atlas.com/fr
Bitmap Images. R package version 0.4-11. Dávalos, L.M. (2004) Phylogeny and biogeography
Blinn, D.W. & Ruiter, D.E. (2009) Caddisfly of Caribbean mammals. Biological Journal of
(Trichoptera) assemblages along major the Linnean Society, 81, 373–394. https://
river drainages in Arizona. Western North doi.org/10.1111/j.1095-8312.2003.00302.x
American Naturalist, 69, 299–308. https:// Davies, N. & Bermingham, E. (2002) The historical
doi.org/10.3398/064.069.0303 biogeography of two Caribbean butterflies
Bonada, N., Dolédec, S. & Statzner, B. (2012) (Lepidoptera: Heliconiidae) as inferred from
Spatial autocorrelation patterns of stream genetic variation at multiple loci. Evolution,
invertebrates: exogenous and endogenous 56, 573–589. https://doi.org/10.1554/0014-
factors. Journal of Biogeography, 39, 3820(2002)056[0573:thbotc]2.0.co;2
56–68. https://doi.org/10.1111/j.1365- Doadrio, I., Perea, S., Alcaraz, L. & Hernández,
2699.2011.02562.x N. (2009) Molecular phylogeny and
Bonada, N, Zamora-Muñoz, C., Rieradevall, M. & biogeography of the Cuban genus Girardinus
Prat, N. (2004) Ecological profiles of caddisfly Poey, 1854 and relationships within the tribe
Frontiers of Biogeography 2022, 14.3, e54479 © the authors, CC-BY 4.0 license 15You can also read