Predictive classification of Alzheimer's disease using brain imaging and genetic data
←
→
Page content transcription
If your browser does not render page correctly, please read the page content below
www.nature.com/scientificreports
OPEN Predictive classification
of Alzheimer’s disease using brain
imaging and genetic data
Jinhua Sheng1,2*, Yu Xin1,2, Qiao Zhang3,4,5, Luyun Wang1,2, Ze Yang1,2 & Jie Yin1,2
For now, Alzheimer’s disease (AD) is incurable. But if it can be diagnosed early, the correct treatment
can be used to delay the disease. Most of the existing research methods use single or multi-modal
imaging features for prediction, relatively few studies combine brain imaging with genetic features
for disease diagnosis. In order to accurately identify AD, healthy control (HC) and the two stages
of mild cognitive impairment (MCI: early MCI, late MCI) combined with brain imaging and genetic
characteristics, we proposed an integrated Fisher score and multi-modal multi-task feature selection
research method. We learned first genetic features with Fisher score to perform dimensionality
reduction in order to solve the problem of the large difference between the feature scales of genetic
and brain imaging. Then we learned the potential related features of brain imaging and genetic
data, and multiplied the selected features with the learned weight coefficients. Through the feature
selection program, five imaging and five genetic features were selected to achieve an average
classification accuracy of 98% for HC and AD, 82% for HC and EMCI, 86% for HC and LMCI, 80% for
EMCI and LMCI, 88% for EMCI and AD, and 72% for LMCI and AD. Compared with only using imaging
features, the classification accuracy has been improved to a certain extent, and a set of interrelated
features of brain imaging phenotypes and genetic factors were selected.
Alzheimer’s disease (AD) is a complicated neurodegenerative disease involving a variety of pathogenic factors
(biological and psychosocial). As the condition worsens, patients often suffer from mental and cognitive disor-
ders, memory decline and behavior changes, which affect people’s normal life ability. Mild cognitive impairment
(MCI) is a state between normal and dementia which can be considered the early stage of AD. Nearly 10–15%
of MCI patients are converted into AD patients every year1. Except for a few number of familial cases driven
by genetic mutations, the main pathogenic factors of AD are still u nclear2. In 2017, AD has become the sixth
leading cause of death in the United States3. According to the International Alzheimer’s Disease (ADI) report
in 2019, approximately 95% of the public believe that they may suffer from AD in the f uture4. If the disease can
be detected early and measures can be taken timely, the onset of AD can be effectively delayed5. Therefore, early
diagnosis and early intervention are essential for the control of AD.
The increasing development of neuroimaging has brought new vitality to the study of human brain struc-
ture and function. Frequently-used brain imaging techniques include Magnetic Resonance Imaging (MRI)6,
Diffusion Tensor Imaging (DTI)5, Positron Emission Tomography (PET)7. Many researches focused on how
to use one of them or combine multiple imaging modalities to classify AD. Li et al.8 designed a powerful deep
learning system to identify different stages of AD patients based on MRI and PET. Bi et al.9 proposed a random
support vector machine clustering method to classify AD and HC, with an accuracy rate of 94.44%. At present,
the accuracy of AD and HC using imaging materials can reach more than 90%, while the accuracy of HC and
MCI is relatively low. There are two main reasons for low accuracy of early diagnosis. First, cerebral atrophy is
a gradual process, which is relatively subtle and difficult to detect in the early stages. Second, there is a certain
overlap in the data space between the normal aging of the brain of normal people with age and the brain atrophy
of early MCI patients.
In recent years, the integration of brain imaging and genetic data for research has become an active research
topic10. For genetically complex diseases, at the level of a single nucleotide polymorphism (SNP), it is impos-
sible to determine the main cause of the difference. Brain imaging genomics conducts comprehensive analysis of
1
College of Computer Science, Hangzhou Dianzi University, Hangzhou 310018, Zhejiang, China. 2Key Laboratory
of Intelligent Image Analysis for Sensory and Cognitive Health, Ministry of Industry and Information Technology
of China, Hangzhou 310018, Zhejiang, China. 3Beijing Hospital, Beijing 100730, China. 4National Center of
Gerontology, Beijing 100730, China. 5Institute of Geriatric Medicine, Chinese Academy of Medical Sciences,
Beijing 100730, China. *email: jsheng@hdu.edu.cn
Scientific Reports | (2022) 12:2405 | https://doi.org/10.1038/s41598-022-06444-9 1
Vol.:(0123456789)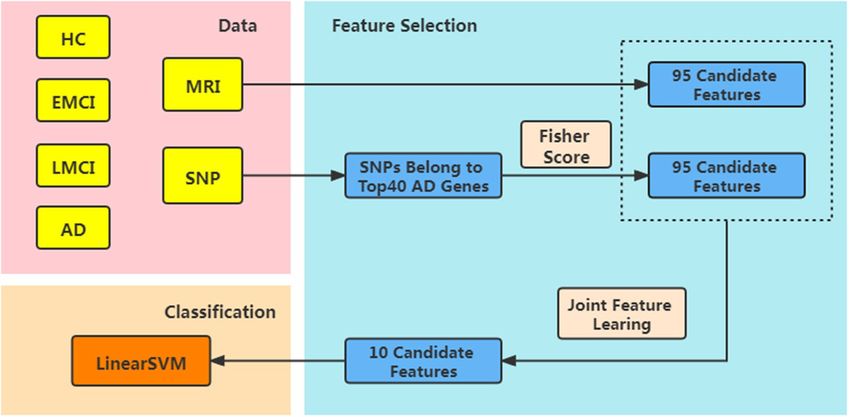
www.nature.com/scientificreports/
Figure 1. Specific steps of our method.
brain imaging and genomic data to obtain new insights, which have bright prospect for a better understanding
of disordered brain functions. Through high-throughput genotyping technology, Genome Wide Association
Studies (GWAS)11 determined the high-density genetic marker SNPs or gene copy number variation of large-
scale population DNA samples at the whole genome level. It is a strong way to identify disease susceptibility
loci. Researchers used GWAS to analyze SNP data and found that genetic factors play a significant role in the
development of AD12,13. Dukart et al.14 obtained an accuracy of 76% via Naive Bayes to identify converter and
stable MCI with glucose positron emission tomography as a single biomarker. The accuracy increased to about
87% when including further imaging data and APOE information. Dukart’s experimental results indicated that
adding genetic factors can indeed help image features to improve classification accuracy.
With the rapid development of machine learning and deep learning, people have found that it can be used as
an auxiliary diagnostic method, such as S VM15 and convolutional neural n etwork16,17. There are several difficul-
ties in the joint study of brain imaging and genetic data for classification and prediction: (1) High-dimensional
data can cause computational and statistical problems18, and different modalities are heterogeneous; (2) Models
may encounter multicollinearity problems for potentially correlated high-dimensional genetic variables19; (3)
High-dimensional genetic data contains a lot of redundant i nformation19.
How to effectively study genetic information and image phenotypes, while fully considering the heterogene-
ity of data and the robustness of the model, is a major challenge in the application of image genetics. In order to
improve the accuracy of AD diagnosis and make full use of the supplementary information between different
modalities, we integrate Fisher score and multi-modal and multi-task feature selection to learn brain imaging
and genetic data. Fisher score was used to pre-reduce high-dimensional genetic features and eliminated genetic
features with small contributions. Genetic features obtained and brain imaging data were used for multi-task
joint feature selection. Then, we used linear support vector machine (SVM) to predict healthy controls (HC),
early MCI (EMCI), late MCI (LMCI) and AD patients. Finally, we systematically evaluated the potential of modal
combinations and verified the effectiveness of the method. Figure 1 shows the steps of our method.
Results
To avoid the possible impact of different image acquisition equipment and genotyping techniques, data used in
this article were obtained from the Alzheimer’s Disease Neuroimaging Initiative (ADNI) database stage 2. Con-
sidering the category balance problem, we screened 100 subjects with brain imaging and genetic data measured at
the same age. The study sample (N = 100) included 25 HC subjects, 25 early MCI, 25 late MCI and 25 AD subjects.
The average age is 73.597 years, and the male to female ratio is 60:40. They have quality-controlled quantitative
brain imaging data and genetic data. The demographic and clinical characteristics of participants, summarized
by the diagnosis, are shown in Table 1 below.
Classification performance. In the experiment, we evaluated the performance of the method in different
cognitive groups: (1) HC and EMCI, (2) HC and LMCI, (3) HC and AD, (4) EMCI and LMCI, (5) EMCI and AD,
and (6) LMCI and AD. Due to the limited number of subjects, we used fivefold cross-validation (CV) to evaluate
model performance20. In fivefold CV, we randomly divided the data set into 5 parts, with 1 part for testing and
the remaining part was used for training. Repeat this process 5 times so that each part was tested once. In order
to obtain a more reliable performance estimate, we calculated the average of the test accuracy of 5 tasks as the
evaluation standard. Table 2 lists the cross-validation accuracy when using different machine learning methods
for group recognition. We can see that SVM is the relatively most suitable classification algorithm.
Scientific Reports | (2022) 12:2405 | https://doi.org/10.1038/s41598-022-06444-9 2
Vol:.(1234567890)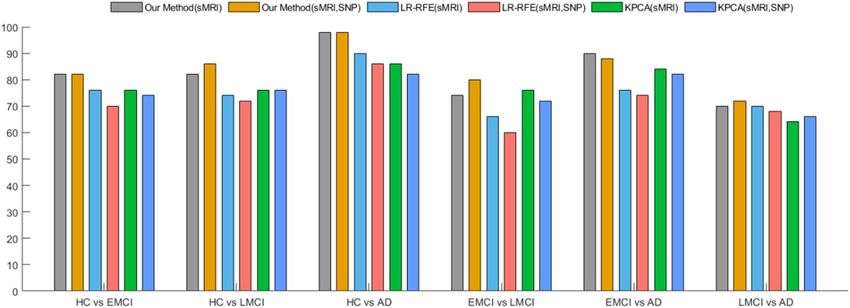
www.nature.com/scientificreports/
Diagnostic Male/Female Age (mean[min–max]) Education
Healthy control 15/10 73.44 [65.1–84.9] 17.12
Early mild cognitive impairment 14/11 71.04 [61.9–82.3] 16.04
Late mild cognitive impairment 15/10 73.47 [55.0–91.4] 16.64
Alzheimer’s disease 16/9 76.44 [55.9–90.3] 15.80
Table 1. Demographic characteristics of subjects.
HC vs EMCI (%) HC vs LMCI (%) HC vs AD (%) EMCI vs LMCI (%) EMCI vs AD (%) LMCI vs AD (%)
SVM 82 86 98 80 88 72
KNN 80 86 96 76 82 72
Tree 70 70 92 76 88 74
Ensemble 72 72 94 66 86 74
Table 2. Cross validation accuracy in identification of groups using different machine learning methods.
HC vs EMCI (%) HC vs LMCI (%) HC vs AD (%) EMCI vs LMCI (%) EMCI vs AD (%) LMCI vs AD (%)
SNP 50 50 58 52 46 40
sMRI 82 82 98 74 90 70
sMRI + SNP 82 86 98 80 88 72
Table 3. Classification performance comparison of different modes.
We considered the classification performance of three different input biomarker combinations based on
linear SVM. The three morphological data tested were: (1) SNP, (2) sMRI, (3) sMRI and SNP. Table 3 shows the
classification performance obtained by three different input biomarkers.
We analyzed the performance of a single mode and compared it with the performance of a multi-mode. We
can see that the performance of sMRI is far better than SNP, because brain structure changes are a phenotypic
feature closely related to diagnostic labels. However, including both cerebrum and genetic features as model
predictors enhanced the performance compared with using either cerebrum or SNP features alone. In most
tasks, especially MCI recognition, the performance of genetic imaging data was better than that of a single
modality. For example, the accuracy of using SNP+sMRI in HC and LMCI classification was 4% higher than
that of sMRI alone; the accuracy of EMCI and LMCI was improved by 6%; the accuracy of LMCI and ADI was
improved by 2%. However, for tasks such as HC and AD, EMCI and AD, which are relatively simple and have
great differences in themselves, compared with the performance of a single image modal, the performance of
multi-modality has not improved, and in some cases it may cause performance degradation. The main reason is
that in the absence of SNP, the performance of the model has reached a saturated state. At this time, adding SNP
data will be regarded as noise, which will have a negative impact on the performance of the classifier. Another
reason is that the sample set we use is relatively small.
Studying the phenotype or SNP feature of each brain region separately will discard the potential correlation
between the intra-modal features as well as between the features of different modalities. Univariate analysis can
quickly provide important information between genetic features or imaging features and diseases. In order to
further study the benefits of genetic and image data fusion learning, we compared with traditional univariate
feature selection without considering the potential correlation between modalities. LR-RFE21 iteratively elimi-
nates the features with the lowest contribution. It has been used and is expected to detect AD early and predict
the progress of A D21. KPCA22 believes that the greater the variance of data distributed along a certain feature,
the more information the feature contains. We used LR-RFE and KPCA to perform feature selection on image
and genetic information respectively. Five of each imaging gene features were selected and applied to linear
SVM for diagnosis.
Based on the performance of image features, we show the impact of three methods on classification perfor-
mance after adding genetic features. Figure 2 below shows that the accuracy of traditional feature selection for
those two modalities has decreased in most classification tasks. It illustrates that overfitting or increased noise
may occur after adding SNP features. But our method has achieved good performance in all six binary tasks,
and the performance has been further improved after combining SNP data. Different from traditional univari-
ate feature selection, we studied the correlation between image and genetic data in a public space, considered
the sparsity between different modalities through G1-norm, and used l2,1-norm regularization to jointly select
genetic information related to important image data. In the learning process, the differences of different mor-
phological features are fully considered, and different weights were assigned to each feature, which reduces the
risk of overfitting the training data by the classifier. The results show that the fusion of genetic information can
Scientific Reports | (2022) 12:2405 | https://doi.org/10.1038/s41598-022-06444-9 3
Vol.:(0123456789)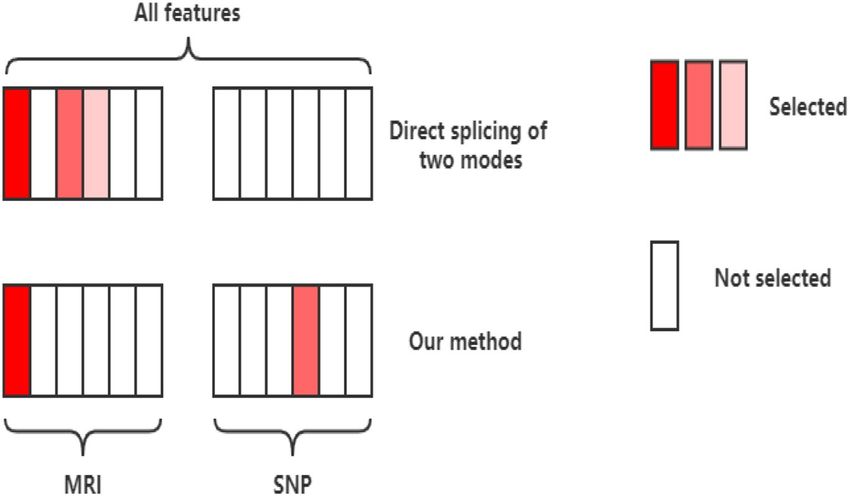
www.nature.com/scientificreports/
Figure 2. Classification performance of different feature selection methods.
HC vs EMCI HC vs LMCI HC vs AD EMCI vs LMCI EMCI vs AD LMCI vs AD
LHippVol
LHippVol
LHippVol RHippVol
ROI LAmygVol RPrecentral RPrecentral LInfParietal
LLingual RCuneus
RPrecentral
LInfParietal
Table 4. Most selected sMRI features for diagnosis.
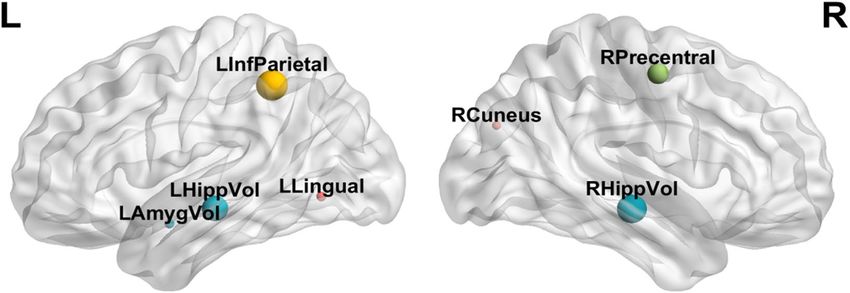
Figure 3. Brain distribution in the core brain area.
indeed take advantage of the complementarity between the modalities and eliminate the redundancy between
the modalities, thereby obtaining better feature representation and improving classification performance.
Selection of biomarkers. Finding out the most discriminating brain regions and SNPs is essential for
the diagnosis of AD. The brain regions and SNP data selected most in the experiment can be used as potential
biomarkers for clinical diagnosis. In Table 4, we give the brain imaging features that are selected every time in
fivefold CV, and Fig. 3 shows the distribution of these brain regions in the brain. “HippVol” (hippocampal vol-
ume) plays the significant role in predicting memory performance. “LHippVol” serves as an important potential
biomarker in the recognition of HC in the three stages of disease, implicating that it is an important indicator
for cognitive decline and has a potential for early detection of AD. “LAmygVol” (amygdala volume) was also
selected in the early diagnosis of HC and EMCI. This is because the hippocampus and amygdala are the first to
form plaques during the development of A D23. Besides, “Precentral” (thickness of precentral), “Lingual” (thick-
ness of lingual), “Cuneus” (thickness of cuneus) and “InfParietal” (thickness of inferior parietal) are also selected
in other classification groups. Zhang et al.24 used an intrinsic brain-based CAD system to detect 30 brain regions
related to AD, which was consistent with our results.
In terms of genetic information, the SNPs that have been selected many times for AD and HC classification
come from the AOPE gene. APOE is related to neuroimaging measurement of diseases, especially the left hip-
pocampus and right hippocampus25, which are the most significant risk factors for AD. In the diagnosis of MCI,
the SNPs that are selected multiple times come from the CR1 gene and the SORCS1 gene. They are also well-
known candidate genes related to MCI. CR1 mainly affects the development of AD by affecting Aβ deposition,
brain structure and glucose metabolism during the progression of A D26. During the experiment, many SNPs were
Scientific Reports | (2022) 12:2405 | https://doi.org/10.1038/s41598-022-06444-9 4
Vol:.(1234567890)www.nature.com/scientificreports/
Performance
Sr. no Year Authors Modality Dataset Method Target Acc (%) Sens (%) Spec (%)
12 FDG-PET, AV45-PET, 708(144AD, 265sMCI, Bayesian-Markov-Blan-
1 2016 Dukart et al. sMCI vs cMCI 86.8 87.5 86.1
sMRI, APOE 177cMCI, 122HC) ket + Naive Bayes
189(49AD, 93MCI, AD vs NC 96.1 97.3 94.9
2 2016 Peng et al. 28 MRI, PET, SNP Krenel-learning
47NC) MCI vs NC 80.3 85.6 69.8
CN 89 59 96
MRI, CSF, FDG-PET, Cascaded multi-view
149(52AD, 71MCI,
3 2017 Singanamalli et al. 29 APOE, cognitive canonical correlation MCI 80 88 80
26HC)
measures (CaMCCo)
AD 80 69 88
sMRI, APOE, FDG-
426(121AD, 126MCI-c,
4 2017 Liu et al. 30 PET, cognitive meas- ICA + Cox model MCI-c vs MCI-nc 84.6 86.5 82.4
108MCI-nc, 180NC)
ures, demographics
721(138AD, 358MCI, Conversion from MCI
5 2018 Ning et al. 31 MRI, SNP Neural network – – –
225CN) to AD
NC vs MCI vs AD – – –
NC vs sMCI vs pMCI
347(101AD, 138MCI, – – –
6 2019 Zhou et al. 32 MRI, PET, SNP Neural network vs AD
108NC)
NC vs MCI – – –
NC vs AD – – –
sMRI, APOE, cognitive
785(192AD, 181pMCI, Multi-tasking neural
7 2019 Spasov et al. 33 measures, demograph- sMCI vs pMCI 86 87.5 85
228sMCI, 184 HC) network
ics
723(170AD, 352MCI, Task balanced multi-
8 2020 Brand et al. 34 sMRI, SNP AD vs HC/MCI 72.8 – –
201HC) modal feature selection
Cluster evolution- AD vs HC 81 – –
109(37AD, 37EMCI,
9 2020 Bi et al. 35 fMRI, SNP ary random forest
35HC) EMCI vs HC 80 – –
(CERF) + SVM
AD vs HC 98 100 96
AD vs EMCI 88 88 88
Fisher score + Multi- AD vs LMCI 72 72 72
100(25AD, 25LMCI,
10 2021 Sheng et al. (this paper) sMRI, SNP task feature selec-
25EMCI, 25HC) LMCI vs HC 86 88 84
tion + SVM
LMCI vs EMCI 80 88 72
EMCI vs HC 82 80 84
Table 5. Example studies for outcome prediction via integrating imaging and genomics data.
selected from the same gene, such as SORCS1 gene, CR1 gene and DAPK1 gene. In general, our research results
are consistent with existing research, and provide help for the clinical diagnosis of AD and further exploration
of AD treatment strategies.
Discussion
Previous studies mostly used imaging features for disease prediction. Some researchers added APOE genes on
the basis of imaging to improve performance. For example, Filipovych et al.27 proposed a method to predict
the conversion of MCI to AD by compounding multiple imaging scores. They used the non-linear mode and
the linear mode to obtain the subjects’ imaging and genetic scores, and then synthesized the imaging genetic
scores as the weighted sum of the imaging scores and genetic scores. The accuracy of imaging markers only is
AUC = 0.746, and the accuracy is improved to AUC = 0.779 after including imaging genetic markers. However,
Filipovych’s experiment did not consider the correlation between imaging and genetic characteristics, and sim-
ply combined them through scoring. In Table 5, we gave a performance comparison mainly for recent studies
achieving classification accuracy, sensitivity and specificity.
Although we have achieved good results in six traditional binary classification tasks, there are still some
limiting factors. To start with, in order to determine a group of subjects that have both the image and heredity
measured at the same time and fully consider the category balance, we have to discard a large amount of available
data in the ADNI database, resulting in a very limited sample size for the training and testing data sets. Second,
we only used two modes to calculate features. In fact, in addition to MRI and SNP data, ANDI has many other
forms of characteristics, such as PET, demographics, and neuropsychological assessments. These patterns may
carry important pathological information or provide supplementary information between modalities. Third, since
the score of each feature of the Fisher Score is calculated independently, the selected feature is sub-optimal, and
it is not possible to select features with relatively low individual scores but high scores when they are combined.
Finally, because brain atrophy is a gradual process, it is relatively subtle and difficult to detect in the early stages.
In the experiment, we did not fully consider the normal shrinkage of some people with age.
We will use new Freesurfer versions with more accurate anatomical measurements in our future work. In our
future work, we are also committed to the following research: (1). plan to obtain more subjects with more varied
patterns of data, and explore the impact of identify more characteristic correlations between patterns on disease
Scientific Reports | (2022) 12:2405 | https://doi.org/10.1038/s41598-022-06444-9 5
Vol.:(0123456789)www.nature.com/scientificreports/
diagnosis brain imaging and genetic markers with disease development, (2). in order to fully consider age factor
and reduce the impact of normal aging on classification performance, we need to add a reasonable age-related
regression model to the optimization formula to reduce impact to the model from normal aging, (3). we need to
re-improve the dimensionality reduction method of genetic features to give play to genetic information in AD
diagnosis, and (4). more challenging and clinically diagnostic multi-classification tasks.
Conclusion
There is a certain overlap in the data space between early brain atrophy of patients and normal aging of the brain
of healthy people, which leads to low accuracy of many computer-aided diagnosis methods. In this article, both
image and genetic features are considered as candidate features for classification. By effectively integrating con-
sistent brain imaging and genetic features through methods such as pre-dimensionality reduction and feature
selection, patients with EMCI, LMCI and AD can be more accurately identified from HC. A set of characteristics
related to imaging phenotypes and genetic factors were selected, and the selected risk characteristics were basi-
cally consistent with existing research. We selected 5 brain imaging and 5 genetic features for disease process
diagnosis through the feature selection program, and achieved good classification accuracy. Although the SNP
feature has a weak predictive ability for the development of AD, it can help the imaging mode to improve per-
formance together.
Material and methods
Data collection and sharing for this project was funded by the Alzheimer’s Disease Neuroimaging Initiative
(ADNI) (http://adni.loni.usc.edu). Informed consent was obtained from the volunteer in accordance with the
institutional review board policy. All methods were carried out in accordance with relevant guidelines and
regulations. All experimental protocols were approved by the institutional review board (IRB) at Hangzhou
Dianzi University (IRB-2020001).
Data preprocessing. FreeSurfer is suite of tools that provide extensive and automated analysis of cerebrum
r egion36. It can conveniently process brain MRI images, and generate high-precision gray and white matter
segmentation planes and gray matter and cerebrospinal fluid segmentation planes. Based on these two surfaces,
the thickness of the cortex at any position and other surface data characteristics such as cortical outer surface
area, curvature, Gray matter volume, etc., these parameters can be mapped to the surface of the cerebral cortex
obtained by the white matter expansion algorithm for visual display. FreeSurfer version 5.3 was used to extract
66 cortical thickness measurements and 29 volume measurements for each baseline MRI scan. Those measure-
ments were pre-adjusted to eliminate the effects of the baseline age, gender, handedness, education, and intrac-
ranial volume (ICV). We used the above 95 regions of interest in the experiment.
The genotyping data were genotyped by the Human 610-Quad BeadChip and preprocessed according to
standard quality control and imputation procedures. The value of SNP is 0, 1, or 2, which indicates the number
of minor alleles. Most of the SNPs may have nothing to do with the pathogenesis of AD, and only a small part
of them are high risk factors for AD and are related to changes in certain brain regions. We only used SNP data
belonging to the top 40 AD candidate genes listed in the AlzGene database (www.alzgene.org) to screen out
916 SNP features. We finally obtained 95 + 916 = 1011 candidate features, which come from the two modalities
of each subject.
There are differences in the size of each person’s brain. MaxMin-normalization related to extreme values.
Unstable data sets and extreme maximum/minimum values may lead to data congestion after scaling. Based on
this consideration, we adopted two different normalization approaches. We standardized the MRI data according
to formula (1), and normalized the SNP data according to formula (2).
x − xmin
x̃ =
xmax − xmin + ε (1)
x−x
x̃ =
1
N 2 (2)
N−1 i=1 (xi − x) + ε
ε is a very small positive number to avoid situations where the denominator approaches
N
where x = 1
N i=1 xi
zero.
Preprocessing of genetic data. The dimensionality of SNP features is generally high and most gene vari-
ants account for less than 1% of the measurement variance, so our genetic data is a high-dimensional sparse
matrix. This is fatal for many machine learning models, especially models with gradient descent as the optimi-
zation algorithm. If it is directly used for joint learning with image data, a large amount of irrelevant genetic
information may have a negative impact on the final selected feature subset. Therefore, before using genetic data
for joint feature learning, we need to perform simple pre-dimensional reduction processing on genetic data to
reduce the dimensionality to a level similar to image features. Feature selection can be divided into three types:
filtering, wrapping and embedded37. In this paper, a filtering feature selection method independent of the clas-
sifier was used. This type of method usually selects a subset of features that are highly related to the category.
Filtered feature selection methods are often used in the preprocessing of original data, which can better filter
non-critical features, retain the main structural features with high correlation as much as possible, and finally
reduce the dimensionality of feature set attributes.
Scientific Reports | (2022) 12:2405 | https://doi.org/10.1038/s41598-022-06444-9 6
Vol:.(1234567890)www.nature.com/scientificreports/
The value and distribution of data do not want to change here, so that methods such as PCA and LDA are
abandoned. After comparing the performance of Fisher score, mutual information, F-tests and minimum redun-
dancy maximum relevance, we chose Fisher score. Fisher score38 is an effective feature selection criterion, which
has the advantages of simple calculation, time saving, and high accuracy. Its main method is to find a subset of
features according to Fisher’s linear discriminant, so that the selected features are different in the data space. The
distance between data points of a class is as large as possible, and the distance between data points in the same
class is as small as possible. Given a data set of N samples containing c classes, define the inter-class divergence
Sb (xi) of the ith feature and the intra-class divergence St (xi) of the ith feature of the kth sample as
c
2
Sb (xi ) = nk µki − µi (3)
k=1
nk
2
St (xi ) = xijk − µki (4)
j=1
where nk is the number of samples of class k, µi is the mean value of the ith feature of the whole sample, and xijk
is the mean value of the ith feature of the jth sample in the k-class sample. When the inter-class divergence is as
large as possible, the intra-class divergence is as small as possible, and the Fisher score of the ith feature can be
expressed as follows
c
k
2
Sb (xi ) k=1 nk µi − µi
F(xi ) = c k
= 2 (5)
k=1 nk St (xi ) c nk
k k
k=1 nk j=1 xij − µi
The greater the Fisher Score value, the stronger the ability to distinguish features. After calculating the Fisher
Score of each feature, we sort the scores in descending order and select the highest m genetic factors as the genetic
input for the next step of learning.
Multimodal joint feature selection. Two modes contain unique information and have a certain poten-
tial connection, both modes are expected to help the diagnosis of AD. Joint multimodal learning can help dis-
cover more powerful features than when learning alone. Multi-task learning is a sub-field of machine learning,
which uses the commonalities and differences between different tasks to improve the generalization ability and
prediction accuracy of the m odel39,40. When the square of the l 2-norm is used as a loss function, it is insensitive to
smaller outliers and sensitive to larger outliers, while the l 1-norm as a loss function is just the opposite. Recently,
many multi-task learning methods use group sparsity l2,1-norm to couple cross-task features together for joint
feature selection41.
In the feature selection process, each category was as a separate task. Assuming that the data set
X = [x1,x2,…,xN] ∈ Rd×N contains M modalities, the label set Y = [y1,y2,…,yN] ∈ Rc×N, and the label adopts binary
representation, that is, only one element in each row is 1, and the other elements is 0.
Through l2,1-norm, we can make the model better handle outliers and reduce the burden of tuning. Therefore,
we used l2,1-norm to select features for multiple tasks. The expression of l 2,1-norm is
d
N 2 d
�W�2,1 =
wij = �wi: �2 (6)
i=1 j=1 i=1
where wij is the weight coefficient of the ith feature for category j.
Because the characteristics of different modalities have different effects on the task, such as SNP data, their
individual characteristics or overall characteristics are weaker than image characteristics. Compared with the
intuitive changes in the volume of brain partitions, genetic data is more forward-looking. If genetic data and
image data are directly combined for traditional feature selection, it is very likely that most or all of the selected
features are image data, as shown in Fig. 4 28. In the process of feature selection, if we do not impose proper
constraints on our loss function, it may happen that even high-risk genetic features have generally low weights.
However, l2,1-norm is an excessively strong group sparsity constraint, which may cause the modal to be discarded
and ultimately affect the classification result. Wang et al.42 proposed a new group l 1-norm (Group1-norm), which
strengthened the sparsity between different modes by using l2-norm in each mode and using l1-norm between
modes. Group1-norm is defined as
c
M
�W�G1 =
wij
2 (7)
i=1 j=1
Adding l2,1-norm and G1-norm to the loss function, we can finally express as the following form
min L(X, Y , W) + γ1 �W�G1 + γ2 �W�2,1 (8)
W
where γ1, γ2 > 0 is the regularization parameter. The relative importance of features is represented by the sum of
absolute values of w. We normalize the weights of the selected features, and perform element-wise product of
the original feature data and the weights.
Scientific Reports | (2022) 12:2405 | https://doi.org/10.1038/s41598-022-06444-9 7
Vol.:(0123456789)www.nature.com/scientificreports/
Figure 4. Feature selection diagram.
Data availability
Data collection and sharing for this project is funded by the Alzheimer’s Disease Neuroimaging Initiative (ADNI)
(National Institutes of Health, USA).
Received: 29 April 2021; Accepted: 24 January 2022
References
1. Lu, S. et al. Early identification of mild cognitive impairment using incomplete random forest-robust support vector machine and
FDG-PET imaging. Comput. Med. Imaging Graph. 60, 35–41 (2017).
2. DeTure, M. A. & Dickson, D. W. The neuropathological diagnosis of Alzheimer’s disease. Mol. Neurodegener. 14(1), 1–18 (2019).
3. Association, A. 2019 Alzheimer’s disease facts and figures. Alzheimers Dement. 15(3), 321–387 (2019).
4. Alzheimer’s Disease International. World Alzheimer report 2019: attitudes to dementia. (2019).
5. Brookmeyer, R., Gray, S. & Kawas, C. Projections of alzheimer’s disease in the united states and the public health impact of delaying
disease onset. Am. J. Public Health 88, 1337–1342 (1998).
6. Moradi, E. et al. Machine learning framework for early MRI-based Alzheimer’s conversion prediction in MCI subjects. Neuroimage
104, 398–412 (2015).
7. Nir, T. M. et al. Diffusion weighted imaging-based maximum density path analysis and classification of Alzheimer’s disease.
Neurobiol. Aging 36, S132–S140 (2015).
8. Cabral, C. et al. Predicting conversion from MCI to AD with FDG-PET brain images at different prodromal stages. Comput. Biol.
Med. 58, 101–109 (2015).
9. Bi, X. et al. Random support vector machine cluster analysis of resting-state fMRI in Alzheimer’s disease. PLOS One 13(3),
E0194479 (2018).
10. Tanveer, M. et al. Machine learning techniques for the diagnosis of Alzheimer’s disease: A review. ACM Trans. Multimed. Comput.
Commun. Appl. 16(1s), 1–35 (2020).
11. Bush, W. S. & Moore, J. H. Genome-wide association studies. PLoS Comput Biol 8(12), e1002822 (2012).
12. Li, J. et al. Genome-wide association and interaction studies of CSF T-tau/Aβ42 ratio in ADNI cohort. Neurobiol. Aging 57, 247.
e11-247.e8 (2017).
13. Jansen, I. E. et al. Genome-wide meta-analysis identifies new loci and functional pathways influencing Alzheimer’s disease risk.
Nat. Genet. 51(3), 404–413 (2019).
14. Dukart, J., Sambataro, F. & Bertolino, A. Accurate prediction of conversion to Alzheimer’s disease using imaging, genetic, and
neuropsychological biomarkers. J. Alzheimers Dis. 49(4), 1143–1159 (2016).
15. Salvatore, C., Battista, P. & Castiglioni, I. Frontiers for the early diagnosis of AD by means of MRI brain imaging and support
vector machines. Curr. Alzheimer Res. 13(5), 509–533 (2016).
16. Li, F., Cheng, D., Liu, M. Alzheimer’s disease classification based on combination of multi-model convolutional networks. In IEEE
International Conference on Imaging Systems and Techniques (IST). IEEE, 1–5 (2017).
17. Cheng, D., Liu, M. CNNs based multi-modality classification for AD diagnosis. In 10th International Congress on Image and Signal
Processing, BioMedical Engineering and Informatics (CISP-BMEI). IEEE 1–5 (2017).
18. Thompson, P. M. et al. Genetics of the connectome. Neuroimage 80, 475–488 (2013).
19. Vounou, M. et al. Discovering genetic associations with high-dimensional neuroimaging phenotypes: A sparse reduced-rank
regression approach. Neuroimage 53(3), 1147–1159 (2010).
20. Kohavi, R. A study of cross-validation and bootstrap for accuracy estimation and model selection. Ijcai 14(2), 1137–1145 (1995).
21. Sheng, J. et al. Alzheimer’s disease, mild cognitive impairment, and normal aging distinguished by multi-modal parcellation and
machine learning. Sci. Rep. 10(1), 1–10 (2020).
22. Alam, S. & Kwon, G. R. Alzheimer’s Disease Neuroimaging Initiative: Alzheimer disease classification using KPCA, LDA, and
multi-kernel learning SVM. Int. J. Imag. Syst. Technol. 27(2), 133–143 (2017).
23. Poulin, S. P. et al. Amygdala atrophy is prominent in early Alzheimer’s disease and relates to symptom severity. Psychiatry Res.
Neuroimag. 194(1), 7–13 (2011).
24. Zhang, Y. et al. Detection of subjects and brain regions related to Alzheimer’s disease using 3D MRI scans based on eigenbrain
and machine learning. Front. Comput. Neurosci. 9, 66 (2015).
Scientific Reports | (2022) 12:2405 | https://doi.org/10.1038/s41598-022-06444-9 8
Vol:.(1234567890)www.nature.com/scientificreports/
25. Shen, L. et al. Genetic analysis of quantitative phenotypes in AD and MCI: Imaging, cognition and biomarkers. Brain Imaging
Behav. 8(2), 183–207 (2014).
26. Zhu, X. C. et al. Effect of CR1 genetic variants on cerebrospinal fluid and neuroimaging biomarkers in healthy, mild cognitive
impairment and Alzheimer’s disease cohorts. Mol. Neurobiol. 54(1), 551–562 (2017).
27. Filipovych, R., Gaonkar, B., Davatzikos, C. A composite multivariate polygenic and neuroimaging score for prediction of conver-
sion to Alzheimer’s disease. In Second International Workshop on Pattern Recognition in Neuroimaging. IEEE, 105–108 (2012).
28. Peng, J., An, L., Zhu, X., et al. Structured sparse kernel learning for imaging genetics based Alzheimer’s disease diagnosis. In
International Conference on Medical Image Computing and Computer-Assisted Intervention. Springer, 70–78 (2016).
29. Singanamalli, A., Wang, H. & Madabhushi, A. Cascaded multi-view canonical correlation (CaMCCo) for early diagnosis of Alz-
heimer’s disease via fusion of clinical, imaging and omic features. Sci. Rep. 7(1), 1–14 (2017).
30. Liu, K. et al. Prediction of mild cognitive impairment conversion using a combination of independent component analysis and
the cox model. Front. Hum. Neurosci. 11, 33 (2017).
31. Ning, K. et al. Classifying Alzheimer’s disease with brain imaging and genetic data using a neural network framework. Neurobiol.
Aging 68, 151–158 (2018).
32. Zhou, T. et al. Effective feature learning and fusion of multimodality data using stage-wise deep neural network for dementia
diagnosis. Hum. Brain Mapp. 40(3), 1001–1016 (2019).
33. Spasov, S. et al. A parameter-efficient deep learning approach to predict conversion from mild cognitive impairment to Alzheimer’s
disease. Neuroimage 189, 276–287 (2019).
34. Brand, L., O’Callaghan, B., Sun, A., et al. Task balanced multimodal feature selection to predict the progression of alzheimer’s
disease. In 2020 IEEE 20th International Conference on Bioinformatics and Bioengineering (BIBE). IEEE, 196–203 (2020).
35. Bi, X. et al. Multimodal data analysis of Alzheimer’s disease based on clustering evolutionary random forest. IEEE J. Biomed. Health
Inform. 24(10), 2973–2983 (2020).
36. Fischl, B. FreeSurfer. NeuroImage 62, 774–781 (2012).
37. Chandrashekar, G. & Sahin, F. A survey on feature selection methods. Comput. Electr. Eng. 40(1), 16–28 (2014).
38. Duda, R. O., Hart, P. E. & Stork, D. G. Pattern Classification (Wiley, 2001).
39. Caruana, R. Multitask learning. Mach. Learn. 28(1), 41–75 (1997).
40. Thrun, S. Is learning the n-th thing any easier than learning the first? Adv. Neural Inf. Process. Syst. 640–646 (1996).
41. Liu, J., Ji, S., Ye, J. Multi-task feature learning via efficient l2,1-norm minimization. arXiv preprint https:// https://arxiv.org/abs/
1205.2631 (2012).
42. Wang, H., Nie, F., Huang, H., et al. Heterogeneous visual features fusion via sparse multimodal machine. In Proceedings of the IEEE
conference on Computer Vision and Pattern Recognition. 3097–3102 (2013).
Acknowledgements
This work was supported by the National Natural Science Foundation of China (No. 61871168).
Author contributions
J.S. Designed the project and supervised the overall research; Y.X. performed the experiments and analyzed data;
Q.Z. co-designed the research; L.W., Z.Y., and J.Y. participated in data analysis; J.S. and Y.X. wrote the manuscript.
Competing interests
The authors declare no competing interests.
Additional information
Correspondence and requests for materials should be addressed to J.S.
Reprints and permissions information is available at www.nature.com/reprints.
Publisher’s note Springer Nature remains neutral with regard to jurisdictional claims in published maps and
institutional affiliations.
Open Access This article is licensed under a Creative Commons Attribution 4.0 International
License, which permits use, sharing, adaptation, distribution and reproduction in any medium or
format, as long as you give appropriate credit to the original author(s) and the source, provide a link to the
Creative Commons licence, and indicate if changes were made. The images or other third party material in this
article are included in the article’s Creative Commons licence, unless indicated otherwise in a credit line to the
material. If material is not included in the article’s Creative Commons licence and your intended use is not
permitted by statutory regulation or exceeds the permitted use, you will need to obtain permission directly from
the copyright holder. To view a copy of this licence, visit http://creativecommons.org/licenses/by/4.0/.
© The Author(s) 2022
Scientific Reports | (2022) 12:2405 | https://doi.org/10.1038/s41598-022-06444-9 9
Vol.:(0123456789)You can also read