Process Parameter Optimization in Metal Laser-Based Powder Bed Fusion Using Image Processing and Statistical Analyses - MDPI
←
→
Page content transcription
If your browser does not render page correctly, please read the page content below
metals
Article
Process Parameter Optimization in Metal Laser-Based Powder
Bed Fusion Using Image Processing and Statistical Analyses
Faiyaz Ahsan *, Jafar Razmi                  and Leila Ladani

                                          Ira A. Fulton Schools of Engineering, Arizona State University, Tempe, AZ 85212, USA; jafar.razmi@asu.edu (J.R.);
                                          ladani@asu.edu (L.L.)
                                          * Correspondence: fahsan1@asu.edu

                                          Abstract: The powder bed fusion additive manufacturing process has received widespread interest
                                          because of its capability to manufacture components with a complicated design and better surface
                                          finish compared to other additive techniques. Process optimization to obtain high quality parts is still
                                          a concern, which is impeding the full-scale production of materials. Therefore, it is of paramount
                                          importance to identify the best combination of process parameters that produces parts with the least
                                          defects and best features. This work focuses on gaining useful information about several features of
                                          the bead area, such as contact angle, porosity, voids, melt pool size and keyhole that were achieved
                                          using several combinations of laser power and scan speed to produce single scan lines. These features
                                          are identified and quantified using process learning, which is then used to conduct a comprehensive
                                          statistical analysis that allows to estimate the effect of the process parameters, such as laser power and
                                          scan speed on the output features. Both single and multi-response analyses are applied to analyze
                                          the response parameters, such as contact angle, porosity and melt pool size individually as well as
                                          in a collective manner. Laser power has been observed to have a more influential effect on all the

                                          features. A multi-response analysis showed that 150 W of laser power and 200 mm/s produced a
                                   bead with the best possible features.
Citation: Ahsan, F.; Razmi, J.; Ladani,
L. Process Parameter Optimization in      Keywords: additive manufacturing; powder bed fusion; statistical analysis; process optimization
Metal Laser-Based Powder Bed
Fusion Using Image Processing and
Statistical Analyses. Metals 2022, 12,
87. https://doi.org/10.3390/              1. Introduction
met12010087
                                               The powder bed fusion (PBF) additive manufacturing process uses an electron or laser
Academic Editor: Kyriakos                 beam to fuse metallic powders over a build platform to print one layer of the build dictated
I. Kourousis                              by a computer-aided design (CAD) software. The machine takes design instruction from
Received: 23 November 2021
                                          the CAD software and creates the part by adding layers. After the first layer is created,
Accepted: 26 December 2021
                                          another layer of metal powder is distributed over the build plate using a powder hopper.
Published: 4 January 2022
                                          This layer is then melted and solidified based on the CAD design. The process continues
                                          until the final product is built. Additive processes have the ability to produce lightweight
Publisher’s Note: MDPI stays neutral
                                          materials with a complicated design, as well as to reduce the tooling cost, which gives
with regard to jurisdictional claims in
                                          them an edge over conventional manufacturing processes, such as machining in aerospace
published maps and institutional affil-
                                          and medical industries [1,2]. The laser powder bed fusion process has been the subject of
iations.
                                          extensive research lately [3–6]. Melt pool physics is one of the most crucial and complicated
                                          phenomena during the process. Many factors impact the final quality of the melt, including
                                          the energy balance, thermo-physical properties of materials and the types of heat source
Copyright: © 2022 by the authors.
                                          used for the process. Researchers showed that melt pool and bead features, such as contact
Licensee MDPI, Basel, Switzerland.        angle, porosity, voids and melt pool size, can change depending on the intensity of input
This article is an open access article    energy that is supplied to the powder bed [7–11]. The energy input in turn depends on the
distributed under the terms and           process variables, such as laser power, scanning speed, and thickness of the layers, etc. Due
conditions of the Creative Commons        to the variability of these parameters, the molten region possesses distinguished features.
Attribution (CC BY) license (https://     These features, such as lower value of contact angle, are desirable as they ensure proper
creativecommons.org/licenses/by/          adhesion with previous layers [12], and some features, such as high amount of porosity
4.0/).                                    that results in distortion of the part, are not very desirable.

Metals 2022, 12, 87. https://doi.org/10.3390/met12010087                                                         https://www.mdpi.com/journal/metals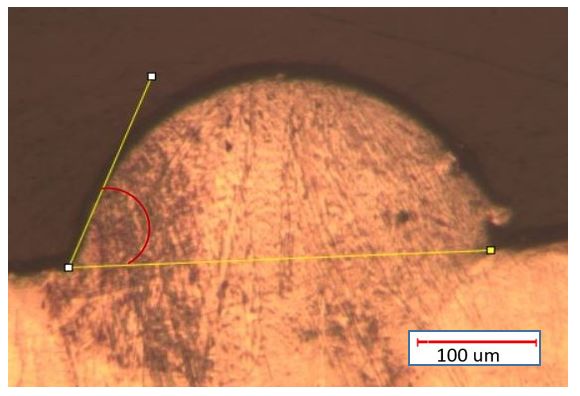
Metals 2022, 12, 87                                                                                            2 of 13

                           Researchers have tried to analyze the characteristics of different aspects of the build to
                      optimize the parameters that can influence the process. Geometrical features such as contact
                      angle between the present and the preceding layers, which dictates the wetting behavior
                      of the melt pool, have been studied by several scientists. Fateri et al. [12] investigated
                      the effect of temperature and viscosity towards the evolution of contact angle using hot
                      stage microscopy. The study showed that contact angle decreases as the powders start to
                      sinter at higher temperature points. Haley et al. [13] used a computational fluid dynamics
                      (CFD) simulation technique to observe the influence of particle size, melt pool shape and
                      surface tension on wetting dynamics. They found out that powder particle residence time,
                      which is termed as the time between the interaction of the powder and heat source, and
                      complete melting are dependent on particle size and surface tension, and contact angle
                      varies inversely with residence time. Triantafyllidis et al. [14] experimentally established a
                      relationship between power and contact angle during a laser surface treatment of Al2O3-
                      based refractory ceramics and deduced that contact angle increases with reduced power.
                      Hu et al. [15] used a computational model to show that contact angle decreases with
                      increasing number of tracks and decreasing scan speed during selective laser melting.
                      Process defect in melt pool is another important feature that has been a major concern
                      in additive manufacturing (AM) processes. It will not be feasible to move towards large-
                      scale production without addressing these defects. Extensive research has been dedicated
                      towards the physics behind the formation of these defects. Brennan et al. [16] discussed
                      different defects, such as porosity, voids, lack of fusion defects and how they can be reduced
                      using a hot isostatic process (HIP). Other papers [17,18] have also tried to investigate defects
                      from a different perspective. These papers mainly focused on the formation of defects, such
                      as the lack of fusion, porosity, surface roughness, etc., on the build direction. An analysis of
                      these defects along the bead cross section based on process parameters such as laser power
                      and scan speed is largely missing from the literature.
                           The specific features of the beads discussed above can be utilized to optimize the
                      process parameters in the powder bed process. Traditionally, process parameter optimiza-
                      tions are implemented using experimental and computational methods [8,19,20]. Although
                      computational modeling can reveal important information about melt pool, microstructure,
                      temperature history, etc., that change with the input variables, due to the complications
                      in the process, these models possess a lot of simplified assumptions, which result in a
                      deviation from actual experimental results [21–24]. To solve the issue, many researchers
                      have recently opted to use machine learning algorithm techniques to optimize the process
                      parameters. Kwon et al. [25] used a convolutional neural network (CNN) to forecast laser
                      power from images of the molten pool taken during the experiment and built a model with
                      96% accuracy. Caiazzo et al. [26] built a three-layer cascade forward propagation artificial
                      neural network (ANN) to predict the process parameters needed to print the optimum
                      part dimension. They produced a result with 2% error for laser power and 5.8% for scan
                      speed. Although machine learning models have become increasingly popular as they
                      can predict data with high accuracy, these techniques are still not good enough to predict
                      process parameters with smaller datasets [27]. These techniques require a large number
                      of experimental data set to train [25,28], which is both time-consuming and expensive.
                      Statistical analysis techniques have also been employed to identify patterns in additive
                      manufacturing. Sanaei et al. [29] analyzed the defects in an AM part based on specific
                      locations, such as the narrow section and at the perimeter of the dog-bone samples. They
                      used a K–S statistical test to show that the distribution of defects are different in the neck
                      and perimeter region. Casalino et al. [30] investigated the impact of laser power and scan
                      speed on mechanical properties, such as hardness and tensile strength of the final build.
                      They found out that increasing energy density decreases surface roughness and increases
                      hardness. Whip et al. [31] used an analysis of variance method to observe the effect of
                      process parameters in melt pool and surface roughness. They found out that increasing
                      laser power increases the melt pool size, which facilitates in a smoother surface due to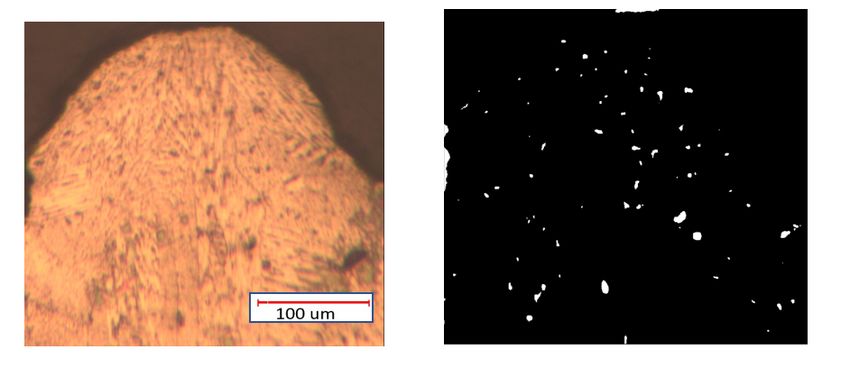
Metals 2022, 12, 87                                                                                             3 of 13

                      proper wettability. The effect of process parameters on the evaluation of bead formation
                      has been discussed in several works [32–34].
                           Although there is a handful of research discussions about the defects of AM parts,
                      a comprehensive analysis of different features of the bead cross section is missing. Moreover,
                      most of this research focuses on an analysis of defects on the surface and beneath. This
                      work attempts to provide a detailed analysis of different features of the bead cross section
                      for a nickel-based Inconel 718 sample, which has a high strength over a wide range of
                      temperatures. Contact angle, porosity, void, melt pool area and keyhole formation are
                      quantified. Individual significance of each parameter is analyzed using a full factorial
                      design of experiment and analysis of variance (ANOVA). Process parameter optimization
                      in terms of multiple response parameters is largely missing from the literature as well.
                      A multi-response analysis is conducted in this work, including all the features as a part of
                      process parameter optimization.

                      2. Experimental Setup
                           An EOSINT M280 machine was used to fabricate 24 base blocks of 25.4 mm × 25.4 mm
                      × 4 mm using 285 W of laser power and a scanning speed of 960 mm/s to ensure that
                      microstructure was uniform throughout all the samples [35]. Evenly spaced parallel lines
                      were built on top of the base blocks while changing laser power and scan speed on each
                      specimen, according to a factorial Design of Experiment (DoE). Inconel 718, an alloy based
                      on nickel, was chosen due to its superior properties over a wide temperature range and
                      high corrosion resistance. After the samples were built, they were cut into several sections
                      to expose the bead cross sections. A Meiji Techno optical microscope equipped with a
                      Nikon DS-Fi1 camera was used to take the images of the solidified beads. A magnification
                      of 200× was used for beads with smaller dimensions. Magnifications were reduced to
                      100× to incorporate larger bead sizes. Samples were encased in resin, polished and etched
                      to prepare it for micrography observation. A total of 8–12 images from each sample were
                      taken for proper representation of the samples. Table 1 contains the laser power and scan
                      speeds that were used during the experiments. Samples are numbered as T1, T2 and so on.
                      ImageJ was used to quantify the features. ImageJ is a widely used open access processing
                      and analysis software. As it was mostly a manual process, measurements were taken
                      multiple times for the same sample to ensure precision.

                      Table 1. Process parameters.

                       Power/Speed         40 W           100 W          150 W           200 W          300 W
                        200 mm/s             T1            T4             T10             T13             T19
                        700 mm/s             T2            T5             T11             T14             T20
                        1200 mm/s            T3            T6             T12             T15             T21
                        1700 mm/s                          T7                             T16             T22
                        2200 mm/s                          T8                             T17             T23
                        2500 mm/s                          T9                             T18             T24

                      3. Melt Pool Features
                      3.1. Contact Angle
                           Contact angle is the angle between the bead section and the layer beneath it [36].
                      It determines the wettability of the molten powder particle with the previous layer. Proper
                      wettability ensures there is a good adhesion between the layers. Inadequate adhesion
                      between layers can result in a warped build [12], as the surface tension forces become
                      dominant over the adhesive forces. A high contact angle (>90◦ ) can result in a balling
                      phenomenon, which distorts the material. Thus, it is desirable to have a low contact angle
                      to ensure proper wetting and adhesion between layers. Image analysis software ImageJ
                      was used to measure the contact angle of the experimentally obtained bead. The bead
                      images were obtained using optical microscopy. Pixel units were converted to micron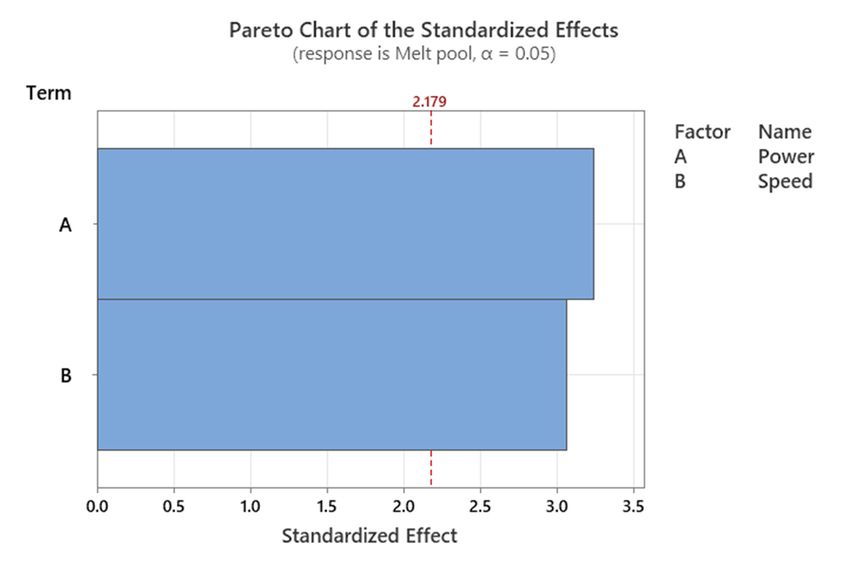
tween layers can result in a warped build [12], as the surface tension forces become dom-
inant over the adhesive forces. A high contact angle (>90°) can result in a balling phenom-
Metals 2022, 12, 87
enon, which distorts the material. Thus, it is desirable to have a low contact angle to ensure 4 of 13
proper wetting and adhesion between layers. Image analysis software ImageJ was used
to measure the contact angle of the experimentally obtained bead. The bead images were
obtained using optical microscopy. Pixel units were converted to micron units for conven-
units Figure
ience. for convenience.
1 shows two Figure 1 showslines
yellow straight twomaking
yellowthestraight
contactlines
anglemaking
betweenthe contact angle
the sub-
strate and the
between the surface of the
substrate andbead.
the surface of the bead.
Contact
Figure1.1.Contact
Figure angle
angle measurement.
measurement.
3.2.Porosity
3.2. Porosity
Gas-entrapped
Gas-entrapped pores
pores cancan
havehave
bothboth a spherical
a spherical and irregular
and irregular shape.shape. They
They are are character-
charac-
ized bybya size
terized a sizeofofaround
around5–205–20microns
microns for for the
the powder
powder bedbed fusion
fusion(PBF)
(PBF)process
processand and greater
greater
than 50than 50 microns
microns for direct
for direct energy energy deposition
deposition (DED)(DED) [37].
[37]. These
These defectscan
defects canbe beattributed
at- to
tributed to the manufacturing
the manufacturing of powders of powders
using ausing a gas atomization
gas atomization process
process thatthat
cancan carry
carry some gases
some gases entrapped
entrapped within the within the powders
powders [17]. [17]. In addition,
In addition, processparameters
process parameters that
thatcreate
create strong
strong
marangoni flow can trap some of the pores within the melt pool. The presence of
marangoni flow can trap some of the pores within the melt pool. The presence of porosity
porosity can induce a damaging impact on material fatigue life, as well as mechanical
can induce a damaging impact on material fatigue life, as well as mechanical properties.
properties. ImageJ was used to identify the porosities in the melt pool using a color thresh-
ImageJ was used to identify the porosities in the melt pool using a color threshold. The
old. The scale bars in the images were used as a reference to ensure accurate measurement
scale
of bars in
the pores bythe images the
converting were used
pixel sizeastoaareference to ensure
micron unit. For easeaccurate measurement
of measurement, the of the
poresimages
color by converting the pixel
were converted into ansize to binary
8-bit a micron unit.
image. For ease aoffast
Afterwards, measurement,
Fourier trans- the color
images
form were
(FFT) usingconverted
a bandpass into anwas
filter 8-bit
usedbinary image.a Afterwards,
to maintain a fast Fourier
uniform background through-transform
(FFT)
out the using
image. aAbandpass
threshold was filter
usedwas used to to
afterwards maintain
separate athe
uniform
pores frombackground throughout
the rest of the
the image.
image. A threshold
The darker was0.4–1
regions with usedcircularity
afterwards weretoselected
separate the poreshaving
as porosities from athe sizerest of the
of 5–30 microns.
image. The darkerThe long greywith
regions regions were
0.4–1 considered
circularity as impurities
were and,
selected as as such, were
porosities having a size
ignored. The borderline
of 5–30 microns. thresholds
The long were removed
grey regions during analysis.
were considered Figure 2a shows
as impurities and, asthe such, were
cross section
ignored. of borderline
The the bead obtained using the
thresholds were optical
removedmicroscope,
duringand Figure 2b
analysis. shows2a
Figure theshows the
Metals 2022, 12, x FOR PEER REVIEW 5 of 14
color
crossthreshold
section ofused
thetobead
find obtained
the porosities.
using the optical microscope, and Figure 2b shows the
color threshold used to find the porosities.
(a) (b)
Figure 2. (a)2.Bead
Figure cross cross
(a) Bead section, (b) identification
section, of porosities
(b) identification across the across
of porosities bead cross
the section usingsection
bead cross a using a
color threshold.
color threshold.
3.3. Keyhole and Voids
Although a keyhole is more dominant in welding due to high laser power and low
welding speed, it can be present during additive manufacturing as well, as high laser
powers are being used lately in this process. High energy density on the powder material
can cause evaporation, creating recoil pressure, which depresses the melt pool, creating a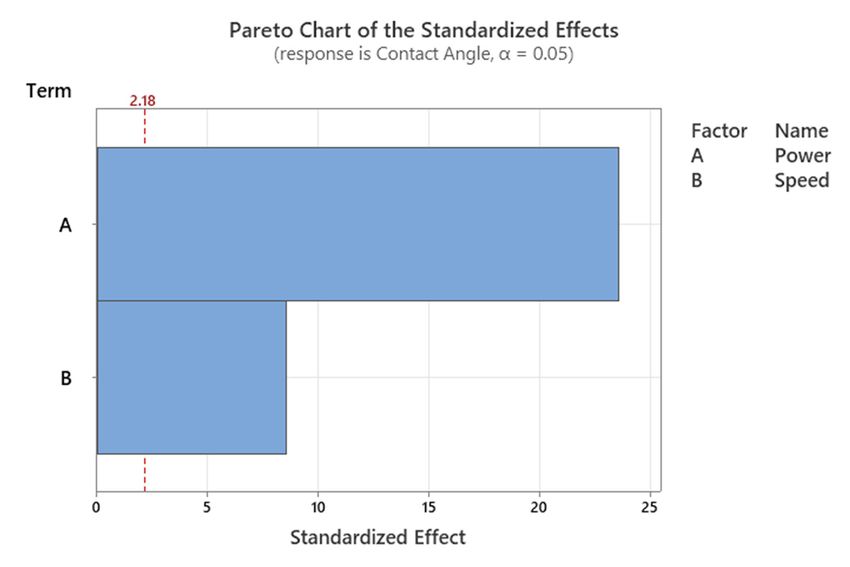
(a) (b)
Metals 2022, 12, 87 5 of 13
Figure 2. (a) Bead cross section, (b) identification of porosities across the bead cross section using a
color threshold.
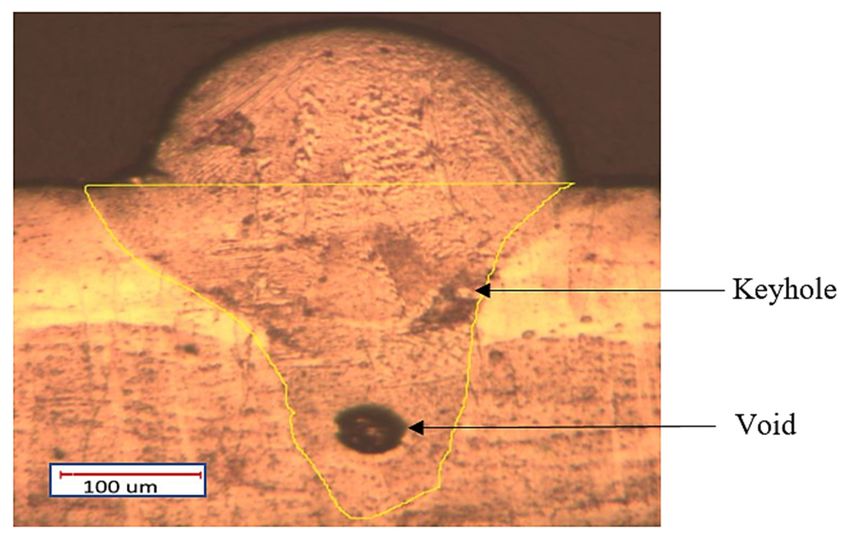
3.3.
3.3. Keyhole
Keyhole and
and Voids
Voids
Although
Although a keyhole
a keyhole isis more
more dominant
dominant in in welding
welding due
due toto high
high laser
laser power
power and and low
low
welding
welding speed, it can be present during additive manufacturing as well, as high laser
speed, it can be present during additive manufacturing as well, as high laser
powers
powers are being used
are being used lately
lately in
in this
this process.
process. High
High energy
energy density
density onon the
the powder
powder material
material
can cause
cause evaporation,
evaporation,creating
creatingrecoil
recoilpressure,
pressure,which
whichdepresses
depressesthethemelt
meltpool,
pool,creating
creating a
narrow
a narrow and
anddeep
deep keyhole
keyholeshape [38].[38].
shape The The
keyhole needsneeds
keyhole to be to
controlled, otherwise
be controlled, it can
otherwise
leave
it can voids
leave inside
voids the melt
inside thepool containing
melt vapor. Metals
pool containing vapor. that have
Metals lowhave
that thermal
low conduc-
thermal
tivity facilitatefacilitate
conductivity the formation of a keyhole,
the formation as they as
of a keyhole, help
theyaccumulate enough enough
help accumulate heat to start
heat
evaporation. Each keyhole image was measured 5 times to remove measurement
to start evaporation. Each keyhole image was measured 5 times to remove measurement error as
much
error asasmuch
possible. Figure 3Figure
as possible. shows3 the keyhole
shows formation
the keyhole due to due
formation excessive energyenergy
to excessive input
that
inputcreates a largea void
that creates largeinside the melt
void inside thepool.
melt pool.
Figure 3. Voids associated with keyholes.
3.4. Melt
3.4. Melt Pool
Pool
Melt pool
Melt pool shape
shape isis one
one of
of the
the most
most crucial
crucial features
features in
in additively
additively manufactured
manufactured parts.
parts.
Geometry of the melt pool is extremely important. If the area of the melt pool is too large,
Geometry of the melt pool is extremely important. If the area of the melt pool is too large,
then it repeatedly melts and solidifies 4–5 layers beneath the current layer, which can
then it repeatedly melts and solidifies 4–5 layers beneath the current layer, which can cre-
create residual stress in those layers. Residual stress can result in distortion of the part of
ate residual stress in those layers. Residual stress can result in distortion of the part of the
the build. On the other hand, a shallow melt pool can cause inadequate adhesion with
build. On the other hand, a shallow melt pool can cause inadequate adhesion with the
the previously solidified layer. Therefore, choosing the optimum process parameter is of
paramount importance to create the standard melt pool. Each of the melt pool areas was
measured 5 times to reduce the measurement error.
4. Results and Discussion
4.1. Single Response Analysis
As part of the statistical analysis, the features were identified and quantified. An anal-
ysis of variance (ANOVA) was used to detect if the process variables such as laser power
and scan speed have any significant impact on the bead cross section, such as contact
angle, porosity and melt pool size. Each combination of laser power and scan speed had
6–10 images of the bead, and each response parameter was measured five times for each
image to make sure the measurement errors were reduced as much as possible. Groups
are defined according to the design of experiments provided in Table 1. ANOVA starts
with the assumption that there is no significant influence of the input variables on the
output, termed the null hypothesis. The F-ratio or F statistic is calculated using the mean of
different groups to observe if the output changes significantly based on the change in the
input. If the value of the F-ratio is sufficiently large, then it can be concluded that there is a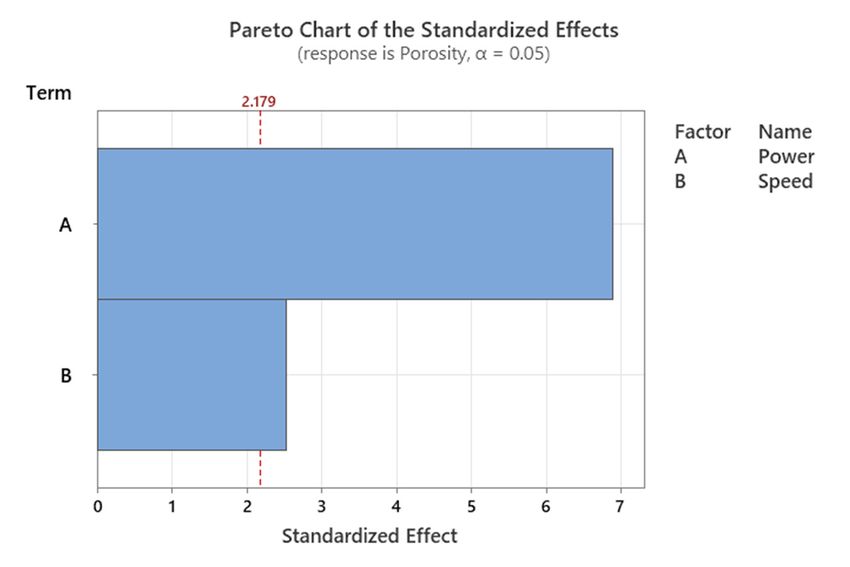
Metals 2022, 12, 87                                                                                            6 of 13

                      strong correlation between the input and output, and a change in the input will affect the
                      output substantially.

                                                           Mean o f squares between ( MSv )
                                               F ratio =                                                          (1)
                                                           Mean o f squares within ( MSe )

                                                              Sum o f squares (SS)
                                                    MS =                                                          (2)
                                                            Degrees o f f reedom ( DF )

                                               DF = Number of groups of a variable − 1                            (3)

                                                                             ∑
                                                                                                2
                                             Sum o f squares within, SSw =       Yij − Yi.avg                     (4)

                                                                            ∑
                                                                                                     2
                                         Sum o f squares between, SSv =         Yi.avg − Ytot.avg                 (5)
                            Here, Yij denotes the jth observation of the ith group.
                            Equations (1)–(5) provide the steps to calculate the F-ratio. Here, between refers to
                      the value of an output between the groups of a variable, and within means the value of
                      an output within a specific group of a variable. For example, when we try to find out the
                      F-ratio of the contact angle in terms of laser power, the sum of squares between refers to
                      the variation of means of the contact angle between different laser powers (40 W, 100 W,
                      150 W and so on) compared to the average of all the contact angles, which can be calculated
                      using Equation (5). On the other hand, the sum of squares within refers to the variation of
                      the contact angle within a specific group. For instance, there are multiple values of contact
                      angle for a laser power of 40 W. The sum of squares within calculates the variation of the
                      contact angle within this group of 40 W, does the same for all the other groups, such as 100,
                      150, 200 and 300 W, and sums it all up to get the total sum of squares between, as shown in
                      Equation (4). We get the mean of squares by dividing the sum of squares by the degrees
                      of freedom. Finally, the F-ratio is calculated by dividing the mean of squares between by
                      the mean of squares within. So, if the F-ratio is larger than the critical value of F provided
                      in the F distribution table [39], then the variability of the contact angle for different laser
                      powers is large enough to ascertain that laser power has a significant effect on contact angle.
                      p-value is another way to determine if the null hypothesis is true. The null hypothesis
                      states that the mean value of the contact angle for different laser powers is the same. The
                      p-value is the probability of accepting the null hypothesis. A smaller p-value indicates a
                      small chance for the null hypothesis being true. For example, if the p-value is 0.05, then
                      there is only a 5% chance that the mean contact angle value for all the laser powers will be
                      same, which is really low. Thus, we can reject the null hypothesis.
                            A Pareto chart is another tool that demonstrates the significance of the process param-
                      eters on the response parameter. It is a bar chart that shows the relative effect of different
                      parameters on a specific response or output parameter. It also provides a reference line at a
                      5% significant level. The process parameters are considered significant if they exceed that
                      reference line.

                      4.1.1. Contact Angle
                           Figure 4 shows the effects of laser power and scan speed on the contact angle. The val-
                      ues of the contact angle varied between 29 degrees at 300 W/200 mm/s to 135.2 degrees
                      at 40 W/2500 mm/s. Although literature with similar process parameters was unavail-
                      able, the trend of contact angle agrees well with the work of Triantafyllidis et al. [14] and
                      Hu et al. [15]. The contact angle decreased with higher laser power and lower scan speed
                      because of the high energy input. At a lower energy input, the angle was more than
                      90 degrees. At this level, balling phenomena occured that could create delamination and
                      distort the part. It can be observed from both Figure 4 and the F-value of Table 2 that both
                      laser power and scan speed played a significant role on contact angle. The F-value for
values of the contact angle varied between 29 degrees at 300 W/200 mm/s to 135.2 degrees
at 40 W/2500 mm/s. Although literature with similar process parameters was unavailable,
the trend of contact angle agrees well with the work of Triantafyllidis et al. [14] and Hu et
al. [15]. The contact angle decreased with higher laser power and lower scan speed be-
cause of the high energy input. At a lower energy input, the angle was more than 90 de-
Metals 2022, 12, 87 grees. At this level, balling phenomena occured that could create delamination and distort 7 of 13
the part. It can be observed from both Figure 4 and the F-value of Table 2 that both laser
power and scan speed played a significant role on contact angle. The F-value for laser
power was larger than scan speed, indicating that power had a more significant effect
laser power was larger than scan speed, indicating that power had a more significant effect
than scan speed on contact angle. An ANOVA for the interaction between laser power
than scan speed on contact angle. An ANOVA for the interaction between laser power
and scan speed was not possible to conduct, as we did not have contact angle data for all
and scan speed was not possible to conduct, as we did not have contact angle data for all
combinations of laser power and scan speed because some of the beads were broken due
to combinations of laser
balling and other power and scan speed because some of the beads were broken due to
defects.
balling and other defects.
Figure 4. Individual
Figure impact
4. Individual of laser
impact power
of laser and scan
power andspeed on mean
scan speed oncontact angle. angle.
mean contact
Table 2. Analysis
Table of variance.
2. Analysis of variance.
Source DF Adj SS (Degree2) Adj MS (Degree2) F-Value p-Value
Source DF Adj SS (Degree2 ) Adj MS (Degree2 ) F-Value p-Value
Power 4 16,439.6 4109.89 338.87 0.00001
Power 4 16,439.6 4109.89 338.87 0.00001
Speed 5 1872.2 374.44 30.87 0.00003
Speed 5 1872.2 374.44 30.87 0.00003
Metals 2022, 12, x FOR PEER REVIEW It can also be observed from the Pareto chart in Figure 5 that both power and speed 8 of 14
It canhigher
effects were also be observed
than from detected
the threshold the Pareto chart
by the 95%inconfidence
Figure 5 that both(red
interval power and speed
dotted
effects
line), withwere
laserhigher
powerthan the
being thethreshold detected
most dominant by the 95%
influencing confidence
factor. interval
The values (red
in the x dotted
line),
axis withdeviation
denote laser power
frombeing the most
the overall dominant
mean for eachinfluencing factor. The
process parameter. Thevalues
more in
thethe x axis
deviation, the morefrom
denote deviation likely
theit overall
is that the specific
mean parameter
for each is more influential
process parameter. The moreonthe
thedeviation,
output
value.
the more likely it is that the specific parameter is more influential on the output value.
Figure 5. Pareto chart of the standardized effect of laser power and scan speed on contact angle.
Figure 5. Pareto chart of the standardized effect of laser power and scan speed on contact angle.
4.1.2. Porosity
The pores in the melt pool varied in the range of 5 to 30 microns in diameter. This is
similar to the average size found by Everton et al. (5 to 20 microns) [37]. Due to improper
melting, a lack of fusion occurred at lower laser powers and higher scan speeds, resultingMetals 2022, 12, 87 8 of 13
Figure 5. Pareto chart of the standardized effect of laser power and scan speed on contact angle.
4.1.2.
4.1.2. Porosity
Porosity
TheThe
pores in the
pores inmelt pool varied
the melt in the range
pool varied in theofrange
5 to 30ofmicrons
5 to 30inmicrons
diameter.inThis is
diameter. This is
similar to the average size found by Everton et al. (5 to 20 microns) [37]. Due to
similar to the average size found by Everton et al. (5 to 20 microns) [37]. Due to improper improper
melting,
melting,a lack of fusion
a lack occurred
of fusion at lower
occurred at laser
lower powers
laser and higher
powers scan
and speeds,
higher resulting
scan speeds, resulting
in a higher number of pores. Although there was less porosity at higher laser powers due
in a higher number of pores. Although there was less porosity at higher laser powers due
to proper wetting, some pores still existed due to the larger melt pool size. Excluding the
to proper wetting, some pores still existed due to the larger melt pool size. Excluding the
40 W power samples, which did not have enough power to melt the particles, porosity
40 Wfrom
ranged power 1 tosamples, which did
8 percent (Figure not have
6), which enough
is similar to thepower to melt
1–5 percent thefound
range particles,
in porosity
ranged from
the literature [17].1 to 8 percent (Figure 6), which is similar to the 1–5 percent range found in the
literature [17].
)
Figure 6. Individual
Figure impact
6. Individual of laser
impact ofpower and scan
laser power speed
and onspeed
scan the mean
on of
theporosity.
mean of porosity.
Metals 2022, 12, x FOR PEER REVIEW 9 of 14
Laser power
Laser powerhad had
a considerable influence
a considerable on pore on
influence percentage, as is evident
pore percentage, as from the
is evident from the
ANOVA analysis (Table 3) and Pareto chart (Figure 7). Although scanning speed had
ANOVA analysis (Table 3) and Pareto chart (Figure 7). Although scanning speed had much
less significance,
much it was
less significance, stillstill
it was above thethe
above threshold
thresholdlevel,
level,and
and hence
hence could not be
could not beig-
ignored
while optimizing the process to minimize porosity in the melt
nored while optimizing the process to minimize porosity in the melt pool. pool.
Table
Table3. 3.
Analysis of variance.
Analysis of variance.
Source
Source DF DFAdj SS Adj MS
Adj SS F-Value F-Value p-Valuep-Value
Adj MS
Power
Power 4 4 321.06 321.0680.266 80.266 22.52 22.52 0.000 0.000
Speed
Speed 5 5 68.04 68.0413.607 13.607 6.82 6.82 0.027 0.027
Figure 7. Pareto chart of the standardized effect of laser power and scan speed on porosity.
Figure 7. Pareto chart of the standardized effect of laser power and scan speed on porosity.
4.1.3. Melt Pool
Power and speed had similar, but opposite effects on the melt pool area that spanned
across the melt pool depth, width and height of the bead (Figure 8). Melt pool size can beMetals 2022, 12, 87 9 of 13
4.1.3. Melt Pool
Power and speed had similar, but opposite effects on the melt pool area that spanned
across the melt pool depth, width and height of the bead (Figure 8). Melt pool size can
be extremely small and shallow for a lower energy input, while high energy can create a
large enough molten pool that melts 5–6 layers of previously solidified layers. An ANOVA
Metals 2022, 12, x FOR PEER REVIEW analysis (Table 4) showed that the p-value for power and speed was 0.007 and 10 of0.010,
14
indicating a significant effect on melt pool area. Contrary to contact angle and porosity,
Metals 2022, 12, x FOR PEER REVIEW scan speed and laser power had a similar impact on the size of the melt pool.
10 ofMelt
14 pool size
took a sharp increase when the power was shifted to 200 W from 150 W, and the change
was rather insignificant at a scan speed beyond 1700 mm/s (Figure 9).
Figure
Figure 8.8.Individual
Figure Individual
8. impact
impact
Individual impact of of
laser
of laser power
power
laser and
and scan
power scan
speed
and scanspeed onon
onspeed
mean mean
contact
mean contact
angle. angle.
contact angle.
Table
Table 4.4.Analysis
Table Analysis
4. of of
Analysis variance.
variance.
of variance.
Source
Source DF Adj SS (µm4) 4) Adj MS(µm4) 4 F-Value p-Value
Source DF DFAdj SS (µmAdj SS (µm4 ) Adj MS(µm
Adj MS)(µm4 ) F-ValueF-Value p-Value
p-Value
Power
Power 44 13,541,394,444
13,541,394,444 3,385,348,611
3,385,348,611 5.95 5.95 0.007 0.007
Power 5
Speed 4 13,541,394,444
14,474,970,343 2,894,994,0693,385,348,611
5.49 5.95
0.010 0.007
Speed
Speed 5 514,474,970,343
14,474,970,343 2,894,994,069
2,894,994,069 5.49 5.49 0.010
0.010
Figure 9. Pareto chart of the standardized effect of laser power and scan speed on melt pool.
4.1.4. Keyhole
Figure and chart
9. Pareto Void of the standardized effect of laser power and scan speed on melt pool.
Figure 9. Pareto
Keyholes chartfound
were of theonly
standardized effect
in three sets of of laser power
beads: 300 W and scanpower
of laser speed on melt
with pool.
scan
speeds of 200 and 700 mm/s and200 W of laser power with a 200 mm/s scan speed due to
4.1.4.energy
high Keyhole andThe
input. Void
size of the keyhole was 18,036 square microns on average. The
diameter of the voids
Keyholes werewithin
foundthe keyholes
only due sets
in three to gas
ofentrapment
beads: 300was
W around
of laser81power
micronswith scan
on average.
speeds of 200 and 700 mm/s and200 W of laser power with a 200 mm/s scan speed due to
high energy input. The size of the keyhole was 18,036 square microns on average. TheMetals 2022, 12, 87 10 of 13
4.1.4. Keyhole and Void
Keyholes were found only in three sets of beads: 300 W of laser power with scan
speeds of 200 and 700 mm/s and200 W of laser power with a 200 mm/s scan speed due
to high energy input. The size of the keyhole was 18,036 square microns on average. The
diameter of the voids within the keyholes due to gas entrapment was around 81 microns
on average.
4.1.5. Regression Model
Table 5 shows the regression model for the melt pool features. This is an important tool,
as it can be used to predict the output value for unknown values of laser power and scan
speed. The model provides the regression equation for the contact angle with an R2 value
of 86.2% based on the process variables. This can be explained by the strong correlation
between the parameters, laser power and speed with the output contact angle. Although
porosity varied in a consistent manner with laser power, it was somewhat scattered for
scanning speed. Melt pool size had a reasonable correlation as well. These models can be
used to play with the process parameters and achieve the best R2 value for each individual
output parameter. However, more experimental data are needed to get a more realistic
value of the regression model.
Table 5. Regression model to predict bead features.
Bead Feature Model R2
Contact Angle 111.18 − 0.2714 ∗ Power + 0.00834 ∗ Speed 0.862
Porosity 10.75 − 0.04046 ∗ Power + 0.001550 ∗ Speed 0.818
Melt Pool Size 27,865 + 270.1 ∗ Power − 33.45 ∗ Speed 0.774
4.2. Multi-Response Analysis and Optimization
To observe the combined effect of both the process parameters on the all the outputs or
responses simultaneously, the response optimizer was used in Minitab, which is a statistical
analysis software. Response optimization enables the identification of the optimum values
of the variables to achieve the desired set of output values.
Table 6 shows the optimization parameters for each output. The target for the contact
angle was set as 50 degrees. As a lower contact angle can produce higher surface rough-
ness [14], a lower limit of 30 was chosen. On the other hand, a higher angle of contact
with the substrate can facilitate a balling formation, which is why an upper bound of
80 degrees was selected. As porosity is not desirable in additively manufactured parts,
a minimum value was set as the target value. For melt pool area, a range was chosen
which ensured proper adhesion with the previous layer, as well as made sure that repeated
solidification and melting was prevented to avoid residual stress. The keyhole area and
void were avoided during the multi-response analysis, as we did not have enough data for
these features.
Table 6. Parameters set for response optimization.
Response Goal Lower Target Upper Weight Importance
Contact Angle
Target 30 50.0 80 1 1
(Degrees)
Porosity Minimum 0.9 4 1 1
Melt pool (µm2 ) Target 30,000 50,000 70,000 1 1
After examining all the combinations of input, 150 W of laser power and a 200 mm/s
scan speed were selected as the optimum values of the process parameters to provide the
desired output target values. A regression model and process parameters were used to get
the best fit out of all the combination settings. The standard error of the fit (SE fit) was used
to calculate the variation from the mean value for a specific set of process variables. TheMetals 2022, 12, 87 11 of 13
smaller the standard error, the more precise the predicted mean response [40]. The standard
error along with the fit could be used to calculate the confidence interval for the responses.
The SE fit for all the responses is provided in Table 7, along with the confidence interval.
Table 7. Multiple response prediction.
Variable Setting Composite Desirability
Power (W) 150
0.7647
Speed (mm/s) 200
Response Fit SE Fit 95% CI
Contact Angle (Degrees) 56.82 3.44 (50.07, 63.56)
Porosity 2.01 0.87 (0.3048, 3.71)
Melt pool (µm2 ) 55,424 6578 (42,531, 68,316)
One of the most important parameters in a multi-response analysis is composite
desirability. Composite desirability indicates how effectively the settings have reached
the target values. For multiple response parameters, it is difficult to get all the optimum
response parameters for a single combination of process inputs. Composite desirability
combines all the individual desirabilities for each of the response parameters and combines
them to get the overall desirability. The individual desirability for a target response is
defined as [41]:
Y − Li ri
di = ( i ) (6)
Ti − Li
Ui − Yi ri
di = ( ) (7)
Ui − Ti
Here, Y is the predicted value, L is the lowest acceptable value, U is the highest
acceptable value, T is the target value and r is the importance of the ith response. Composite
desirability is defined as:
1
D = ( d1 × d2 × d3 × . . . d n ) n (8)
Here, n is the number of responses or outputs.
For example, it can be observed that the composite desirability of a 150 W/200 mm/s
combination of laser power and scan speed is 0.7647. This combination of power and
speed has produced the values of the response optimizer (Fit column in Table 7) that are
closest to the target values compared to other combinations of speed and power. Therefore,
the composite desirability of other combinations of parameter speeds are less than 0.7647.
Based on these composite desirability values, 150 W of laser power and 200 mm/s of scan
speed were chosen as the optimum process parameters; that is, the closest to the target
value set by the user.
5. Conclusions
• This paper discusses the different features of a melt pool, i.e., contact angle, porosity, melt
pool size, keyhole area and void that were found in additively manufactured samples for
different combinations of laser power and scan speed using optical micrography.
• ImageJ was used to measure and quantify the size of the features. The measured
values were plotted against laser power and scan speed. Contact angle and porosity
decrease with increasing laser power and declining scanning speed, while the process
parameters had the opposite effect on melt pool size.
• A single response statistical analysis was conducted to assess the impact of process
variables. An ANOVA as well as a Pareto chart revealed that both the process parame-
ters have a significant impact on the measured responses because of their effect on the
energy input, with laser power being the most dominant factor between them.Metals 2022, 12, 87 12 of 13
• A multi-response analysis was performed to optimize the process using Minitab.
Composite desirability was used as the performance parameter to choose which
process parameter yields the best features in terms of low porosity, lower contact angle
and average melt pool size.
• A laser power of 150 W and scan speed of 200 mm/s were found to have produced a
melt pool, with the most desired features having the highest composite desirability
of 0.7647.
Author Contributions: Conceptualization, L.L. and F.A.; methodology, F.A.; software, F.A.; valida-
tion, L.L., J.R. and F.A.; formal analysis, F.A.; investigation, L.L.; resources, J.R.; data curation, F.A.;
writing—F.A.; writing—review and editing, J.R. and L.L.; visualization, F.A.; supervision, L.L.; project
administration, J.R. All authors have read and agreed to the published version of the manuscript.
Funding: This research received no external funding.
Institutional Review Board Statement: Not applicable.
Informed Consent Statement: Not applicable.
Conflicts of Interest: The authors declare no conflict of interest.
References
1. Lyons, B. Additive manufacturing in aerospace: Examples and research outlook. Bridge 2014, 44, 3.
2. Gibbons, D.W.; Serfontein, J.-P.L.; van der Merwe, A.F. Mapping the path to certification of metal laser powder bed fusion for
aerospace applications. Rapid Prototyp. J. 2021, 27, 355–361. [CrossRef]
3. Mezghani, A.; Nassar, A.R.; Dickman, C.J.; Valdes, E.; Alvarado, R. Laser powder bed fusion additive manufacturing of copper
wicking structures: Fabrication and capillary characterization. Rapid Prototyp. J. 2021, 27, 1181–1188. [CrossRef]
4. Li, L.; Pan, T.; Zhang, X.; Chen, Y.; Cui, W.; Yan, L.; Liou, F. Deformations and stresses prediction of cantilever structures fabricated
by selective laser melting process. Rapid Prototyp. J. 2021, 27, 453–464. [CrossRef]
5. Zhang, B.; Han, X.; Chen, C.; Zhang, W.; Liao, H.; Chen, B. Effect of the strut size and tilt angle on the geometric characteristics of
selective laser melting AlSi10Mg. Rapid Prototyp. J. 2021, 27, 879–889. [CrossRef]
6. Guan, J.; Wang, Q.; Chen, C.; Xiao, J. Forming feasibility and interface microstructure of Al/Cu bimetallic structure fabricated by
laser powder bed fusion. Rapid Prototyp. J. 2021, 27, 1337–1345. [CrossRef]
7. Rahman, M.S.; Schilling, P.J.; Herrington, P.D.; Chakravarty, U.K. A Comparison of the Thermo-Fluid Properties of Ti-6Al-4V Melt
Pools Formed by Laser and Electron-Beam Powder-Bed Fusion Processes. J. Eng. Mater. Technol. 2020, 143, 021003. [CrossRef]
8. Ahsan, F.; Ladani, L. Temperature Profile, Bead Geometry, and Elemental Evaporation in Laser Powder Bed Fusion Additive
Manufacturing Process. JOM 2020, 72, 429–439. [CrossRef]
9. Ahsan, F.; Razmi, J.; Ladani, L. Experimental measurement of thermal diffusivity, conductivity and specific heat capacity of
metallic powders at room and high temperatures. Powder Technol. 2020, 374, 648–657. [CrossRef]
10. Ladani, L.; Romano, J.; Brindley, W.; Burlatsky, S. Effective liquid conductivity for improved simulation of thermal transport in
laser beam melting powder bed technology. Addit. Manuf. 2017, 14, 13–23. [CrossRef]
11. Dikshit, B.; Zende, G.R.; Bhatia, M.S.; Suri, B.M. Convection in molten pool created by a concentrated energy flux on a solid metal
target. Phys. Fluids 2009, 21, 84105. [CrossRef]
12. Fateri, M.; Pitikaris, S.; Sperl, M. Investigation on Wetting and Melting Behavior of Lunar Regolith Simulant for Additive
Manufacturing Application. Microgravity-Sci. Technol. 2019, 31, 161–167. [CrossRef]
13. Haley, J.C.; Schoenung, J.M.; Lavernia, E.J. Modelling particle impact on the melt pool and wettability effects in laser directed
energy deposition additive manufacturing. Mater. Sci. Eng. A 2019, 761, 138052. [CrossRef]
14. Triantafyllidis, D.; Li, L.; Stott, F. The effects of laser-induced modification of surface roughness of Al2O3-based ceramics on fluid
contact angle. Mater. Sci. Eng. A 2005, 390, 271–277. [CrossRef]
15. Hu, Z.; Zhu, H.; Zhang, C.; Zhang, H.; Qi, T.; Zeng, X. Contact angle evolution during selective laser melting. Mater. Des. 2018,
139, 304–313. [CrossRef]
16. Brennan, M.; Keist, J.; Palmer, T. Defects in Metal Additive Manufacturing Processes. Addit. Manuf. Processes 2020, 24, 277–286.
[CrossRef]
17. Kim, F.H.; Moylan, S.P. Literature Review of Metal Additive Manufacturing Defects; US Department of Commerce, National Institute
of Standards and Technology: Gaithersburg, MD, USA, 2018; pp. 1–17. Available online: http://nvlpubs.nist.gov/nistpubs/ams/
NIST.AMS.100-16.pdf (accessed on 20 November 2021).
18. Mian, J.; Razmi, J.; Ladani, L. Defect analysis and fatigue strength prediction of as-built Ti6Al4V parts, produced using electron
beam melting (EBM) AM technology. Materialia 2021, 16, 101041. [CrossRef]Metals 2022, 12, 87 13 of 13
19. Wang, W.; Wang, S.; Zhang, X.; Chen, F.; Xu, Y.; Tian, Y. Process parameter optimization for selective laser melting of Inconel 718
superalloy and the effects of subsequent heat treatment on the microstructural evolution and mechanical properties. J. Manuf.
Process. 2021, 64, 530–543. [CrossRef]
20. Tapia, G.; Elwany, A.; Sang, H. Prediction of porosity in metal-based additive manufacturing using spatial Gaussian process
models. Addit. Manuf. 2016, 12, 282–290. [CrossRef]
21. Wang, C.; Tan, X.; Tor, S.; Lim, C. Machine learning in additive manufacturing: State-of-the-art and perspectives. Addit. Manuf.
2020, 36, 101538. [CrossRef]
22. Yang, Y.; van Keulen, F.; Ayas, C. A computationally efficient thermal model for selective laser melting. Addit. Manuf. 2020,
31, 100955. [CrossRef]
23. Rahman, M.S.; Schilling, P.J.; Herrington, P.D.; Chakravarty, U.K. Heat Transfer and Melt-Pool Evolution During Powder-Bed
Fusion of Ti-6Al-4V Parts Under Various Laser Irradiation Conditions. ASME Int. Mech. Eng. Congr. Expo. 2020, 84515,
V004T04A017. [CrossRef]
24. Bayat, M.; Klingaa, C.G.; Mohanty, S.; De Baere, D.; Thorborg, J.; Tiedje, N.S.; Hattel, J. Part-scale thermo-mechanical modelling of
distortions in Laser Powder Bed Fusion—Analysis of the sequential flash heating method with experimental validation. Addit.
Manuf. 2020, 36, 101508. [CrossRef]
25. Kwon, O.; Kim, H.G.; Kim, W.; Kim, G.-H.; Kim, K. A Convolutional Neural Network for Prediction of Laser Power Using
Melt-Pool Images in Laser Powder Bed Fusion. IEEE Access 2020, 8, 23255–23263. [CrossRef]
26. Caiazzo, F.; Caggiano, A. Laser Direct Metal Deposition of 2024 Al Alloy: Trace Geometry Prediction via Machine Learning.
Materials 2018, 11, 444. [CrossRef] [PubMed]
27. Machine Learning Requires Big Data–Qubole. Available online: https://www.qubole.com/blog/machine-learning-requires-big-
data/ (accessed on 6 October 2021).
28. Cui, W.; Zhang, Y.; Zhang, X.; Li, L.; Liou, F. Metal Additive Manufacturing Parts Inspection Using Convolutional Neural
Network. Appl. Sci. 2020, 10, 545. [CrossRef]
29. Sanaei, N.; Fatemi, A.; Phan, N. Defect characteristics and analysis of their variability in metal L-PBF additive manufacturing.
Mater. Des. 2019, 182, 108091. [CrossRef]
30. Casalino, G.; Campanelli, S.; Contuzzi, N.; Ludovico, A. Experimental investigation and statistical optimisation of the selective
laser melting process of a maraging steel. Opt. Laser Technol. 2015, 65, 151–158. [CrossRef]
31. Whip, B.; Sheridan, L.; Gockel, J. The effect of primary processing parameters on surface roughness in laser powder bed additive
manufacturing. Int. J. Adv. Manuf. Technol. 2019, 103, 4411–4422. [CrossRef]
32. Tang, C.; Le, K.Q.; Wong, C.H. Physics of humping formation in laser powder bed fusion. Int. J. Heat Mass Transf. 2020, 149, 119172.
[CrossRef]
33. Guo, C.; Xu, Z.; Zhou, Y.; Shi, S.; Li, G.; Lu, H.; Zhu, Q.; Ward, R.M. Single-track investigation of IN738LC superalloy fabricated
by laser powder bed fusion: Track morphology, bead characteristics and part quality. J. Mater. Process. Technol. 2021, 290, 117000.
[CrossRef]
34. Mazzucato, F.; Aversa, A.; Doglione, R.; Biamino, S.; Valente, A.; Lombardi, M. Influence of Process Parameters and Deposition
Strategy on Laser Metal Deposition of 316L Powder. Metals 2019, 9, 1160. [CrossRef]
35. Sadowski, M.; Ladani, L.; Brindley, W.; Romano, J. Optimizing quality of additively manufactured Inconel 718 using powder bed
laser melting process. Addit. Manuf. 2016, 11, 60–70. [CrossRef]
36. Li, R.; Liu, J.; Shi, Y.; Wang, L.; Jiang, W. Balling behavior of stainless steel and nickel powder during selective laser melting
process. Int. J. Adv. Manuf. Technol. 2012, 59, 1025–1035. [CrossRef]
37. Everton, S.K.; Hirsch, M.; Stravroulakis, P.; Leach, R.K.; Clare, A.T. Review of in-situ process monitoring and in-situ metrology for
metal additive manufacturing. Mater. Des. 2016, 95, 431–445. [CrossRef]
38. King, W.E.; Barth, H.D.; Castillo, V.M.; Gallegos, G.F.; Gibbs, J.; Hahn, D.E.; Kamath, C.; Rubenchik, A.M. Observation of
keyhole-mode laser melting in laser powder-bed fusion additive manufacturing. J. Mater. Process. Technol. 2014, 214, 2915–2925.
[CrossRef]
39. F-Distribution Tables. Available online: http://www.socr.ucla.edu/Applets.dir/F_Table.html (accessed on 7 October 2021).
40. All Statistics and Graphs for Response Optimizer. Available online: https://support.minitab.com/en-us/minitab/18/help-
and-how-to/modeling-statistics/using-fitted-models/how-to/response-optimizer/interpret-the-results/all-statistics-and-
graphs/ (accessed on 20 November 2021).
41. Ling, Z.; Chen, J.; Xu, T.; Fang, X.; Gao, X.; Zhang, Z. Thermal conductivity of an organic phase change material/expanded
graphite composite across the phase change temperature range and a novel thermal conductivity model. Energy Convers. Manag.
2015, 102, 202–208. [CrossRef]You can also read