Reaching Into The New Year: Q1 2022 - Last Updated October 2021
←
→
Page content transcription
If your browser does not render page correctly, please read the page content below

Reaching Into
The New Year:
Q1 2022
Seasonal
Strategy Guide

Last Updated
October 2021

Table of Contents

03 Q1 Trends & Learnings

06 Key Audiences in Q1

14 New Years Resolutions

20 Valentine's Day

29 St. Patrick's Day

36 Winter Travel

41 Q1 Seasonal Strategies & How To Activate With FSQ

                                                       2
Overview &
Methodology
Foursquare analyzes consumer behavior based on
foot traffic data from millions of Americans that
make up our always-on panel. Foursquare measures
3+ billion visits per month globally. For the purpose
of this report, all data is anonymized, aggregated
and normalized against U.S. Census data to remove
any age, gender and geographical bias.

In this report, we take a closer look at foot traffic
patterns to various places of interest during Q1
tentpoles including New Years', Valentine's Day, St.
Patrick's Day and general Winter Travel (based on
data from Q1 2021).

                                                        3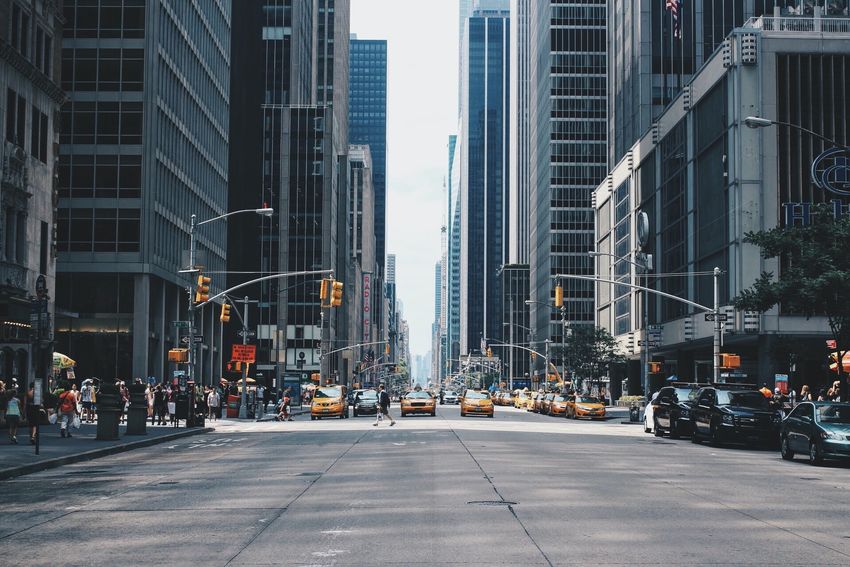
Key Trends To Watch In Q1 2022

 1                                           2                                           3
 Prioritizing family time                    College students are                        Sports fans are returning
 Parents with young children are             returning to campus                         to stadiums & arenas
 increasingly 'out and about', and seeking                                               While some restrictions remain, sports fans
                                             Many college students are returning to
 family-friendly leisure activities. For                                                 are once again filling up stadiums and
                                             their campus for the first time since the
 example, theme parks & zoos are seeing                                                  cheering on their favorite teams from
                                             pandemic began. Beyond academia,
 an uptick in visits around Q1 holidays,                                                 crowded sports bars. These loyal fans are
                                             these young consumers are eager to
 indicating that young parents may be                                                    eager to follow their teams throughout the
                                             partake in various activities including
 taking advantage of long holiday weekends                                               upcoming basketball & hockey seasons.
                                             off-campus nightlife & sporting events .
 to spend quality time with their kids.
                                             Recognize and adapt to changes in           Reach specific audiences based on
 Align with key moments of planning
                                             consumer behavior; Segment and              real-world behavior & historical foot
 & purchase intent with tailored
                                             tailor messaging based on                   traffic patterns.
 activations around real-world
                                             location-based insights.
 behavior.

                                                                                                                                       4
Key Learnings From Q1 2021

     Q1 AUDIENCES                            Q1 TRAVEL                                   Q1 HOLIDAYS

 Our analysis of Q1 foot traffic         Location data verifies that Americans        Location data reveals that not all
 patterns & real-world behavior allows   are eager to travel in the beginning of      audiences are celebrating holidays in
 brands & marketers to glean valuable    the new year. In fact, airports saw a        the same way. While some Americans
 insights about various audiences,       +20% lift in foot traffic in Q1 2021         may be celebrating Valentine's Day with
 including: Parents with young           compared to Q4 2020.                         a fancy dinner or cocktail hour, others
 children, Date Nighters, Urban                                                       may be more likely to plan a romantic
 Millennial Socializers, Winter          While affluent travelers & winter sports     evening at home.
 Travelers, College Students, Q1         enthusiasts are still planning their usual
 Sports Fans & more.                     trips to popular ski resorts, other          Our analysis of Q1 behavior reveals key
                                         consumers may be more inclined to            opportunities for marketers to reach
 Location data and technology can        travel elsewhere in the winter. For          specific audiences of interest. For
 augment your marketing efforts and      example, Millennial socialites have been     example, fast casual dining chains may
 boost conversion rates in several       seen traveling to nightlife hot spots like   want to optimize messaging to reach
 ways a la Foursquare's targeting &      Las Vegas, Miami and Nashville, while        late night snackers who are celebrating
 measurement solutions.                  parents with young children may be           Q1 holidays on-premise, while alcohol
                                         traveling to Los Angeles & Orlando for       brands & essential retailers may want
                                         family-friendly leisure & entertainment.     to target consumers who are planning
                                                                                      Q1 celebratory gatherings at home.

                                                                                                                                5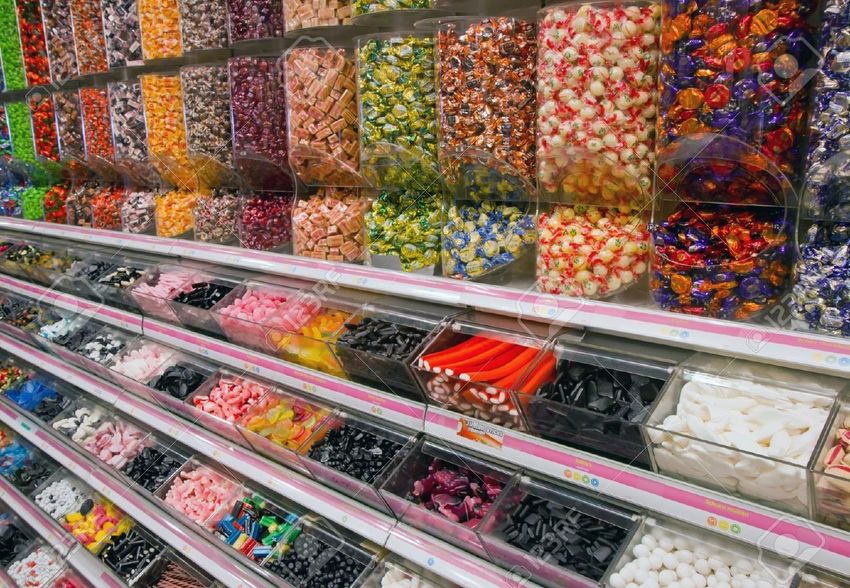
Take a closer look
at consumer
behavior around
specific holidays.

                     6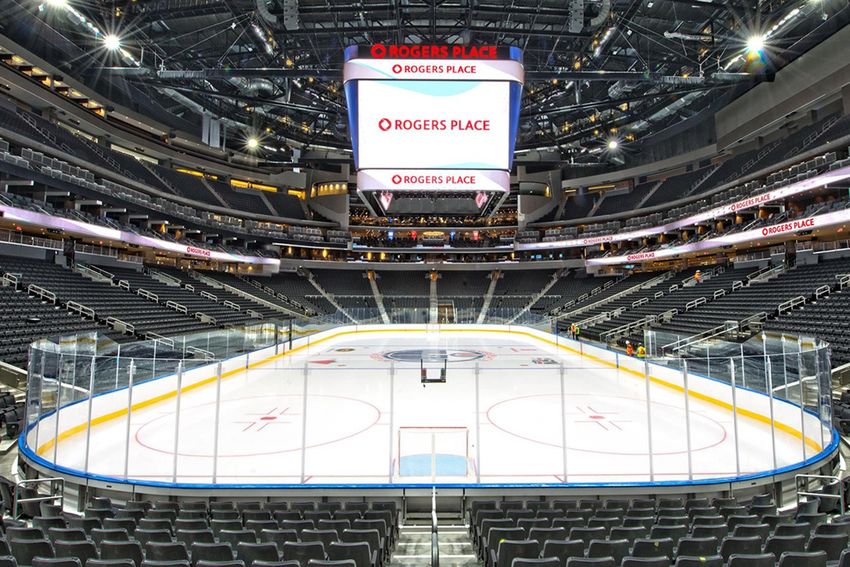
Identify,
understand
& reach key
audiences
in Q1 2022

              7
College students
are returning to
campus in Q1
Foursquare data reveals an uptick in
foot traffic to colleges & universities in
Q1 compared to previous months.

Colleges & Universities              +48%
COLLEGE RESIDENCE HALLS +43%
COLLEGE GYMS +42%
FRATERNITY HOUSES +34%
COLLEGE CAFETERIAS +25%
SORORITY HOUSES +24%
COLLEGE BOOKSTORES +23%

                                             Foursquare data Q1 2021; % indicated an uptick in
                                             traffic as compared the previous quarter (Q4 2020)   8
Sports fans show
up for their favorite
teams in Q1
Foursquare data reveals an uptick in visits
to professional & college sports venues in
Q1 compared to the previous quarter.

HOCKEY ARENAS +37%
COLLEGE HOCKEY RINKS +43%
BASKETBALL STADIUMS +35%
COLLEGE BASKETBALL STADIUMS +43%

                                              Foursquare data Q1 2021; % indicated an uptick in
                                              traffic as compared the previous quarter (Q4 2020)   9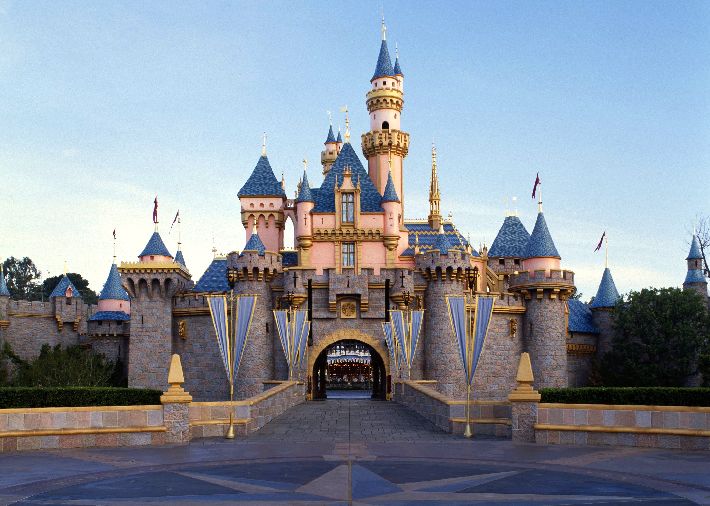
Frequent travelers
are planning their
next vacation for
early in the new year
Foursquare data reveals an uptick in visits
to travel & hospitality venues in Q1
compared to previous months.

Airport Lounges +24%
Baggage Claims +23%
Airports +20%

                                              Foursquare data Q1 2021; % indicated an uptick in
                                              traffic as compared the previous quarter (Q4 2020)   10
Activate custom & ready-to-use audiences in Q1
College Students Sports Fans DADS Winter Travelers
/Audience /Proximity
/Audience
College Students: Reach March Madness Games: Reach
consumers whose location history consumers in real-time while they're at Affluent Travelers: Reaches consumers whose
indicates they are a college or NCAA Arenas where March Madness location history indicates they frequently travel for
graduate student. These consumers games are occurring to generate business or leisure. These are people who typically
have recently been observed awareness & interest on behalf of client. travel at least 600 miles (966 km) from their home
spending a significant amount of at least 4 times a year.
time on a college or university Sports Bars during March Madness:
campus, attending lectures, Reach consumers in real-time while Trip or Vacation Planners: Reach consumers
performing research, or working or March Madness games are being played who are likely planning a trip or vacation. These
eating in student areas. by reaching fans at sports bars to consumers have recently been seen at tour guides,
generate awareness and interest on currency exchanges, travel planners, luggage
NCAA College Basketball behalf of the client. retailers, and other related locations that would
Attendees: Reach consumers whose indicate they are planning a trip.
location history indicates they have Colleges & Universities: Reach college
previously been to a college students in real-time during the dates Family Travelers: Reach parents with young
basketball game this season to March Madness games are being played children whose device history shows they have
recently been to prominent travel destinations
generate awareness and interest. while they are at a college or university
such as Disney World, Six Flags, Sea World, and
to drive traffic and generate awareness.
other amusement parks.
11Americans lose
interest in DIY
hobbies & crafting
in the first few
months of the year
Foursquare data reveals a decline in
visits to craft & hobbyist retailers in
Q1 compared to the previous quarter.
Opportunity: Hardware, home improvement and
FABRIC SHOPS -25% craft store retailers should double-down on
HOBBY SHOPS -20% marketing efforts to reach DIYers and
FRAME STORES -19% hobbyists and overcome the typical decline
ARTS & CRAFTS STORES -19% in foot traffic to these places in Q1.
Foursquare data Q1 2021; % indicated a decline in
traffic as compared the previous quarter (Q4 2020) 12Re-engage DIYers & home improvers
in Q1 with ready-to-use audiences
DADS
Home Improvement Kitchen / Bath
Recent Movers Home Decorators
DIY Shoppers Remodelers
Reach consumers whose Reach consumers whose Reach consumers whose Reach consumers who enjoy
location history indicates location history indicates they location history indicates they decorating and maintaining
they have previously been are remodeling their kitchen or have moved in the past 1-3 their homes. These
shopping at a home bathroom. These consumers months from one home to consumers have a history of
improvement store in the have demonstrated an online another. These locations visiting home furnishing and
past 1-3 months. interest in bathroom and include moving services, decor stores such as IKEA,
Locations include The kitchen fixtures and have been storage companies, U-Haul, Crate & Barrel, Pier 1 Imports,
Home Depot, Lowe’s, seen at general home Penske Truck Rental, HomeGoods, West Elm, Bed
True Value, etc. improvement stores and home Safeguard Self Storage, The Bath & Beyond, etc.
improvement stores that focus Storage Place, etc.
on bathroom and kitchen
fixtures.
13Keep track of
consumers' New
Year Resolutions
14Consumers take a Location data confirms that consumers are less likely
to visit non-essential retail stores in January compared
to December, perhaps indicating a focus on saving vs.
break from shopping spending following an expensive holiday season.
after the holidays Shopping Malls -21%
Opportunity: Specialty stores should OUTLET STORES -35%
consider highlighting New Years' deals CLOTHING STORES -33%
& promotions to drive consumers back DEPARTMENT STORES -30%
to brick & mortar locations in Q1.
SHOE STORES -30%
JEWELRY STORES -27%
BABY STORES -26%
COSMETICS SHOPS -25%
SPORTING GOODS SHOPS -24%
DISCOUNT STORES -21%
ELECTRONICS STORES -21%
Foursquare data from January 2021; % indicates decline in
traffic as compared to the month before (December 2020) 15Many retailers are seeing a decline
in traffic after the holidays
The following retail chains saw a decline in foot traffic in January 2021 compared the previous month:
CLOTHING & SHOES BEAUTY & ACCESSORIES OUTLET STORES
Macy's -47% Zales -44% GAP Factory Store -45%
Saks Fifth Avenue -46% Bath & Body Works -43% American Eagle Outfitters -43%
Old Navy -44% LUSH -40% Coach Factory Outlet -42%
American Eagle -43% Sephora -40% Michael Kors Outlet -39%
Finish Line -42% Claire's -39%
Kohl's -42%
PacSun -40%
Foot Locker -38%
Foursquare data from January 2021; % indicates decline in
traffic as compared to the month before (December 2020) 16Americans are Gym Workouts & Studio Classes
Gyms & Fitness Centers +13%
establishing new Sports Clubs +11%
Yoga Studios +8%
fitness routines Climbing Gyms +8%
Boxing Gyms +8%
in the new year
Outdoor & Solo Fitness Activities
Opportunity: Recognize and adapt
Surf Spots +6%
to changes in consumer behavior
Golf Driving Ranges +12%
as they establish new workout Gym Pools +11%
routines in the new year; Segment Rock Climbing Spots +18%
and tailor messaging based on Tracks +18%
location-based insights.
Team-Based Sports
Tennis Courts +5%
Soccer Fields +6%
Volleyball Courts +15%
Hockey Fields +15%
Foursquare data from January 2021; % indicates uptick in
traffic as compared to the month before (December 2020) 17Americans are
joining the gym
in January
Location data confirms that U.S. consumers are
making New Year’s Resolutions to get in shape.
The following fitness chains all saw a notable
uptick in visits in January 2021:
Gyms & Fitness Centers +13%
Planet Fitness +22%
Life Time Fitness +21%
Blink Fitness +20%
LA Fitness +18%
Crunch Gym +15%
Gold's Gym +10%
Foursquare data from January 2021; % indicates uptick in
traffic as compared to the month before (December 2020) 18Americans are cutting
unhealthy habits in
the new year
After making it through another holiday season full
of indulgent treats, U.S. consumers are making
resolutions to prioritize healthier habits in the new
year. Compared to traffic in December, the following
indulgent categories all saw a slight decline in visits
in January 2021, while nutritionists & weight loss
centers saw a slight uptick in traffic.
Chocolate Shops -25%
Candy Stores -22%
Weight Loss Centers +10%
Nutritionists +6%
Foursquare data from January 2021; % indicates uptick/decline
in traffic as compared to the month before (December 2020) 19Understand
trends in
consumers'
behavior around
Valentine's Day
20Capitalize on Valentine's Day gift givers'
preferences with timely promotions.
The following categories see a positive lift in foot traffic during Valentine's Day weekend compared the previous three weekends.
SWEET TREATS GIFTS & GADGETS LOVE LETTERS
Chocolate Shops +48% Jewelry Stores +25% Hallmark Gold Crown +25%
Candy Stores +40% Nordstrom +43% Photography Labs +24%
Krispy Kreme Doughnuts +34% Apple Store +29% Gift Shops +28%
/audience & proximity /audience & proximity /audience & proximity
Dessert Lovers Affluent Shoppers Doting Husbands & Partners
Indulgent Eaters Affluent Gift Givers Engaged Couples & Newlyweds
Parents With Young Children Luxury Goods Shoppers Valentine's Day Shoppers
Jewelry Shoppers Grandparents
Foursquare data from 2021; % indicates lift in traffic as compared
to the three weekends before Valentine's Day weekend 2021 21Americans are celebrating Valentine's Day with travel
plans, family leisure and romantic date nights.
OUTDOOR ADVENTURES FAMILY FUN DATE NIGHTS &
& WEEKEND GETAWAYS & LEISURE ROMANTIC DAY TRIPS
Single consumers are taking advantage Young parents are celebrating Couples are celebrating Valentine's
of the long holiday weekend by Valentine's Day with a special family Day with a romantic day trip or
planning a trip with friends, perhaps outing to places like Aquariums, date night out on the town.
partaking in winter activities like skiing. Theme Parks and Zoos.
They're visiting:
They're visiting: They're visiting:
Casinos +29%
Vacation Rentals +28% Walt Disney Parks +42% Gay Bars +27%
National Parks +25% AMC Theaters +27% Wineries +23%
Ski Chairlifts +25% Vineyards +23%
Foursquare data from 2021; % indicates lift in traffic as compared
to the three weekends before Valentine's Day weekend 2021 22Americans are
celebrating Valentine’s
Day with a romantic
weekend getaway
Foursquare data reveals an uptick in visits to
travel-related categories during Valentine's Day
weekend compared to previous weekends.
HOTEL BARS +50%
RESORTS +43% Valentine's Day travelers'
preferred hotel chains include:
HOTELS +35%
DoubleTree +86%
AIRPORTS +30%
Hilton Hotels & Resorts +60%
VACATION RENTALS +28%
Marriott Hotels & Resorts +56%
Best Western +42%
Foursquare data from 2021; % indicates lift in traffic as compared
to the three weekends before Valentine's Day weekend 2021 23Viva Las Vegas for
Valentine's Day?
Foursquare data reveals an uptick in visits to
popular hotels & resorts located in the Las Vegas
strip, indicating that Las Vegas may be popular
destination amongst 2022 V-Day travelers.
MGM RESORTS INTERNATIONAL +90%
CAESARS ENTERTAINMENT +61%
/audience
Gambling Behavior: Reach consumers whose location history indicates
they have visited card rooms, horse race tracks, bingo halls, etc.
Leisure Travelers: Reach consumers with an HHI of $100k+ seen
traveling 2+ times a year who are often seen in premium sky lounges. In
addition, they are also often seen at high-end luxury retailers and hotels.
Foursquare data from 2021; lift as compared to the
three weekends before Valentine's Day weekend 2021 24Young parents are
celebrating Valentine's
Day with wholesome
family fun
Foursquare data reveals an uptick in visits to
family-friendly leisure attractions during Valentine's
Day weekend compared to previous weekends.
AQUARIUMS +62%
THEME PARKS +40% Walt Disney Parks & Resorts saw a
+43% lift in foot traffic during
ZOOS +27%
Valentine's Day weekend last year.
INDOOR PLAY AREAS +24%
Foursquare data from 2021; % indicates lift in traffic as compared
to the three weekends before Valentine's Day weekend 2021 25Americans celebrate
Valentine's Day with
adult activities
Foursquare data reveals an uptick in visits to adult
nightlife & entertainment venues during Valentine's
Day weekend compared to previous weekends.
CASINOS +29%
GAY BARS +27%
Doting partners may be planning a
WINERIES +23%
romantic day trip to a nearby winery,
VINEYARDS +23% while single consumers may be
gathering with friends to celebrate
'Galentines Day' on-premise.
Foursquare data from 2021; % indicates lift in traffic as compared
to the three weekends before Valentine's Day weekend 2021 26Date nighters are
celebrating
Valentine’s Day with
a romantic meal
Foursquare data reveals an uptick in visits
to various restaurants on Valentine’s Day
compared to the three weekends before.
BRAZILIAN RESTAURANTS +42% Opportunity: Reach consumers in
FRENCH RESTAURANTS +29% the places they’re most likely
to visit for dine-in or take out
STEAKHOUSES +27%
on Valentine’s Day this year.
SPANISH RESTAURANTS +27%
AMERICAN RESTAURANTS +25%
ITALIAN RESTAURANTS +22%
Foursquare data from 2021; % indicates lift in traffic as compared
to the three weekends before Valentine's Day weekend 2021 27Casual dining chains
are seeing a notable
lift in foot traffic on
Valentine’s Day
Foursquare data reveals an uptick in visits to various
casual dining chains during Valentine’s Day weekend
compared to the three weekends before.
The Cheesecake Factory +59% OPPORTUNITY: Causal dining chains
should consider highlighting pick-up
Red Lobster +54%
and delivery options to win with
P.F. Chang's +52% consumers who plan to stay home this
Olive Garden +43% Valentine's Day.
T.G.I. Friday's +36%
Longhorn Steakhouse +29%
Foursquare data from 2021; % indicates lift in traffic as compared
to the three weekends before Valentine's Day weekend 2021 28Keep track of
trends in
consumer
behavior around
St. Patrick’s Day
29How are Americans Bars & Nightlife
Bars +37%
celebrating St. Nightlife Spots +35%
Cannabis Dispensaries +27%
Patrick's Day?
Music & Entertainment
Karaoke Bars +42%
Opportunity: Align with consumers’
Music Venues +26%
visitation patterns to deliver Arts & Entertainment +23%
moment-based messaging when consumers
are most likely to be 'out & about'.
Weekend Getaways
Resorts +42%
Hotel Bars +33%
Airports +26%
Family Fun
Theme Parks +74%
Arcades +30%
Zoos +23%
Foursquare data from 2021; % indicates lift in foot traffic as
compared to the three weekends before St. Patrick's Day weekend 2021 30Bars & Nightlife
spots see a notable
uptick in visits on
St. Patrick's Day
Foursquare data reveals an uptick in foot traffic to
various on-premise locations during St. Patricks’s Day
weekend compared to the previous three weekends.
/audience
PUBS +58% HOTEL BARS +33%
Irish Pub Visitors: Reach consumers who have a history of visitation
SPORTS BARS +42% DIVE BARS +25%
to Irish pubs and are likely planning to celebrate St. Patrick’s Day.
NIGHTCLUBS +41% COCKTAIL BARS +27%
KARAOKE BARS +41% BREWERIES +23% St. Patrick’s Day Celebrations: Geofence places such as bars, pubs,
parade routes, beer gardens, nightclubs, liquor stores, sports bars,
comedy clubs, pool halls, karaoke bars, billiards rooms, music, and
show venues, etc. on St. Patrick’s Day to reach celebrators in real-time.
Foursquare data from 2021; % indicates lift in foot traffic as
compared to the three weekends before St. Patrick's Day weekend 2021 31Americans celebrate
St. Patrick's Day
with live music &
entertainment
Foursquare data reveals a lift in traffic to music &
entertainment venues during St. Patricks Day
weekend compared to the previous three weekends.
/audience
Karaoke Bars +42% Live Music Enthusiasts: Reach consumers whose location history
indicates they have previously been to a location where people are
Music Venues +26% enjoying live music in the last 1-3 months. Locations include music
and show venues, concert arenas, music festivals, etc.
Arts & Entertainment +23%
/proximity
Live Music Venues: Reach consumers in real-time while they are out
listening to music at entertainment venues. Locations include music
and show venues, concert arenas, music festivals, etc.
Foursquare data from 2021; % indicates lift in foot traffic as
compared to the three weekends before St. Patrick's Day weekend 2021 32Americans celebrate
St. Patrick's Day with
a weekend getaway
Foursquare data reveals a lift in traffic to travel-
related venues during St. Patricks Day weekend
compared to the previous three weekends. /audience
Affluent Leisure Travelers: Reach consumers with an HHI of $100k+ seen
Resorts +42% traveling 2+ times a year who are often seen in premium sky lounges. In
addition, they're also often seen at high-end luxury retailers & hotels.
Hotel Bars +33%
AirBnb & Vacation Home Renters: Reach consumers whose location
Airports +26% history indicates they have visited a popular summer or winter destination
during the summer or winter but do not live there. By excluding consumers
who have been seen at hotels and motels in those areas, we can capture
those who are most likely staying at an AirBnb or vacation home rental.
/online interests
Travel Enthusiasts: Reach consumers whose online interests indicate they
are interested in travel through their search, sharing & content viewing.
Foursquare data from 2021; % indicates lift in foot traffic as
compared to the three weekends before St. Patrick's Day weekend 2021 33Americans celebrate
St. Patrick's Day
with a wholesome
family fun
Foursquare data reveals a lift in traffic to family-
friendly leisure attractions during St. Patricks Day
weekend compared to the previous three weekends.
/audience
Family Travelers: Reach parents with young children whose device history
Theme Parks +74% shows they have recently been to prominent travel destinations such as
Disney World, Six Flags, Sea World, and other amusement parks.
Arcades +30%
Parents with Young Children: Reach consumers whose location history
Zoos +23% indicates that they are parents who have young families.
Family Fun Activities: Reach consumers whose location history shows
they enjoy family fun activities. These consumers are seen at family-
friendly activities and destinations such as theme parks, arcades, carnivals,
miniature golf, bowling, zoos, aquariums, and children’s museums.
Foursquare data from 2021; % indicates lift in foot traffic as
compared to the three weekends before St. Patrick's Day weekend 2021 34Consumers celebrate St. Patrick's
Day with a causal meal
Foursquare data reveals an uptick in visits to fast causal dining chains during St. Patrick's Day weekend.
10:00AM 5:00PM 9:00PM
BRUNCHERS CASUAL DINERS LATE NIGHT SNACKERS
Reach consumers who prefer to Reach consumers who prefer to Reach nightlife enthusiasts & late night snackers
dine out for breakfast or plan a dine out for dinner on holidays who are celebrating St. Patrick's Day on-premise
celebratory brunch with friends on like St. Patrick's Day. & within proximity to your QSR chain.
holidays like St. Patrick's Day.
Location data reveals a lift in Location data reveals a lift in
traffic on St. Patrick's Day to: traffic on St. Patrick's Day to:
Location data reveals a lift in
traffic on St. Patrick's Day to: BUFFALO WILD WINGS +22% KFC +18%
CHILI'S GRILL & BAR +22% CULVER'S +14%
IHOP +34%
TEXAS ROADHOUSE +22% PIZZA HUT +13%
WAFFLE HOUSE +18%
APPLEBEE'S +20% HARDEE'S +13%
DENNY'S +17%
CRACKER BARREL+20% MCDONALD'S +12%
Foursquare data from 2021; % indicates lift in foot traffic as
compared to the three weekends before St. Patrick's Day weekend 2021 35Keep track of
Winter travel
behavior & trends
36Americans are
eager to travel in
the first few
months of the year
Location data confirms that consumers are
more likely to visit certain travel-related
categories in Q1 compared to previous months.
/audience
Airport Lounges +24%
Vacation or Trip Planners: Reach consumers who are likely planning a
Baggage Claims +23% trip or vacation. These consumers have recently been seen at tour guides,
Airports +20% currency exchanges, travel planners, luggage retailers, and other related
locations that would indicate they are planning a trip.
Affluent Travelers: Reach consumers whose location history indicates they
frequently travel for business or leisure. These are people who typically
travel at least 600 miles (966 km) from their home at least 4X a year.
Foursquare data Q1 2021; % indicates an uptick in
traffic as compared to the previous quarter (Q4 2020) 37Americans partake
in winter leisure
activities in the
first few months
of the year
Location data reveals a lift in traffic /audience
to these seasonal locations in Q1
Luxury Sports & Activities: Reach consumers who frequently participate
compared to previous months:
in luxury sports. These consumers are frequently seen playing golf,
tennis, skiing, lacrosse, polo, and participating in other sports affluent
Ski Lodges +172% consumers partake in.
Ski Areas +154%
Winter Activity Enthusiasts: Reach consumers who have been seen
Ski Shops +62% participating in cold-weather activities such as skiing, snowboarding,
and ice skating. consumers have been seen visiting ice skating rinks, ski
Skating Rinks +24% slopes, resort towns such as Mammoth, Jackson Hole, Vail, Park City,
etc. in the past year.
Foursquare data Q1 2021; % indicates an uptick in
traffic as compared to the previous quarter (Q4 2020) 38Not all American
travelers are planning
ski trips this winter
Foursquare data reveals the the most popular U.S.
destinations amongst Q1 travelers last year.
Interestingly, the top 5 destinations are exclusively
warm weather destinations in NV, CA and FL.
Las Vegas Ft. Meyers/Naples
Orlando Denver
Los Angeles New York City
Tampa/St. Petersburg Houston
Miami Nashville
Dallas Washington
Atlanta Chicago
Foursquare data Q1 2021; based
on visits amongst U.S. tourists 39Winter travelers seek warm weather vacations, big
city energy and family-friendly leisure activities
Entertainment & Warm weather & Leisure Activities Big City Energy
Nightlife Beach Vacations & Family Fun
Winter travelers in search
Las Vegas, Miami & Winter travelers are fleeing Phoenix & Denver are popular of site-seeing & famous
Nashville were especially to year-round warm- destinations amongst avid attractions are most likely
popular destinations amongst weather destinations in the golfers and skiing enthusiasts. planning to visit major
Q1 travelers last year, South, like Tampa, Ft. Orlando & Los Angeles are cities like Atlanta, New
indicating that some winter Meyers, Naples & Houston equally popular amongst York City, Washington
travelers seek vacations that to escape the winter cold. families seeking wholesome fun DC and Chicago.
include quality entertainment & entertainment at theme parks,
& nightlife activities. zoos and other attractions.
Foursquare data Q1 2021; based
on visits amongst U.S. tourists 40Seasonal
Strategies
For Q1 2022
41How to activate with Foursquare in Q1.
Segment Audiences Tap Into Trends Reach Consumers With Influence Buyer
Moment Based Messaging Behavior
Identify consumers in different Use taste & trend data to
life stages with changes in foot identify consumer preferences, Dynamically optimize Reach key audiences on their
traffic patterns, visit frequency creating programs that drive messaging and creative to align path to purchase, intercepting
& brand affinities mass personalization with the appropriate moment and influencing their journeys
Conquest Competitors Proximity Target Leverage Insights Measure Impact
Target consumers in and Identify consumers in & Use insights on lifestyles & Monitor how cross platform
around competitor locations around store locations to brand preferences to influence advertising is driving visits to
to change their behavior with drive them to purchase future growth initiative store locations, optimizing
conquesting messaging specific products performance in real-time
42Reach new customers
& align with the right Build highly-customized, scalable audiences based
moments with on real-world consumer behavior.
Foursquare's Select from 1200+ ready-to-use audience available in
our Audience Designer and all major DSPs, DMPs, or
targeting solutions. create highly-customized audiences in our self-serve UI.
Build accurate, custom geofences to reach consumers
in geo-contextual real-time moments.
Build accurate, custom geofences to reach consumers
based on where they are in real-time and key moments of
receptivity. Design your own custom segments in our self-
serve UI, or let us create segments that meet your goals
43Activate
All leading DNP's
Everywhere
You Buy
All leading DSP's Media.
Our targeting is available to
Leading Publishers activate anywhere you buy. Your
platforms are our partners. This
includes deep partnerships with all
leading DSPs/DMPs, publishers
Leading Social Media
and ad networks, social, and
emerging channels like CTV and
out-of-home.
Leading CTV & OOH
44Measure the impact of
all your Q1 Targeting.
And understand the value of emerging channels.
• 13M always-on first party panel, the largest in the industry to
measure incremental visit lift.
• Synthetic control group modeling accounts for the most
accurate attribution solution.
• Available across 550+ partners, including major social
networks like Twitter, Pinterest and Snap.
45Struggling to
understand how
your advertising
impacts your
store traffic?
Foursquare Attribution knows the
true impact of your advertising dollars
with the most accurate footfall
attribution solution in the industry.
46Beyond Marketing
Location technology and data can play a game-changing
role in helping fast casual dining enterprises with the
following strategic decisions and activities:
Customize app experiences based on where
a user is located / where they like to go
Site selection
Territory mapping
Investment strategies
In-app customer experience
Demand forecasting
Learn more about: FSQ/Places & FSQ/Pilgrim SDK
47Harness the power ANALYZE
Our proprietary assets make sense of
of location data with where people are moving to inform
Foursquare Visits better business decisions through
analytics, forecasting, and modeling.
Your first party data is invaluable, but incomplete.
Real-world visits inform how to keep your ACTIVATE
customers engaged and loyal.
Incorporate FSQ Visits into your
With Foursquare Visits, you can incorporate the own data to create custom targeting
only MRC accredited visits solution, which is segments and activate them in your
couples from our first party and our trusted third DSP or social network of choice.
party partnerships.
MEASURE
Leverage FSQ visits as a conversion
metric to gauge the effectiveness of
your entire marketing and strategy
plan to drive people to a store.
48Thank You
Emily Owayni
Senior Strategist, Insights
eowayni@foursquare.com
October 2021
Confidential © FoursquareYou can also read