RNA Based Approaches to Profile Oncogenic Pathways From Low Quantity Samples to Drive Precision Oncology Strategies
←
→
Page content transcription
If your browser does not render page correctly, please read the page content below
METHODS
                                                                                                                                            published: 05 February 2021
                                                                                                                                       doi: 10.3389/fgene.2020.598118

                                              RNA Based Approaches to Profile
                                              Oncogenic Pathways From Low
                                              Quantity Samples to Drive Precision
                                              Oncology Strategies
                                              Anja van de Stolpe 1* † , Wim Verhaegh 2† , Jean-Yves Blay 3,4 , Cynthia X. Ma 5 ,
                                              Patrick Pauwels 6 , Mark Pegram 7 , Hans Prenen 8 , Dirk De Ruysscher 9 , Nabil F. Saba 10,11,12 ,
                            Edited by:        Susan F. Slovin 13 , Karen Willard-Gallo 14 and Hatim Husain 15*
                               Lei Wei,
                                              1
   University at Buffalo, United States         Philips MPDx, Eindhoven, Netherlands, 2 Philips Research, Eindhoven, Netherlands, 3 Medical Oncology, Université Claude
                                              Bernard Lyon 1, Lyon, France, 4 Centre Léon Bérard, Lyon, France, 5 Medicine, Division of Oncology, Section of Medical
                       Reviewed by:
                                              Oncology, Washington University School of Medicine, St. Louis, MO, United States, 6 Molecular Pathology, Centre
               Milind B. Ratnaparkhe,
                                              for Oncological Research (CORE), University of Antwerp, Antwerp, Belgium, 7 Stanford University School of Medicine,
     ICAR Indian Institute of Soybean
                                              Clinical Research, Stanford Cancer Institute, Stanford, CA, United States, 8 Oncology Department, Head of Phase I – Early
                       Research, India
                                              Clinical Trials Unit, Clinical Trial Management Program, Oncology Department, Antwerp University Hospital, Antwerp,
                Paul M. Krzyzanowski,
                                              Belgium, 9 Oncology-Radiotherapy, Maastro/Maastricht University Medical Center, Maastricht, Netherlands, 10 Department
   University Health Network, Canada
                                              of Hematology and Medical Oncology, Emory University School of Medicine, Atlanta, GA, United States, 11 Department
                 *Correspondence:             of Otolaryngology, Emory University School of Medicine, Atlanta, GA, United States, 12 Head and Neck Medical Oncology
                   Anja van de Stolpe         Program, Winship Cancer Institute of Emory University, Atlanta, GA, United States, 13 Department of Medicine, MSKCC,
      anja.van.de.stolpe@philips.com          New York, NY, United States, 14 Molecular Immunology Laboratory, Institut Jules Bordet, Brussels, Belgium, 15 University
                        Hatim Husain          of California, San Diego, La Jolla, CA, United States
                  hhusain@ucsd.edu
     † These   authors have contributed
                    equally to this work
                                              Precision treatment of cancer requires knowledge on active tumor driving signal
                                              transduction pathways to select the optimal effective targeted treatment. Currently only
                   Specialty section:         a subset of patients derive clinical benefit from mutation based targeted treatment,
         This article was submitted to
         Genomic Assay Technology,
                                              due to intrinsic and acquired drug resistance mechanisms. Phenotypic assays to
               a section of the journal       identify the tumor driving pathway based on protein analysis are difficult to multiplex
                  Frontiers in Genetics
                                              on routine pathology samples. In contrast, the transcriptome contains information on
         Received: 23 August 2020
                                              signaling pathway activity and can complement genomic analyses. Here we present the
      Accepted: 07 December 2020
       Published: 05 February 2021            validation and clinical application of a new knowledge-based mRNA-based diagnostic
                             Citation:        assay platform (OncoSignal) for measuring activity of relevant signaling pathways
        van de Stolpe A, Verhaegh W,          simultaneously and quantitatively with high resolution in tissue samples and circulating
          Blay J-Y, Ma CX, Pauwels P,
                Pegram M, Prenen H,
                                              tumor cells, specifically with very small specimen quantities. The approach uses mRNA
 De Ruysscher D, Saba NF, Slovin SF,          levels of a pathway’s direct target genes, selected based on literature for multiple proof
 Willard-Gallo K and Husain H (2021)
                                              points, and used as evidence that a pathway is functionally activated. Using these
   RNA Based Approaches to Profile
      Oncogenic Pathways From Low             validated target genes, a Bayesian network model has been built and calibrated on
  Quantity Samples to Drive Precision         mRNA measurements of samples with known pathway status, which is used next to
                 Oncology Strategies.
             Front. Genet. 11:598118.
                                              calculate a pathway activity score on individual test samples. Translation to RT-qPCR
    doi: 10.3389/fgene.2020.598118            assays enables broad clinical diagnostic applications, including small analytes. A large

Frontiers in Genetics | www.frontiersin.org                                         1                                        February 2021 | Volume 11 | Article 598118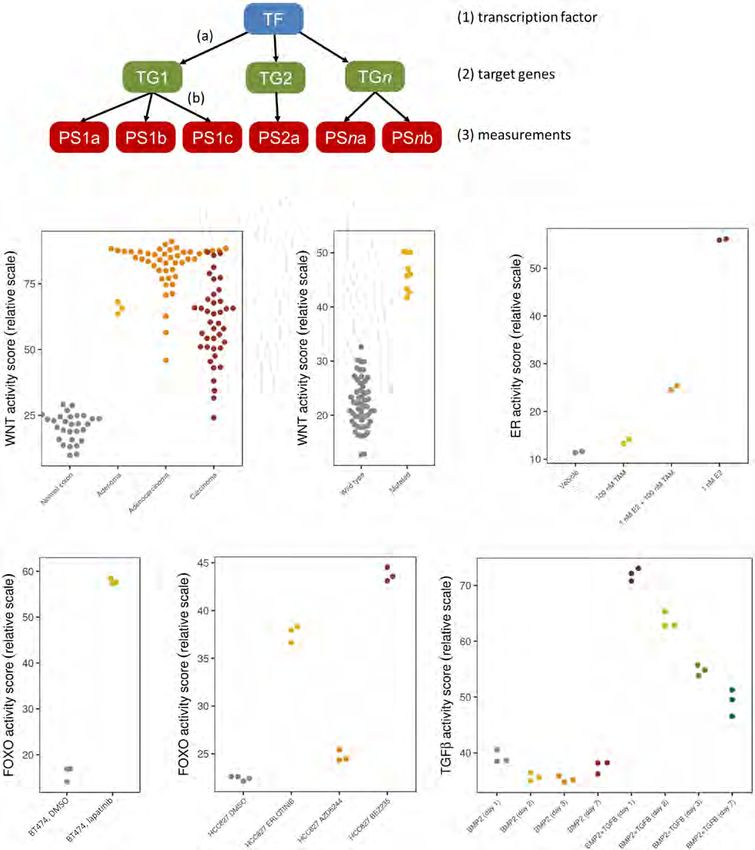
van de Stolpe et al.                                                                                                 RNA Based Precision Oncology Strategies

                                              number of cancer samples have been analyzed across a variety of cancer histologies
                                              and benchmarked across normal controls. Assays have been used to characterize cell
                                              types in the cancer cell microenvironment, including immune cells in which activated
                                              and immunotolerant states can be distinguished. Results support the expectation that
                                              the assays provide information on cancer driving signaling pathways which is difficult
                                              to derive from next generation DNA sequencing analysis. Current clinical oncology
                                              applications have been complementary to genomic mutation analysis to improve
                                              precision medicine: (1) prediction of response and resistance to various therapies,
                                              especially targeted therapy and immunotherapy; (2) assessment and monitoring of
                                              therapy efficacy; (3) prediction of invasive cancer cell behavior and prognosis; (4)
                                              measurement of circulating tumor cells. Preclinical oncology applications lie in a better
                                              understanding of cancer behavior across cancer types, and in development of a
                                              pathophysiology-based cancer classification for development of novel therapies and
                                              precision medicine.
                                              Keywords: oncology precision medicine, treatment prediction, signaling pathway activity, mRNA profiling, low
                                              input analytes

INTRODUCTION                                                                        cancer types (Massard et al., 2017; Dugger et al., 2018; Marquart
                                                                                    et al., 2018; National Cancer Institute, 2021). Emerging evidence
Cellular mechanisms of cancer can be described in terms of                          suggests that activity of specific signaling pathways are involved
abnormal activity of a discrete number of signal transduction                       in response and resistance to a variety of therapies including
pathways that control crucial cellular functions and play                           targeted therapy, immunotherapy, and chemotherapy.
important roles in both physiology (e.g., embryonic
development, immune response) and pathophysiology.
They can be categorized as hormone driven pathways [e.g.,                           A MAJOR CHALLENGE IN ONCOLOGY
estrogen receptor (ER), androgen receptor (AR), progesterone
receptor (PR), and glucocorticoid receptor (GR) pathways],
                                                                                    DIAGNOSTICS AND TREATMENT
growth factor pathways (e.g., PI3K, MAPK-AP1, JAK-STAT1/2                           DECISIONS: IDENTIFICATION OF THE
and JAK-STAT3), the inflammatory pathway (NFκB), and                                TUMOR DRIVING SIGNALING PATHWAY
developmental pathways [e.g., Wnt, Hedgehog (HH), TGFβ, and                         ACTIVITY IN CANCER
Notch pathways].
   Signal transduction pathways drive tumor growth and                              Traditionally, the selection of targeted drugs has been based
metastasis, either as a single active pathway (e.g., the ER                         in immunohistochemistry (IHC, i.e., staining for ER, PR
pathway in luminal A breast cancer) or through cooperation or                       and HER2 protein expression in breast cancer) and can be
crosstalk between signaling pathways (e.g., the MAPK and TGFβ                       applied to formalin fixed paraffin embedded (FFPE) tissue
pathways) (Sundqvist et al., 2013). Abnormal pathways are at                        samples. IHC staining is currently semi-quantitative, however,
the core of cancer pathophysiology and are frequently caused                        and multiplexing staining remains a major challenge. Correct
by molecular aberrations in the cancer genome in interaction                        normalization of staining signals can be inconsistent, and sample
with the cancer cell microenvironment (Hanahan and Weinberg,                        preparation and staining protocols can vary substantially among
2011; Bose et al., 2013). Signaling pathway activity can either                     pathology departments. Expression levels of signaling proteins do
be increased to drive growth or metastasis of a tumor, as is                        not provide information on their functional activity and activity
frequently the case for the PI3K pathway, or decreased in case of                   of the associated signaling pathway (Hemert et al., 2020). The
a signaling pathway that normally serves as a tumor suppressor.                     presence of ER in the cell nucleus is required for ER pathway
Some pathways, such as the TGFβ pathway, can exert tumor                            activity, but ER expression alone is not sufficient as the estrogen
promoting and suppressive effects depending on the cancer                           ligand is necessary to activate ER and consequently the ER
type. A drug can either target the signal transduction pathway                      signaling pathway (Katzenellenbogen et al., 1993; Hemert et al.,
at the receptor, for example trastuzumab to target the HER2                         2020). This explains the variations in ER pathway activity in
receptor, or at downstream nodes, for example a PI3K inhibitor                      an evenly distributed ER positive tumor (Yang et al., 2019;
to target the PIK3CA signaling molecule or everolimus targeting                     Inda et al., 2020). The functional state of signaling proteins
the mTOR protein (Baudino, 2015; Sieuwerts et al., 2020). Many                      can be determined by complex and dynamic alterations of the
targeted drugs, such as those which target the ER, PI3K and                         protein structure, which require quantitative measurement of a
MAPK signaling pathways, have been clinically approved based                        variety of post-translational modifications which affect protein
on evidence of clinical benefit and are being used to treat various                 activity. Staining methods using antibodies that recognize a

Frontiers in Genetics | www.frontiersin.org                                     2                                   February 2021 | Volume 11 | Article 598118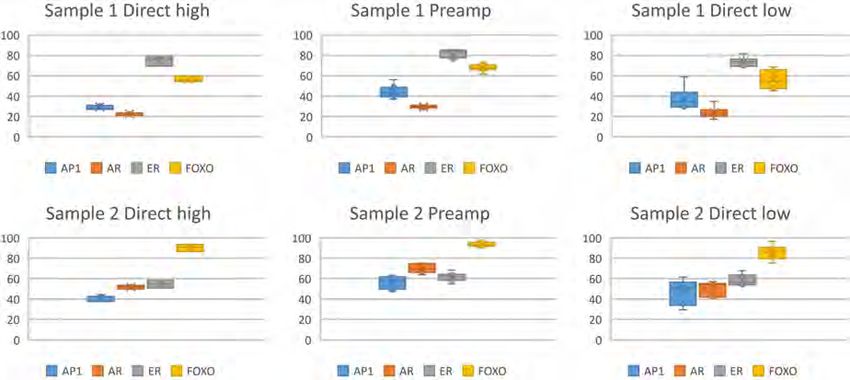
van de Stolpe et al.                                                                                        RNA Based Precision Oncology Strategies

specific phosphorylation state of a protein have been investigated         expression levels are unreliable indicators of corresponding
extensively, but are not always sufficiently reliable (Mandell,            protein levels because their production and turnover rates are
2008). Mass spectrometry proteomics approaches can be used to              frequently not matched. Second, signaling protein levels are in
measure post-translational modifications of a range of receptor,           general not related to the functional activity state of the protein,
signaling and transcription factor proteins (Mnatsakanyan et al.,          which is determined by post-translational modifications, such
2018), but diagnostic applications can be complicated since the            as specific phosphorylations. Nevertheless, mRNA expression
analysis is limited to fresh frozen (FF) tissue samples and requires       levels can provide information on activity of the transcription
a relatively large amount of tissue to obtain a reliable result.           factors that produce them, and indirectly on activity of signaling
An alternative means to measure activity of a signaling protein            pathways that lead to activation of such transcription factors.
is to provide a substrate to the protein to measure enzymatic                  A number of RNA-based pathway analysis tools are available,
activity, but this method is similarly limited to fresh frozen,            such as Ingenuity Pathway Analysis (Qiagen), Gene Set
non-denatured samples (Shi et al., 2018). Directly measuring               Enrichment Analysis (GSEA) (Subramanian et al., 2005) and
transcription factor activity is even more complex and requires            DAVID (Huang et al., 2009). They use pathway information
fresh cells or tissue (Browning et al., 2009). Protein analysis            from databases such as KEGG1 , and WikiPathways2 . The term
approaches have been of limited help to measure the activation             “pathways” there usually refers to a variety of intracellular
state of a signaling pathway and as a method to predict                    molecular mechanisms, not specifically to activity of signal
therapy response.                                                          transduction pathways (Subramanian et al., 2005; Huang et al.,
    The availability of Next Generation Sequencing (NGS)                   2009). These tools are mostly used to discover which “pathways”
techniques has enabled identifying tumor-driving gene mutations            differ between two groups of samples, by looking at the
in many histologies of cancer. This has resulted in a number of            differentially expressed genes between the two groups, and
therapeutic successes, as evident from FDA approved companion              identifying the “pathways” in which these differentially expressed
diagnostic assays based on identification of a specific gene               genes are overrepresented. A drawback of such methods is that
mutation to predict therapy response (FDA, 2020). FDA approval             typically analysis starts unbiased, with thousands of “pathways”
was recently obtained for the use of the PI3K inhibitor drug               being evaluated for their difference between the two groups
alpelisib in breast cancer patients with a PIK3CA mutation, based          of samples. On the one hand, such a discovery setup may
on the results of the SOLAR-1 trial (André et al., 2019). Other            be limited by testing corrections, while many findings may
mutations may be clinically used independent of FDA approval,              emerge that are not reflections of the tumor driving pathway.
for example activating mutations in the ESR1 gene coding for               For instance, when comparing normal tissue to cancer tissue,
the estrogen receptor and associated with resistance to hormonal           “pathways” involved in cell cycling may appear, and can signify
therapy (Jeselsohn et al., 2015). For many mutations in signaling          an effect rather than a driver. In addition, pathways known to
pathway-related genes, for example in the Notch genes, it remains          drive certain tumors in some cases may not be identified or
hard to establish the clinical relevance of the mutation. A clear          identified incorrectly. A GSEA experiment analyzing canonical
link between the mutation and activity of the corresponding                pathways between 32 colon adenoma vs. 32 normal colon
signaling pathway can often not be made reliably (Janku, 2017;             samples from GSE8671, shown in Table 1, failed to identify the
van de Stolpe, 2019; Martin et al., 2020). An important factor,            Wnt pathway as being upregulated in colon adenomas, while
partially explaining this disappointing result, is that the cancer         it is known to be the first activated pathway in practically
cell phenotype is determined not only by genomic mutations, but            all adenomas. The first occurrence of a Wnt pathway was on
also by epigenetic dysregulations and by interactions with cells           position 257 of the result list, with a corrected p-value of 0.91.
in the tumor microenvironment, e.g., fibroblasts and a variety             Some Wnt pathways were reported to be up-regulated in the
of immune cells (Hanahan and Weinberg, 2011). This makes it                normal samples instead of the adenomas. A major cause of such
essential to measure functional signaling pathway activity in a            findings is the inclusion of genes encoding for signaling proteins
cancer tissue sample, while taking into account the challenge to           in “pathways,” which are only very loosely coupled to protein
distinguish between the phenotypes of cancer cells and cell types          levels and activation.
in the microenvironment.                                                       Even if above pathway analysis approaches yield relevant
                                                                           “pathways” that are differentially expressed, then a step is to
                                                                           be made to translate them into a gene expression profile or a
                                                                           classifier that can be applied on an individual test sample. This
MEASURING PHENOTYPIC SIGNALING                                             requires a training step on samples with known ground truth
PATHWAY ACTIVITY IN A CANCER                                               pathway status. Since many of these “pathway” gene sets have
TISSUE SAMPLE FROM mRNA                                                    been derived in a data-driven manner, one should be cautious
EXPRESSION                                                                 when applying them on test samples of a different nature than
                                                                           the original discovery set. Data-driven discovery approaches are
RNA-based methods to measure signaling pathway activity have               difficult to properly assess functional activity of tumor-driving
advanced during the past decade to provide information on                  pathways. Here we will present a novel approach that focuses
signaling pathway activity based on mRNA expression data of
a tumor sample. However, using mRNA expression levels as
a proxy for the presence of corresponding activated signaling              1
                                                                               www.kegg.jp
molecules or transcription factors can be inaccurate. First, mRNA          2
                                                                               www.wikipathways.org

Frontiers in Genetics | www.frontiersin.org                            3                                   February 2021 | Volume 11 | Article 598118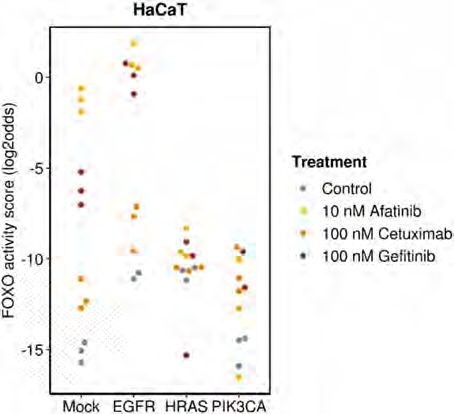
van de Stolpe et al.                                                                                                 RNA Based Precision Oncology Strategies

TABLE 1 | Results of a Gene Set Enrichment Analysis on 32 colon adenomas vs. 32 normal colon samples from GSE8671, using 1,502 canonical pathways from the
curated pathway database from MSigDB (c2/cp).

Up in        Position     Name                                                                                                     nom.p      fdr.q    fwer.q

A
Adenoma          1        PID_FOXM1_PATHWAY                                                                                         0.000     0.224    0.133
Adenoma          2        PID_AURORA_A_PATHWAY                                                                                      0.000     0.211    0.222
Adenoma          3        REACTOME_CHROMOSOME_MAINTENANCE                                                                           0.000     0.193    0.262
Adenoma          4        KEGG_CELL_CYCLE                                                                                           0.002     0.151    0.271
Adenoma          5        REACTOME_G2_M_CHECKPOINTS                                                                                 0.002     0.141    0.303
Adenoma          6        REACTOME_CELLULAR_RESPONSE_TO_HEAT_STRESS                                                                 0.002     0.121    0.306
Adenoma          7        REACTOME_REGULATION_OF_TP53_ACTIVITY_THROUGH_PHOSPHORYLATION                                              0.000     0.105    0.312
Adenoma          8        PID_MYC_ACTIV_PATHWAY                                                                                     0.000     0.093    0.314
Adenoma          9        REACTOME_CELL_CYCLE_CHECKPOINTS                                                                           0.002     0.083    0.314
Adenoma          10       REACTOME_REGULATION_OF_HSF1_MEDIATED_HEAT_SHOCK_RESPONSE                                                  0.002     0.088    0.352
Adenoma          11       REACTOME_BASE_EXCISION_REPAIR                                                                             0.000     0.085    0.364
Adenoma          12       BIOCARTA_G2_PATHWAY                                                                                       0.000     0.081    0.374
Adenoma          13       REACTOME_DNA_REPAIR                                                                                       0.000     0.079    0.384
Adenoma          14       REACTOME_RHO_GTPASES_ACTIVATE_FORMINS                                                                     0.014     0.077    0.397
Adenoma          15       REACTOME_METABOLISM_OF_NUCLEOTIDES                                                                        0.000     0.072    0.397
Adenoma          16       REACTOME_REGULATION_OF_RAS_BY_GAPS                                                                        0.002     0.068    0.403
Adenoma          17       REACTOME_PROTEIN_FOLDING                                                                                  0.002     0.065    0.409
Adenoma          18       SA_G1_AND_S_PHASES                                                                                        0.002     0.063    0.412
Adenoma          19       REACTOME_TELOMERE_MAINTENANCE                                                                             0.000     0.061    0.419
Adenoma          20       REACTOME_TP53_REGULATES_TRANSCRIPTION_OF_GENES_INVOLVED_IN_G2_CELL_CYCLE_ARREST                           0.000     0.059    0.421
B
Adenoma         125       REACTOME_DEGRADATION_OF_BETA_CATENIN_BY_THE_DESTRUCTION_COMPLEX                                           0.018     0.036    0.724
Adenoma         257       REACTOME_TCF_DEPENDENT_SIGNALING_IN_RESPONSE_TO_WNT                                                       0.015     0.046    0.914
Adenoma         387       REACTOME_SIGNALING_BY_WNT                                                                                 0.055     0.179    1.000
Adenoma         482       PID_BETA_CATENIN_DEG_PATHWAY                                                                              0.227     0.363    1.000
Adenoma         496       PID_BETA_CATENIN_NUC_PATHWAY                                                                              0.244     0.393    1.000
Adenoma         507       REACTOME_FORMATION_OF_THE_BETA_CATENIN_TCF_TRANSACTIVATING_COMPLEX                                        0.324     0.420    1.000
Adenoma         540       WNT_SIGNALING                                                                                             0.330     0.463    1.000
Adenoma         546       KEGG_WNT_SIGNALING_PATHWAY                                                                                0.334     0.475    1.000
Adenoma         561       REACTOME_DEACTIVATION_OF_THE_BETA_CATENIN_TRANSACTIVATING_COMPLEX                                         0.405     0.483    1.000
Adenoma         568       BIOCARTA_WNT_PATHWAY                                                                                      0.425     0.487    1.000
Adenoma         652       REACTOME_SIGNALING_BY_WNT_IN_CANCER                                                                       0.792     0.764    1.000
C
Normal           1        KEGG_NITROGEN_METABOLISM                                                                                  0.000     0.178    0.095
Normal           2        KEGG_ALDOSTERONE_REGULATED_SODIUM_REABSORPTION                                                            0.000     0.242    0.209
Normal           3        KEGG_PROXIMAL_TUBULE_BICARBONATE_RECLAMATION                                                              0.006     0.216    0.263
Normal           4        KEGG_LEUKOCYTE_TRANSENDOTHELIAL_MIGRATION                                                                 0.002     0.260    0.351
Normal           5        REACTOME_NITRIC_OXIDE_STIMULATES_GUANYLATE_CYCLASE                                                        0.000     0.241    0.380
Normal           6        REACTOME_PLATELET_HOMEOSTASIS                                                                             0.000     0.206    0.383
Normal           7        KEGG_VASCULAR_SMOOTH_MUSCLE_CONTRACTION                                                                   0.000     0.183    0.391
Normal           8        REACTOME_DIGESTION                                                                                        0.000     0.181    0.412
Normal           9        REACTOME_GLUCAGON_LIKE_PEPTIDE_1_GLP1_REGULATES_INSULIN_SECRETION                                         0.000     0.163    0.415
Normal           10       REACTOME_DIGESTION_AND_ABSORPTION                                                                         0.000     0.148    0.418
Normal           11       REACTOME_GLUCAGON_SIGNALING_IN_METABOLIC_REGULATION                                                       0.000     0.147    0.433
Normal           12       REACTOME_SUMOYLATION_OF_INTRACELLULAR_RECEPTORS                                                           0.000     0.144    0.444
Normal           13       REACTOME_FCGR3A_MEDIATED_IL10_SYNTHESIS                                                                   0.004     0.137    0.451
Normal           14       REACTOME_AQUAPORIN_MEDIATED_TRANSPORT                                                                     0.000     0.131    0.455
Normal           15       REACTOME_STIMULI_SENSING_CHANNELS                                                                         0.000     0.131    0.470
Normal           16       REACTOME_FOXO_MEDIATED_TRANSCRIPTION                                                                      0.004     0.140    0.495
Normal           17       REACTOME_RHO_GTPASES_ACTIVATE_PAKS                                                                        0.002     0.151    0.533
Normal           18       NABA_ECM_GLYCOPROTEINS                                                                                    0.006     0.154    0.547

                                                                                                                                                  (Continued)

Frontiers in Genetics | www.frontiersin.org                                  4                                      February 2021 | Volume 11 | Article 598118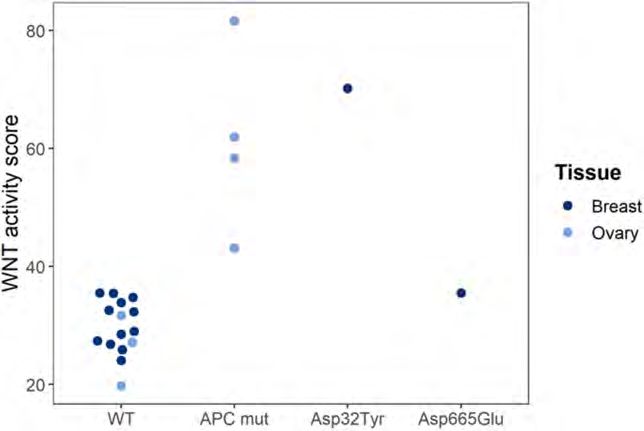
van de Stolpe et al.                                                                                                         RNA Based Precision Oncology Strategies

TABLE 1 | Continued

Up in      Position      Name                                                                                                               nom.p      fdr.q     fwer.q

Normal         19        REACTOME_BINDING_AND_UPTAKE_OF_LIGANDS_BY_SCAVENGER_RECEPTORS                                                      0.002      0.152     0.558
Normal         20        REACTOME_CREATION_OF_C4_AND_C2_ACTIVATORS                                                                          0.006      0.151     0.573
D
Normal        406        PID_WNT_CANONICAL_PATHWAY                                                                                          0.200      0.401     1.000
Normal        672        PID_WNT_SIGNALING_PATHWAY                                                                                          0.534      0.619     1.000
Normal        783        REACTOME_BETA_CATENIN_PHOSPHORYLATION_CASCADE                                                                      0.777      0.804     1.000
Normal        791        REACTOME_WNT_LIGAND_BIOGENESIS_AND_TRAFFICKING                                                                     0.852      0.837     1.000
Normal        792        REACTOME_WNT5A_DEPENDENT_INTERNALIZATION_OF_FZD4                                                                   0.829      0.836     1.000

(A) 20 most upregulated pathways in colon adenomas. (B) Canonical Wnt-related pathways upregulated in colon adenomas. (C) 20 most upregulated pathways in normal
colon samples. (D) Canonical Wnt-related pathways upregulated in normal colon samples. Per pathway the rank is given in the list of upregulated pathways (position), the
nominal p-value (nom.p), false-discovery-rate corrected p-value (fdr.q), and the family-wise error corrected p-value (fwer.q).

on specific pathway activations that are distinct from traditional                     By choosing direct target genes, we ensure maximum specificity
gene enrichment set analysis.                                                          of the models. Furthermore, this reduces dependency on specific
                                                                                       tissue-dependent contexts, making that the models can be used
                                                                                       across different tissue types.
METHODS: DESIGN OF A NEW HIGHLY                                                            Given the network structure, we subsequently define
SENSITIVE ASSAY PLATFORM TO                                                            parameters describing (a) the relation between the transcription
QUANTITATIVELY MEASURE ACTIVITY                                                        factor complex and the direct target genes, and (b) the relation
OF SIGNAL TRANSDUCTION PATHWAYS                                                        between each target gene and its corresponding measurements.
                                                                                       The parameters of the first layer (a) are based on literature
ACROSS CELL AND TISSUE TYPES AND                                                       insights, whereas those of the second layer (b) are calibrated
VALIDATION                                                                             based on measurements on samples with a known ground
                                                                                       truth status for activity of the respective signal transduction
Starting from the opportunities provided by the transcriptome,                         pathway, from which typical measurement levels are deduced in
we have developed an assay (OncoSignal) to quantitatively                              an inactive or an active state. These ground truth samples may
measure activity of signal transduction pathways across cell and                       come from patient studies, such as for the Wnt pathway, which is
tissue types. At the core of the approach is a mathematical                            known to be activated in colon adenomas and inactive in normal
Bayesian model which quantitatively infers activity of signal                          colon samples, or from controlled cell line experiments in
transduction pathways from mRNA measurements of a small                                which a default inactive pathway is activated by adding ligands,
number of selected direct target genes of the respective signaling                     or a constitutively activated pathway is blocked by means of
pathway-associated transcription factor (Verhaegh and van                              blocking compounds.
de Stolpe, 2014; Verhaegh et al., 2014; van Ooijen et al.,
2018; van de Stolpe, 2019; van de Stolpe et al., 2019a).
By selecting for high evidence direct target genes of the                              Biological Validation
transcription factor, this approach builds on knowledge obtained                       After building and calibrating Bayesian pathway models as
on mechanisms of signal transduction and gene transcription                            described above, the models can be applied on subsequent
regulation (van Hartskamp et al., 2019).                                               individual test samples by taking such a sample’s measurements
                                                                                       and feeding them into the model after which Bayesian inference
A Bayesian Model of Target Gene                                                        is used to re-engineer the odds that the transcription factor must
Activation                                                                             have been activated compared to those that are not activated.
We have employed a Bayesian network model that describes the                           These odds are represented on a log2 scale, with a positive value
causal relation between transcription factor activation of a certain                   indicating that there is more evidence for an active pathway, and
pathway and the mRNA expression levels of the corresponding                            a negative value indicating more evidence of an inactive pathway.
direct target genes (Verhaegh et al., 2014), as shown in Figure 1A.                    For ease of comparison, these log2 values are further normalized
The model contains three types of nodes: (1) a transcription                           to a 0–100 scale.
factor complex (TF), (2) high evidence direct target genes (TG),                           We have developed Bayesian network models to assess the
and (3) measurement nodes representing the corresponding                               phenotypic activity of the PI3K, MAPK-AP1, JAK-STAT1/2 and
probes or probe sets (PS) of each of the target genes. Based on                        JAK-STAT3, NFκB, ER, AR, Notch, TGFβ, Wnt and HH signaling
an elaborate literature study, we selected genes as direct target                      pathways using Affymetrix expression microarray data (HG-
genes if they were supported by multiple types of evidence, such                       U133Plus2.0 arrays), and we tested each of them extensively
as motif analysis on the transcription factor, its actual binding to                   on data sets from publicly available sources such as the Gene
promotor regions (e.g., ChIP-seq experiments), and differential                        Expression Omnibus to show that they give a correct read-out
expression experiments, and supported by ongoing clinical trials.                      of activity in samples with known ground truth pathway status

Frontiers in Genetics | www.frontiersin.org                                        5                                        February 2021 | Volume 11 | Article 598118
van de Stolpe et al. RNA Based Precision Oncology Strategies FIGURE 1 | Bayesian model and validation results. (A) The network structure of the Bayesian pathway model, with causal, probabilistic dependencies. (B–G) Validation results with pathway activity scores represented on a 0–100 scale; each dot is an individual sample. (B) Normal colon samples (gray) show a low Wnt pathway activity, while colon adenomas (yellow), adenocarcinomas (orange) and carcinomas (red) show a high Wnt pathway activity; microarray data from GSE20916. (C) Medulloblastoma samples with a driving CTNNB1 mutation (yellow) show a high Wnt activity, while other medulloblastoma samples (gray) show a low Wnt activity; microarray data from GSE10327. (D) ER pathway activity in MCF7 cell lines is low if treated with vehicle (gray) or only tamoxifen (yellow), high if treated with E2 (red), which is reduced again after adding tamoxifen (orange); microarray data from GSE53734. (E) FOXO activity is low in control BT474 cell lines (gray), indicating a high PI3K activity, but FOXO is high again (and PI3K low) after treatment with lapatinib (yellow); microarray data from GSE16179. (F) Quantitative differences in FOXO activity in HCC827 cell lines treated with DMSO (gray), erlotinib (yellow), AZD6244 (orange) and BEZ235 (red); microarray data from GSE51212. (G) Quantitative differences over the course of time (days 1, 2, 3, 7) without (first four groups) and with TGFβ stimulation (last four groups); microarray data from GSE84500. Frontiers in Genetics | www.frontiersin.org 6 February 2021 | Volume 11 | Article 598118
van de Stolpe et al. RNA Based Precision Oncology Strategies
(Verhaegh et al., 2014; Creemers et al., 2018; van de Stolpe et al., way, we ensure compatibility between the microarray-based and
2018; van Ooijen et al., 2018; Bouwman et al., 2020; Canté- RT-qPCR based STP assays.
Barrett et al., 2020; Inda et al., 2020). Some validation data
for Wnt, ER, FOXO, and TGFβ is shown in Figures 1B–G, Comparing Pathway Scores to
illustrating that the tests accurately indicate pathway activity Reference Distributions
known from disease etiology (1B) or mutation information (1C), When performing an STP analysis on an individual patient
and represent changes in activity due to treatment (1D and 1E). sample to help guide the decision on targeted therapy, it
Pathway activity is assessed not only in a qualitative manner, but will be necessary to know whether and to which extent a
differences in effect from various treatment compounds or time specific signaling pathway activity is considered abnormal, and if
series can even be observed quantitatively (1F and 1G). increased, whether it is likely to be tumor driving and targetable.
The signal transduction pathway (STP) assays have been This requires the definition of a normal pathway activity range
biologically validated on a variety of cell types and are in including a pathway activity threshold. To obtain this, STP
principle applicable to all healthy and diseased cell and tissue activity analysis was performed on healthy tissue samples, and the
types. The major reason for this broad applicability is the focus 95th percentile of normal was defined as threshold above which
on transcription factor target genes. This maximally eliminates the signaling pathway activity in tumor tissue is considered to
influences of cell type-specific proteins on the target gene be abnormal (Martin et al., 2020). When the pathway activity
levels. Another feature of the Bayesian computational network score on an individual sample is defined as increased, it can
model is that it can deal well with variability in input data, be considered as a potential tumor driving signaling pathway.
including conflicting data such as target genes that are not To increase the likelihood that the identified pathway is indeed
expressed in a specific sample despite the transcription factor tumor driving, it is of value to know whether this pathway is more
being active, or target genes that are expressed despite an often activated in the analyzed cancer type. For this purpose, sets
inactive transcription factor. Third, target genes were not selected of cancer tissue samples have been compared with the reference
based on relevance for a specific disease or tissue type, but pathway activity range for different cancer types, and frequently
solely as reliable readout for transcription factor activity. When activated signaling pathways were defined as likely tumor driving
expression levels of individual pathway target genes vary between pathways for the respective cancer types. To illustrate this, for
samples and between different cell types, the Bayesian reasoning the ER and AR pathways, the average pathway activity score
principle allows robust interpretation of these mRNA levels. This was observed abnormally high in luminal breast cancer and
explains why the STP assays can deliver reliable pathway activity primary prostate cancer, respectively, indicating a role as tumor
measurements across patient samples in spite of the variation driving pathway in these cancer types (Verhaegh et al., 2014;
that is inherent to such samples. The same signal transduction van de Stolpe et al., 2019a; Inda et al., 2020). If an abnormal
pathways that play a role in cancer, also determine activity ER pathway activity is measured in an ER positive breast cancer
or immunosuppression of the many cell types that together sample, this can be considered as a tumor driving pathway and
generate the innate and adaptive immune response, and as a can be designated as a therapy target, and it may be inferred
consequence STP tests are being studied to measure activity of that a patient can be a good candidate for hormonal therapy
the immune system (van de Stolpe et al., 2019b). (see Figure 2B, left). If despite an ER positive IHC result, the
ER pathway appears to be not abnormally active, the patient
Pathway Assays for Routine Clinical may have another tumor driving pathway active, for example the
PI3K pathway (Figure 2B, right) which may be of importance for
Samples therapy choice. Once the normal reference values are known for
Our STP assays were first built and tested on Affymetrix a specific tissue type, for each patient sample a patient report can
expression microarray data, having the advantage of access to be produced containing information for all analyzed signaling
publicly available datasets from the GEO database, enabling pathways (Figure 2A) and evaluated as potential targets.
model validation on multiple independent preclinical and clinical
datasets (GEO database, 2021). To facilitate clinical use and
enable assay performance on FFPE tissue samples, assays for RESULTS: APPLICATION OF FINDINGS
MAPK-AP1, PI3K, ER, AR, Notch, TGFβ, and HH pathways
have recently been adapted to RT-qPCR measurements of mRNA. The Advantage of Adding RNA-Based
Additional advantages of qPCR-based tests are “in house” use
on regular PCR equipment for a short time-to-result (typically
Information on Signaling Pathway
within 3 h) and use on small or low quality FFPE samples. Activity to DNA-Based Genomic
To build these RT-qPCR pathway assays, we first reduced the Mutation Analysis
number of target genes used per pathway to around 12. This Our findings have shown that STP analysis of a cancer tissue
still enables robust behavior of the assays, while maintaining sample may assist in functionally characterizing a gene mutation;
specificity, and all validation results were confirmed with these for example, an unknown mutation in a gene encoding a
reduced gene lists. Next, we used the very same calibration signaling protein is more likely to be a functional mutation if
samples to determine the model parameters with the only the corresponding pathway was found active (Figure 3). We
difference that we measured them again with RT-qPCR. In this show that Wnt pathway activity scores were measured in tissue
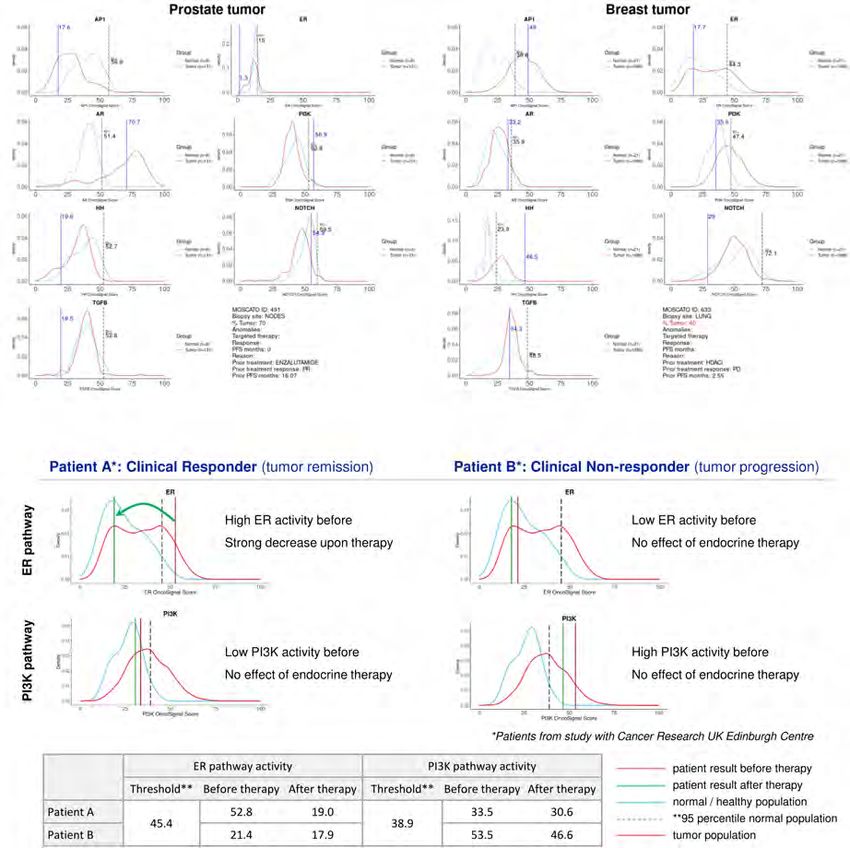
Frontiers in Genetics | www.frontiersin.org 7 February 2021 | Volume 11 | Article 598118van de Stolpe et al. RNA Based Precision Oncology Strategies FIGURE 2 | Patient report for signaling pathway analysis with OncoSignal pathway activity tests. Visualized are for each signaling pathway the pathway activity distribution in healthy reference tissue (blue line) and in primary cancers originating from this tissue (prostate and breast) (red line); the dotted vertical line indicates the 95% confidence interval of normal pathway activity; the vertical blue line indicates the measured pathway activity in the analyzed patient tissue sample. If the blue line is located outside the (right) 95th percentile of normal, pathway activity is considered potentially tumor driving and targetable. (A) Examples of two individual patient samples from the EIT-PACMAN study (Martin et al., 2020), in which samples were analyzed from hard-to-treat patients from the MOSCATO study (Massard et al., 2017). For each patient pathway activity scores are shown for the ER, AR, PI3K, Hedgehog, MAPK-AP1, Notch, TGFβ pathways. Left: prostate cancer patient; right: breast cancer patient. For the prostate cancer patient (vertical line) the AR pathway activity score exceeded the 95th percentile of normal, while for prostate cancer in general AR pathway activity also exceeds the normal threshold (red line); consequently, the AR pathway was defined as a potentially targetable tumor driving pathway for this patient. Similarly, the ER pathway was abnormally active in the advanced breast cancer patient, providing a treatment target. (B) Example of two individual patient samples from Inda et al. (2020). For two patients with an ER positive breast cancer, ER (top) and PI3K (bottom) pathway activity scores are shown before (brown vertical line) and after (green vertical line) neoadjuvant hormonal aromatase inhibitor therapy. The left patient is a responder to hormonal therapy, and the increased ER pathway activity before therapy returned to normal during therapy. The right patient is a non-responder to hormonal therapy, and instead of the ER pathway, the PI3K pathway is the most likely tumor driving pathway. Below, the actual measured pathway activity scores are depicted. samples from human ovarian and breast cancer PDX (xenograft) increased in loss-of-function APC-mutated ovary cancer and in mice. Loss of APC and gain of β-catenin (CTNNB1 gene) protein gain-of-function CTNNB1 Asp32Tyr mutated breast cancer, and function are known to result in increased Wnt pathway activity. normal in non-functionally mutated CTNNB1 Asp665Glu breast Wnt pathway activity scores were normal in the reference (WT), cancer (Figure 3). Frontiers in Genetics | www.frontiersin.org 8 February 2021 | Volume 11 | Article 598118
van de Stolpe et al.                                                                                                     RNA Based Precision Oncology Strategies

  FIGURE 3 | Functional characterization of Wnt pathway mutations in PDX mice. Wnt pathway activity scores were measured in tissue samples from human ovarian
  and breast cancer PDX (xenograft) mice. Loss of APC and gain of β-catenin (CTNNB1 gene) protein function are known to result in increased Wnt pathway activity.
  Wnt pathway activity scores were normal in the reference (WT), increased in loss-of-function APC-mutated ovary cancer and in gain-of-function CTNNB1 Asp32Tyr
  mutated breast cancer, and normal in non-functionally mutated CTNNB1 Asp665Glu breast cancer. Pathway tests were adapted for use in mouse PDX models (to
  exclude interference of mouse model microenvironment). Pathway Activity Scores presented on a 0–100 scale. Tissue samples were analyzed in a collaboration with
  Charles River Labs (CRL) (Verhaegh et al., 2018).

   STP activity analysis is also expected to facilitate the search                  signaling pathway activity in the sample to decide on a targeted
for tumor driving mutations in a tumor, which can be focused                        therapy choice. Furthermore, the pathways involved in epithelial
on genes known to be related to the activated signaling pathway.                    to mesenchymal transition important for cell and CTC migration
Performing DNA and RNA sequencing simultaneously on the                             are reflected in our assay. Measuring targets in CTCs has high
same sample is expected to provide highly complementary                             potential as a liquid biopsy of otherwise unattainable metastatic
information. RNA sequencing data provide information on                             tumors and analyzed as single cells (van de Stolpe et al., 2011; van
mutated genes that are actually expressed and likely to be                          de Stolpe and den Toonder, 2014; Massagué and Obenauf, 2016).
functionally relevant and can be used to better link genomic                           STP analysis of very small samples may be possible using
mutations to abnormal STP activity. To apply this in the                            either RNA sequencing or qPCR to measure the required
PACMAN study (PACMAN, 2021), STP activity analysis is                               mRNA levels. RNA sequencing on single cells has recently
performed retrospectively on samples across histologies of cancer                   developed into a feasible technology (Hedlund and Deng, 2018;
which had been treated with targeted drugs guided by mutation                       Hwang et al., 2018; Chen et al., 2019). Using the STP analysis
analysis, resulting in targeted drug treatment for 19% of patients                  technology, measurement of activity of the Wnt pathway on a
and a 7% increase in treatment response (Massard et al., 2017).                     single (circulating tumor) cell using RNA sequencing data has
Interim study results showed that addition of information on                        already been reported, underscoring the highly sensitive nature
signaling pathway activity increased the percentage of breast and                   of the pathway analysis approach (van Strijp et al., 2017). Initial
prostate cancers for which a targeted drug could be identified to                   results using the qPCR-based STP analysis similarly indicated
nearly all cases (Martin et al., 2020).                                             the feasibility of measuring pathway activity on only a few cells,
                                                                                    using an adaptation of the protocol to include a pre-amplification
                                                                                    method (Figure 4). Incorporating the RNA pre-amplification
The Advantage of Assaying Low Input                                                 step is expected to enable performance of multiple STP analyses
Analytes, Including Circulating Tumor                                               on a single CTC.
Cells
Some clinical sample types are unavoidably associated with a
minimal cancer cell content or low quality. Performing STP
                                                                                    Application of the mRNA-Based Assay
analysis on such samples in a standard manner tends to be                           Platform to Measure Activity of Signaling
associated with high technical noise (Inda et al., 2020). Obtaining                 Pathways
tumor biopsies from difficult to access cancer types, such as lung                  Initial results have been published on a number of different
cancer, or measuring pathway activity in circulating tumor cells                    cancer types using the above described assay platform, in which
(CTCs) may be clinically very relevant to obtain information on                     the potential of STP analysis was explored to provide insight in

Frontiers in Genetics | www.frontiersin.org                                     9                                       February 2021 | Volume 11 | Article 598118
van de Stolpe et al. RNA Based Precision Oncology Strategies
FIGURE 4 | Measurement of activity of multiple signaling pathways simultaneously in a single small tissue sample, using RNA pre-amplification by multiplex PCR (96
primer sets) (Philips MPDx/OncoSignal, Eindhoven, Netherlands). Measurement of activity of the MAPK-AP1 (AP1), AR, ER, PI3K-FOXO (PI3K pathway activity is the
inverse of measured FOXO activity) pathways in two independent formalin fixed paraffin embedded (FFPE) samples, activity score 0–100 on the y-axis. Left: direct
high = pathway activity measurement without pre-amplification in a sufficiently large sample (n = 8), 1 ng per reaction, average mRNA qPCR Cq of 30. Middle:
preamp = measurement in a very low RNA sample after pre-amplification, measured on sample (n = 6) diluted to average Cq of reference genes between 32 and
35.5. Right: direct low = measurement (n = 6) on a similar diluted sample without pre-amplification.
cancer pathophysiology and to predict prognosis and response to was universally measured as active in primary prostate cancer,
therapy (Verhaegh et al., 2014; van Boxtel et al., 2019; Inda et al., AR pathway activity remained high in some castrate-resistant
2020; Sieuwerts et al., 2020; van Weelden et al., 2020). A few key metastatic prostate cancers, possibly reflecting emergence of AR
results are summarized below, centered around the role of the activating mutations (van de Stolpe et al., 2019a). In breast
different signaling pathways in the various cancer types. cancer patients, the highest average AR pathway activity score
The estrogen receptor (ER) pathway is a tumor driving was found in the HER2 subtype (van de Stolpe et al., 2020). The
signaling pathway in breast cancer, and can also be active in ratio between AR and ER IHC staining has been suggested to
ovarian and endometrium cancer although its role in those be informative as to the functional role of the AR pathway in
malignancies is less clear. Adjuvant tamoxifen treatment of ER breast cancer (Rangel et al., 2018, 2020). STP analysis enabled
positive breast cancer patients was associated with significantly calculation of an AR over ER pathway activity ratio instead of the
lower recurrence rate in patients with an ER pathway active AR over ER protein expression ratio, revealing a relatively low
primary tumor, compared to patients with an ER-inactive tumor ratio in luminal A/B and a high ratio in higher grade HER2 and
(Verhaegh et al., 2014). Pathway analysis in three independent basal breast cancer subtypes. This is in line with reported AR/ER
clinical studies (performed using both Affymetrix microarray- expression ratios per subtype, and suggestive of a potential benefit
and qPCR-based pathway analysis) showed that in primary ER of anti-androgen therapy for breast cancer with a high AR/ER
positive breast cancer patients, the ER pathway activity score pathway activity ratio (van de Stolpe et al., 2020). In luminal
predicted response to neoadjuvant treatment with an aromatase breast cancer patients who had all developed metastatic disease
inhibitor (Inda et al., 2020). In ER positive breast cancer patients and therefore constituted a bad prognosis patient subset, high AR
who developed metastatic disease and were subsequently treated pathway activity was associated with worse outcome (Sieuwerts
with first line tamoxifen, an active ER pathway was associated et al., 2020). In advanced salivary duct cancer with positive AR
with a better prognosis (Sieuwerts et al., 2020). In both ovarian IHC staining, the AR pathway activity score predicted response to
cancer and endometrial cancer, loss of ER pathway activity was androgen deprivation therapy (van Boxtel et al., 2019). Currently,
associated with higher grade cancer type and worse prognosis a second independent clinical study is in progress aiming at
(van Lieshout et al., 2020; van Weelden et al., 2020). Results confirmation of the predictive value of AR pathway activity for
suggest that for all three cancer types, ER pathway activity response to anti-androgen therapy.
reflects a more differentiated cancer type associated with a The PI3K pathway is a major growth factor pathway,
better prognosis, and measuring ER pathway activity may predict sometimes called a “survival” pathway, and the frequent pathway
response to hormonal therapy in ER positive breast cancer. activity can be caused by for example mutations in the PIK3CA
The AR pathway is another important hormonal pathway and gene or amplification of the HER2 gene (van de Stolpe, 2019). In
positive IHC staining has been described for different cancer line with this, PI3K pathway activity was found to be associated
types (Munoz et al., 2015). While, as expected, the AR pathway with higher grade and worse prognosis in breast cancer, high
Frontiers in Genetics | www.frontiersin.org 10 February 2021 | Volume 11 | Article 598118van de Stolpe et al. RNA Based Precision Oncology Strategies
grade serous ovarian cancer, prostate cancer, and esophageal with neoadjuvant chemoradiation, combined FOXO plus TGFβ
cancer (Verhaegh et al., 2014; Creemers et al., 2018; van de Stolpe pathway activity was associated with favorable outcome, while
et al., 2019a; Sieuwerts et al., 2020; van Lieshout et al., 2020). loss of FOXO and TGFβ pathway activity was associated with
Novel PI3K inhibitors including B591 and IBL-302 are in various increased recurrence rate (Creemers et al., 2018). Cooperative
stages of development. activity of tumor driving signaling pathways may also be
Activity of developmental signaling pathways, such as the associated with resistance to a drug that targets a single pathway.
TGFβ, Hedgehog, Notch and Wnt pathways, is a typical This is explored in the PACMAN study, in which pathway
characteristic of stem cells and was found in a variety of tumors analysis is performed on a variety of cancer types that were
including medulloblastomas and gliomas (Verhaegh et al., 2014; treated with targeted drugs (Martin et al., 2020). Multiple
Holtzer et al., 2017; van de Stolpe et al., 2019a). Some of these clinical studies are in progress to further explore the relation
pathways, such as the TGFβ pathway, may play either a tumor between single or combined signaling pathway activity and
suppressive or tumor promoting role in cancer, depending on cancer progression, and to investigate clinical value of measuring
cellular context (Alinger et al., 2009; Katoh and Katoh, 2009; signaling pathway activity to predict response and resistance to
Massagué, 2012; Sundqvist et al., 2013; Liu et al., 2015; Aster targeted treatment.
et al., 2017). In breast cancer and colon cancer, high TGFβ
pathway activity was associated with worse prognosis (Wesseling-
Rozendaal et al., 2019a). In contrast, activity of the TGFβ
DISCUSSION: FUTURE APPLICATIONS
pathway was frequently lost in advanced prostate cancer and in
esophageal cancer, suggestive of a tumor suppressive role in the WITH THERAPY SELECTION
corresponding healthy tissue (Creemers et al., 2018; van de Stolpe
et al., 2019a). Various anti-TGFβ small molecule inhibitors or Characterization of the Immune
antibodies are in various stages of development and include the Microenvironment and Blood Samples
compounds SAR439459 and galunisertib. For many diseases, including cancer, the immune response
The Wnt pathway is well known for its tumor initiating is a major determinant of progression, response to therapy,
role in colon adenoma and cancer, and Wnt pathway activity and clinical outcome. Immunotherapy has emerged as a
was confirmed in these tumors (Bienz and Clevers, 2000; high potential curative treatment for many cancer types, and
Verhaegh et al., 2014). The role of Wnt pathway activity in checkpoint inhibitor therapy is becoming standard of care for
some other cancers may be more complex (Kypta and Waxman, cancer types for a variety of tumors including melanoma, lung
2012; Schneider and Logan, 2018). In primary lower grade cancer, head and neck cancers (Havel et al., 2019). Various types
prostate cancer, Wnt pathway activity was associated with the of immunotherapy are available and being developed, mainly
TMPRSS2:ERG fusion protein, known to be able to activate the directed at breaking the immunotolerance against cancer or at
Wnt pathway, but in advanced disease Wnt pathway activity inducing novel anti-cancer immunity by various vaccination
was frequently lost, suggesting a tumor-suppressive rather than approaches, and either as a monotherapy or in combination
tumor-promoting role under this condition (Wu et al., 2013). with radiotherapy, chemotherapy or targeted therapy (Emens
In primary breast cancer and in ovarian cancer, Wnt pathway and Middleton, 2015; Romero et al., 2016; Van Limbergen
activity seemed to be associated with less aggressive tumors et al., 2017). While initially late-stage cancer has been the focus
(Sieuwerts et al., 2020; van Lieshout et al., 2020). of immunotherapy, adjuvant use in an earlier clinical phase,
Notch pathway activity was associated with improved and even in a neoadjuvant setting to exploit the tumor as a
prognosis in T cell-acute lymphoblastic lymphoma (Canté- source of neo-antigen, is being explored (Moujaess et al., 2019).
Barrett et al., 2020). Activity of the Hedgehog pathway was Aside from sporadic successes, such as microsatellite instability
found in primary metastasized breast cancer and was associated or mismatch repair-deficiency biomarkers to reliable predict
with worse prognosis in luminal breast cancer patients who checkpoint inhibitor response, challenges in predicting response
developed metastatic disease, and pathway activity was increased to immunotherapy remain and currently used parameters
in higher compared to lower grade ovarian cancer (Beachy such as tumor type, its neoantigen profile, histopathology
et al., 2018; Sieuwerts et al., 2020; van Lieshout et al., of the tumor infiltrate (TIL) (e.g., inflammatory or immune
2020). Signaling pathways frequently crosstalk to orchestrate excluded), and CD3+/CD8+ and PD1 and PD-L1 IHC do not
specific cellular functions (Cantley et al., 2014). Simultaneous perform sufficiently well (Chang et al., 2018; Hegde and Chen,
measurement of multiple signaling pathway activities on the same 2020; Kennedy and Salama, 2020). As a consequence there
sample enabled exploration of cooperation between signaling is a high need for tests to improve response prediction and
pathways (Sieuwerts et al., 2020). Interaction between the assessment, and also to predict who is at high risk for immune-
SMAD2/3 transcription factor of the TGFβ pathway and the mediated severe side effects (Duffy and Crown, 2019). Failure to
FOXO transcription factor (inversely related to PI3K pathway successfully select responder patients for immunotherapy may
activity) has been described in detail, and can serve a tumor ultimately endanger further clinical implementation of this high
suppressive role (Massagué, 2012; Sundqvist et al., 2013). potential therapy.
Activation of the PI3K pathway, reflected by loss of FOXO The immune response is determined by coordinated activity
activity, is frequently associated with loss of TGFβ pathway of many immune cell types belonging to the innate and
activity (van Ooijen et al., 2018). In esophageal cancer treated adaptive immune system. The functional state of immune
Frontiers in Genetics | www.frontiersin.org 11 February 2021 | Volume 11 | Article 598118van de Stolpe et al. RNA Based Precision Oncology Strategies
cells is determined by coordinated activity of the same signal
transduction pathways that have been described above as
potential tumor driving signaling pathways (Newton and Dixit,
2012; Cantrell, 2015). Immune cells communicate through a
variety of free (e.g., cytokines) or membrane-bound molecules
that bind to specific cellular receptors to activate the signaling
pathways that determine their function in mounting an immune
response, such as T cell clonal expansion, cytotoxic functions and
antigen presentation (Platanias, 2005; Li et al., 2007; Goodman
et al., 2011; Lee et al., 2011; Han et al., 2012; Oh and Ghosh, 2013).
Combined JAK-STAT1/2 and JAK-STAT3 pathway analysis in
blood samples of patients with a variety of viral infections was
shown to quantitatively measure the cellular immune response
to viruses (Bouwman et al., 2020). With respect to cancer,
measurement of STP activity in a tumor infiltrate (TIL), or
possibly in blood samples, may be similarly informative on the
immune-active versus immune-tolerant state of the immune
response. Initial results suggest that in primary breast cancer the
adaptive T cell response has already been switched off, while
in vitro study results suggest that this may be mediated by FIGURE 5 | Analysis on data from GSE80667, described in Fertig et al.
soluble factors from cancer tissue (e.g., TGFβ) that reduce effector (2016). HaCaT premalignant keratinocyte cell line (mock), with overexpressed
wild-type EGFR (EGFR),or activating mutation in HRAS (HRASV12D ) (HRAS) or
immune pathway activity (PI3K, JAK-STAT, NFκB pathways) and
PIK3CA (PIK3CAH1047R ) (PIK3CA) genes; treated for 24 h with cetuximab,
increase activity of the immune suppressive TGFβ pathway (Gu- gefitinib, or afatinib. Measured FOXO activity score per analyzed sample,
Trantien et al., 2013; van de Stolpe et al., 2019b). Investigation presented on a log2odds scale; PI3K pathway activity is the inverse of the
of the value of STP analysis to predict response to checkpoint FOXO activity score.
inhibitor immunotherapy is underway. New technologies are
becoming available to separately analyze different cell types in
cancer tissue, including immune cell subsets in the TIL (e.g., and Jänne, 2012). Only minor inhibitory effects were observed
multiplex IHC, laser microdissection of selected regions for STP in HRAS- and PIK3CA-mutant cells because these mutations
analysis). This may facilitate STP activity profiling in specific are located downstream of the TKI drug targets and therefore
immune cell types in the TIL to investigate the relation with confer resistance.
immunotherapy response (Gu-Trantien et al., 2018; Garaud et al., A third factor to take into account in deciding on a targeted
2019; Solinas et al., 2019). drug treatment is whether more than one tumor driving signaling
pathway is active, potentially conferring drug resistance. This
Choosing a Targeted Drug for an was a frequently encountered issue in the analyzed cancer types
Individual Patient Based on Identification to date (Martin et al., 2020). Activity of the PI3K growth
factor pathway in ER positive breast cancer was associated with
of a Targetable Signal Transduction
primary resistance to endocrine therapy (Ciruelos Gil, 2014).
Pathway Targeting of both pathways simultaneously may be tested to
Choosing a targeted drug with the highest chance at clinical overcome resistance and improve clinical response. Inhibition
response requires characterization and consideration of a number of one signaling pathway may lead to activation of a resistance-
of important factors. Since targeted drugs are specifically directed conferring pathway. An in vitro example for the latter was
toward a component of a signaling pathway, a functionally active identified in fulvestrant resistant breast cancer cell lines that
signaling pathway can be a prerequisite for response (Verhaegh unexpectedly had gained MAPK pathway activity in addition to
et al., 2014; van Boxtel et al., 2019; Wesseling-Rozendaal et al., loss of ER pathway activity (Wesseling-Rozendaal et al., 2019b).
2019b; Inda et al., 2020). In the presence of a pathway activating
mutation in the gene for a signaling protein, the drug needs Dealing With Intra-Tumor Heterogeneity
to target downstream of the activated protein in the signaling Similar to heterogeneity with respect to mutations within a
pathway to be effective. This is illustrated in Figure 5 in which tumor, functional pathway activity levels may vary within a
anti-EGFR inhibitors (cetuximab, gefitinib, and afatinib) had tumor. The amount of variation to expect probably depends
been used to treat breast cancer cells containing mutations in on cancer type as well as the signaling pathway. In a clinical
genes coding for proteins that play a direct or indirect role study on intra-tumor heterogeneity in breast cancer, ER pathway
(through crosstalk between pathways) in the PI3K pathway. All activity was the least variable and PI3K pathway activity the most
TKIs inhibited PI3K pathway activity in wild type cells and cells variable within a tumor (van de Stolpe et al., 2018). Results of this
with overexpressed Epidermal Growth Factor Receptor (EGFR). study suggested that measuring pathway activity at two locations
Inhibition was maximal with the dual EGFR/HER2 inhibitor in a single primary breast cancer biopsy generally provided
afatinib. Of the two EGFR TKI inhibitors, gefitinib was most sufficient information on overall intra-tumor heterogeneity
effective, possibly because it targets EGFR intracellularly (Bardelli (van de Stolpe et al., 2018). Upon further confirmation, a
Frontiers in Genetics | www.frontiersin.org 12 February 2021 | Volume 11 | Article 598118You can also read