Scalable mapping of myelin and neuron density in the human brain with micrometer resolution
←
→
Page content transcription
If your browser does not render page correctly, please read the page content below
www.nature.com/scientificreports
OPEN Scalable mapping of myelin
and neuron density in the human
brain with micrometer resolution
Shuaibin Chang2, Divya Varadarajan3, Jiarui Yang1, Ichun Anderson Chen1, Sreekanth Kura1,
Caroline Magnain3, Jean C. Augustinack3, Bruce Fischl3, Douglas N. Greve3, David A. Boas1,2 &
Hui Wang3*
Optical coherence tomography (OCT) is an emerging 3D imaging technique that allows quantification
of intrinsic optical properties such as scattering coefficient and back-scattering coefficient, and has
proved useful in distinguishing delicate microstructures in the human brain. The origins of scattering
in brain tissues are contributed by the myelin content, neuron size and density primarily; however,
no quantitative relationships between them have been reported, which hampers the use of OCT in
fundamental studies of architectonic areas in the human brain and the pathological evaluations of
diseases. Here, we built a generalized linear model based on Mie scattering theory that quantitatively
links tissue scattering to myelin content and neuron density in the human brain. We report a strong
linear relationship between scattering coefficient and the myelin content that is retained across
different regions of the brain. Neuronal cell body turns out to be a secondary contribution to the
overall scattering. The optical property of OCT provides a label-free solution for quantifying volumetric
myelin content and neuron cells in the human brain.
The cells, dendrites, and axons in the human brain are structured into cytoarchitectonic and myeloarchitectonic
areas, based on cell type, size, density, and the density of myelin sheath surrounding the axons. Those struc-
tural components are the substrate for cognitive competencies and the specific locations of neuropathological
processes1–3. Despite significant advances in imaging technology in the past decades, our understanding of
human brain structures at 1–100 μm scale, in which neurons are organized into functional cohorts, is still lim-
ited. Quantitative features such as cell and myelin density have only been reported in a small number of subjects
and over a small region of the b rain4–9. Currently, Gallyas Silver stain and Nissl stain are two of the standard
histology methods to study myelin content and Neurons in the human brain10,11. Despite their ubiquity, complex
procedures have to be taken to apply these methods. One needs to cut the brain into tens of micron thickness
slices and mount the slice on a glass slide, which induces inevitable tissue damage and distortions. The slices
need to be stained and excessive pigment needs to be washed, which is labor intensive and subject to error and
variability. Strict control of digitization such as illumination power and camera exposure time are pivotal for
downstream quantitative analysis. After imaging individual slices, tremendous efforts are paid to reconstruct
the volume, making it challenging for large scale study.
Optical coherence tomography (OCT) has been widely used in imaging the brain, which allows volumetric
reconstruction of multiple cubic centimeters of tissue with mesoscopic to microscopic resolution. OCT utilizes
the backscattered light to acquire tissue microstructural i nformation12, which has proven to be useful in revealing
cancerous tissue boundaries13,14, 3D vascular structures15–17, fiber tracts, and individual neurons and laminar
structures across the cerebral cortex in rat and human brain18,19. OCT also allows quantification of tissue scatter-
ing. Fitting the OCT depth profile to a nonlinear model allows the calculation of tissue optical properties such
as the attenuation coefficient and the back-scattering coefficient20,21. Myelin and neuron scattering have been
described as the origins of tissue scattering. Wang et al.20 found that the scattering coefficient is higher in white
matter and subcortical nuclei regions with highly myelinated fibers, compared to less myelinated grey matter.
Srinivasan et al.19 found that myelinated fiber tracts are highly scattering while cell bodies have a lower scattering
coefficient. Despite these investigations, quantitative correlations between tissue optical properties and these
structural components have yet to be investigated.
1
Department of Biomedical Engineering, Boston University, 44 Cummington Mall, Boston 02215,
USA. 2Department of Electrical and Computer Engineering, Boston University, 8 St Mary’s St, Boston 02215,
USA. 3Department of Radiology, Massachusetts General Hospital, A.A. Martinos Center for Biomedical Imaging,
13th Street, Boston 02129, USA. *email: hwang47@mgh.harvard.edu
Scientific Reports | (2022) 12:363 | https://doi.org/10.1038/s41598-021-04093-y 1
Vol.:(0123456789)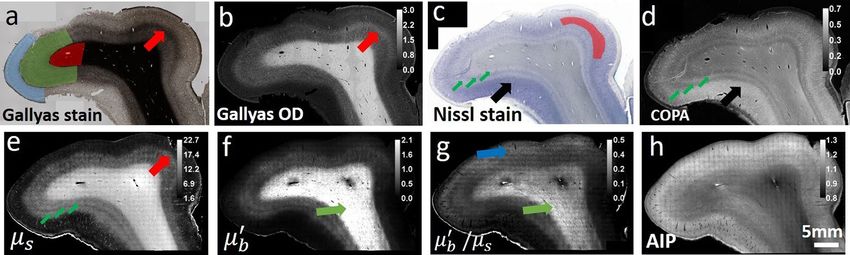
www.nature.com/scientificreports/
Figure 1. Histology and OCT optical property maps of the human somatosensory cortex. (a) Gallyas Silver
stain shows contrast for myelin content. Red region: white matter. Green region: infragranular layers consist
of layer IV, V and VI. Blue region: supragranular layers consist of layer I, II and III. Red arrow indicates a thin
band of higher myelin content inside layer IV. (b) Optical density (OD) of Gallyas silver stain. The red arrow
highlights the myelinated band inside the layer IV. (c,d) Nissl statin and COPA show contrast for cell bodies.
The red region indicates the layer II and III with highest COPA value. The big black arrow highlights the high
neuron density region. The small green arrows highlight the IV, V, VI layers within the infragranular layer
with alternating contrasts. (e–g) Optical properties derived from the OCT images. (e) µs map. Small green
arrows highlight the alternating contrasts in the infragranular layers similar to that in the COPA map, and the
big red arrow indicates the myelinated band seen in Gallyas OD map. (f) µ′ b map. Green arrow highlights the
fibers with high intensity, possibly oriented within the imaging plane. (g) Ratio map of µ′ b /µs . Green arrow
highlights the fibers with high intensity, similar to that in the µ′ b map. The Blue arrow highlights the region with
high signals in the supragranular layers. (h) OCT average intensity projection (AIP) image.
Here, we report our work on quantifying the relationship between tissue optical properties and myelin content
and neuron density in the human brain using automated serial sectioning OCT22. We established a computational
model of the scattering coefficient with myelin content and cell density as the origins of scattering. By using
the ground truth of Gallyas Silver stain and Nissl stain, we showed that the scattering coefficient has a strong
linear relationship with the myelin content across different regions of the human brain. We also found that in
grey matter, the cell body scattering serves as a secondary contribution to the overall tissue scattering and that
the scattering coefficient has a moderate correlation with cell density. Our study provides a novel method for
measuring myelin content and neuron density of the human brain tissues in a scalable sample size. The study
also has important implications in evaluating brain diseases. As demyelination and neuron loss are two of
the pathological hallmarks in neurodegenerative diseases such as Alzheimer’s disease and Chronic Traumatic
Encephalopathy (CTE)23–28, characterization of the optical property in diseased and normal brains will advance
our understanding of pathological evolutions and their impact on complex functions.
Results
Optical property maps resembling quantitative histology. Figure 1 shows the histology and optical
property maps for somatosensory cortex. Gallyas Silver stain (Fig. 1a) exhibits contrast among the supragranu-
lar layers which consist of pyramidal neurons, numerous stellate neurons and sparse axons (indicated by blue
region), infragranular layers with large pyramidal neurons and axon bundles that connect to the subcortical
structures (green region), and the white matter (red region), which mainly consists of highly myelinated axon
bundles and glial cells. The Gallyas Optical Density (OD) map (Fig. 1b) demonstrates that the supragranular
layers have the lowest OD value, followed by the infragranular layers which have intermediate amount of myeli-
nated axon bundles. The white matter exhibits the highest OD value due to the highly myelinated and densely
packed axonal bundles. In addition, smaller features can be seen in the Gallyas OD map as well, such as the thin
band of denser myelin content at the upper right region of layer IV (red arrow), possibly due to the high-density
fibers in the outer band of Baillarger29. The Nissl stain and Cellular Occupation per Area (COPA) map (Fig. 1c,d)
show contrast for cell bodies. The external granular layer (layer II) and the external pyramidal layer (layer III)
exhibit the highest COPA value (red region), especially in the lower left part of the sample (black arrow), prob-
ably due to the higher neuron density. The internal granular layer (layer IV), internal pyramidal layer (layer V),
and the fusiform layer (layer VI) present alternating contrasts (small green arrows). The white matter generally
exhibits a low value of COPA, which is mainly attributed to the glia cells.
The µs map (Fig. 1e) strongly resembles the Gallyas OD map. The white matter shows highest µs because of
the highly scattering myelin sheath. As the sparse axon branches into the cortex, µs decreases accordingly. The
supragranular layer shows the lowest µs , due to the lack of myelin content. In addition, the thin band feature at
the upper right region (red arrow) found in Gallyas OD map can also be seen in the µs map. Apart from that,
the infragranular layers (IV, V, VI) show additional laminar structures (small green arrows) similar to the COPA
map but not in Gallyas OD map. Overall, the µs map seems to be strongly correlated with myelin content and
slightly modulated by the neuron scattering. The µ′ b map (Fig. 1f) offers another feature dimension to aid in
discriminating tissue types. It is noticeable that µ′ b varies within the white matter, possibly highlighting fibers
oriented within the image plane (green arrow). This is possibly because the fibers oriented within the imaging
plane direct more back-scattered photons to the detectors than the fibers oriented through the imaging plane.
Consequently, the µ′ b map offers potential information about fiber orientation. The ratio of µ′ b /µs map (Fig. 1g)
Scientific Reports | (2022) 12:363 | https://doi.org/10.1038/s41598-021-04093-y 2
Vol:.(1234567890)www.nature.com/scientificreports/
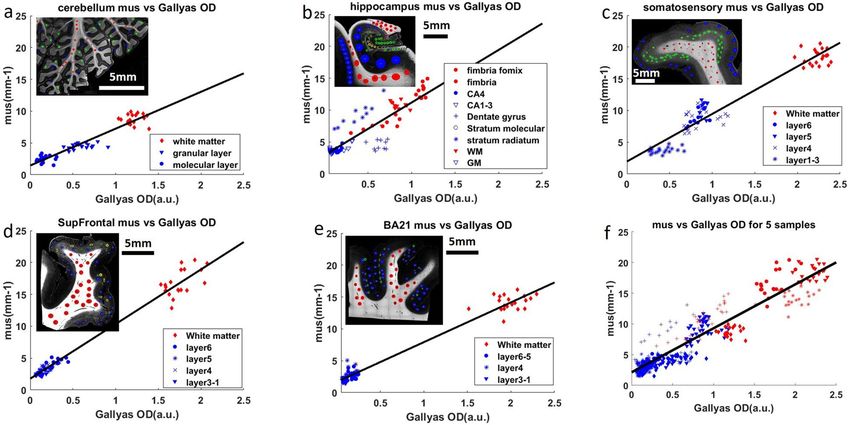
Figure 2. (a–e) Linear regression of µs and Gallyas OD for 5 different regions in human brain samples. Red
dots: white matter data points. Blue dots: grey matter data points. The inset figure shows the Gallyas OD map
of the corresponding sample. The Red circles in the inset figure represent the ROIs in the white matter. The
blue, green and yellow circles represent the ROIs in different layers of the grey matter, for example, the green
ROIs in (c) represent infragranular layers and the blue ROIs represent the supragranular layers. (a) Cerebellum,
(b) hippocampus, (c) somatosensory cortex, (d) superior frontal cortex (SupFrontal), (e) middle temporal
Brodmann area 21(BA21), (f) linear regression of all data points from 5 samples. The six panels have the same
range on the X and Y axes for easier comparison.
provides another useful feature to distinguish structures in the brain. Similar to the µ′ b map, the ratio of µ′ b /µs
map also highlights the region with fibers oriented within the imaging plane (green arrow). In addition, the
ratio of µ′ b /µs map also highlights region of higher value in the superficial layers indicated by the blue arrow,
the cause of such contrast requires further investigation. The AIP image (Fig. 1h) is a nonlinear function of the
µs and µb maps, which provides an overall view of the tissue structure for reference.
The relationship of scattering coefficient and myelin content. The similarity between the µs and
Gallyas OD maps indicates that myelin is a crucial factor contributing to the brain tissue scattering. To quanti-
tatively inspect the relationship, we plot µs versus Gallyas OD in selective ROIs, which covered all the laminar
layers as well as the white matter for the five brain regions. The scatter plots indicate a strong linear relationship
between scattering coefficient and Gallyas OD, which is consistent with the Mie theory30. Therefore, we fit the
data with a linear model and presented the results in Fig. 2a–e.
Remarkably, the five samples share similar linear relationship as indicated by the slope parameter (k1) of
the fitting results, although individual samples have distinct patterns of µs and Gallyas OD distributions. In the
cerebellum (Fig. 2a), data points from the white matter, granular layer and molecular layer form three discrete
clusters. However, they all follow a shared linear function (k1 = 5.79) in which higher Gallyas OD is associated
with higher µs . Similar patterns are observed in the somatosensory cortex (Fig. 2c), where the six cortical lay-
ers and the white matter group into three clusters and share a co-linear relationship (k1 = 7.48). Supragranular
layers (layer I, II and III) form a cluster with the lowest Gallyas OD and µs , infragranular layers (layer IV, V and
VI) form a cluster with intermediate values, and the white matter cluster exhibits the highest values. The other
two cortical regions of SupFrontal and BA21 (Fig. 2d–e) only present two discrete clusters. The supragranular
layers and infragranular layers in both regions fall into a single cluster with low Gallyas OD and µs . The white
matter tracts show high values close to those of somatosensory cortex. Interestingly, the SupFrontal displays a
within-cluster trend in both grey matter and white matter, suggesting a myelin gradient across cortical layers.
Regardless, the slope parameters (k1 = 8.57 for SupFrontal and k1 = 6.24 for BA21) demonstrate a similar rela-
tionship as those revealed in the cerebellum and the somatosensory cortex. In the hippocampus (Fig. 2b), due
to complex anatomical structures, data points from different layers form a continuous distribution. For example,
the fimbria, white matter and fornix show gradually increasing Gallyas OD and µs values, while having large
overlaps with the CA4 and dentate gyrus. Despite the different distribution pattern from other tissues, the fitting
result is comparable with a slope parameter k1 = 8.26.
An extraordinary linear relationship between Gallyas OD and µs is revealed in all the samples (P 0.85 for all brain regions, see Fig. 3b). The slope between Gallyas OD and µs
falls in a narrow range of 5.8 to 8.6. Slope variations are possibly due to different staining backgrounds, as well
Scientific Reports | (2022) 12:363 | https://doi.org/10.1038/s41598-021-04093-y 3
Vol.:(0123456789)www.nature.com/scientificreports/
Figure 3. Multivariate regression of µs vs Gallyas OD and COPA (black bars), compared against univariate
regression where only Gallyas OD is considered (grey bars). (a) Gallyas OD slope k1 of 5 brain regions
resulted from univariate regression and multivariate regression. From left to right: cerebellum, hippocampus,
somatosensory, SupFrontal and BA21. (b) Correlation coefficient with Gallyas OD in univariate and partial
correlation coefficient (PCC) in multivariate regression. (c) R2 of Pearson’s correlation in univariate and
multivariate regressions. (d) Normalized root mean square error (NRMSE) of univariate and multivariate
regressions.
as other scattering factors such as neuronal cell bodies. In Fig. 2f we combined all the data from the 5 samples
and fit a single linear function, which reveals an average slope of 7.2 (correlation coefficient = 0.936, Pwww.nature.com/scientificreports/
Figure 4. Evaluation of µs with COPA and remaining factors in multivariate regression. (a) COPA slope k2 in
the five brain regions. Regions with stars indicate significant k2. (b) Partial correlation coefficient of COPA with
respect to µs. (c) Intercept b of the multivariate regression in the five brain regions.
Figure 5. (a) Average µs, (b) average Gallyas OD in white matter and (c) average COPA in grey matter
differentiating brain regions. The error bars represent the standard error from the ROIs.
in SupFrontal and BA21 are moderate (Fig. 4b), but further statistical test fails to find a significance (P = 0.11 for
SupFrontal and P = 0.35 for BA21). These results suggested that the neuronal scattering is a small contribution to
the overall scattering coefficient and the effect varies across the brain. The negative correlation in the cerebellum
and hippocampus was counterintuitive. However, it should be noted that the size of neurons in densely packed
layers such as the granular cells in the cerebellum and the dentate gyrus in the hippocampus is much smaller
than that of the other layers, which leads to a reduced scattering coefficient. The intercept in the multivariate
regression exhibits large variation as well (Fig. 4c). As the intercept in the regression encompasses the unmod-
eled components to the tissue scattering, such as the extracellular matrix, the small intercepts in hippocampus,
somatosensory, and BA21 indicate a negligible contribution from these remaining components. However, in
cerebellum and SupFrontal cortex, we found a significant intercept (P < 0.001), indicating substantial scattering
components remained. Overall, the fitting results for COPA in the model are coherent with findings in session
2.2 and 2.3 that µs is dominant by the myelin factor. Neuronal cell body, however, only plays a secondary con-
tribution to tissue scattering in the human brain.
Scattering coefficient differentiating neocortex from allocortex. As shown in Fig. 2, µs and
Gallyas OD exhibit distinctive cross-layer patterns among the 5 samples. As both metrics are strong predictors
of myelin content, we examined the mean µs and Gallyas OD in the white matter (red ROIs and red dots on
scatter plots of Fig. 2) for all the samples. We found that µs distribution exhibits a similar pattern as in Gallyas
OD (Fig. 5a,b). Hippocampus and cerebellum have significantly lower Gallyas OD and µs compared to the
other three samples in the cortex, indicating a lower myelin content in the two regions of the brain. Anatomi-
cally, cerebellum and hippocampus belong to the allocortex while somatosensory, SupFrontal and BA21 belong
to the neocortex. The two types of cortices possess different developmental trajectories of myelination (Miller
et al.36). The mean COPA in the grey matter (blue dots on scatter plots of Fig. 2) of the allocortex is significantly
higher than that of the neocortex (Fig. 5c). Our results suggest that in addition to histology, the optical property
obtained by OCT serves as a viable tool to differentiate the neocortex from the allocortex, with a distinction
resulting from underlying myelin content.
The relationship of back scattering and joint myelin content and neuron density. We analyzed
the relationships of µ′ b and µ′ b /µs with respect to the COPA and Gallyas OD, respectively. For cerebellum,
somatosensory cortex, BA21 and SupFrontal, there is a strong linear relationship between µ′ b and Gallyas OD
(Supplemental Figs. 5, 8), which is likely a result of the strong dependency between µs and µ′ b. However, there
is no clear relationship between the ratio map of µ′ b /µs and Gallyas OD or COPA (Supplemental Figs. 6, 7).
Scientific Reports | (2022) 12:363 | https://doi.org/10.1038/s41598-021-04093-y 5
Vol.:(0123456789)www.nature.com/scientificreports/
Discussion and conclusions
Previous studies have demonstrated the ability of OCT to differentiate cortical laminar structures and to identify
fiber tracts and subcortical nuclei20,31. Here, by using serial sectioning OCT, we have quantitatively investigated
the contribution of structural components to the optical property in human brain samples and established a
model of the scattering coefficient with regard to myelin content and neuron density. We have found that the
scattering coefficient is strongly correlated with the myelin content (P 0.85) and that linear rela-
tionship is retained across different regions of the brain. The domination of myelin content in tissue scattering
is reasonable considering the high index of refraction of myelin (n = 1.47) with respect to the surrounding aque-
ous environment (n = 1.35). The results from our study suggest that the optical property can be used a robust
predictor for myelin content of the human brain. This strong correlation between scattering coefficient and
myelin content has important implications in neurodegenerative diseases. It has been shown that the breakdown
of myelin sheath is an indication of pathological abnormality and can result from several neurodegenerative
diseases such as multiple s clerosis32–34, Alzheimer’s d isease25,35 and chronic traumatic e ncephalopathy23,24. The
quantitative measurement of myelin content could potentially be useful in characterizing the degree of demy-
elination in pathological brain samples. In addition, we have shown that scattering coefficient enabled the dif-
ferentiation of various brain regions, such as neocortex and allocortex that have distinct myelination trajectories
in development36. Previous studies have revealed that the degree of myelination and the order of maturation in
the brain is associated with the vulnerability to psychiatric disorders37–39. Systematic characterization of myelina-
tion in the brain may provide a new avenue to map out the regional vulnerability to a range of brain disorders.
Neuronal cell body turns out to be a secondary contribution to the overall scattering, and the correlation var-
ies across different brain regions. In somatosensory cortex we found a significantly positive correlation (P < 0.01),
indicating a strong laminar structure with differed neuron density and size, while in other brain regions we
observed negative or moderately positive correlations. The lack of major contribution made by cell bodies to scat-
tering in brain tissues have been reported in previous studies. Kalashnikov et al.40 found light scattering from the
neuron body contributes less than 10% of the observed backscattering signal when using cultured Hela neurons.
Besides, Magnain et al.41 found out that myelin density and fiber orientation could disrupt the identification of
neuron cell bodies by using an optical coherence microscopy (OCM). As a result, the weak correlation revealed
by the current linear model is not unexpected. Indeed, most of the OCT studies on brain cancer samples have
reported difficulties in differentiating cancer of various stages from normal grey matter merely by scattering
coefficient42,43. Our studies might provide an explanation for those challenges because cell body contribution is
only a minor factor for light scattering in the brain. Further improvement of our scattering model may increase
the sensitivity to neuron scattering. In our model, we assumed the same k1 and intercept between the grey matter
and white matter (Fig. 2 and Supplementary Fig. 9). However, as the refractive index of the extracellular space
in grey and white matter could be different, allowing parameter tuning might result in a better fitting. When
formulating the relationship between scattering coefficient and COPA, we assumed the phase function Qs to
be constant for all neuron bodies (Eq. 4, “Method”), which bears a drawback if there’s a large variation in the
neuron size. Considering the dependency between phase function and scatterer size, a nonlinear model might
improve the performance for correlating scattering coefficient with neuronal cell bodies.
Compared to histological methods, serial sectioning OCT offers a new window for quantifying myeloarchi-
tecture and neuroarchitecture in human brain. Histological stains have been standard methods for studying
myelin content and cell density. However, the outcome of histology heavily depends on the concentration of the
contrast agent, the pH and temperature, and bleaching procedure for undesired pigment, which may vary across
studies. Histology also requires a series of manual processes that are prone to human errors. Consequently, vari-
ations from slice to slice are i nevitable44. In addition, sample must be cut into thin slices before being stained and
imaged, which introduces tissue damage and distortions that are challenging to correct during 3D reconstruction.
Serial sectioning OCT, on the contrary, uses intrinsic optical properties of tissue that does not depend on external
contrast agents. The scattering coefficient is insensitive to system setup, incident power, and acquisition param-
eters. In volumetric imaging, the images are acquired on block-face prior to slicing, avoiding the vast majority
of distortions incurred by tissue cutting and mounting. As a result, serial sectioning OCT generates images with
consistent qualities across slices and samples. The technique, being automated and robust, is favorable to expand
to larger sample size. Thus, serial sectioning OCT provides an attractive solution for quantifying volumetric
myelin content and neuron cells in the human brain.
A few future directions in this field can be pointed out. First, another optical property named birefrin-
gence may directly relate to myelin content in the b rain45. With polarization-sensitive OCT, we can measure the
birefringence of myelinated fibers in addition to the scattering coefficient46. Inclusion of both parameters will
enable a model for predicting and synthesizing myelin content in the human brain. Second, the local index of
refraction may serve as another optical property to quantify neuronal characteristics19. Besides, high-resolution
OCM has proven to be able to visualize neurons in brain tissue. Magnain et al.41 used OCM to identify neurons
that were validated by co-registered Nissl stain images in human entorhinal cortex. In addition to OCT, other
imaging techniques such as two photon microscopy (2PM) could be useful to quantify neuron density as well.
With elongated depth of profile, 2PM is able to cover a volume of tissue with high volume rate and generates
an AIP of autofluorescence signals47–50. Hence, one of the future directions is to use multimodal techniques to
obtain accurate measurement of cell and myelin content in scalable human brain samples. Lastly, the scattering
coefficient measurement and correlation with myelin content could potentially provide valuable information
in in vivo applications such as imaging guided neurosurgery. In a few related studies, Ben Arous et al.51 have
applied deep optical coherence microscopy in post-surgery mouse brain imaging for fiber tracking. Almasian
et al.52 have used the attenuation coefficient extracted from OCT to differentiate normal and glioma tissue during
human brain surgery. OCT imaging of fresh brain tissues has revealed the intricate architecture of the underlying
Scientific Reports | (2022) 12:363 | https://doi.org/10.1038/s41598-021-04093-y 6
Vol:.(1234567890)www.nature.com/scientificreports/
microstructure18,53. Future investigation of quantitative OCT with fast fitting algorithm will allow us to measure
scattering coefficients of the brain in real time that has great potential in neurosurgical and neuromodulation
guidance.
Several empirical considerations ought to be clarified in this study. First, in the effort of correlating to histol-
ogy, we thoroughly examined the quality of histological images and used the slices that have consistent staining
intensity as ground truth. Yet there might be minor variations of staining that were not normalized among dif-
ferent samples, which could be one of the reasons for the variations of the slope and intercept values observed in
the fitting results. Second, we formulated COPA based on the assumption that neuron bodies do not overlap on
Nissl images, which may result in an underestimation in regions with high neuron populations. As an alterna-
tive, we also calculated the OD of Nissl stain and correlated it with the optical properties. The results were not
significantly different from using COPA. Third, to obtain COPA we used an empirical thresholding method to
segment the neuron body while excluding the smaller glia cells, the accuracy of which may depend on brain
regions and staining quality. In the future, a deep learning based classifier may improve the s egmentation9.
Lastly, we acknowledge that there are more sources of scatterers in addition to myelin content and neuron that
contribute to the tissue scattering. In this study, we used a simplified two-regressor linear model to include only
myelin content and neuron and left the other factors as residuals of the model. Although our results showed
strong evidence that myelin content is a major contributor, the intercepts that indicated the secondary source
contribution varied with brain regions. The regions with larger secondary contributions such as the cerebellum or
SupFrontal cortex will benefit from a model that accounted for contributions from other scattering components.
A more complete model incorporating multiple variables into the scattering model, including contributions from
protein, lipid bubbles, fiber structures, and extracellular space is a promising future direction to further improve
accuracy. This type of multivariate Mie scattering model can be built by integrating refractive index, size and
concentration of the various components into the existing model. For example, the water content of the fibers
is associated with fiber density. Scattering changes when light travels from myelin sheath to water or vice versa
where the index of refraction changes. Alternation of water content due to pathology changes the local density
of axonal pack and may reflect on scattering coefficient. In addition, the geometry of fibers including the ratio
of myelin sheath wrapping and thickness with respect to the total axonal diameter may affect the scattering coef-
ficient. Further investigation of a Mie scattering model incorporating the layout of cylindrical scatterers can help
to better understand this mechanism54. The orientation of fibers may affect the backscattering coefficient, which
could be simulated by constructing the scattering model with off-axis fiber bundles. The release or accumulation
of proteins, lipids, and other molecules may contribute to the overall scattering coefficient. Precise quantification
of molecular concentration, index of refraction, and size is needed to build a molecule-specific Mie scattering
model, which may be obtained by histological staining and super-resolution i maging44,55,56.
In conclusion, we have demonstrated the use of optical scattering obtained by serial sectioning OCT to
measure myelin content and neuron density of human brain tissues. The scattering coefficient has a strong
linear relationship with the myelin content across different brain regions, which promotes a robust label-free
measurement for myelin with substantially reduced labor efforts comparing to traditional histology. The scat-
tering coefficient was also moderately modulated by the neuronal cell bodies, the precise measurement of which
requires complementary quantification or imaging techniques. Our approach has great potentials for enabling
large-scale investigation of myeloarchitecture in various brain regions as well as studies of neurodegenerative
processes in pathological brain sample.
Method
Sample. Two human brains (mean age 53.5 ± 12.0 year old, 1 male and 1 female) were obtained from the
Massachusetts General Hospital Autopsy Suite. The brains were neurologically normal without a previous diag-
nosis of neurological deficits. The tissues were fixed by immersion in 10% formalin for at least two months57. The
post-mortem interval did not exceed 24 h. The samples in the study consisted of five anatomical regions from
the two human brains, including the cerebellum, hippocampus, somatosensory cortex, superior frontal cortex,
and middle temporal area 21. Each sample was embedded in 4% melted oxidized agarose and cross-linked with
a borohydride-borate solution for block-face imaging58.
Serial sectioning OCT system. The serial sectioning OCT system was previously d escribed22. Briefly,
the system consists of a spectral-domain OCT system to measure the optical properties of the sample as well
as a customized vibratome for tissue slicing. The light source was a broadband super-luminescent diode with a
center wavelength of 1300 nm and full width half maximum bandwidth of 170 nm, yielding an axial resolution
of 3.5 μm in tissue. The spectrometer consisted of a 1024-pixel InGaAs line scan camera operating at an A-line
rate of 47 kHz. The total imaging depth was estimated to be 1.5 mm. The sample arm used a 10 × water immer-
sion objective (Zeiss, N-Achroplan), yielding a lateral resolution of 3.5 μm. The volumetric imaging covered a
field of view (FOV) of 1.5 × 1.5 × 1.5 mm3. The voxel size, which was defined by the stepping size of galvo mirror
scanning laterally and obtained by the total imaging depth divided by the number of pixels axially, was 2.9 μm
isotropic. The sensitivity of the system was 105 dB. Consecutive image tiles were obtained to cover the entire
area of the sample and a 50% overlap was used between adjacent tiles. A customized vibratome was mounted
adjacent to the OCT to cut off a 50 μm thick slice of the tissue upon completion of the full area scan. The slices
were retrieved for histological staining. It is noted that the comparison of OCT and histology images in this
study was not conducted on the same slices but slices nearby, as OCT slices have been preserved for other uses.
Quantification of optical properties. Optical property maps of the five samples are estimated from the
data, by using a nonlinear model to fit the OCT depth profile as described in20,59. We used the Beer-Lambert
Scientific Reports | (2022) 12:363 | https://doi.org/10.1038/s41598-021-04093-y 7
Vol.:(0123456789)www.nature.com/scientificreports/
Law to model light propagation in tissue, which is a negative exponential function parameterized by scattering
coefficient µs and back-scattering coefficient µb (Eq. 1). The OCT depth profile is also confined by a confocal
function h(z) imposed by the objective lens and a system sensitivity function H(z)20 imposed by the spectrom-
eter as below:
R(z) = µ′b · exp(−2µs z) · h(z) · H(z) (1)
Note that µ′b is the relative back-scattering coefficient, which includes OCT system parameters such as power
and spectrometer configuration and efficiency. Light absorption is ignored due to its small contribution in the
near-infrared spectral range. We used a simplified Gaussian PSF function, which depends on the focus depth Zf
and the effective Rayleigh range ZRs of the objective:
1
h(z) =
z−Zf 2 (2)
1+( ZRs )
We fit the measured OCT profile using a nonlinear optimization tool with the least-square error in Matlab60
to obtain the optimal solutions for parameters of µs and µb. In general, the fitting process tries to find the optimal
value for four parameters:µs , µ′b , Zf and ZRs for each A-line. Without any fitting constraints there is a strong
inter-dependency between these parameters20. To reduce this inter-dependency and to make the fitting more
stable and robust, we spatially parameterized the Zf and ZRs following the procedure described in Yang et al. 2020.
The Zf and ZRs values were pre-calibrated using an Intralipid phantom with a comparable scattering coefficient
as the tissue sample. As a result, we have reduced the number of unknowns in our fitting model to two: µs and
µ′b . To reduce the noise and errors in estimating these optical properties, the OCT A-lines were averaged over a
30 × 30 μm2 area before fitting. A ratio map of µ′b /µs was obtained afterward.
In reconstruction, we used ImageJ to stitch the AIP of each OCT image tile to generate the XY coordinates
for overlapping tiles. The tiles were then blended using a customized Matlab code to remove artifacts caused
by intensity non-uniformity across the field of view. The down-sampled (30 × 30 μm2, same as the volumetric
averaging in fitting) stitching coordinates were used to stitch the µs and µ′b results from previous fitting steps.
Quantitative histological analysis. Selected slices from the serial block-face scanning were processed
with Nissl stain61,62 for neuron body identification and Gallyas s tain10,36 for characterizing myelin content. The
stained slices were digitized by an 80i Nikon Microscope (Micro- video Instruments, Avon, Massachusetts) with
a 4 × objective. The pixel size was 1.9 μm.
The Gallyas stain images were normalized in each channel and converted to mean Optical Density (OD)44
to directly represent the myelin content:
−1
OD = log 10 (Ii /255) (3)
3 i=R,G,B
where I is the RGB vector of the histology image with Ii representing the intensity of the red, green, or blue chan-
nel, respectively. Each RGB channel was normalized separately before converting to OD in log scale. Then the
average of three channels was used as the mean OD that represents the myelin content. Based on Mie scattering
theory, assuming the same myelin architecture generating a constant phase function in the brain, scattering
coefficient is expected to be proportional to myelin density which is represented by Gallyas OD.
For the cellular scattering, according to Mie t heory63, the scattering of sphere particles is related to the phase
function Qs, the number density of the sphere Ns, and the cross-section area of the sphere As:
µs = Qs Ns As (4)
Assuming that the phase function Qs is constant for all neuron bodies, the scattering coefficient becomes pro-
portional to the product of cellular density Ns and cellular cross-sectional area As, which we define as the cellular
occupation per area (COPA). We constructed the COPA map in Nissl stain images by calculating the total area
occupied by cell bodies and divided it by the total area of the tissue in a small neighborhood. The computation
was conducted in two steps: (1) we segmented the cell bodies in the Nissl stain image using a threshold-based
method, which converts the pixels values inside cell body to be 1 and the others in extracellular space to be 0;
(2) by calculating the ratio of number of pixels with value equal to 1 to the total number of pixels within a small
neighborhood (a 200 × 200 µm box), we obtained the percentage of that local area occupied by cell bodies. The
box moved across the entire image to form the COPA map.
Generalized linear model. Taking both myelin and neuronal cell bodies into account, we examined the
quantitative relationship between the optical properties and the Gallyas OD and COPA to reveal the sources of
tissue scattering. OCT block-face and the histology images were acquired on slices from the same brain region
that were a few millimeters apart. We manually drew 60 to 90 Region of Interests (ROIs) on corresponding slices
from both modalities for linear regression analysis. The area of ROIs ranges from 200 to 500 pixels. In larger
areas with more uniform intensity, such as the grey matter in hippocampus, the area of ROIs were expanded to
a few thousand pixels to get more precise measurement. The total number of ROIs depends on the number of
distinct cortical layers or subdivisions. On average we drew 20 evenly distributed ROIs for each layer in the µs ,
Gallyas OD and COPA maps, respectively.
Scientific Reports | (2022) 12:363 | https://doi.org/10.1038/s41598-021-04093-y 8
Vol:.(1234567890)www.nature.com/scientificreports/
We built a multivariate, generalized linear model (GLM) for µs to include Gallyas OD and COPA as predictors.
In the grey matter, we included both Gallyas OD and COPA as contributing factors, whereas in white matter, we
only considered Gallyas OD since contribution from neuronal cell bodies was neglectable. The GLM relationship
can be mathematically described as,
µs = X · β, (5)
where the matrix X contains the measured Gallyas OD and COPA values and β contains the linear coefficients
that will be estimated:
X T = 1 1 · · · 1; GallyasOD1 GallyasOD2 · · · GallyasODn ; COPA1 COPA2 · · · COPAn
(6)
β T = [b k1 k2 ] for multi-variable regression.
X T = 1 1 · · · 1; GallyasOD1 GallyasOD2 · · · GallyasODn β T = [b k1 ] for uni-variable regression.
(7)
where n is total number of ROIs, k1 is the slope corresponding to the myelin contribution to the tissue scatter-
ing, k2 is the slope corresponding to the neuronal contribution to the tissue scattering, and b is the contribution
from other components, such as scattering from the extracellular matrix. The coefficients were calculated by a
pseudoinverse solution as,
(8)
−1
β = (X T · X) · X T · µs
We used R2 of Pearson’s correlation and Normalized Root Mean Square Error (NRMSE) for examining the
goodness of the fitting. Partial correlation coefficient (PCC), two sided t-tests and multiple comparisons were
conducted to reveal the significance of the contributions from Gallyas OD and COPA, respectively.
It should be noted that we set COPA in the white matter of all tissue types to be 0 before regression, as there
are only glia cells and a few interstitial neurons64 in the white matter, which won’t contribute to scattering signifi-
cantly. Leaving it unchanged, however, will bias the regression. In the multivariable regression, we also assumed
that k1 and b to be the same in grey and white matter, as we assume that the contribution from myelin and other
extracellular components behave similarly, and thus use the same coefficients k1 and b to describe them jointly.
Lastly, we also investigated the origins of contrast in the µ′b map and ratio of µ′b /µs . Four linear models were
used, namely, fitting µ′b as a linear function of Gallyas OD and COPA, respectively, and fitting the ratio of µ′b /µs
as a linear function of Gallyas OD and COPA, respectively. Due to the lack of strong correlation of µ′b or ratio
of µ′b /µs with respect to Gallyas OD and COPA (see session 2.4 and supplementary figures), no multivariate
investigation was further performed.
Data availability
The datasets and analysis code generated during and/or analysed during the current study are available from the
corresponding author on reasonable request.
Received: 1 September 2021; Accepted: 3 December 2021
References
1. DeWitt, I. & Rauschecker, J. P. Wernicke’s area revisited: Parallel streams and word processing. Brain Lang. 127, 181–191 (2013).
2. Tootell, R. B. H. & Hadjikhani, N. Where is ‘Dorsal V4’ in human visual cortex? Retinotopic, topographic and functional evidence.
Cereb. Cortex 11, 298–311 (2001).
3. Tootell, R. B. H. et al. Functional analysis of human MT and related visual cortical areas using magnetic resonance imaging. J.
Neurosci. 15, 3215–3230 (1995).
4. Stüber, C. et al. Myelin and iron concentration in the human brain: A quantitative study of MRI contrast. Neuroimage 93, 95–106
(2014).
5. Laule, C. et al. Myelin water imaging of multiple sclerosis at 7 T: Correlations with histopathology. Neuroimage 40, 1575–1580
(2008).
6. Sjöbeck, M., Haglund, M. & Englund, E. Decreasing myelin density reflected increasing white matter pathology in azheimer’s
disease - A neuropathological study. Int. J. Geriatr. Psychiatry 20, 919–926 (2005).
7. Gao, X. & Chen, J. Mild traumatic brain injury results in extensive neuronal degeneration in the cerebral cortex. J. Neuropathol.
Exp. Neurol. 70, 183–191 (2011).
8. Smiley, J. F. et al. Reduced GABA neuron density in auditory cerebral cortex of subjects with major depressive disorder. J. Chem.
Neuroanat. 76, 108–121 (2016).
9. Soltanian-Zadeh, S., Sahingur, K., Blau, S., Gong, Y. & Farsiu, S. Fast and robust active neuron segmentation in two-photon calcium
imaging using spatiotemporal deep learning. Proc. Natl. Acad. Sci. U. S. A. 116, 8554–8563 (2019).
10. Pistorio, A. L., Hendry, S. H. & Wang, X. A modified technique for high-resolution staining of myelin. J. Neurosci. Methods 153,
135–146 (2006).
11. García-Cabezas, M., John, Y. J., Barbas, H. & Zikopoulos, B. Distinction of neurons, glia and endothelial cells in the cerebral cortex:
An algorithm based on cytological features. Front. Neuroanat. 10, 1–28 (2016).
12. Huang, D. et al. Optical coherence tomography. Science 254, 1178–1181 (1991).
13. van Manen, L. et al. The clinical usefulness of optical coherence tomography during cancer interventions. J. Cancer Res. Clin.
Oncol. 144, 1967–1990 (2018).
14. Yuan, W., Kut, C., Liang, W. & Li, X. Robust and fast characterization of OCT-based optical attenuation using a novel frequency-
domain algorithm for brain cancer detection. Sci. Rep. 7, 1–8 (2017).
15. Leahy, C., Radhakrishnan, H., Weiner, G., Goldberg, J. L. & Srinivasan, V. J. Mapping the 3D connectivity of the rat inner retinal
vascular network using OCT angiography. Investig. Ophthalmol. Vis. Sci. 56, 5785–5793 (2015).
Scientific Reports | (2022) 12:363 | https://doi.org/10.1038/s41598-021-04093-y 9
Vol.:(0123456789)www.nature.com/scientificreports/
16. Liu, W., Luisi, J., Liu, H., Motamedi, M. & Zhang, W. OCT-angiography for non-invasive monitoring of neuronal and vascular
structure in mouse retina: Implication for characterization of retinal neurovascular coupling. Physiol. Behav. 66, 693–698 (2018).
17. Zhang, Q. et al. Swept source OCT angiography of neovascular macular telangiectasia type. Eur. J. Opthamol. 2(35), 2285–2299
(2016).
18. Magnain, C. et al. Optical coherence tomography visualizes neurons in human entorhinal cortex. Neurophotonics 2, 015004 (2015).
19. Srinivasan, V. J., Radhakrishnan, H., Jiang, J. Y., Barry, S. & Cable, A. E. Optical coherence microscopy for deep tissue imaging of
the cerebral cortex with intrinsic contrast. Opt. Express 20, 2220 (2012).
20. Wang, H., Magnain, C., Sakadžić, S., Fischl, B. & Boas, D. A. Characterizing the optical properties of human brain tissue with high
numerical aperture optical coherence tomography. Biomed. Opt. Express 8, 5617 (2017).
21. Yang, J., Chen, I. A., Chang, S., Tang, J. & Lee, B. Improving the characterization of ex vivo human brain optical properties using
high numerical aperture optical coherence tomography by spatially constraining the confocal parameters. Neurophotonics 7, 1–16
(2020).
22. Wang, H. et al. as-PSOCT : Volumetric microscopic imaging of human brain architecture and connectivity. Neuroimage 165, 56–68
(2018).
23. Cho, H. et al. Alterations of transcriptome signatures in head trauma-related neurodegenerative disorders. Sci. Rep. 10, 1–12 (2020).
24. McKee, A. C., Stein, T. D., Kiernan, P. T. & Alvarez, V. E. The neuropathology of chronic traumatic encephalopathy. Brain Pathol.
25, 350–364 (2015).
25. Nasrabady, S. E., Rizvi, B., Goldman, J. E. & Brickman, A. M. White matter changes in Alzheimer’s disease: A focus on myelin and
oligodendrocytes. Acta Neuropathol. Commun. 6, 22 (2018).
26. Chi, H., Chang, H. Y. & Sang, T. K. Neuronal cell death mechanisms in major neurodegenerative diseases. Int. J. Mol. Sci. 19, 13
(2018).
27. Gorman, A. M. Neuronal cell death in neurodegenerative diseases: Recurring themes around protein handling: Apoptosis review
series. J. Cell. Mol. Med. 12, 2263–2280 (2008).
28. Kanazawa, I. How do neurons die in neurodegenerative diseases?. Trends Mol. Med. 7, 339–344 (2001).
29. Balaram, P., Young, N. A. & Kaas, J. H. Histological features of layers and sublayers in cortical visual areas V1 and V2 of chimpan-
zees, macaque monkeys, and humans. Eye Brain 6, 5–18 (2014).
30. Bashkatova, T. A., Bashkatov, A. N., Kochubey, V. I. & Tuchin, V. V. Light scattering properties for spherical and cylindrical parti-
cles: A simple approximation derived from Mie calculations. Saratov Fall Meet. 2000 Opt. Technol. Biophys. Med. II 4241, 247–259
(2001).
31. Magnain, C. et al. Blockface histology with optical coherence tomography: A comparison with Nissl staining. Neuroimage 84,
524–533 (2014).
32. Popescu, B. F. G. & Lucchinetti, C. F. Pathology of demyelinating diseases. Annu. Rev. Pathol. Mech. Dis. 7, 185–217 (2012).
33. Weil, M. T. et al. Loss of myelin basic protein function triggers myelin breakdown in models of demyelinating diseases. Cell Rep.
16, 314–322 (2016).
34. Wrzos, C. et al. Early loss of oligodendrocytes in human and experimental neuromyelitis optica lesions. Acta Neuropathol. 127,
523–538 (2014).
35. Papuc, E. & Rejdak, K. The role of myelin damage in Alzheimer’s disease pathology. Arch. Med. Sci. 16, 345–351 (2020).
36. Miller, D. J. et al. Prolonged myelination in human neocortical evolution. Proc. Natl. Acad. Sci. U. S. A. 109, 16480–16485 (2012).
37. Davis, K. L. et al. White matter changes in schizophrenia. Arch. Gen. Psychiatry 60, 443 (2003).
38. Höistad, M. et al. Linking white and grey matter in schizophrenia: Oligodendrocyte and neuron pathology in the prefrontal cortex.
Front. Neuroanat. 3, 1–16 (2009).
39. Schlösser, R. G. M. et al. White matter abnormalities and brain activation in schizophrenia: A combined DTI and fMRI study.
Schizophr. Res. 89, 1–11 (2007).
40. Kalashnikov, M. et al. Assessing the contribution of cell body and intracellular organelles to the backward light scattering. Opt.
Express 20, 816 (2012).
41. Magnain, C. et al. Colocalization of neurons in optical coherence microscopy and Nissl-stained histology in Brodmann’s area 32
and area 21. Brain Struct. Funct. 224, 351–362 (2019).
42. Kut, C. et al. Detection of human brain cancer infiltration ex vivo and in vivo using quantitative optical coherence tomography.
Physiol. Behav. 63, 1–18 (2014).
43. Yashin, K. S. et al. Cross-polarization optical coherence tomography for brain tumor imaging. Front. Oncol. 9, 201 (2019).
44. Macenko, M. et al. A method for normalizing histology slides for quantitative analysis. in Proceedings of the 2009 IEEE International
Symposium on Biomedical Imaging from Nano to Macro, ISBI 2009. 1107–1110. https://doi.org/10.1109/ISBI.2009.5193250 (2009).
45. Henry, F. P. et al. In vivo optical microscopy of peripheral nerve myelination with polarization sensitive-optical coherence tomog-
raphy. J. Biomed. Opt. 20, 046002 (2015).
46. Wang, H. et al. Polarization sensitive optical coherence microscopy for brain imaging. Opt. Lett. 41, 2213 (2016).
47. Dufour, P., Piché, M., De Koninck, Y. & McCarthy, N. Two-photon excitation fluorescence microscopy with a high depth of field
using an axicon. Appl. Opt. 45, 9246 (2006).
48. Sinski, J. T., Reed, G. L., Kelley, L. M. & LeFebvre, R. Extended depth of field microscopy for rapid volumetric two-photon imaging
Gabrielle. Opt. Express 7, 226–230 (2013).
49. Kun, A. et al. Characterization of amyloid-$β$ plaques and autofluorescent lipofuscin aggregates in Alzheimer’s disease brain:
A confocal microscopy approach. in Amyloid Proteins: Methods and Protocols (eds. Sigurdsson, E. M., Calero, M. & Gasset, M.).
497–512. https://doi.org/10.1007/978-1-4939-7816-8_31 (Springer, 2018).
50. Chen, C. et al. In vivo near-infrared two-photon imaging of amyloid plaques in deep brain of Alzheimer’s disease mouse model.
ACS Chem. Neurosci. 9, 3128–3136 (2018).
51. Ben Arous, J. Single myelin fiber imaging in living rodents without labeling by deep optical coherence microscopy. J. Biomed. Opt.
16, 116012 (2011).
52. Almasian, M. et al. Pilot feasibility study of in vivo intraoperative quantitative optical coherence tomography of human brain tissue
during glioma resection. J. Biophoton. 12, 1–9 (2019).
53. Magnain, C., Augustinack, J. C., Martin, R., Boas, D. A. & Fischl, B. Blockface histology with optical coherence tomography: A
comparison with nissl staining. Neuroimage 23, 1–7 (2014).
54. Kerker, M. & Matijević, E. Scattering of electromagnetic waves from concentric infinite cylinders. J. Opt. Soc. Am. 51, 506 (1961).
55. Feiner-Gracia, N. et al. Super-resolution imaging of structure, molecular composition, and stability of single oligonucleotide
polyplexes. Nano Lett. 19, 2784–2792 (2019).
56. Cregger, M., Berger, A. J. & Rimm, D. L. Immunohistochemistry and quantitative analysis of protein expression. Arch. Pathol. Lab.
Med. 130, 1026–1030 (2006).
57. Augustinack, J. C. et al. MRI parcellation of ex vivo medial temporal lobe. Neuroimage 23, 1–7 (2013).
58. Ragan, T. et al. Serial two-photon tomography for automated ex vivo mouse brain imaging. Nat. Methods 9, 255–258 (2012).
59. Chang, S. et al. Measuring myelin content and cell density in the human brain using optical coherence tomography. Conf. SPIE
11629, 31 (2021).
60. Coleman, T. F. & Li, Y. An interior trust region approach for nonlinear minimization subject to bounds. SIAM J. Optim. 6, 418–445
(1996).
Scientific Reports | (2022) 12:363 | https://doi.org/10.1038/s41598-021-04093-y 10
Vol:.(1234567890)www.nature.com/scientificreports/
61. Augustinack, J. C. et al. Detection of entorhinal layer II using tesla magnetic resonance imaging. Ann. Neurol. 57, 489–494 (2005).
62. Mohlberg, H. Broca’s region revisited: Cytoarchitecture and intersubject. Eur. PMC 341, 319–341 (1999).
63. Mourant, J. R., Fuselier, T., Boyer, J., Johnson, T. M. & Bigio, I. J. Predictions and measurements of scattering and absorption over
broad wavelength ranges in tissue phantoms. Appl. Opt. 36, 949 (1997).
64. Suárez-Solá, M. L. et al. Neurons in the white matter of the adult human neocortex. Front. Cell Neurosci. 3, 1–7 (2009).
Acknowledgements
C. Maigain thanks an advise fund provided by the Silicon Valley Community. The study was also made possible
by the resources provided by Shared Instrumentation Grants 1S10RR023401, 1S10RR019307, and 1S10RR023043.
Author contributions
S.C., D.A.B., and H.W. conceived and designed the research; C.M., J.A. and H.W. performed data acquisition;
S.C. analyzed the data and constructed the mathematical models with input from D.V. and D.G.; D.V., J.Y, A.C.,
S.K., C.M., J.A., B.F., D.G., D.A.B. and H.W. contributed to data analysis and interpretation; S.C., D.V., and H.W.
contributed to manuscript preparation.
Funding
This work was supported in part by the BRAIN Initiative Cell Census Network grant U01MH117023, the
National Institute for Biomedical Imaging and Bioengineering (P41EB015896, 1R01EB02328, 1R01EB006758,
R21EB018907, R01EB019956, P41EB030006), the National Institute on Aging (1R56AG064027, 1R01AG064027,
5R01AG008122, R01AG016495), the National Institute of Mental Health (R01 MH123195, R01 MH121885),
the National Institute for Neurological Disorders and Stroke (R01NS0525851, R21NS072652, R01NS070963,
R01NS083534, 5U01NS086625, 5U24NS10059103, R01NS105820), a NIH career development award
R00EB023993 to HW and grant number 2019-189101 from the Chan Zuckerberg Initiative DAF. Additional
support was provided by the NIH Blueprint for Neuroscience Research (5U01-MH093765), part of the multi-
institutional Human Connectome Project.
Competing interests
Bruce Fischl has a financial interest in CorticoMetrics, a company whose medical pursuits focus on brain imag-
ing and measurement technologies. BF’s interests were reviewed and are managed by Massachusetts General
Hospital and Partners HealthCare in accordance with their conflict of interest policies.
Additional information
Supplementary Information The online version contains supplementary material available at https://doi.org/
10.1038/s41598-021-04093-y.
Correspondence and requests for materials should be addressed to H.W.
Reprints and permissions information is available at www.nature.com/reprints.
Publisher’s note Springer Nature remains neutral with regard to jurisdictional claims in published maps and
institutional affiliations.
Open Access This article is licensed under a Creative Commons Attribution 4.0 International
License, which permits use, sharing, adaptation, distribution and reproduction in any medium or
format, as long as you give appropriate credit to the original author(s) and the source, provide a link to the
Creative Commons licence, and indicate if changes were made. The images or other third party material in this
article are included in the article’s Creative Commons licence, unless indicated otherwise in a credit line to the
material. If material is not included in the article’s Creative Commons licence and your intended use is not
permitted by statutory regulation or exceeds the permitted use, you will need to obtain permission directly from
the copyright holder. To view a copy of this licence, visit http://creativecommons.org/licenses/by/4.0/.
© The Author(s) 2022
Scientific Reports | (2022) 12:363 | https://doi.org/10.1038/s41598-021-04093-y 11
Vol.:(0123456789)You can also read