Sea Turtle Tagging in the Mariana Islands Training and Testing (MITT) Study Area
←
→
Page content transcription
If your browser does not render page correctly, please read the page content below
Sea Turtle Tagging in the
                       Mariana Islands Training and Testing
                       (MITT) Study Area
                       Programmatic Report
                       May 2019

             PREPARED FOR THE U.S. PACIFIC FLEET ENVIRONMENTAL READINESS OFFICE
                       Under Interagency Agreement NMFS-PIC-17-010 / 18-008
                         Conducted under NOAA ESA 10a1A 17022 / 15661

___________________________
PIFSC Data Report DR-19-033
Issued 04 September 2019
https://doi.org/10.25923/v0hh-8663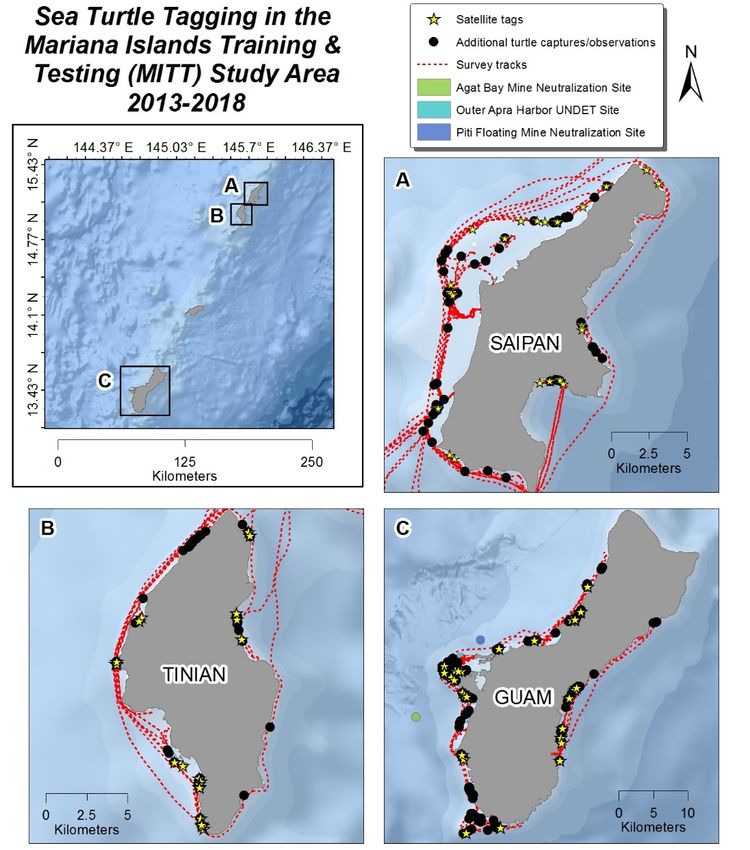
Sea Turtle Tagging in the
Mariana Islands Training and Testing (MITT)
Study Area
Programmatic Report
May 2019

Summer L. Martin, Ph.D.
Alexander R. Gaos, Ph.D.
T. Todd Jones, Ph.D.

Marine Turtle Biology and Assessment Program
Protected Species Division
Pacific Islands Fisheries Science Center
NOAA Fisheries

U.S. DEPARTMENT OF COMMERCE
National Oceanic and Atmospheric Administration

National Marine Fisheries Service
Pacific Islands Fisheries Science Center
Recommended document citation

Martin SL, Gaos AR, Jones TT. 2019. Sea turtle tagging in the Mariana Islands Training and
Testing (MITT) study area. Annual Report prepared for the U.S. Pacific Fleet Environmental
Readiness Office, Pearl Harbor, Hawaii by NOAA Fisheries, Marine Turtle Biology and
Assessment Group, Protected Species Division, Pacific Islands Fisheries Science Center,
Honolulu, Hawaii under Interagency Agreement NMFS-PIC-17-010. 36 p. PIFSC Data Report
DR-19-033.

Cover: Photo courtesy of Pacific Islands Fisheries Science Center, Protected Species Division.

                                               iv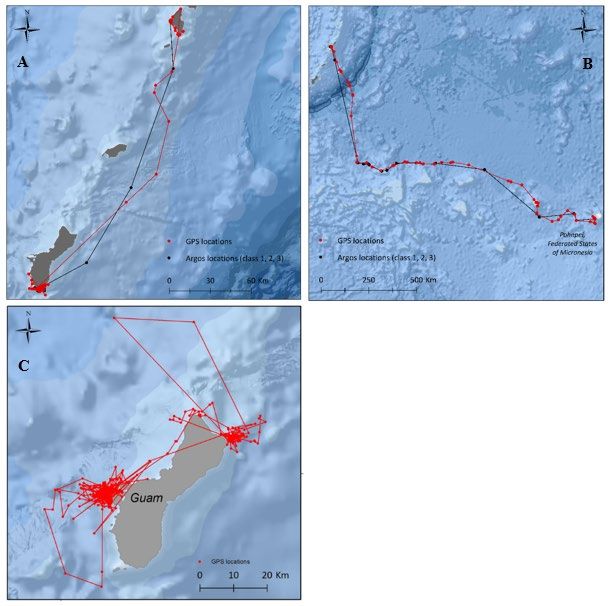
Table of Contents

Table of Contents ............................................................................................................................ v
List of Acronyms ........................................................................................................................... vi
Background ..................................................................................................................................... 1
Guiding Questions from the FY13-15 Monitoring Plan ................................................................. 1
Summary of Tasks .......................................................................................................................... 2
Progress on Field Research ............................................................................................................. 2
Progress on Data Analysis .............................................................................................................. 3
Progress on Data Availability ......................................................................................................... 4
Methods........................................................................................................................................... 4
   In-water surveys and capture....................................................................................................... 4
   Movement tracks, home range estimates, and dive behavior ...................................................... 5
   Sample archiving and analysis .................................................................................................... 7
Results and Discussion ................................................................................................................... 8
   In-water surveys and turtle observation, capture and processing................................................ 8
   Satellite tag deployment, tag longevity, horizontal movements and home range ..................... 13
   Dive behavior and vertical movement ...................................................................................... 21
Progress towards Summary of Tasks ............................................................................................ 25
Progress towards Guiding Questions from the FY13–15 Monitoring Plan .................................. 25
Activities Planned for 2019 .......................................................................................................... 26
Acknowledgements ....................................................................................................................... 26
References ..................................................................................................................................... 28

                                                                         v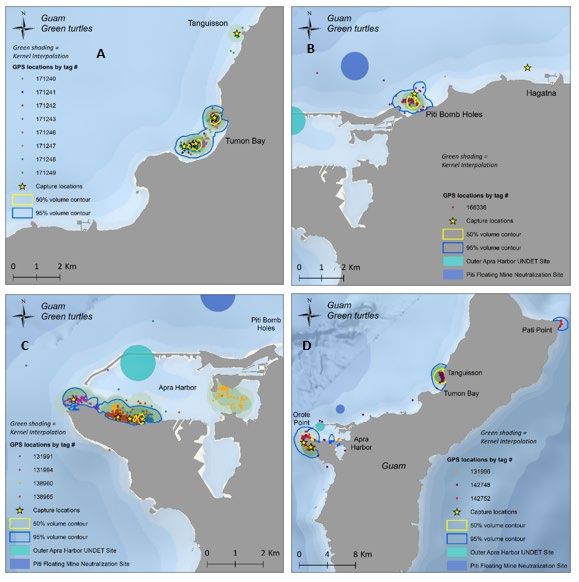
List of Acronyms

BO – Biological Opinion
C – Celsius
CLS – Collection and Location by Satellite
CM – Centimeter
CNMI – Commonwealth of the Northern Mariana Islands
DAWR – Division of Aquatic and Wildlife Resources
DLNR – Department of Lands and Natural Resources
DNA – Deoxyribonucleic Acid
ESA – Endangered Species Act
FY – Fiscal Year
GIS – Geographic Information Systems
GPS – Global Positioning System
ICMP – Integrated Comprehensive Monitoring Program
ID - Identification
KIWB – Kernel Interpolation
KM – Kilometer
MIRCMP – Mariana Islands Range Complex Monitoring Plan
M – Meter
MITT – Mariana Islands Training and Testing
MMPA – Marine Mammal Protection Act
MTBAP – Marine Turtle Biology and Assessment Program
NIST – National Institute for Standards and Technology
NMFS – National Marine Fisheries Service
NOAA – National Oceanic and Atmospheric Administration
PIFSC – Pacific Islands Fisheries Science Center
PIT – Passive Integrated Transponder
PSD – Protected Species Division
SCL – Straight Carapace Length
SD – Standard Deviation
USFWS – United States Fish and Wildlife Service

                                              vi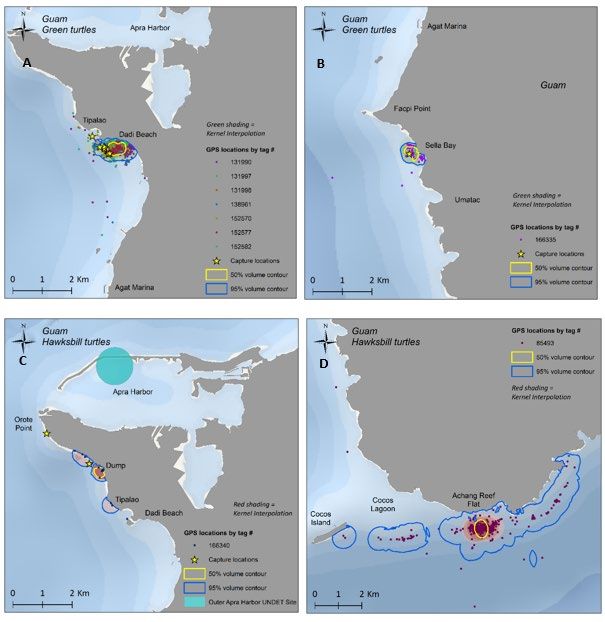
Background

The U.S. Navy developed monitoring questions for the Mariana Islands Training and Testing
(MITT) study area under the Mariana Islands Range Complex Monitoring Plan (MIRCMP) as
required under the Marine Mammal Protection Act (MMPA) of 1972 and the Endangered
Species Act (ESA) of 1973. The MITT monitoring questions outline the scope of monitoring the
Navy will conduct to understand marine mammal and sea turtle distribution and, ultimately,
impacts from Navy training and testing. The monitoring and analyses outlined in this annual
report support the ESA Biological Opinion (BO) received for the MITT in 2015. The overall
objective of the MIRCMP is to collect field data that will enable the Navy and the National
Oceanic and Atmospheric Administration’s (NOAA) National Marine Fisheries Service (NMFS)
to better understand the distribution and habitat use of sea turtles in Guam and the
Commonwealth of the Northern Mariana Islands (CNMI) (collectively referred to as the Mariana
Archipelago). Data generated via implementation of the MIRCMP will be integrated into the
Navy-wide Integrated Comprehensive Monitoring Program (ICMP). Of the five species of sea
turtles associated with the MITT, this annual report provides data on the habitat and movements
of two species; the green (Chelonia mydas) and hawksbill (Eretmochelys imbricata) turtle.
Individuals of both species were tagged and satellite-tracked in the nearshore waters of Saipan,
Tinian, and Guam by staff from NOAA Pacific Islands Fisheries Science Center’s Marine Turtle
Biology and Assessment Program (PIFSC MTBAP). Juvenile and adult life-stages were targeted
for tagging and satellite tracking, with juveniles making up the majority of turtles observed,
captured and equipped with electronic tags. The other three species of sea turtle present in the
North Pacific are not generally associated with neritic nearshore waters and were not observed
during monitoring activities.

To date, PIFSC MTBAP has spent a total of 41 field days conducting sea turtle surveys around
the Mariana Archipelago. These surveys have been conducted during a total of eight field
expeditions to Guam, five expeditions to Saipan and four expeditions to Tinian. During that time
researchers have observed a total of 438 turtles, 139 of which were captured and 94 of which
were equipped with satellite tags. The expeditions have included meetings and collaborative
fieldwork with numerous local partners, including representatives from Guam Department of
Agriculture Division of Aquatic and Wildlife Resources (DAWR), CNMI Department of Lands
and Natural Resources (DLNR), USFWS, University of Guam/SeaGrant, Naval Base Guam, and
the U.S. Pacific Fleet Environmental Readiness Office.

                   Guiding Questions from the FY13-15 Monitoring Plan

   •   Are there locations of greater cetacean and/or sea turtle concentration around Guam,
       Saipan, and Tinian?

   •   What is the occurrence and habitat use of sea turtles in the MITT study area?

   •   What is the exposure of cetaceans and sea turtles to explosives and/or sonar in the MITT
       study area?

                                               1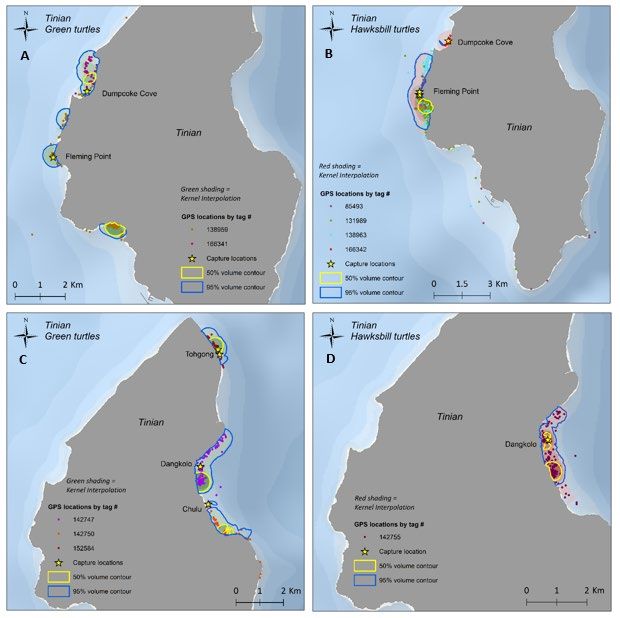
Summary of Tasks

   1. Capture and tag sea turtles in the MITT study area, and deploy biotelemetry devices
   2. Process and analyze biotelemetry data and other survey data
   3. Prepare annual reports

                                    Progress on Field Research

The most recent field research was conducted during August 1–12, 2018. Drs. T. Todd Jones,
Summer Martin, Camryn Allen and Alexander Gaos of the PIFSC MTBAP, as well as Julie
Rivers of U.S. Pacific Fleet, collaborated with local partners to conduct marine turtle surveys and
in-water captures of green and hawksbill turtles. Captured turtles were weighed, measured,
biopsied, tagged [i.e., flipper, passive integrated transponder (PIT), satellite tracking] in an effort
to expand our knowledge of the population demographics, population structure, and fine-scale
habitat use of turtles in the area. Blood samples were also collected for two studies: 1) hormone
analysis to determine population sex ratios, and 2) metabolite analysis to determine
nutritional/feeding state. The aforementioned activities were permitted under NMFS ESA10a1A
Take permit #17022 and NMFS IACUC SWPI2013-05R. Additionally, in Guam, the Division of
Aquatic and Wildlife Resources (Guam DAWR) biologists were provided with hands-on
refresher training by MTBAP staff. In both Guam and CNMI, local partners continue to be
engaged in this collaborative research effort. Many of these activities are part of a larger
collaborative effort with PIFSC MTBAP, Guam DAWR, CNMI DLNR, Naval Base Guam, and
the U.S. Pacific Fleet Environmental Readiness Office.

The most recent field expedition consisted of 12 days on Guam and Saipan, including 5 days of
travel, 5 days of in-water surveys and turtle captures, and 2 days during which inclement weather
conditions prohibited operations. During most of the year both Guam and Saipan experience
strong easterly trade winds, which create hazardous boating and monitoring conditions. These
conditions have previously made it impossible to survey much of the eastern coasts of these
islands. MTBAP staff programmed the most recent survey trip to coincide with months when
easterly trade winds occasionally abate (August and September), with the goal of conducting
research in these hard-to-study areas. The team was rewarded for its planning with successful
monitoring efforts carried out along the northeast coast of Saipan (e.g., Tank Beach and Marine
Beach), as well as both the eastern (e.g., Talofofo Bay, Pago Bay, Paget Point) and southern
(e.g., Cocos Island, Cocos Lagoon, Achang Reef Flat) coasts of Guam. None of these areas have
previously been surveyed, thus encountering turtles and deploying satellite tags has provided
novel opportunities to collect important information in these data deficient areas. Surveying and
tagging in multiple locations around the perimeters of Guam, Saipan, and Tinian is important for
understanding sea turtle occurrence, distribution, relative abundance, and habitat use throughout
the MITT study area. In Saipan, all captured turtles were processed and satellite tagged onboard
the research boat. In Guam, in addition to a primary research boat, we were able to mobilize
collaborators from DAWR to deploy a second boat. We then set up terrestrial processing centers,
which were staged out of Achang Bay (southern coast) and Talofofo Bay (eastern coast), and
DAWR transferred captured turtles from the primary research boat to the land-based processing
centers, thus allowing the primary boat to focus on in-water capture of turtles. Turtles with
straight carapace length (SCL) > 45 cm and good body condition were equipped with Wildlife

                                                  2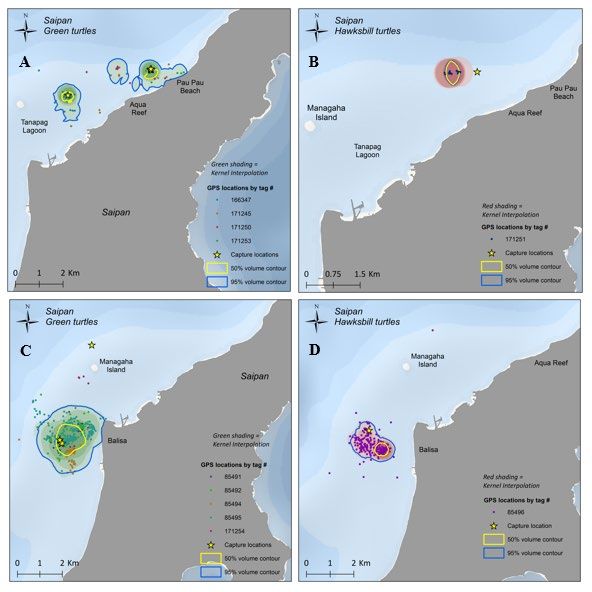
Computers SPLASH 297A satellite tags, which have both Fastloc-GPS and Argos location
capabilities, as well as temperature and depth sensors. Turtles with SCL between 35 and 45 cm
and good body condition were equipped with Wildlife Computers SPOT-311A satellite tags,
which have Argos location capabilities and temperature sensors.

Over the 5 field days, the team observed a total of 66 turtles, 16 of which were captured, 11 of
which were outfitted with Wildlife Computers SPLASH satellite transmitters and two of which
were outfitted with SPOT-311A satellite transmitters.

                                    Progress on Data Analysis

Under Interagency Agreement NMFS-PIC-16-008 through NMFS-PIC-18-008 between NOAA
and the Navy, data analysis and collection have been ongoing from 2013 through 2018. The
PIFSC MTBAP project staff currently continue to process satellite tracking data as they arrive
from Collection and Location by Satellite America (CLS America), which collects and stores the
Argos satellite information. These data are being organized and analyzed to understand spatial
distribution, depth use and temperature profiles for habitat used by tagged turtles.

The findings presented in this report provide robust and essential biogeographical context for
understanding the abundance, spatial distribution and habitat use of sea turtles in the MITT, as
well as preliminary data on the abundance and distribution of other large marine vertebrates in
the region. Furthermore, these data and analyses have helped to inform the proposed Critical
Habitat for the Endangered Central West Pacific distinct population segment of green turtle
(NMFS and USFWS 2015). They have also informed incidental take statements and impact
assessments for NOAA Fisheries ESA Section 7 and Biological Opinion needs.

In January of 2016, the first manuscript derived from this Navy/NOAA Interagency Agreement,
“Five Decades of Marine Megafauna Surveys from Micronesia, ” was published (Martin et al.
2016, Frontiers in Marine Science, doi.org/10.3389/fmars.2015.00116). The analysis suggested a
substantial but isolated increase in sea turtles over the last 5 decades in Guam. Specifically, there
was an observed island-wide trend in turtle counts from semi-monthly aerial surveys (surveys
conducted by Guam DAWR). The mean annual population growth rate of turtles (primarily
green sea turtles) was 8.0% (SD = 5.7%) since 1963 and 9.3% (SD = 3.5%) since 1989.

PIFSC MTBAP staff are currently working on the second major manuscript associated with the
program and have set a target publication date for early 2020. The manuscript, tentatively titled,
“Reef-dwelling turtles of the Mariana Archipelago: fine-scale habitat use revealed by in-water
surveys and GPS telemetry,” will provide further analysis of the boat-based surveys and satellite
telemetry efforts presented in this study, including in-depth analyses of horizontal, vertical,
temporal, and temperature-based habit use. The research will encompass the largest sample size
for satellite tracking of juvenile green and hawksbill turtles included in a single study available
to date in the scientific literature.

A third manuscript, with a 2021 target date, will focus on producing abundance estimates by
integrating the survey data from this study with small boat cetacean surveys (Hill et al. 2016) and
presence/absence data collected during underwater towed-diver coral reef surveys (NOAA data).
These survey data and analyses document the widespread presence of turtles throughout the

                                                  3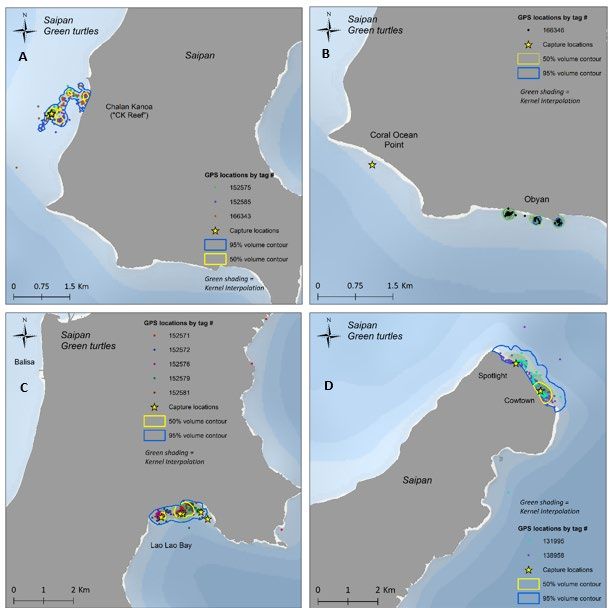
Mariana Archipelago, with >1,700 observations. The synthesis of results from in-water surveys,
along with data from the first in-water satellite transmitter deployments in this island chain, will
advance our understanding of the distribution, relative abundance, and habitat use patterns of the
juvenile-dominated green and hawksbill turtle foraging populations throughout the Mariana
Archipelago.

                                  Progress on Data Availability

The supplementary materials list all data available to date. The listed files include the following:

          1) all boat survey tracks from the 2013–2018 field seasons throughout the MITT
             study area;
          2) all metadata on turtle observations, captures, and satellite tag deployments in
             2013–2018 (date, location, species, numbers of all tags applied, turtle length
             measurement, etc.);
          3) all metadata on cetacean observations for 2016–2018 (date, location, species);
          4) time-at-depth histogram data from satellite tags deployed in 2014–2018 (raw data
             are provided as the proportion of time spent at binned depths for designated
             periods of time);
          5) time-at-temperature histogram data from satellite tags deployed in 2014–2018 (raw
             data are provided as the proportion of time spent at binned temperatures for
             designated periods of time);
          6) raw Argos location data from Wildlife Computers SPLASH and SPOT Satellite
             tags deployed in 2013–2018 (with a table for interpretation of Argos derived
             locations); and
          7) raw GPS location data from Wildlife Computers SPLASH Satellite tags (with a
             table for interpretation of GPS locations) deployed in 2013–2018.

The PIFSC MTBAP plans to make the data publicly accessible through the Animal Telemetry
Network, which will satisfy Public Access to Research Results (PARR) requirements for both
NOAA and the Navy.

                                             Methods

In-water surveys and capture

Small boat surveys were conducted in the nearshore and coastal waters of Guam, Saipan, and
Tinian (Figure 1). During surveys, the boat team recorded all observations of turtles seen by both
the in-water snorkel team and the boat team, along with approximate GPS coordinates. Observed
turtles were visually assessed as to the feasibility of capture (e.g., turtle behavior and distance
from diver). Turtles of all size classes were targeted for capture, either by hand capture while
snorkeling or after diving from a slow-moving boat. Hand captures involved free-diving (2–25
m) to capture turtles resting/foraging in the water column or on the substrate. Captured turtles
were immediately brought to the surface, lifted into the boat and processed on deck or after being
brought to shore and placed in turtle holding bins. All research was authorized under the

                                                 4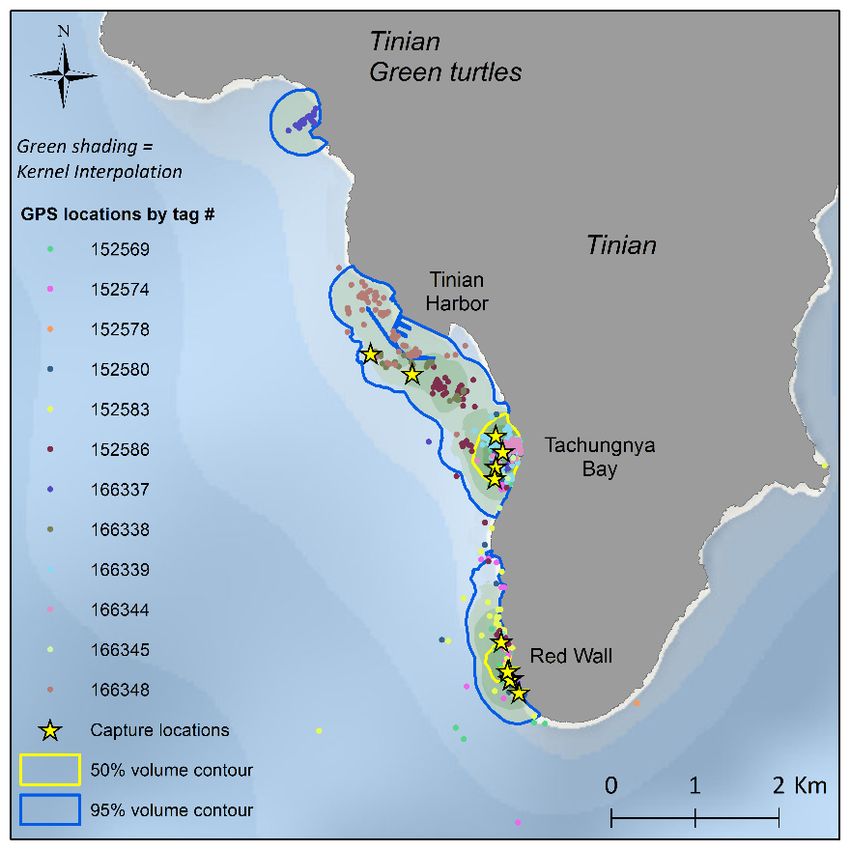
following permits: NMFS ESA10a1A 17022 / 1556 / 15661, USFWS Recovery Permit TE-
72088A-1, IACUC Protocols NMFS SWPI 2013-05, and Guam Department of Agriculture
Special Permit for Scientific Research SP2013-004 and SC-MPA-17-010.

All turtles were tagged with two metal (Inconel) self-piercing sea turtle tags or ‘flipper tags’
(Style 681, National Band and Tag Company) using the standard technique described in the
Marine Turtle Specialist Group Manual on Research Techniques (Eckert et al. 1999) and with
two PIT tags – small (14-mm length × 2-mm diameter) electromagnetically-coded glass-encased
“microchips” – Destron Tx 1406L. All Inconel and PIT tags had unique identification numbers.
The Inconel flipper tags were attached to the trailing edge of a fore flipper and the PIT tags were
injected subcutaneously into the rear flippers. Skin samples were obtained for DNA and stable
isotope analysis (Dutton et al. 1996). Straight carapace length (SCL) and turtle mass were
measured, and turtles of appropriate SCL (see Jones et al. 2013) were outfitted with a satellite
tag.

 The majority of satellite tags attached to turtles were the SPLASH10-F series Platform
Transmitting Terminals designed by Wildlife Computers. These are data-archiving tags that
transmit via the Argos satellite system. In addition to Argos-derived location data, the tags also
upload sensor data that include GPS derived locations, depth, temperature, light level, and
wet/dry (based on conductivity). For this study we used SPLASH10-F tags with a frontal area of
approximately 12 cm2; however, some size variation of the SPLASH tags is due to the
differences in the battery capacity (and hence battery life) of the various versions, with the
smaller tags allowing us to apply them to smaller juvenile turtles (minimum 45-cm SCL).
Wildlife Computers SPOT-311A tags were also deployed to track turtles of even younger life-
stages (i.e., 35 cm–45 cm SCL). In contrast to the SPLASH tags, SPOT tags are much smaller
(frontal area = 4.79 cm2) and only have the capability of collecting data on Argos locations and
water temperature. Captured turtles with SCL < 35 cm or that had poor body condition or
physical abnormalities were not outfitted with a satellite tag.

 Satellite tag attachment followed the drag recommendations of Jones et al. (2011, 2013) and the
attachment methods as described in Jones et al. 2018. In short, the attachment area on the
carapace was lightly sanded to remove algae and cleaned with denatured ethanol. A 0.75-cm
layer of a two-part epoxy (Powers T308 or Superbond) was used to affix the tag to the carapace,
and a second putty-type epoxy (J.B. WaterWeld) was form-molded around the tag to protect it
from damage by reef and rock ledges during the course of normal turtle behavior. This tag
attachment technique is widely used and works well with reef-dwelling hawksbill or green
turtles. All satellite tags were subsequently covered with a layer of anti-fouling paint (Interlux
Ulta Micro Extra or Micron66) to inhibit the attachment of algae and other growth that can cover
sensors and interfere with tag operation.

Movement tracks, home range estimates, and dive behavior

GPS locations, dive depth, dive duration, and temperature data were obtained in raw form over
the Argos system, and processed to produce data ready for analysis. For turtles equipped with
SPLASH tags, two turtle movement tracks were created, one using all available Argos locations
and another using all GPS locations. Only the former track was created for turtles equipped with
SPOT tags. For calculating migration distances and timing of movements, we used the difference

                                                 5
in time and distance of path between (i) the last GPS location point (Argos location point for
SPOT tags) of a turtle before it began its long-distance movement out of an area and (ii) the first
GPS location point (Argos location point for SPOT tags) associated with its arrival at the new
location.
Home range estimates were generated using GPS locations for the SPLASH tags due to the
increased accuracy of these location points (over Argos). However, we also generated home
range estimates for turtles equipped with SPOT tags using Argos locations, omitting the less
precise and invalid Argos location classes 0 and Z, respectively (Argos 2008). Home ranges and
the associated 50% and 95% density volume contours were generated using kernel interpolation
with barriers (KIWB). The KIWB method was selected to calculate home range over traditional
kernel density estimation (KDE) due to the ability of KIWB to account for land barriers, which is
particularly relevant for nearshore marine species as topological features can inadvertently be
incorporated into the analysis in traditional KDE analyses (Sprogis et al. 2016). All tracks and
density estimates were performed in ArcGIS (ESRI 2012). The data analysis remains preliminary
as some of the satellite tags are still transmitting. Final analyses will include the full range of
GPS data for additional home range analysis and KIWB estimates.
Further details on the KIWB estimates in ArcGIS are provided here. The KIWB tool is available
within the ‘Geostatistical Analyst’ toolbox section of ArcGIS. Prior to performing a KIWB
estimate on a set of GPS points, we grouped the data by species and tagging location and filtered
out (i) all points that occurred within the first two weeks of tag deployment (to remove erratic
behavior and displacement from capture), (ii) all points erroneously appearing on land, and (iii)
all points suggesting a swim speed greater than 5 km per hour. We generated a point density
surface with a cell size of 10 m as a necessary intermediate step. Then we used the point density
surface and an output cell size of 10 m to construct the KIWB estimate. Using the KIWB
estimate, we produced 50% and 95% volume contour polygons to describe the core area and
home range, respectively, for turtles pooled by deployment location. We calculated the area of
each volume contour polygon (km2) to quantify core area and home range and allow for
qualitative comparisons across sites.
Temperature data and depth data were collected every 10 seconds and archived by the
corresponding tags; these data were then binned across 6-hour periods and sent via satellite
transmissions with the Argos and GPS (if applicable) location data when the turtle surfaced. Bins
are user-defined and give insights into different aspects associated with dive behavior, including:
Temperature: the proportion of dives spent at each temperature bin.
Depth: the proportion of overall dive time spent within each depth bin.
Max dive depth: the maximum depth bin reached for each dive.
Dive duration: the time duration bin of each dive.
6The temperature, depth, maximum dive depth, and dive duration bins were programmed as
follows:
Temperature:
(in degrees Celsius) 19, 21, 23, 24, 25, 26, 27, 28, 29, 30, 31, 33, 35, > 35
Depth:
(in meters) 0, 2, 5, 10, 15, 20, 25, 30, 40, 50, 60, 70, 100, > 100
Max Dive Depth:
(in meters) 4, 6, 8, 10, 14, 18, 24, 30, 40, 60, 80, > 80
Dive Duration (2013–2017):
(in minutes) 1, 2, 3, 4, 5, 10, 15, 20, 25, 30, 40, 50, 60, > 60
In previous years we have recorded dive durations that lasted longer than the maximum bin (see
previous reports), so for 2018 we adjusted the dive duration bins as follows: 1, 5, 10, 20, 30, 40,
50, 60, 75, 90, 105, 120, 150, > 150 (in minutes). The total time a turtle was in a depth,
temperature, or duration bin was averaged, and the data were represented in a histogram
providing an average of averages of the life of a tag (transmission days) and across turtles.
Several tags deployed at the start of the project (green turtles n = 4, hawksbill turtles n = 2) had
variable depth bin programs and these data were included when feasible, but leading to some
discrepancy in the sample sizes available for dive data analysis. The data were separated by
species and we also evaluated potential differences between diurnal and nocturnal time periods.
Sample archiving and analysis
Tissue samples collected for DNA, stable isotope analysis (SIA), and health assessment were
sent to analytical laboratory collaborators within NOAA and the National Institute for Standards
and Technology (NIST):
Genetic and Stable Isotope analysis NOAA, NMFS, Southwest Fisheries Science Center
8901 La Jolla Shores Drive
La Jolla, CA 92037
Biological and Environmental Monitoring and Archival of Sea Turtle Tissues
National Institute of Standards and Technology
Hollings Marine Laboratory
331 Fort Johnson Road
Charleston, SC 29412
7Results and Discussion
In-water surveys and turtle observation, capture and processing
The following is a synopsis of surveys, captures, and analyses between 2013 and 2018. The
survey tracks, satellite tags deployed and additional turtles observed or captured (i.e., not
equipped with satellite tags) by location for the field seasons are shown in Figure 1. A total of 41
days of boat-based snorkel survey effort were conducted; 21 days in Guam, 12 days in Saipan,
and 8 days in Tinian (Table 1, Appendix Tables A2-A6).
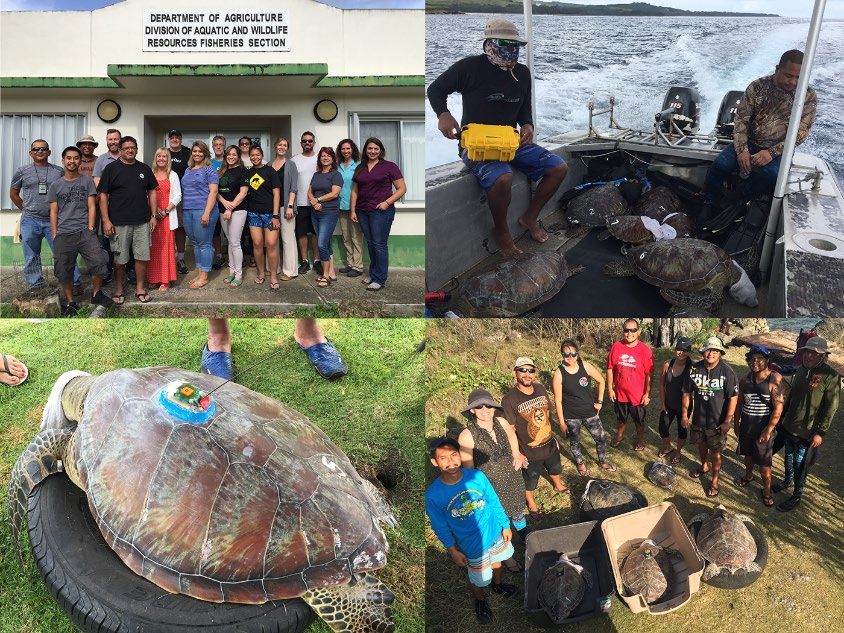
Figure 1. Marine turtle surveys, satellite tag deployment locations and turtle observations/captures
in the Mariana Islands Training and Testing (MITT) study area. Red lines on each map are small-
boat GPS tracks from sea turtle surveys conducted in the nearshore waters of Saipan, Tinian, and
Guam in 2013–2018. Yellow stars indicate locations of satellite tag deployments on green and
hawksbill turtles captured during surveys. Black circles indicate locations where additional turtles
were observed/captured.
8Table 1. Summary of boat-based snorkel surveys and turtle captures from 2013-2018. Data columns
from left to right include: survey dates, site locations, turtle observations (number of individuals),
captures, satellite tag deployments, and cetacean observations (number of individuals). CM = green
turtle (Chelonia mydas); EI = hawksbill turtle (Eretmochelys imbricata); UN = unknown turtle
species (either green or hawksbill turtle). Cetacean observations were of spinner dolphins (Stenella
longirostris) or unknown species.
9A total of 438 turtles were encountered during the 2013–2018 surveys (Table 1). Of those
encounters, 299 turtles were observed but not captured (54 Saipan, 47 Tinian, 198 Guam), 45
turtles were captured but not outfitted with a satellite tag (8 Saipan, 18 Tinian, 19 Guam) due to
small size, inadequate body condition (e.g., emaciation or a missing limb) or study design (e.g.,
geographic distribution of satellite tags across sites), and 94 turtles were captured and outfitted
with satellite tags (30 Saipan, 24 Tinian, 40 Guam) (Table 1). Of the 94 turtles outfitted with
satellite tags, 84 were equipped with SPLASH tags and 10 were equipped with SPOT tags.
Recaptures included two green turtles in Saipan in 2013 (60 cm and 63 cm), which were tagged
by a previous in-water project (Summers et al. 2017), and a 56-cm hawksbill in Guam in 2017
which had been tagged one year prior in 2016 by this project when it was 53 cm. Of the 299 non-
capture observations, 70.6% were identified as green turtles, 5.0% as hawksbill turtles and 24.4%
as “unknown” species (but either green or hawksbill turtles) (Table 1). Of the 45 turtles captured
but released without a SPLASH or SPOT tag, 86.7% were green turtles and 12.8% were
hawksbill turtles (Table 1). For the 94 satellite tags, 87.2% were deployed on green turtles and
12.8% on hawksbill turtles (Tables 1 to 4). Three of the tags on green turtles failed within 2
weeks of deployment and these tags were not included in our analyses. Table 1 provides a
breakdown of observations, captures, and satellite tags by species and location for each year.
Table 2. Saipan: summary of 2013–2018 satellite tags by deployment location, turtle size (SCL), tag
model, and tag life as transmission days. Yellow highlights tags that were still transmitting data
(“active”) on December 18, 2018.
10Details on dates, locations, and species of all satellite tag deployments, turtle captures, and turtle
observations are provided in Tables 2 to 4, Appendix Tables A1–A5, and as supplementary files.
In 2016–2018, cetacean observations were also recorded during surveys and transit periods;
sightings details are provided in Appendix Table A6. For all captured and tagged turtles,
measurements and tag identification numbers are also provided in Tables 2 to 4 and Appendix
Tables A1-A5. Captured green turtles ranged in straight carapace length from 34.4 cm to 84.1 cm
(mean = 53.4, SD = 9.1 cm, n = 121) and in mass from 6.4 kg to 76.2 kg (mean = 22.0, SD =
12.6 kg, n = 121). Captured hawksbills ranged in straight carapace length from 34.4 cm to 72.3
cm (mean = 50.4, SD = 11.0 cm, n = 18) and in mass from 4.4 kg to 48.9 kg (mean = 18.2, SD =
12.5 kg, n = 18). Two large captured green turtles were determined to be male based on tail
length. All other captured turtles were sub-adults for which sex could not be determined using
visual observation and morphometric techniques.
The size distributions of green and hawksbill turtles captured in this study are typical for turtles
throughout the Mariana Archipelago. From an analysis of more than 500 in-water captures from
2006 to 2014, Summers et al. (2017) suggest that turtles recruit to the nearshore waters of the
Mariana Islands around 34 cm SCL to 36 cm SCL and depart to adult foraging and nesting
grounds around 78-81 cm SCL, remaining in the nearshore waters for an estimated 17 years (13–
28 years: 95% confidence interval) between recruitment and maturity. Except for the two adult
males, the turtles captured in this study appear to mostly be juveniles and sub-adults residing in
developmental foraging grounds.
Table 3. Tinian: summary of 2013–2018 satellite tags by deployment location, turtle size (SCL), tag
model, and tag life as transmission days. Yellow highlights tags that were still transmitting data
(“active”) on December 18, 2018.
11Table 4. Guam: summary of 2013-2018 satellite tags by deployment location, turtle size (SCL), tag model, and tag life
as transmission days. Yellow highlights tags that were still transmitting data (“active”) on December 18, 2018.
12Satellite tag deployment, tag longevity, horizontal movements and home range
The KIWB estimates and volume contours in Figures 2–7 elucidate the general habitat use, home
range (95% volume contour), and core area (50% volume contour) for the majority of turtles
tagged in each location based on their horizontal movements. Of the 94 satellite devices
deployed, three were not included in this analysis due to lack of sufficient data, either from
immediate failure of the tag or less than two weeks of data collected from the deployment date.
The 10 SPOT tags deployed on turtles are also not included here as we continue to develop the
necessary data processing code, but will be incorporated into future reports. Maps include data
generated through 1/1/18 and do not include results of tags deployed after this date, most of
which are currently still active and will be included in future reports. Details on the number,
species, and carapace lengths of turtles tagged at each site are provided in Tables 2–4, along with
the longevity (i.e., transmission days), Argos IDs, and current status (e.g., active) of the tags.
Figure 2. Habitat use maps for green and hawksbill turtles tagged in western Saipan (sites: Pau
Beach, Aqua Reef, Tanapag Lagoon, Outer Mañagaha Island and Balisa). GPS location data were
analyzed using a Kernel Interpolation with Barriers method. Darker shades of green (green turtles)
or red (hawksbill turtles) indicate higher density of GPS location points, with the 50% (core area)
and 95% (home range) volume contours outlined in yellow and blue, respectively. For each map,
Table 2 provides additional details on individual tag deployments.
13Figure 3. Habitat use maps for green and hawksbill turtles tagged in southern, eastern, and
northern Saipan (sites: Chalan Kanoa Reef, Coral Ocean Point, Lao Bay, Cowtown, and Spotlight).
GPS location data were analyzed using a Kernel Interpolation with Barriers method. Darker
shades of green (green turtles) indicate higher density of GPS location points, with the 50% (core
area) and 95% (home range) volume contours outlined in yellow and blue, respectively. For each
map, Table 2 provides additional details on individual tag deployments.
14Figure 4. Habitat use maps for green and hawksbill turtles tagged in northwest and northeast
Tinian (sites: Dumpcoke Cove, Fleming Point, Chulu, Dangkolo, and Tohgong). GPS location data
were analyzed using a Kernel Interpolation with Barriers method. Darker shades of green (green
turtles) or red (hawksbill turtles) indicate higher density of GPS location points, with the 50% (core
area) and 95% (home range) volume contours outlined in yellow and blue, respectively. For each
map, Table 3 provides additional details on individual tag deployments.
15Figure 5. Habitat use map for green turtles tagged in southern Tinian (sites: Red Wall, Tachungnya
Bay, Tinian Harbor). GPS location data were analyzed using a Kernel Interpolation with Barriers
method. Darker shades of green indicate higher density of GPS location points, with the 50% (core
area) and 95% (home range) volume contours outlined in yellow and blue, respectively. For each
map, Table 2 provides additional details on individual tag deployments.
Tag longevity, calculated from 84 tags that were no longer transmitting a signal as of December
18th, 2018, was similar across islands. For green turtles, tags transmitted data for an average of
179 days on Saipan (SD = 151, n = 24 tags), 162 days on Tinian (SD = 77, n = 17 tags), and 163
days on Guam (SD = 81, n = 31 tags). For hawksbill turtles, tag life was 466 days on Saipan (sd
= 698, n = 3 tags), 572 days on Tinian (SD = 321, n = 6 tags) and 565 days on Guam (SD = 505,
n = 2 tags). For the three islands combined, tags lasted an average of 166 days (SD = 108, n = 73
tags) on green turtles and 542 days (SD = 420, n = 11) on hawksbill turtles. Maximum tag life
was 721 days for green turtles (Argos ID 131995 tagged on the northern shore of Saipan at
Spotlight; Table 2 and Figure 3D) and 1,270 days for hawksbill turtles (Argos ID 85496 tagged
on the west coast of Saipan at Balisa; Table 2 and Figure 2D). Hawksbill turtle shells are thicker
and more keratinized than green turtle shells, which tend to be thinner and oilier; this difference
likely contributes to the longer tag retention times observed on hawksbill turtles. Eight tags were
still active and transmitting data on December 18, 2018, seven of which deployed in 2018 and
one of which was deployed in 2017 (Table 2 and Table 4). KIWB estimates revealed high site
fidelity and limited movements for both green and hawksbill turtles in Guam, Tinian, and Saipan
(Figures 2 to 7 and Table 2). Across all islands and sites, the core area (50% KIWB volume
contour) was geographically concentrated for both green turtles (mean = 0.51 km2, SD = 0.66
km2, range = 0.03–2.58 km2) and hawksbill turtles (mean = 0.26 km2, SD = 0.13 km2, range =
0.10–0.46 km2). Home ranges (95% KIWB volume contour) were also similar for the two
16species, with green turtles using an average area of 3.20 km2 (SD = 4.47 km2, range = 0.07–
18.17 km2) and hawksbill turtles 3.29 km2 (SD = 4.67 km2, range = 0.20–12.57 km2). For green
turtles, there were some subtle inter-island differences in core area, with turtles in Guam (mean =
0.59 km2, SD = 0.98 km2, range = 0.08–2.58 km2) and Tinian (mean = 0.57 km2; SD = 0.19 km2;
range = 0.46–0.79 km2) using slightly larger areas than in Saipan (mean = 0.39 km2, SD = 0.48
km2, range = 0.03–1.33 km2). Home range of green turtles was also larger on Guam (mean =
4.20 km2, SD = 6.88 km2, range = 0.43–18.17 km2) and Tinian (mean = 3.09 km2, SD = 0.78
km2, range = 2.24–3.76 km2) than on Saipan (mean = 2.26 km2, SD = 2.45 km2, range = 0.07–
6.59 km2). The two hawksbill turtles tagged in Saipan had a similar core area (mean = 0.21 km2,
SD = 0.04, range = 0.18–0.24) to the two tagged on Tinian (mean = 0.37 km2, SD = 0.13 km2,
range = 0.28–0.46 km2) and the two residing in Guam (mean = 0.22 km2, SD = 0.17 km2, range =
0.10–0.34 km2). The home range for the Saipan hawksbills (mean = 1.09 km2, SD = 1.25 km2,
range = 0.20–1.97 km2) was smaller than for those tagged on Tinian (mean = 2.20 km2, SD =
1.36 km2, range = 1.24–3.16 km2) and those residing in Guam (mean = 6.58 km2, SD = 8.48 km2,
range = 0.59–12.57 km2). These geographic comparisons will be tested statistically in the final
analysis of these data.
While the majority of tagged turtles remained within a 1–3 km2 area for the entire life of the tag,
there were a few long-range movements. One 61.7 cm hawksbill turtle tagged in 2013 on Tinian
traveled 233 km south to the southern coast of Guam, where it remained for more than 2 years
(Argos ID 85493; Figure 8A). This movement was somewhat unexpected, as hawksbill turtles of
this size are not thought to be mature and thus are likely not making breeding migrations yet.
Therefore, this turtle possibly moved to a different foraging site, reached maturity at a smaller
size than expected and moved to breed, or moved for a different unknown reason. Another 72.3-
cm hawksbill tagged in 2014 on Tinian migrated east 2,118 km in 74 days to Ant Atoll adjacent
to Pohnpei, Federated States of Micronesia, where it remained in nearshore waters for 10 months
(Argos ID 138963; Figure 8B). This individual was likely a mature adult making a long-distance
breeding migration to a known breeding site; however, it is also possible that it was concluding a
breeding season near Tinian and returning to Ant Atoll to forage.
One adult male green turtle (82.3 cm SCL) tagged off Orote Point in Guam in May 2016 moved
39 km north to Pati Point before making a 70 km roundtrip jaunt offshore and then traveling
south again to Apra Harbor and Orote Point (Argos ID 142752; Figure 6D). Given there are
known nesting sites near both Pati Point (e.g., along Andersen Air Force Base beaches) and
Orote Point (e.g., Spanish Steps in Apra Harbor), this adult male could have been visiting
multiple breeding grounds or possibly moving between a combination of foraging and breeding
sites. These movements indicate some diversity in nearshore habitat use and movements around
the Mariana Islands and beyond. This suggests that movement patterns, residency times, and thus
exposure to nearshore threats, likely vary throughout an individual’s life, with smaller juvenile
turtles potentially spending most of their time in a localized reef area and larger mature turtles
having intermittent periods of residency as they move between foraging and breeding grounds.
17Figure 6. Habitat use map for green turtles tagged in western Guam (sites: Tanguisson, Tumon
Bay, Piti Bomb Holes, Apra Harbor, and Orote Point). GPS location data were analyzed using a
Kernel Interpolation with Barriers method. Darker shades of green indicate higher density of GPS
location points, with the 50% (core area) and 95% (home range) volume contours outlined in
yellow and blue, respectively (see Figure 8A). An adult male (Argos ID: 142752, red points in D)
was tagged at Orote Point, then moved to Pati Point, then back to Orote Point (additional details
provided at the end of this section). For each map, Table 4 provides additional details on individual
tag deployments.
18Figure 7. Habitat use map for green and hawksbill turtles tagged in western Guam and
northwestern Tinian (sites: Dadi Beach, Sella Bay, Orote Point in Guam and Fleming Point in
Tinian). Tags were deployed in Guam in A-C, but the hawksbill turtle in D was tagged at Fleming
Point in Tinian and migrated to Guam (see Figure 8A). GPS location data were analyzed using a
Kernel Interpolation with Barriers method. Darker shades of green (green turtles) or red
(hawksbill turtles) indicate higher density of GPS location points, with the 50% (core area) and
95% (home range) volume contours outlined in yellow and blue, respectively. For each map, Table
4 provides additional details on individual tag deployments.
19Figure 8. Turtle migrations. (A) A 61.7 cm hawksbill turtle (Argos ID: 85493) was tagged 20 August
2013 at Fleming Point, Tinian. It departed Tinian on 11 October 2013 and arrived 5 days later in
Cocos Lagoon, southern Guam on 16 October 2013 after traveling a distance of 233 km. This turtle
remained in nearshore waters along the south and southwest coasts of Guam for over 2 years until
27 February 2016, when the last signal was transmitted. Total tag transmission time was 922 days
or 2.5 years. (B) A 72.3 cm hawksbill turtle (Argos ID: 138963) was tagged 21 July 2014 at Fleming
Point, Tinian. It departed Tinian on 18 April 2015 and arrived 74 days later to Ant Atoll adjacent
to Pohnpei, Federated States of Micronesia on 1 July 2015 after traveling a distance of 2,118 km. It
remained in the nearshore waters of Ant Atoll for 10 months until its last signal transmission on 27
April 2016. Total tag transmission time was 646 days or 1.8 years. (C) An 82.3 cm adult male green
turtle tagged in May 2016 at Orote Point (Argos ID: 142752). It left Orote Point on 13 September
2016 and arrived 5 days later at Pati Point, traveling >39 km. It then moved offshore from Pati
Point (northeast) between 20 and 28 September, with a roundtrip distance of > 70 km. On 23
October, it moved south, arriving in Apra Harbor on 27 October after a > 39 km trip. It then
moved back to its original tagging location at Orote Point between 29 and 31 October (> 2.6 km
distance).
20Dive behavior and vertical movement
Dive patterns suggest that both green and hawksbill turtles spend most of their time in waters
shallower than 25 m (Figures 9 and 10), and despite a relatively small sample size (n = 7) for
hawksbill turtles, it is possible that habitat partitioning may exist between the two species in this
region. Binned depth data from the tags suggest both species made dives down to 100 m;
however, hawksbill turtles spent more time in deeper waters than green turtles, with an average
depth of 15.2 m compared to 10.9 m, respectively (Figure 9), and spending 59.5% of their time
in waters < 10 m in depth, compared to 64.2% for greens. Additionally, the maximum dive depth
of hawksbills was substantially deeper than those of green turtles, with averages of 20.9 m
compared to 13.5 m, respectively (Figure 10).
Figure 9. Proportion of time-at-depth profiles for 68 green turtles (A) and 7 hawksbill turtles (B) in
the MITT study area in 2014–2018. Green turtles resided between the surface and 25 m depth
97.6% of the time, with an average depth of 10.9 m. Hawksbill turtles spent more time at deeper
depths, with 92.7% of the time spent between the surface and 25 m and an average depth of 15.2 m.
Histogram bars are time-at-depth averages; error bars represent standard error of the mean.
Figure 10. Maximum dive depth profiles for 72 green turtles (A) and 9 hawksbill turtles (B) in the
MITT study area in 2014-2018. Green turtles dove to maximum depths of 24 m or less on 95.0% of
their dives, with an average maximum depth of 13.5 m. Hawksbill turtles performed deeper dives
more frequently, with only 68.6% of their dives occurring in the 0 –24 m depth range, and an
average of 23.7 m maximum dive depth. Histogram bars are max dive depth averages; error bars
represent standard error of the mean.
21Green and hawksbill turtles primarily use waters with temperatures of 28–31 °C, but hawksbill
turtles spent more time in slightly warmer waters, with 40.1% of their time in waters of 30 °C
and an average water temperature of 29.8 °C, compared to green turtles that spent 40.7% of their
time in waters of 29 °C by (Figure 11) and an average water temperature of 29.7 °C. In general
hawksbill turtles prefer warmer waters than their green turtle counterparts and it is likely that
hawksbills are actively seeking out slightly warmer waters during the day (Gaos et al. 2012).
Figure 11. Proportion of time-at-temperature profiles for 68 green turtles (A) and 7 hawksbill
turtles (B) in the MITT study area in 2014–2017. Green turtles spent 40.7% of their time in
temperatures of 29 °C, with an average temperature of 29.7 °C. Hawksbill turtles spent more time
in slightly warmer waters, with 40.1% of their time in temperatures of 30 °C, but had a similar
average temperature of 29.8 °C. Histogram bars are time-at-temperature averages; error bars
represent standard error of the mean.
Hawksbills tended to have longer dive durations than green turtles, with average dive durations
of 46 minutes compared to 31 minutes, respectively (Figures 12A and 12B). Time-at-depth,
time-at-temperature, maximum dive depth, and dive duration histograms in Figures 9–12 provide
a detailed breakdown of these habitat and behavioral variables for each species and suggest that
hawksbill turtles spend more time at depth and in warmer waters.
Figure 12. Dive duration profiles for 62 green turtles (A) and 9 hawksbill turtles (B) in the MITT
study area in 2014–2017. Green turtles dove for 60 minutes or less on 89.6% of their dives, with an
average dive duration of 31 minutes. Hawksbill turtles performed longer dives more frequently,
with only 72.5% of their dives lasting 60 minutes or less, and an average dive duration of 46
minutes. Histogram bars are dive duration averages; error bars represent standard error of the
mean.
22In 2018 we adjusted our dive duration bins (see Methods), and we were able to obtain increased
resolution on the dive duration of 11 green turtles equipped with SPLASH tags (no hawksbills
turtles were captured in 2018). Results of the new bin settings indicated that although green turtle
dive durations typically last < 60 minutes, they have the ability to remain submerged > 2.5 hours
(Figure 13A). Diel comparisons demonstrated that green turtle dives are shorter during the day
than at night, with an average duration of 34.8 minutes and 39.4 minutes, respectively, and the
majority of dives lasting > 2.5 hours occurring at night (Figure 12B). For the dive durations
lasting > 2.5 hours, 27.8% occurred during the day, while 72.2% occurred during the night. It is
likely that the prolonged dive durations are indicative of green turtles resting during nocturnal
time periods, during which they surface for air less frequently.
Figure 13. Overall dive duration profiles for 11 green turtles (A) and comparing between diurnal
(lighter) and nocturnal (darker) time frames (B) in the MITT study area in 2018. Dive duration was
> 50 minutes 26.5% of the time, with 43.3% of those dives occurring Overall dive duration profiles
for 11 green turtles (A) and comparing between diurnal (lighter) and nocturnal (darker) time
frames (B) in the MITT study area in 2018. Dive duration was > 50 minutes 26.5% of the time, with
43.3% of those dives occurring at day, compared to 56.7% at night.
Diel comparisons also indicated that green and hawksbill turtles use shallower water depths
during diurnal timeframes (6 am–6 pm) compared to nocturnal timeframes (6 pm–6 am) (Figures
14A–14D). Green turtles spent 70.9% of their time in waters ≤ 10 m in depth during the day,
compared 57.2% during the night, while hawksbills spent 70.0% compared to 49.2%. Similarly,
77.4% of the maximum dive depths for green turtles were to depths of ≤ 14 m during the day
compared 66.3% during the night, while 67.2% of hawksbill dives were to depths of ≤ 14 m
during the day compared 43.3% during the night. These findings suggest that green turtles and
hawksbills are actively foraging in shallower waters during the day, then retreat to deeper waters
to rest during the night, with hawksbill using deeper waters under both diel time periods. Both
species spent time in slightly cooler waters during the day compared to night, although the
average temperature between these to timeframes were very similar, with 29.6 °C vs. 29.9 °C for
green turtles, and 29.7 °C and 29.8 °C for hawksbill turtles, respectively (Figures 14E and 14F).
23Figure 14. Diurnal (6 am – 6 pm) vs. nocturnal (6 pm – 6 am) time at depth profiles for 68 green
turtles and 7 hawksbills, including time at depth (A & B), maximum dive depth (C & D) and time at
temperature (E & F) in the MITT study area in 2014-2018. The average depth during the day vs.
night for green turtles was 9.5 m compared 11.2 m, respectively, and for hawksbill turtles was 12.8
m vs. 17.5 m. The average maximum dive depth during the day vs. night for green turtles was 12.5
m versus 14.5 m, respectively, and for hawksbills was 16.0 vs. 24.5 m, respectively.
24Progress towards Summary of Tasks
1) Capture and tag sea turtles in the MITT study area, and deploy biotelemetry devices.
From 2013 through 2018, there were 139 turtles captured (with identification tags applied) and
94 satellite tags deployed in the MITT study area.
2) Process and analyze biotelemetry data and other survey data.
Kernel interpolation estimates include all tags to date (2013–2018, tags with sufficient data) and
all areas of capture. Analysis revealed high site fidelity and limited movements of turtles,
although some long-distance movements were recorded. Tagging results suggest that movement
patterns, residency times, and thus exposure to nearshore threats, likely vary throughout an
individual’s life. Smaller juvenile turtles potentially spend most of their time in a localized reef
area, and larger mature turtles have intermittent periods of residency as they move between
foraging and breeding grounds. These habitat use patterns are consistent with previous telemetry
studies on reef-dwelling green and hawksbill turtles in other locations, yet possibly reveal habitat
niches that are specific to the region.
Eight tags are possibly still active, and complete analysis is forthcoming. Dr. Summer Martin
and PIFSC MTBAP staff will continue conducting in-depth analysis of satellite tagging data
including spatial analysis, dive depth and duration of turtles, and influence of temperature on
habitat use. See Figures 2–7 and Table 2 for kernel interpolation estimates, Figure 8 for turtle
migratory movements, and Figures 9–14 for dive depth and temperature histograms, as well as
maximum dive depth and dive duration profiles.
3) Prepare annual reports.
Completed annually.
Progress towards Guiding Questions from the FY13–15 Monitoring Plan
Are there locations of greater cetacean and/or sea turtle concentration around Guam, Saipan, and
Tinian?
Efforts are ongoing to answer this question.
We have expanded our survey efforts to new areas of the Mariana Archipelago with each field
season and have encountered turtles in most locations we have surveyed around Guam, Saipan,
and Tinian. The following areas appear to have high turtle density based on the boat-based
snorkel survey observations and captures, as well as analysis of aerial survey data from Guam:
(1) in Guam, the waters inside Apra Harbor near San Luis, Gab Gab, out to Spanish Steps
including Dadi and Tipalao beaches outside of the harbor, as well as Tumon Bay. Our most
recent in-water surveys (August) also confirmed high turtle densities in around Cocos Island,
Cocos Lagoon and Achang Bay (Martin et al. 2016), as well as between Pago Bay and Talofofo
Bay; (2) in Saipan, the area stretching from the Balisa Channel to Managaha Island, as well as
Lao Lao Bay and Puntan Gloria along the east side of the island; and (3) virtually the entire west
coast of Tinian. These areas are primarily dominated by patch reef communities where the turtles
25both forage and rest. While these areas stand out as having relatively high turtle density, this is
only in relation to the areas surveyed thus far (or studied through historical aerial data); we may
discover additional high-density areas as we continue expanding our in-water survey coverage
around each island.
What is the occurrence and/or habitat use of sea turtles in areas that the Navy conducts
underwater detonations?
Seventeen turtles have been outfitted with satellite tags inside and just outside of Apra Harbor
(including capture sites at Orote Point, Dadi Beach, and Piti Bomb Holes), and all but one of the
tags have completed their data transmission period. From the spatial analysis of the GPS
locations and movements from these satellite tags shown in Figures 6 and 7, we have not seen
direct overlap of the turtles or their core use or home range areas with the Agat Bay Mine
Neutralization Site, Piti Point Mine Neutralization Site, and Outer Apra Harbor Underwater
Detonation Site. However, turtles are spending significant amounts of time in and moving
through areas within 1-2 km of these sites, and the lack of overlapping GPS points could be due
to the relatively low frequency of GPS locations obtained from these tags (often a maximum of
one per day). Analysis and filtering of Argos location classes (see supplemental materials) may
provide more data on daily locations.
Activities Planned for 2019
We have multiple in-water surveys planned for Guam, Saipan, and Tinian for June through
November (weather dependent) of 2019 to survey new areas and deploy additional satellite tags.
We will continue our analyses of the satellite data to understand home range, habitat preferences,
preferred depths and temperature, as well as movement within the archipelago. These analyses
will provide the basis of a manuscript intended for journal submission in 2020. The research to
date has largely focused on in-water surveys and expansion to regions/areas throughout the
archipelago. Moving into FY21 and beyond, our efforts will build from presence/absence to
population status and trends and eventually abundance estimates. To get to trends and
abundance, the PIFSC MTBAP will use data derived from the Navy/NOAA Interagency
Agreement as well as Guam DAWR, PIFSC Habitat and Living Marine Resources Program, and
PIFSC Cetacean Research Program turtle sighting data to gain a more robust understanding of
the population distribution and abundance. The MTBAP is also incorporating genetic and
hormone assays to get at regional management units and to understand environmental impacts
such as climate change. In the coming 2 years our research portfolio will include manuscripts
(publications and submissions) describing the in-water and nesting populations, modeling for
habitat use, and population abundance.
Acknowledgements
We thank our collaborative partners at Guam DAWR (Celestino F. Aguon, Jay T. Gutierrez,
Shawn B. Wusstig, Jamie D. Bass, Francisco D. Manibusan, Carlos S. Quintanilla, Cristian M.
Cayanan, Johnedel H. Ducusin), Guam OLE for logistic and boat support, CNMI DLNR
collaborators (Anthony Benavente, Richard Seman, Tammy Summers, Jessy Hapdei, and Joe
Ruak), and the crew of FishGuyz Charters in Saipan. Camryn Allen assisted with all aspects of
the 2017 and 2018 field efforts. Olivia Hughes assisted with data management, tracking, and
26You can also read