Sensing and structure analysis by in situ IR spectroscopy: from mL flow cells to microfluidic applications - IOPscience
←
→
Page content transcription
If your browser does not render page correctly, please read the page content below
Journal of Physics: Condensed Matter

TOPICAL REVIEW • OPEN ACCESS

Sensing and structure analysis by in situ IR spectroscopy: from mL flow
cells to microfluidic applications
To cite this article: Christoph Kratz et al 2020 J. Phys.: Condens. Matter 32 393002

View the article online for updates and enhancements.

                                This content was downloaded from IP address 46.4.80.155 on 26/10/2020 at 14:54
Journal of Physics: Condensed Matter

J. Phys.: Condens. Matter 32 (2020) 393002 (16pp)                                                                           https://doi.org/10.1088/1361-648X/ab8523

Topical Review

Sensing and structure analysis by in situ IR
spectroscopy: from mL flow cells to
microfluidic applications
Christoph Kratz1 , Andreas Furchner1 , Guoguang Sun1 , Jörg
Rappich2 and Karsten Hinrichs1,3
1
    ISAS—e.V., Schwarzschildstr. 8, 12489 Berlin, Germany
2
    Helmholtz-Zentrum Berlin für Materialien und Energie GmbH, Kekuléstr. 5, 12489 Berlin, Germany

E-mail: hinrichs@isas.de

Received 23 December 2019, revised 18 March 2020
Accepted for publication 31 March 2020
Published 23 June 2020

Abstract
In situ mid-infrared (MIR) spectroscopy in liquids is an emerging field for the analysis of
functional surfaces and chemical reactions. Different basic geometries exist for in situ MIR
spectroscopy in milliliter (mL) and microfluidic flow cells, such as attenuated total reflection
(ATR), simple reflection, transmission and fiber waveguides. After a general introduction of
linear optical in situ MIR techniques, the methodology of ATR, ellipsometric and microfluidic
applications in single-reflection geometries is presented. Selected examples focusing on thin
layers relevant to optical, electronical, polymer, biomedical, sensing and silicon technology
are discussed. The development of an optofluidic platform translates IR spectroscopy to the
world of micro- and nanofluidics. With the implementation of SEIRA (surface enhanced
infrared absorption) interfaces, the sensitivity of optofluidic analyses of biomolecules can be
improved significantly. A large variety of enhancement surfaces ranging from tailored
nanostructures to metal-island film substrates are promising for this purpose. Meanwhile,
time-resolved studies, such as sub-monolayer formation of organic molecules in nL volumes,
become available in microscopic or laser-based set-ups. With the adaption of modern brilliant
IR sources, such as tunable and broadband IR lasers as well as frequency comb sources,
possible applications of far-field IR spectroscopy in in situ sensing with high lateral (sub-mm)
and time (sub-s) resolution are considerably extended.
Keywords: in situ, infrared spectroscopy, ATR, solid–liquid interface, enhancement interface,
microfluidic, biosensing
(Some figures may appear in colour only in the online journal)

1. Introduction                                                                          that can be operated under various environmental conditions,
                                                                                         specifically for the analysis of, or in, liquids. Linear optical
Many optical spectroscopic techniques have the advantage of                              methods such as classical infrared (IR) reflection/transmission
being non-invasive, destruction-free and non-contact methods                             spectroscopies [1] and ellipsometry [2], as well as plasmon
                                                                                         resonance [3], Raman [1] and fluorescence spectroscopies [4],
3
 Author to whom any correspondence should be addressed.                                  come with a different set of merits and constraints for the
                  Original content from this work may be used under the terms
                  of the Creative Commons Attribution 4.0 licence. Any further           study of interfaces and sensing platforms in liquid environ-
distribution of this work must maintain attribution to the author(s) and the title       ments resulting from the different light–matter interaction
of the work, journal citation and DOI.                                                   mechanisms.
1361-648X/20/393002+16$33.00                                                         1       © 2020 The Author(s). Published by IOP Publishing Ltd   Printed in the UK
J. Phys.: Condens. Matter 32 (2020) 393002                                                                                        Topical Review

                                                                              through a thick liquid layer. However, there is no principle lim-
                                                                              itation to extend the accessible spectral range to the mid-IR
                                                                              (MIR) if materials with sufficiently high MIR transparency are
                                                                              used [5–93]. Even a further extension down to the THz range
                                                                              [63] is feasible.
                                                                                  Classical in situ IR techniques such as attenuated total
                                                                              reflection (ATR) or external reflection spectroscopies like
                                                                              reflection absorption IR spectroscopy (RAIRS) have been
                                                                              established over decades. In situ infrared spectroscopic ellip-
                                                                              sometry (IRSE) was introduced in recent years allowing for
                                                                              comprehensive quantitative IR studies in milliliter (mL) flow
                                                                              cells when combined with optical modeling.
                                                                                  Microfluidic concepts [5–19] and the combination of ATR
                                                                              with fiber/waveguide geometries [19–25] enable the sensitive
                                                                              analysis of micro- and nanoliter volumes. So-called optoflu-
                                                                              idic approaches could push multiple novel chemical and bio-
                                                                              analytical sensor concepts [94–97], also potentially combin-
                                                                              ing different nonlinear and linear optical spectroscopic meth-
                                                                              ods with microfluidic techniques. Important applications of
                                                                              such optofluidic platforms are biosensing, monitoring of cat-
                                                                              alytic processes, lab-on-a-chip devices, drug development, and
                                                                              biochemical analyses [5–19, 94–97].
                                                                                  An interesting and rapidly emerging technical develop-
                                                                              ment is the application of plasmonic enhancement substrates.
                                                                              The consideration of enhancement particles [98, 99], struc-
                                                                              tures [100–105] and interfaces to exploit the effect of surface
Figure 1. (a) Artist’s illustration of an IR ellipsometric study, which       enhanced infrared absorption (SEIRA) [98, 99] can signifi-
uncovers chemical, structural and interaction properties of a thin            cantly increase the sensitivity of IR spectroscopy and ellipsom-
polymer brush film. (b) Schematic of the swelling–deswelling
                                                                              etry in liquid environments [12, 48, 88, 106]. Moreover, the
transition of a thermoresponsive brush below and above its lower
critical solution temperature (LCST), with characteristic changes in          combined platforms for multimodal detection, such as simulta-
molecular interactions. Reprinted with permission from [31].                  neous surface enhanced Raman scattering (SERS) and SEIRA
Copyright (2018) American Chemical Society.                                   measurements, could significantly expand the area of bioan-
                                                                              alytical, electrochemical and sensing applications [107 and
                                                                              references therein]. Compared with Raman [108], IR spec-
    Vibrational spectroscopy techniques such as Raman and
                                                                              troscopy may offer the possibility of a more straightforward
IR are of particular interest, as they enable label-free studies
                                                                              identification and quantification in applications where thin
of specific chemical, structural and functional sample prop-
erties (see figure 1) under on-line or in situ conditions. The                films down to the sub-monolayer level are investigated [31,
range of applications for in situ Raman and IR vibrational                    50]. Single-molecule detection levels as in SERS are in reach
spectroscopy significantly broadened in consequence of recent                 for IR-spectroscopic techniques [109], especially for large
technological developments with respect to the specific mea-                  molecules.
surement schemes, the optical equipment, and the implemen-                        Most of the recent developments in the field of in situ
tation of functional or enhancement substrates. Key goals                     IR techniques for solid–liquid interface characterization were
of these developments were to reduce measurement times,                       reported on set-ups that still operate with classical FTIR
to advance hyperspectral imaging, to improve measurement                      (Fourier-transform IR) technology. However, there is a fast-
sensitivity, and to downscale sample volumes required for                     growing field of IR analytics that combines in situ measure-
the analysis. Furthermore, optical modeling and multivari-                    ment methods with brilliant infrared sources, in particular
ate analysis were steadily developed for the interpretation of
                                                                              quantum cascade lasers (QCLs). These new developments
(multi-modal) experimental data.
                                                                              enable a more in-depth analysis of functional thin films and
    The application of optical methods in the spectral range
from near-ultraviolet to near-IR is very common because a                     surfaces for multiple technological applications. For the pre-
variety of transparent materials are readily available for the                sented examples of in situ IR spectroscopy, this review will
development of optics and liquid cells (e.g., polymers or                     focus on nm-thin films and monolayers on silicon for opto-
glasses). In addition, aqueous solutions often exhibit sufficient             electronic, biosensing, and catalytic interfaces, highlighting
transparency in this spectral range. Therefore, the optical beam              the application potential of the techniques to broad areas in
can pass through the liquid reservoir or probe an interface even              science, metrology, and industry.

                                                                          2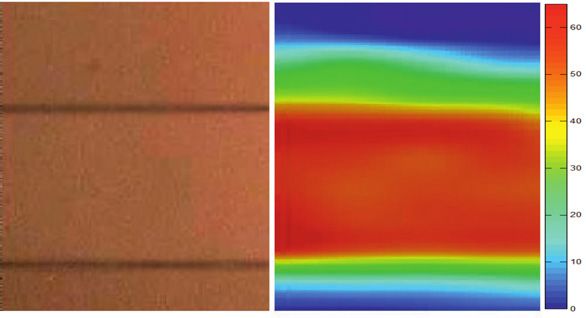
J. Phys.: Condens. Matter 32 (2020) 393002                                                                                       Topical Review

2. Technical aspects of in situ IR spectroscopy                           Both ATR and specular reflection techniques are sensitive
                                                                          methods to characterize thin films. For both methods, addi-
This section starts with a review of the most commonly used               tional polarization dependent measurements can give access
in situ measurement geometries. In the second part, an intro-             to anisotropic sample properties. Advanced IR ellipsometric
duction to common measurement techniques referring to IR                  measurement schemes, such as generalized or Mueller-matrix
spectroscopy in linear optics is given. Several possible varia-           (MM) ellipsometry [111], can also facilitate the study of com-
tions of substrate interfaces to enhance the measured signal are          plex biaxial or bi-isotropic films and enable one to include
discussed in the last part.                                               the depolarization properties of the sample (and set-up) in the
                                                                          measurement and optical interpretation [93, 112].
2.1. In situ IR geometries                                                   The time resolution of most classical far-field in situ FTIR
                                                                          techniques is in the range of several seconds to 10 s. For
Figure 2 summarizes selected possible in situ measurement
                                                                          dynamic studies of non-cyclic processes with higher time res-
geometries for MIR analytics of liquid samples or in liquid
                                                                          olutions, rapid-scan interferometers [113] can be employed.
environments, in particular for the analysis of thin films at
                                                                          IR methods can also be coupled with a brilliant light source
the solid–liquid interface. Figure 2(a) refers to typical geome-
                                                                          and with a single-shot detection scheme to achieve even sub-
tries either in ATR or simple reflection, where the solid–liquid
                                                                          second time resolutions [114–116].
interface is probed through an ATR crystal or an optical win-
dow. For an ATR crystal or sphere in a single- or multiple-
                                                                          2.2.1. Reflection    absorption      IR   spectroscopy    (RAIRS).
reflection geometry, the accessible spectral range depends on
                                                                          RAIRS spectra are widely used for the analysis of characteris-
the optical path length through, and residual absorption of,
                                                                          tic thin-film fingerprints, structure of adsorbed molecules, and
the used materials. Typically, the path lengths through the IR-
                                                                          layer properties. Typically for quantification, the measured
transparent materials of such cells are larger than for those
                                                                          signals are compared to those of a well-known reference
with a microstructured surface or a simple reflection geom-
                                                                          sample, the empty channel or a spectrum of the initial surface
etry. A multiple-reflection ATR geometry enhances the mea-
                                                                          during an in situ experiment. Therefore, spectral RAIRS
sured signal and provides high detection sensitivities. Larger
                                                                          signals are often displayed as referenced differences
incidence angles, and thus ATR conditions, for probing a
solid–liquid interface can be achieved with a macroscopically
                                                                                                    Rsample − R0
planar material by using a microstructured surface [110]. How-
                                                                                                         R0
ever, the structure of the window interface might contribute to
a depolarization of the incident radiation.
                                                                          with the sample reflectance (or reflectivities) Rsample and ref-
    On the contrary, a simple reflection geometry (figure 2(a) on
                                                                          erence reflectance R0 , or (in analogy to transmission spec-
the right) allows for more defined measurements of reflected
                                                                          troscopy) as absorbance [117]:
amplitudes and phases, as well as a high sensitivity to thin-
film optical effects. Figure 2(b) shows a reflection geometry
                                                                                                              Rsample − R0
for direct measurements on the liquid surface. Figure 2(c)                                    A = − log
                                                                                                                   R0
depicts variants in which the optical beam passes through the
liquid sample, either in a reflection or a transmission geom-
                                                                             Beside the name RAIRS, the specular reflection IR method
etry. Figure 2(d) sketches the application of a fiber geome-
                                                                          is also known under several acronyms including ERIRS
try where the ATR conditions are met at the interfaces of the
                                                                          (external reflection infrared spectroscopy), IR-ERS, [118] and
waveguide. Reflection and transmission geometries can also
                                                                          IRRAS. In a typical reflection absorption geometry, a single
be combined requiring the specific modification of the used
                                                                          external reflection of the IR radiation at a sample-covered sub-
prisms or spheres [85, 86].
                                                                          strate is probed. By adding polarizers, s- and p-polarization
    The IR transparency of solvent and substrate material
                                                                          dependent reflectance spectra can be obtained. In situ IRRAS
imposes several restrictions for the realizations of flow cells
                                                                          has been applied in several works either at the air–liquid or the
for in situ IR spectroscopic measurements. Hence, reflection
                                                                          solid–liquid interface, e.g., for the studies of antimicrobial sur-
(figure 2(b)) and transmission (figure 2(c)) measurements [84]
                                                                          faces [119], soluble surfactants [120], organic or bio-related
where the IR beam has to pass through the liquid volume can
                                                                          monolayers [121–124], or in a liquid cell for, e.g., spectro-
only be realized for sufficiently thin layers or channels (e.g.,
                                                                          electrochemistry [125] and the study of adsorption/desorption
for water and blood below about 15 μm penetration depths
                                                                          processes of molecules [126, 127].
[32] in the MIR). These obstacles can be overcome when MIR-
transparent materials are chosen for the substrates or top win-
dows of the cell, and the liquid reservoir or interface of interest       2.2.2. IR spectroscopic ellipsometry (IRSE). IRSE allows
is studied directly through this transparent material.                    for more detailed measurements compared to RAIRS. It can
                                                                          measure s- and p-polarized reflectance spectra, and addition-
                                                                          ally probe relative phase and amplitude information of the
2.2. In situ IR techniques
                                                                          elliptically polarized reflected or transmitted IR beam. IRSE
In the following subsections, common in situ measurement                  measures the quantity ρ, which is the ratio of the complex
techniques are introduced. ATR-IR spectroscopy is probably                reflection coefficients of p- and s-polarized light, defining the
among the most widely used IR spectroscopic techniques.                   basic ellipsometric parameters tan Ψ (relative amplitude ratio)

                                                                      3
J. Phys.: Condens. Matter 32 (2020) 393002                                                                                           Topical Review

Figure 2. In situ measurement geometries: (a) ATR in single reflection, multiple reflection, through a microstructured surface, and a simple
reflection geometry at a lower angle of incidence at the solid–liquid interface; (b) direct reflection from the liquid surface; (c) reflection from
the backside, transmission through a liquid micro layer; (d) fiber waveguide according to reference [21, 24].

and Δ (relative phase shift),                                               micro optics. Detailed theoretical and experimental descrip-
                                                                            tions of the ATR technique, which is also called internal reflec-
                              rp                                            tion spectroscopy because it uses an IR-transparent internal
                        ρ=       = tan Ψ · eiΔ
                              rs                                            reflection element, can be found in references [41–45]. Suit-
                                                                            able materials with chemical compatibility and optical trans-
where tan Ψ can be calculated from the square-root of the ratio             parency in the IR spectral range need to be chosen for fluidic
of p- and s-polarized reflectances:                                         cells [9]. These constraints and the required geometry for the
                                                                           total reflection condition have to be considered for the optical
                                             Rp                             design of an in situ measurement cell or platform.
                            tan Ψ =
                                             Rs
                                                                            2.3. In situ enhancement interfaces
The ellipsometric parameters are absolute, self-referenced                  Recent advancements of plasmonic and porous enhancement
measurement values. Therefore, this measurement scheme                      surfaces are addressed in this section. Beside the possibility of
does not require the use of a reference sample. Advanced ellip-             increasing the measured signal by (i) the use of brilliant light
sometric measurements also allow for the determination of                   sources with high spectral and lateral power densities, (ii) the
polarization degrees and Mueller-matrix elements, which are                 use of optimized cell geometries based on multiple reflections
related to the depolarizing and anisotropic sample properties               or waveguides, also (iii) the sensing interface could be modi-
[2, 93, 111, 128, 129].                                                     fied to achieve signal enhancement. For the latter, this subsec-
    Flow cells for in situ measurements of solid–liquid inter-              tion discusses technical possibilities to increase the measured
faces are only commercially available as accessories for VIS                signal from a surface in an in situ IR-spectroscopic experi-
ellipsometers. Such cells are not yet on the market for IR-                 ment by making use of larger surface areas and electric-field
spectroscopic ellipsometry. However, since the introduction of              enhancements.
IRSE with liquid flow cells in 2007 [33], the technique has
been widely applied to numerous thin-film studies.                          2.3.1. Interfaces with larger surface area. Compared to the
                                                                            monolayer adsorption on a planar substrate, porous or fiber-
2.2.3. ATR. The method relies on an optical total-reflection                covered surfaces can provide a significantly larger surface area
geometry for sensitively probing up to several microme-                     and thereby lead to increased IR signals due to a higher amount
ters beyond the ATR-material–sample interface. Similar to                   of adsorbed material.
RAIRS, ATR signals are often displayed as referenced differ-                   In situ ATR spectroscopy of mesoporous silica films can be
ences or absorbances. A number of commercial devices exist                  used for the monitoring of adsorption processes and trace anal-
that are adaptable to sample compartments or external reflec-               ysis [29, 30]. Specifically, an ATR silicon crystal covered with
tion optics of IR-spectroscopic devices with fiber, macro or                such a film can serve as a large-surface-area layer exhibiting

                                                                        4
J. Phys.: Condens. Matter 32 (2020) 393002 Topical Review
material enrichment factors for adsorbed molecules of up to
210 [29, 30].
2.3.2. Plasmonic chip-based technology. Detection surfaces
integrated in in situ cells can be modified with metallic films
or nanostructures. These modifications provide properties to
exploit both signal enhancement due to a larger surface area
and due to the plasmonic properties by surface enhanced
infrared absorption (SEIRA) [98, 99]. Metallic island films can
provide average enhancement factors ‘usually found to be in
the 10–100 region’ [99] over the full MIR range and the com-
plete probed spot [98, 99]. They are used for simple reflection
[98, 99] (see also section 3.3) as well as ATR geometries [40,
48] (see also section 3.1). Special types of substrates, such as
metallic island gradient substrates, offer continuously vary-
ing plasmonic properties with respect to the island density.
Figure 3. ATR-IR spectra of a hydrogen-passivated silicon surface
This feature can be exploited for optimization and a detailed under Argon atmosphere and in contact with an aqueous electrolyte.
study of the effect of the enhancement on the obtained sig- Reprinted from [77], Copyright (2002), with permission from
nal with only a single solid–liquid interface [12, 105]. The Elsevier.
integration of a gold-island film enhancement substrate in
a microfluidic cell allows classical IR-microscopic measure-
ments in a single-reflection geometry [12, 105], reaching high liquids and supercritical fluids [56], tissues [57], imaging of
sensitivities down to sub-monolayer level, which corresponds drug diffusion [42], polymers [58, 70, 72], electro-oxidation
to detection surface densities of ng cm−2. [59], protein adsorption [21, 60], proteins and peptides in lipid
A different type of enhancement substrates employs plas- bilayers [129] and powder–liquid interfaces [43].
monic nanoantennas whose properties can be precisely tai- Beside these technical applications, in situ ATR can be
lored to provide a high field enhancement over a selectively combined with IR ellipsometric measurements [74, 76], and is
chosen narrow spectral range and at highly localized hot-spots therefore also relevant for the determination of refractive and
such as the apex of nanoantennas. These substrates can deliver absorption indices of solutions [32, 74–76].
enhancement factors of up to 107 at specific frequencies and In the following, two examples of interface studies with
spatially highly localized spots [100–105]. This type of sub- sub-monolayer sensitivity are presented.
strates has been used successfully for studies of the secondary Hydrogen-passivated silicon can be used as a starting sur-
structure of proteins under in situ conditions [88]. face for radical reaction molecular depositions. In situ ATR
with multiple reflections allows the sensitive evaluation of
such an initial surface and the monitoring of the surface with
3. Applications respect to chemical changes in the sub-monolayer regime.
Figure 3 compares IR spectra of a flat and hydrogenated Si sur-
In this chapter, applications of thin-film sensitive methods face in Argon atmosphere with the spectrum of the same sur-
such as ATR, IR ellipsometry and SEIRA microfluidics are face in contact with an aqueous electrolyte. The spectrum mea-
reviewed. A short collection of different applications is listed sured in p-polarization in Argon shows a strong and narrow
at the beginning of each subsection. Selected examples of thin- Si–H band with a broader background due to different Si–H,
film investigations are given to highlight possible applications. Si–H2 and Si–H3 contributions. The spectrum of the Si–H
surface measured in s-polarization shows only a minor contri-
3.1. In situ ATR
bution of Si–H, indicating that Si–H bonds are oriented mainly
perpendicular to the Si surface. The spectrum measured in
In situ ATR has a wide range of applications that require a electrolyte exhibits an overall broadened, slightly less intense
dedicated review article on their own [e.g. 57, 70]. In the fol- Si–H related absorption band with slightly lower intensity.
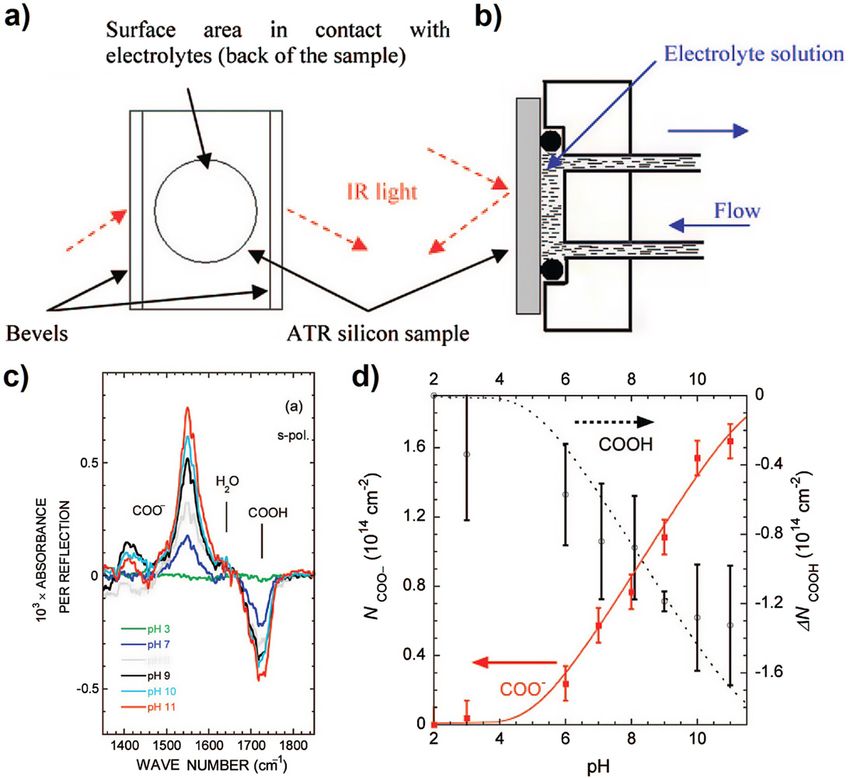
lowing, we therefore provide only a brief survey of the wide The second example is an in situ monolayer study [50]
field of applications, and show selected examples related to in which an ATR set-up with about 30 reflections (see
studies of thin films in more detail. figures 4(a) and (b)) was employed. The authors have pre-
Numerous in situ ATR applications in liquid or wet pared well-defined mixed decyl/10-carboxydecyl monolayers
environments have been reported either using single- or on hydrogen-terminated Si(111) surfaces via direct photo-
multiple-reflection geometries [9–25, 42, 47, 49–60, 70–73]. chemical hydrosilylation and studied their behavior in depen-
Examples are catalytic [47], voltammatric [48], biofilm [7, dence of a varying pH value of the electrolyte solution. In
21], cell [11, 21, 49, 57, 73], and titration studies [50], inves- situ spectra (see figure 4(c)) were analyzed quantitatively
tigations of superhydrophobic surfaces [51], adsorption and with respect to the pH-dependent dissociation of carboxyl
complexation of biomolecules [52, 71], sulfate bonding mech- groups into carboxylate ions in the monolayer. A conversion
anisms on Goethite [53], cement on barnacles [55], ionic takes place of the ν(C=O) band (related to COOH group)
5J. Phys.: Condens. Matter 32 (2020) 393002 Topical Review
Figure 4. (a) In situ ATR set-up from reference [50]; (b) 100 μL flow cell; (c) pH dependence of the stretching vibrations of COOH and
COO− groups in s-polarized in situ ATR spectra with respect to an initial spectrum at pH 2; (d) Calculated surface concentration of COOH
and COO− groups. Reprinted with permission from [50]. Copyright (2008) American Chemical Society.
around 1720 cm−1 into the νs (COO− ) and νas (COO− ) bands at internal single- or multiple-reflection elements or to fiber optic
1400 cm−1 and 1550 cm−1 , respectively. The surface concen- waveguides [21–25]. The latter approach formed the new field
tration of COOH and COO− groups (see figure 4(d)) was cal- of fiber evanescent wave spectroscopy (FEWS) [21]. Fiber-
culated from the respective band amplitudes, showing approx- based waveguide sensing can also be coupled to QCL technol-
imately 10% ionized groups at pH 6 with a progressive trend ogy [20, 90], and has many applications ranging from chemical
towards a more, but not fully, ionized layer at pH 11. This dis- and biosensing to environmental monitoring [21–25].
sociation behavior differs from the one the authors observed
in bulk solutions (3D) and can be explained by solvation con- 3.2. In situ IR ellipsometry
straints and different electrostatic interactions between the
molecules, which are ordered in a 2D layer at the surface [50]. In situ IR ellipsometry has been established for various appli-
This effect is of general importance for many surface reactions, cations of thin films and interfaces [26–28, 31, 33–39, 67–69,
and, as stated in reference [50], may markedly affect the kinet- 78, 79]. The method is able to probe both material-specific
ics of immobilization reactions important for the formation of vibrational bands and structure-related baselines, enabling the
functional surfaces in general. detailed analysis of molecular and functional thin-film proper-
ties, in particular when combined with optical simulations for
3.1.1. Current in situ ATR improvements. The implementa- quantitative spectra evaluation.
tion of a brilliant light source can improve the ATR technique Quantitative IRSE approaches were introduced for mod-
with regard to sensitivity as well as lateral and time reso- eling the electrochemical grafting of ultrathin nitrobenzene
lution (see also section 2.2.3). In order to measure minute [34] and maleimido-phenyl multilayers [36], the growth pro-
amounts of analyte, a wide range of micro- and nanofluidic cess of PSS-doped polyaniline films [28], PDA growth pro-
approaches were introduced in recent years [5–19]. Different cesses [37], as well as the swelling–deswelling transition of
concepts for fiber-based ATR spectroscopy have been devel- polyacrylamide brushes and thin films [31, 67]. Recent works
oped. For example, IR-transparent fibers can be coupled to showed the high application potential of in situ IRSE for the
6J. Phys.: Condens. Matter 32 (2020) 393002 Topical Review
stimuli-dependent ad- and desorption behaviors (and kinetics)
of human serum albumin (HSA) and fibrinogen, depending on
film architecture, composition, and tunable hydration state. In
the case of HSA adsorption on PAA, partial desorption was
observed when increasing the pH of the aqueous environment.
It was found that the protein structure of HSA bound within
the polymer film remains intact, which is crucial information
for bioapplications like drug release. The high chemical con-
trast of IRSE also made it possible to distinguish whether
or not a functional surface could be regarded as protein
repellent.
In situ IR ellipsometry was employed to study differ-
ent functional thin polymer films with respect to structure,
hydration, chemical properties, and molecular interactions [26,
Figure 5. Schematic of an IR ellipsometer [2] coupled with an in 31, 33, 65, 66, 69]. The method revealed pH-responsive,
situ flow cell to monitor functional polymer thin films in liquid reversible swelling and complex formation of mixed PAA-mix-
environments. Reprinted by permission from Springer Nature P2VP polyelectrolyte brushes [26, 33]; pronounced hysteresis
Customer Service Centre GmbH: Springer Nature, Ellipsometry of
Functional Organic Surfaces and Films, copyright Springer Nature effects in PAA mono brushes regarding swelling–deswelling,
2018. carboxyl dissociation and reprotonation, and ion/counterion
distribution [65]; as well as different strong and weak
carbonyl-water hydrogen-bond interactions contributing to
analysis of sensor and biofunctional surfaces [31, 36, 39, 78, swelling and hydration of oxazoline-based polymer brushes in
79]. H2 O and D2 O [66].
In this section, key applications of in situ IR ellipsome- By analyzing position and shape of vibrational markers
try for investigations of functional polymer surfaces [26, 31, like ν(C=N) and ν(C=O) bands, in situ IRSE is particularly
33, 35, 64–69] and electrochemical preparations [27, 28, 34, suited for investigating solvatochromic effects as well as spe-
36–39, 62, 78, 79] are discussed. cific molecular interactions, also in solvents other than water
[69].
3.2.1. Biofunctional polymer surfaces. Functional organic Concerning molecular interactions in particular, and the
thin films such as polymer brushes are of high technological study of biofunctional polymer thin films in general, the full
interest in various bioanalytical applications, e.g., in antimi- potential of in situ IRSE as a quantitative analytical technique
crobial surfaces, cell templates, drug delivery and biosens- was demonstrated in [31] by combining ultrasensitive mea-
ing. Figure 5 shows a schematic of a polymer brush inves- surements with theoretical calculations based upon detailed
tigated in an in situ IR ellipsometric set-up. The in situ optical models. The approach delivered simultaneous quanti-
flow cell is coupled to the IR ellipsometer, which employs a tative information on film hydration, structural and chemical
retarder prism for accurate phase measurements. The brush properties [31] of thin PNIPAAm layers and brushes in depen-
itself is prepared on, and probed through, an IR-transparent dence of external stimuli like ambient water temperature or
silicon substrate. The wedge shape of the substrate ensures humidity of air.
that measured spectra originate from a single reflection undis- PNIPAAm is a secondary amide with hydrophilic amide
turbed by window oscillations. The small wedge angle of 1.5◦ (HNCO) and hydrophobic isopropyl groups. Figure 7 gives an
enables straightforward sample handling and facilitates, e.g., overview of typical in situ IRSE spectra of PNIPAAm films
spin-coating and other preparation steps required for interface measured in different environments. Similar to the proteins
formation. discussed before, the spectra show complicated band com-
In situ IRSE was extensively applied for investigating the positions of the polymer’s amide I and II bands. Moreover,
properties of various types of mono, binary and mixed polymer there are strong overlaps of the polymer-related bands with
thin films, as well as their use for controlling protein adsorp- those of water. In traditional spectroscopy, such superimpo-
tion and desorption via external stimuli like temperature or pH sitions usually cause tremendous problems for quantitative
[21, 33, 35, 88–90, 92]. Topical applications of such films are analyses.
biomedical surfaces such as antifouling coatings and tunable PNIPAAm’s amide I band, which is mainly associated with
bioactive surfaces for drug delivery or controlled cell growth C=O stretching modes, is comprised of at least five major
[35]. components. Their vibrational frequencies depend on short-
For example, in situ IRSE provided detailed insights range hydrogen-bond interactions. Hydrogen bonding with
into the protein adsorption properties of functional polymer water molecules or neighboring amide segments of the poly-
films made from PAA, PNIPAAm, PGMA, and their block- mer chain leads to distinct oscillator redshifts. These shifts can
copolymers PNIPAAm-co-PGMA [88]. As shown in figure 6, be interpreted in combination with DFT (density functional
proteins adsorbed to these surfaces give rise to characteristic theory) calculations in order to identify and assign the vari-
amide I and II bands, which are associated with the protein sec- ous types of intra- and intermolecular interactions (see figure 7
ondary structure. An analysis of these bands revealed distinct bottom).
7J. Phys.: Condens. Matter 32 (2020) 393002 Topical Review
Figure 6. Protein adsorption and repellence observed with in situ IRSE for different types of functional thin polymer films. Reprinted with
permission from [64]. Copyright (2015) American Chemical Society.
Figure 7. Top: measured and fitted referenced tan Ψ in situ IR ellipsometry spectra and band compositions of swollen and collapsed
PNIPAAm films in various environments (left: aqueous solution below and above the LCST; right: dry and humid air). Bottom:
characteristic inter- and intra molecular interactions assigned to C=O-stretching amide I resonances. The oscillator frequency progressively
shift to lower wavenumbers with increasing number and strength of carbonyl hydrogen bonds. Reprinted with permission from [31].
Copyright (2017) American Chemical Society.
The spectra are quantitatively analyzed by optical model- respective oscillators associated with the different molecularly
ing based upon an effective-medium approach. The polymer’s interacting groups.
dielectric function is built from a sum of oscillators (describ- The fits reveal remarkable details regarding, e.g., ther-
ing the various vibrational modes) and embedded in an effec- moresponsive intra- and intermolecular interactions of the
tive dielectric medium of water and polymer. As seen in polymer’s amide groups, film swelling, hydration of the
figure 7, the IRSE optical model is able to correctly describe hydrophilic amide and hydrophobic isopropyl groups, as well
the observed in situ spectra and to automatically account for as the number of water molecules per monomer and their
the spectral overlap between polymer and solvent signatures. individual contribution to overall film hydration and specific
Moreover, structural sample information, such as swelling interactions (strong, weak, or no hydration) [31].
degree and water content of the brushes, can be extracted The above example highlights the wealth of information
from the fit via an analysis of the water vibrational bands. accessible with in situ IRSE. The ability to investigate and
Molecular interactions are quantified by the amplitudes of the quantify molecular interactions and structural properties of
8J. Phys.: Condens. Matter 32 (2020) 393002 Topical Review
by pulsed deposition from an aqueous solution containing
pyrrole molecules. The amount of deposited PPy scales with
the number of potential pulses applied in the electrochemical
deposition process. From lower to higher number of depo-
sition pulses (top to bottom spectra), the band amplitudes
due to C–H and N–H vibrations at about 1180 cm−1 and
1050 cm−1 , respectively, are increasing [107, 108]. The N–H
vibrational band might overlap with weak bands related to
SiOx vibrations. However, a strong oxidation of the inter-
face can be ruled out because no significant band associated
with the Berreman mode of the silicon oxide is found around
1220 cm−1 .
3.2.3. Current in situ IRSE improvements. Important novel
developments of in situ IRSE are the extension of polari-
metric set-ups by brilliant light sources such as QCLs [92,
114–116, 130], and the implementation of more advanced
measurement schemes such as Mueller-matrix ellipsometry
[93, 112].
3.2.3.1. Mueller-matrix ellipsometry. Recent technical advan-
cements showed that IR Mueller-matrix (MM) ellipsometry
can be used to study complex thin films [69, 93, 112]. This
extended ellipsometric technique measures not only changes in
co-polarization (pp, ss) but also cross-polarization (ps, sp) and
depolarization. MM ellipsometry is therefore of high interest
for investigations of anisotropic and/or depolarizing thin films,
in particular of adsorption processes, which are anisotropic
processes by nature. A first study [93] proved it feasible to
Figure 8. (a) Schematic of an electrochemical in situ cell for IRSE measure the partial 4 × 3 MM of a 68 nm thin PGMA film
measurements. (b) IR ellipsometric monitoring of the at the polymer–water interface. Sub-minute time resolutions
electrochemical deposition of polypyrrole (PPy). Smoothed tan Ψ
were reported for monitoring the relaxation of an anisotropic,
spectra (normalized to tan Ψ of the H-passivated Si(111) surface
before the preparation) with increasing number of anodic potential stretched polyethylene foil [93]. Highly sensitive full 4 × 4
pulses are shown from top to bottom. Reprinted with permission IR MM measurements were also demonstrated recently [112],
from [12]. Copyright (2018) American Chemical Society. opening the door for in-depth in situ investigations of thin
films.
ultrathin films is an important building block for miniaturiza- 3.2.3.2. Brilliant light sources. Another interesting upgrade
tion toward microfluidic concepts. for in situ IRSE are brilliant light sources, as they enable spa-
tially and temporally higher-resolved measurements. Employ-
3.2.2. Electrochemical applications. In situ IR ellipsome- ing such sources allows the study of homogeneity effects, the
try has been applied for monitoring various electrochemical investigation of smaller volumes, and the analysis of non-
preparations, among them functional interfaces of oligomers cyclic, time-dependent processes.
of small molecules like nitrobenzene [34, 38], maleimido- A decade ago, using the in situ IRSE set-up at the BESSY II
phenyl [36], functionalized graphene [39, 78, 79], as well as synchrotron facility, the chemical and structural homogeneity
polymers for hybrid organic solar cells [27, 28, 61, 62] and of a binary polyelectrolyte brush, consisting of PEG and PAA-
biofunctional applications [37, 39, 79]. b-PSS, could be investigated with a spot size of about 1 mm2
Figure 8(a) shows an electrochemical in situ cell for IR [68].
ellipsometric measurements. The cell comprises a silicon top Recent developments [114–116] demonstrate that such
window as substrate (WE: working electrode) and is equipped studies can also be performed in standard laboratory
with a contact to a potentiostat for electrochemical depo- environments. For example, the combination of a QCL with
sition (CE: counter electrode, RE: reference electrode). A a single-shot ellipsometer design based upon four parallel
quartz window is mounted on the opposite side of the liq- polarization-state detection channels was able to translate
uid reservoir, allowing for complementary measurements by, many advantages of IR synchrotron ellipsometry to the lab.
e.g., reflectance anisotropy spectroscopy (RAS) [27] or Raman In references [124, 125], the world’s first IR laser-based
back-scattering spectroscopy. polarimeter for measurements in a reflection geometry with
As an example for the in situ monitoring of an electro- high spectral (J. Phys.: Condens. Matter 32 (2020) 393002 Topical Review
volumes and the investigation of time-dependent processes in
the ms and even μs range.
3.3. SEIRA microfluidics
Methods for destruction-free, label-free analysis of μL and nL
liquid volumes are important for multiple bioanalytical appli-
cations and could be a key component in the realization of
novel concepts, e.g., for personalized medicine or in biosens-
ing. Integrating these methods with microfluidics enables one
to apply the wide variety of established microfluidic tech-
niques for reliable and reproducible sample manipulation,
providing a high level of control over the fluidic environ-
ment and other sample-related process and preparation param-
eters. With these capabilities, IR microfluidic sensing can be
important in molecule-specific chemical and structural detec-
tion, which is relevant for drug development and down-stream
bioanalytics. Promising developments in this direction are
approaches involving SEIRA interfaces for microfluidic chips
that enable studies of liquids with low analyte concentrations
[12, 88]. Furthermore, the ability to work with small vol-
umes on the scale of μL to nL opens up the technology to
any application where the sample amount is strongly lim-
ited, as it is often the case in biosensing and other biomedical
applications. Figure 9. In situ SEIRA optofluidic cell [12] for in situ nL IR
Combining microfluidics for sample handling with an IR sensing. (a) Schematic of the optofluidic cell. Adapted with
microscopic set-up in an internal reflection geometry (see permission from reference [12]. Copyright (2018) American
Chemical Society. (b) Chemical imaging (10 μm step size) of a
section 2.1) or an external reflection geometry (such as it is 100 μm wide microfluidic channel filled with water; color coding
also used in IRRAS, see section 2.2.1) is a powerful approach refers to the intensity of the water stretching vibrational mode.
to conduct investigations using minute sample volumes down
to a few nL. The utilization of plasmonic enhancement sub-
strates is required for signal enhancement (see section 2.3.2) to be used in conventional and commercially available IR
in order to analyze such small volumes within reasonable mea- microscopes, but can also be adapted for applications in other
surement times and with sufficient sensitivity in measurements IR and IRSE set-ups. The microfluidic chip can be fabri-
where sampling areas are only a few hundreds of μm2 . Using cated from different materials commonly used in microflu-
these types of substrates increases sensitivity by several orders idics, such as glass or polymers. Various microfluidic chip
of magnitude. designs can be realized. The optofluidic platform’s large acces-
Various types of plasmonic films and nanostructures have sible measurement area enables chemical mapping on different
been developed and applied for ex situ applications [98–105]. domains of the microfluidic chip. Beside point-by-point map-
Roughened gold electrodes and metal-island films [98, 99] ping, a focal plane array can also be used for channel imaging
provide broadband enhancement over the whole surface and [14–17, 87].
the full MIR region at moderate enhancement factors (‘usually Figure 9(b) shows an image of a 2D map (10 μm steps
found to be in the 10–100 region’ [99]). Larger, but spatially in x and y direction, using an IR microscope at the BESSY
and spectrally highly confined, enhancement (up to 107 ) can be II synchrotron) along a microfluidic channel, with color-
achieved by tailored nanoantennas and related nanostructures coded intensity of the water stretching vibration. This partic-
[100–104]. The potential of integrating enhancement sub- ular microfluidic chip comprised four long straight channels
strates with microfluidics for in situ applications has already (100 μm width, 37 μm depth, 42 mm length) with a total vol-
been demonstrated regarding the analysis of protein secondary ume of approximately 155 nL each. In this configuration, the
structures [88]. effective measurement volume and area were about 1.1 nL and
In a recent publication [12], an optofluidic cell [130] was 3 × 10⁻⁴ cm2 , respectively.
presented that integrates gold-island film substrates fabricated By employing an enhancement substrate, high sensitivities
on an IR transparent silicon substrate for signal enhance- with a limit of detection (LOD) in the range of a few ng cm−2
ment for in situ SEIRA sensing with sub-monolayer sensi- are achieved. With such LOD, investigations of the kinetics of
tivity in nL volumes. Figure 9(a) schematically shows the adsorption/desorption processes and monolayer formation at
SEIRA optofluidic cell (in a simple reflection geometry), the solid–liquid interface become feasible.
which can incorporate measurement windows made from dif- In the following, two examples are presented that high-
ferent IR-transparent materials functionalized with a gold- light the potential of the optofluidic platform for diverse in situ
island film for signal enhancement. The cell was designed applications.
10J. Phys.: Condens. Matter 32 (2020) 393002 Topical Review
Figure 10. In situ SEIRA optofluidic study of the adsorption
kinetics of 4-NBM on functionalized and bare gold-island film
substrates. (a) Schematic of the investigated interfaces. (b) Time
dependent development of the normalized peak amplitude of the
NO2 vibrational band of 4-NBM on the different interfaces. Figure 11. Study of the binding of streptavidin on a biotinylated
Reprinted from [39], Copyright (2018), with permission from enhancement substrate. (a) Schematic of process in which
Elsevier. streptavidin binds one biotin molecule per binding pocket. (b) In situ
microscopic IR spectra obtained at different time points. Spectra are
referenced to an initial spectrum of the channel filled with PBS
buffer. Reprinted with permission from [12]. Copyright (2018)
In the first example, the platform was applied to inves- American Chemical Society.
tigate the adsorption kinetics of (4-nitrobenzyl) mercap-
tane (4-NBM) on an enhancement substrate functionalized
with p-maleimido-phenyl (p-MP) modified graphene [113, The second example investigates the adsorption process
114] (see figure 10). The binding process between the 4- of streptavidin on a biotinylated enhancement substrate (see
NBM and the p-MP residues of the functionalized enhance- figure 11). This example demonstrates the possibility given
ment substrate [39] is depicted in figure 10(a). In order by the optofluidic cell to monitor molecular deposition also
to gain evidence on the nature of the binding process, on a previously functionalized enhancement substrate, which
the adsorption kinetics have been compared to the one is of high relevance for investigating the formation of func-
observed on an unmodified enhancement substrate (see figure tional surfaces in biosensing applications and molecular
10(b)). sensing. Furthermore, the capability to measure with sub-
The presented time-dependent adsorption curves show the monolayer sensitivity can be exploited to elucidate struc-
normalized peak amplitude reflectivity of 4-NBM’s nitro- tural changes of proteins during an adsorption/binding pro-
group vibrational band around 1522 cm−1 measured for cess. This is highly relevant for the investigation of biosens-
the graphene-functionalized (black stars) and unmodified ing interfaces but also for studies on the interaction between
enhancement substrate (red rectangles). Distinct differences molecules and proteins in biomedical and pharmaceutical
in the adsorption kinetics are observed for the different inter- research.
faces. In the case of 4-NBM adsorption on the unmodified Figure 11(b) shows exemplary in situ IR spectra at selected
enhancement substrate, the exponential increase in the band time points of the adsorption of streptavidin on the biotiny-
amplitude is indicative of a zero-order reaction, as is typically lated enhancement. Characteristic amide I and II vibrational
found in the adsorption of thiolated molecules on gold inter- bands related to the protein secondary structure can be identi-
faces. In the case of adsorption on the functionalized enhance- fied. The amide I band is centered around 1637 cm−1 , which
ment substrate, the kinetics show a higher-order polynomial is commonly associated with a high content of β-sheet struc-
progression. This kind of kinetics is indicative of a higher- ture elements in a protein [80], and correlates well with the
order reaction process, e.g., a Michael addition reaction cre- known β-barrel structure of streptavidin’s native state [40].
ating a bond between the thiol group of 4-NBM and the imide The dynamic changes in the shape of the amide I and II band
group of p-MP. A further indicator for a more complex binding are indicative of changes in the protein secondary structure as
reaction is the increased time it takes to reach a saturation in a consequence of the binding of streptavidin molecules on the
the adsorption curve. These findings supported the assumption biotinylated surface [131].
of a chemisorption of 4-NBM on the p-MP functionalized Further studies are required to unravel the details of the
surface. underlying processes. However, with carefully performed
11J. Phys.: Condens. Matter 32 (2020) 393002 Topical Review
complementary measurements and/or optical simulations, addition to SEIRA [107, 130], these developments will be of
a detailed analysis of the structural properties could be high interest to study numerous novel sensing applications.
performed. Notably, only the last spectrum of the series Prominent examples are identification and structure analy-
corresponds to an adsorbed protein monolayer, i.e., to the sis, as well as gaining a better understanding of the dynam-
maximum amount of streptavidin that can be bound to the ics of molecular interactions and processes at solid–liquid
interface. All other spectra show sub-monolayer protein cov- interfaces.
erages. Using literature values for the surface density of a
streptavidin layer on a biotinylated interface [132], an LOD
can be calculated from the amide I band area of the satu- 4. Summary
rated monolayer. Taking into account the slightly increased
surface area due to the roughness of the gold-island film, an ATR, IR ellipsometry and SEIRA microfluidics have been pre-
effective surface density of (4.16 ± 0.16) pmol cm−2 is found sented as methods for destruction-free and label-free in situ IR
for the monolayer. The noise level in the measurement corre- spectroscopy in mL to nL flow cells. Multiple technological
sponds to an estimated LOD of (0.12 ± 0.01) pmol cm−2 or developments render in situ IR spectroscopy a rapidly devel-
(7.1 ± 0.3) ng cm−2 . oping field for analytics of lowest liquid volumes and sub-
monolayer coverages with high sensitivity for chemical, struc-
3.3.1. Current SEIRA microfluidics improvements. tural and time-dependent properties. Recent advancements in
the coupling of fibers and waveguides, the use of porous
3.3.1.1. Optofluidic platform. The development of an optoflu-
and versatile enhancement substrates, and the involvement
idic platform opens up the possibility to use minute amounts
of laboratory IR laser sources have significantly broadened
of samples for the investigation by SEIRA spectroscopy.
the area of applications and proved in situ IR spectroscopy
Its exceptional sensitivity and the possibility to gain infor-
to be a vital and fast developing research and technological
mation on the chemical structure of the molecule ren-
field.
ders the presented system highly interesting for a variety
Particularly the technological developments allowing
of applications, in particular in the fields of environmen-
miniaturization and variable operational areas are of high
tal and biosensing. The additional ability to study inter-
importance for bio- and environmental analytics. Here the use
and intramolecular interactions gives an interesting lead
of enhancement interfaces or fiber optics leads to increases of
into developing novel strategies for ex vivo studies to ana-
detection limits even when studying smallest liquid volumes.
lyze interactions between proteins and molecules, e.g., in
The incorporation of (pulsed) brilliant IR sources in IR
biomedical research. Access to information on molecule- and
methods helps to realize optical set-ups with high optical
environment-specific interactions are of particular interest, as
throughputs, faster and spatially higher resolved measure-
they may provide information on disease-related mechanisms,
ments with significant improvements regarding hyperspectral
which might help to identify new targets for treatments, or
imaging and time-resolved measurements in the μs to ms
aid in the evaluation of the mode of action of potential novel
range. New laser-based MIR technological developments
drugs.
exhibit a high potential for biomedical and electrochemical
Further improvements and multi-modal usage of the
in situ applications. Different methodical concepts for the
optofluidic platform are possible. In the case of the enhance-
MIR already exist and are being transferred for in situ studies,
ment substrates, using metals other than gold for the plasmonic
e.g. (i) measuring optically [133], (ii) detecting the near-field
nanostructure, such as copper or other catalytically active met-
scattered light [135], (iii) and detection of the photothermal
als, could enable in situ studies of catalytic processes at such
expansion [134, 136]. In addition, methods based on fre-
interfaces. Moreover, the possibilities arising from the inte-
quency comb techniques [137, 138] further broaden the range
gration of other microfluidic concepts could allow a transla-
of future brilliant IR spectroscopic developments. Beside the
tion of the method, e.g., to electrochemical studies or to the
experimental advancements, also the optical interpretation of
investigation of cell cultures, potentially extending the range
measured spectra was further refined by applying numerical
towards organ-on-chip systems or other highly integrated lab-
and analytical optical simulations.
on-chip platforms. Also, the combination with downstream
In summary, the recent technological advances of in situ
analytics such as mass spectrometry is of high interest for
IR spectroscopy have, to our opinion, pushed new frontiers in
future applications.
studying thin films at solid–liquid interfaces. These advances
3.3.1.2. Brilliant light sources. As shown in figure 9, the com- make it possible to address important questions and chal-
bination of the discussed optofluidic concept with a brilliant lenges in the research of catalysis [e.g. 139], chemical pro-
light source facilitates laterally highly resolved mapping of a cesses [e.g. 9], batteries [e.g. 82], protein analytics [e.g. 89],
microfluidic channel. drug testing [e.g. 90], clinical applications [e.g. 140], point-
Currently, we are working on the adaption and incorpora- of-care medical diagnosis [e.g. 81, 83, 90] and environmen-
tion of the optofluidic cell into a new QCL-based single-shot tal analytics [e.g. 91]. Investigations by in situ IR spec-
ellipsometer (see also section 3.2.3). For individual spots in troscopy yield complementary information in these applica-
the optofluidic cells, the use of the QCL provides time reso- tions and offer the advantage of providing insights on the
lutions on the order of milli- to microseconds. In combination chemical and structural properties of molecules and molecular
with multi-method investigations that integrate, e.g., SERS in interactions.
12J. Phys.: Condens. Matter 32 (2020) 393002 Topical Review
Acknowledgments [14] Kaun N, Vellekoop M J and Lendl B 2006 Time-resolved Fourier
transform infrared spectroscopy of chemical reactions in
We are indebted to T Oates and D Gkogkou for coopera- solution using a focal plane array detector Appl. Spectrosc.
60 1273–8
tion in the field of enhancement substrates and in situ vibra- [15] Hinsmann P, Haberkorn M, Frank J, Svasek P, Harasek M and
tional sensing, D Janasek in the field of microfluidics, and U Lendl B 2001 Time-resolved FT-IR spectroscopy of chemi-
Schade and M Gensch in the field of synchrotron IR spec- cal reactions in solution by fast diffusion-based mixing in a
troscopy. We acknowledge technical support by I Engler and micromachined flow cell Appl. Spectrosc. 55 241–51
Ö Savas, and financial support by the European Union through [16] Kakuta M, Hinsmann P, Manz A and Lendl B 2003 Time-
resolved Fourier transform infrared spectrometry using a
EFRE 1.8/13, as well as financial support by the Ministerium micro fabricated continuous flow mixer: application to pro-
für Kultur und Wissenschaft des Landes Nordrhein-Westfalen, tein conformation study using the example of ubiquitin Lab
Der Regierende Bürgermeister von Berlin-Senatskanzlei Wis- Chip 3 82–5
senschaft und Forschung, and the Bundesministerium für Bil- [17] Baena J R, Kulka S, Kaun N, Frank J, Svasek P, Moss D,
dung und Forschung. Vellekoop M J and Lendl B 2004 Mid-IR synchrotron radi-
ation for molecular specific detection in microchip-based
analysis systems Anal. Bioanal. Chem. 378 1735–40
ORCID iDs [18] Ewing A V, Clarke G S and Kazarian S G 2016 Attenuated total
reflection-Fourier transform infrared spectroscopic imaging
Christoph Kratz https://orcid.org/0000-0002-4046-0760 of pharmaceuticals in microfluidic devices Biomicrofluidics
10 024125
Andreas Furchner https://orcid.org/0000-0002-5448-7956 [19] Chang Y-C, Wägli P, Paeder V, Homsy A, Hvozdara L, van der
Jörg Rappich https://orcid.org/0000-0003-4219-6964 Wal P, Francesco J D, de Rooij N F and Herziga H P 2012
Karsten Hinrichs https://orcid.org/0000-0002-6580-7791 Cocaine detection by a mid-infrared waveguide integrated
with a microfluidic chip Lab Chip 12 3020–3
[20] Jouy P et al 2014 Mid-infrared spectroscopy for gases and liq-
References uids based on quantum cascade technologies Analyst 139
2039–46
[21] Lucas P and Bureau B 2011 Advanced Infrared Glasses
[1] Griffiths P R and Chalmers J 2006 Handbook of Vibrational for Biochemical Sensing (Biointerface Characterization by
Spectroscopy vol 2 (Chichester: Wiley) Advanced IR Spectroscopy) ed Pradier C M and Chabal Y
[2] Hinrichs K and Eichhorn K-J 2018 Ellipsometry of Functional J (Amsterdam: Elsevier) ch 8
Organic Surfaces and Films (Springer Series in Surface [22] Eccleston R, Wolf C, Balsam M, Schulte F, Bongards M and
Sciences) 2nd edn (Heidelberg: Springer) Rehorek A 2016 Mid-infrared spectroscopy for monitoring
[3] Schasfoort R B M (ed) 2017 Handbook of Surface Plasmon Res- of anaerobic digestion processes–prospects and challenges
onance 2nd edn (Croydon: The Royal Society of Chemistry) Chem. Eng. Technol. 39 627–36
[4] Sauer M, Hofkens J and Enderlein J 2011 Handbook of Fluores- [23] Minnich C B, Buskens P, Steffens H C, Bäuerlein P S, Butvina
cence Spectroscopy and Imaging: From Single Molecules to L N, Küpper L, Leitner W, Liauw M A and Greiner L 2007
Ensembles (Weinheim: Wiley) Highly flexible fibre-optic ATR-IR probe for inline reaction
[5] Chan K L A, Gulati S, Edel J B, de Melloband A J and Kazar- monitoring Org. Process Res. Dev. 11 94–7
ian S G 2009 Chemical imaging of microfluidic flows using [24] Schädle T and Mizaikoff B 2016 Mid-infrared waveguides: a
ATR-FTIR spectroscopy Lab Chip 9 2909–13 perspective Appl. Spectrosc. 70 1625–38
[6] Chan K L A, Niu X, de Mellob A J and Kazarian S G 2010 Rapid [25] Steiner H et al 2003 In Situ sensing of volatile organic
prototyping of microfluidic devices for integrating with FT- compounds in groundwater: first field tests of a mid-
IR spectroscopic imaging Lab Chip 10 2170–4 infrared fiber-optic sensing system Appl. Spectrosc.
[7] Holman H Y N, Miles R, Hao Z, Wozei E, Anderson L M 57 607–13
and Yang H 2009 Real-time chemical imaging of bacte- [26] Hinrichs K, Aulich D, Ionov L, Esser N, Eichhorn K-J,
rial activity in biofilms using open-channel microfluidics Motornov M, Stamm M and Minko S 2009 Chemical
and synchrotron FTIR spectromicroscopy Anal. Chem. 81 and structural changes in a pH-responsive mixed polyelec-
8564–70 trolyte brush studied by infrared ellipsometry Langmuir 25
[8] Karabudak E 2014 Micromachined silicon attenuated total 10987–91
reflectance infrared spectroscopy: an emerging detection [27] Sun G, Zhang X, Kaspari C, Haberland K, Rappich J and Hin-
method in micro/nanofluidics Electrophoresis 35 236–44 richs K 2012 In Situ monitoring the growth of polypyr-
[9] Perro A, Lebourdon G, Henry S, Lecomte S, Servant L and role films at liquid/solid interface using a combination of
Marre S 2016 Combining microfluidics and FT-IR spec- polarized infrared spectroscopy and reflectance anisotropy
troscopy: towards spatially resolved information on chem- spectroscopy J. Electrochem. Soc. 159 H811–5
ical processes React. Chem. Eng. 1 577–94 [28] Sun G, Zhang X, Rappich J and Hinrichs K 2015 In situ infrared
[10] Greener J, Abbasi B and Kumacheva E 2010 Attenuated total ellipsometric monitoring of the growth process of polyani-
reflection Fourier transform spectroscopy for on-chip moni- line thin films and doping with poly(4-styrenesulfonate)
toring of solute concentrations Lab Chip 10 1561–6 Appl. Surf. Sci. 344 181–7
[11] Chan K L A and Kazarian S G 2013 Aberration-free FTIR [29] Baumgartner B, Hayden J, Schwaighofer A and Lendl B 2018 In
spectroscopic imaging of live cells in microfluidic devices Situ IR spectroscopy of mesoporous silica films for monitor-
Analyst 138 4040–7 ing adsorption processes and trace analysis ACS Appl. Nano
[12] Kratz C, Furchner A, Oates T W H, Janasek D and Hinrichs K Mater. 1 7083–91
2018 Nanoliter sensing for infrared bioanalytics ACS Sens. [30] Baumgartner B, Hayden J, Loizillon J, Steinbacher S, Grosso
3 299–303 D and Lendl B 2019 Pore size-dependent structure of con-
[13] Lehmkuhl B, Noblitt S D, Krummel A D and Henry C S fined water in mesoporous silica films from water adsorp-
2015 Fabrication of IR-transparent microfluidic devices by tion/desorption using ATR–FTIR spectroscopy Langmuir
anisotropic etching of channels in CaF2 Lab Chip 15 4364–8 35 11986–94
13You can also read