Surface Engineered Iron Oxide Nanoparticles Generated by Inert Gas Condensation for Biomedical Applications - MDPI
←
→
Page content transcription
If your browser does not render page correctly, please read the page content below
bioengineering

Article
Surface Engineered Iron Oxide Nanoparticles Generated by
Inert Gas Condensation for Biomedical Applications
Aver Hemben, Iva Chianella and Glenn John Thomas Leighton *

                                          Surface Engineering and Precision Institute, Cranfield University, Bedfordshire MK430AL, UK;
                                          hemben@cranfield.ac.uk (A.H.); i.chianella.1998@cranfield.ac.uk (I.C.)
                                          * Correspondence: g.j.t.leighton@cranfield.ac.uk

                                          Abstract: Despite the lifesaving medical discoveries of the last century, there is still an urgent need
                                          to improve the curative rate and reduce mortality in many fatal diseases such as cancer. One of
                                          the main requirements is to find new ways to deliver therapeutics/drugs more efficiently and only
                                          to affected tissues/organs. An exciting new technology is nanomaterials which are being widely
                                          investigated as potential nanocarriers to achieve localized drug delivery that would improve therapy
                                          and reduce adverse drug side effects. Among all the nanocarriers, iron oxide nanoparticles (IONPs)
                                          are one of the most promising as, thanks to their paramagnetic/superparamagnetic properties, they
                                          can be easily modified with chemical and biological functions and can be visualized inside the body
                                          by magnetic resonance imaging (MRI), while delivering the targeted therapy. Therefore, iron oxide
                                nanoparticles were produced here with a novel method and their properties for potential applications
                                   in both diagnostics and therapeutics were investigated. The novel method involves production of free
Citation: Hemben, A.; Chianella, I.;      standing IONPs by inert gas condensation via the Mantis NanoGen Trio physical vapor deposition
Leighton, G.J.T. Surface Engineered       system. The IONPs were first sputtered and deposited on plasma cleaned, polyethylene glycol (PEG)
Iron Oxide Nanoparticles Generated        coated silicon wafers. Surface modification of the cleaned wafer with PEG enabled deposition of free-
by Inert Gas Condensation for             standing IONPs, as once produced, the soft-landed IONPs were suspended by dissolution of the PEG
Biomedical Applications.                  layer in water. Transmission electron microscopic (TEM) characterization revealed free standing, iron
Bioengineering 2021, 8, 38.
                                          oxide nanoparticles with size < 20 nm within a polymer matrix. The nanoparticles were analyzed also
https://doi.org/10.3390/
                                          by Atomic Force Microscope (AFM), Dynamic Light Scattering (DLS) and NanoSight Nanoparticle
bioengineering8030038
                                          Tacking Analysis (NTA). Therefore, our work confirms that inert gas condensation by the Mantis
                                          NanoGen Trio physical vapor deposition sputtering at room temperature can be successfully used as
Academic Editors: Ashiqur Rahman,
Md Symon Jahan Sajib and
                                          a scalable, reproducible process to prepare free-standing IONPs. The PEG- IONPs produced in this
Si Amar Dahoumane                         work do not require further purification and thanks to their tunable narrow size distribution have
                                          potential to be a powerful tool for biomedical applications.
Received: 13 January 2021
Accepted: 13 February 2021                Keywords: iron oxide nanoparticles; PVD; Mantis NanoGen Trio; drug delivery
Published: 15 March 2021

Publisher’s Note: MDPI stays neutral
with regard to jurisdictional claims in   1. Introduction
published maps and institutional affil-
                                               Over the last two decades, nanoparticles have captured much research interest due to
iations.
                                          their great potential for biomedical applications. Due to the need for improved diagnostics
                                          and therapeutics methods for musculoskeletal ailments, scientists have been exploring
                                          the use of several types of nanomaterials, including metal nanoparticles conjugated with
                                          biological molecules both for diagnostics and for delivery of drugs only to affected or-
Copyright: © 2021 by the authors.         gans/tissues reducing adverse side effects and improving therapy [1]. Physical, chemical
Licensee MDPI, Basel, Switzerland.        and biological methods for developing metal nanoparticles include mechanical milling,
This article is an open access article    physical vapor deposition and sputtering [2]. Chemical reactions develop nanoparticles
distributed under the terms and
                                          via precipitation [3] of ions followed, in many cases, by their oxidation or reduction [4].
conditions of the Creative Commons
                                          Other chemical methods available for the synthesis of metal nanoparticle include sol gel [5],
Attribution (CC BY) license (https://
                                          co-precipitation, particularly for iron oxide nanoparticles [6] colloidal [7] and hydrothermal
creativecommons.org/licenses/by/
                                          nanoparticle synthesis [7,8], gas phase methods [8] and electrodeposition [9]. Further
4.0/).

Bioengineering 2021, 8, 38. https://doi.org/10.3390/bioengineering8030038                            https://www.mdpi.com/journal/bioengineering
Bioengineering 2021, 8, 38                                                                                           2 of 12

                             development has led to other methods including polymer matrix-mediated synthesis [10],
                             precipitation using microemulsions [11] and vesicles [12].
                                   Among all the metal nanoparticles, iron oxide nanoparticles (IONPs) are one of the
                             most promising for biological applications [13,14]. In fact, they can be easily produced
                             with magnetic properties (i.e., IONPs with uniform surface and sizes < 20 nm are often
                             superparamagnetic [15]) that facilitate their handling during chemical/biological function-
                             alization as well as visualization by magnetic resonance imaging (MRI) when inside the
                             body for clinical diagnostics Thanks to their clinical safety, utility and versatility IONPs
                             have actually already been used in medicine for decades. Due to their property to slowly re-
                             lease iron, iron oxide-cabohydrates complexes or colloids have been used for the treatment
                             of iron deficiency anemia. Similarly, due to IONPs’ magnetic fluid hyperthermia, which is
                             the property to produce heat locally when the nanoparticles are exposed to an alternating
                             magnetic field, they have been exploited to kill cells in cancer tissues for an effective and
                             safe (minimal side effects) cancer therapy [16]. IONPs display different magnetic char-
                             acteristics according to the method of production as a result of structural disorder [17],
                             creation of antiphase boundaries [18] or existence of mechanically dead layers at the surface
                             of the particles [19]. Paramagnetic interaction between particles and flocculation due to
                             Vander Waals forces necessitates surface modification in the form of a dense coating to
                             achieve particle stability. In addition to magnetic forces between single particles, within
                             the magnetic field, magnetic interactions between particles clusters can also take place [20].
                                   According to [21] further research exploring fabrication techniques for nanomaterials,
                             especially applications of IONPs with diverse features, will contribute to innovation in
                             a variety of areas. Optimized and scalable synthesis is critical for the development of
                             nanomaterials to be used in pre-clinical and clinical applications [22]. Other physical,
                             chemical, thermal and mechanical characteristics of IONPs that can be exploited in biomed-
                             ical applications include cellular labelling and separation, tissue repair, drug delivery,
                             magnetic resonance imaging hyperthermia and magnetofection [20–22]. With the frequent
                             investigation of the use of metal nanoparticles in biological systems, IONPs toxicity levels
                             have been assessed in several scientific investigations. IONPs modified with biocompatible
                             polymers exhibit low level toxicity, when used in diluted conditions [23]. They have also
                             shown useful blood circulation time and cells’ internalization efficiency [23].
                                   In order to improve their stability and biocompatibility, IONPs can be dispersed in
                             specific inorganic or polymeric solutions [24] as well as in natural gelatin, dextran and
                             chitosan solutions [24–26]. Without modification, IONPs possess hydrophobic surfaces
                             and a large surface area to volume ratio. The hydrophobic intra particulate interactions
                             cause the iron oxide particles to agglomerate and produce larger clusters with a resultant
                             increase in particle size with changes in magnetic attractions [25]. Synthetic polymers used
                             for coating IONPs include poly (ethylene-co-vinyl acetate), poly (vinylpyrrolidone), poly
                             (lactic-co-glycolic acid), poly (ethylene glycol) (PEG), poly (vinyl alcohol) and polyethylene
                             imine (PEI) [25,26]. In addition to increasing stability, coatings of PEG and short chain
                             PEI have been shown to enhance biocompatibility [26]. PEG can be non-covalently immo-
                             bilized on the nanoparticle surface to enhance their properties as nanocarriers for drug
                             delivery. Intracellular delivery of drugs into specific tissues and organs for gene therapy
                             remains a major challenge [26]. Nanoparticles, including IONPs, have the potential to
                             facilitate gene delivery only to the affected tissues without or with minimal accumulation
                             on healthy tissues.
                                   Production of metal nanoparticles by inert gas condensation (IGC) and magnetron
                             sputtering is a technique developed for generating and depositing nanoparticles on a
                             substrate [27–30] from a target attached to a magnetron suspended in an inert gas- filled
                             agglomeration chamber [31]. IGC and magnetron sputtering is recognized as a convenient
                             and low costs method to produce metal nanoparticles on a substrate with desired compo-
                             sition, size, structure, shape and defect density [32]. Although the Mantis NanoGen Trio
                             IGC system, utilized in this work, was used to generate and deposit ‘simple’ IONPs, the
                             instrument has positions for potentially three different metal targets, enabling, if desired,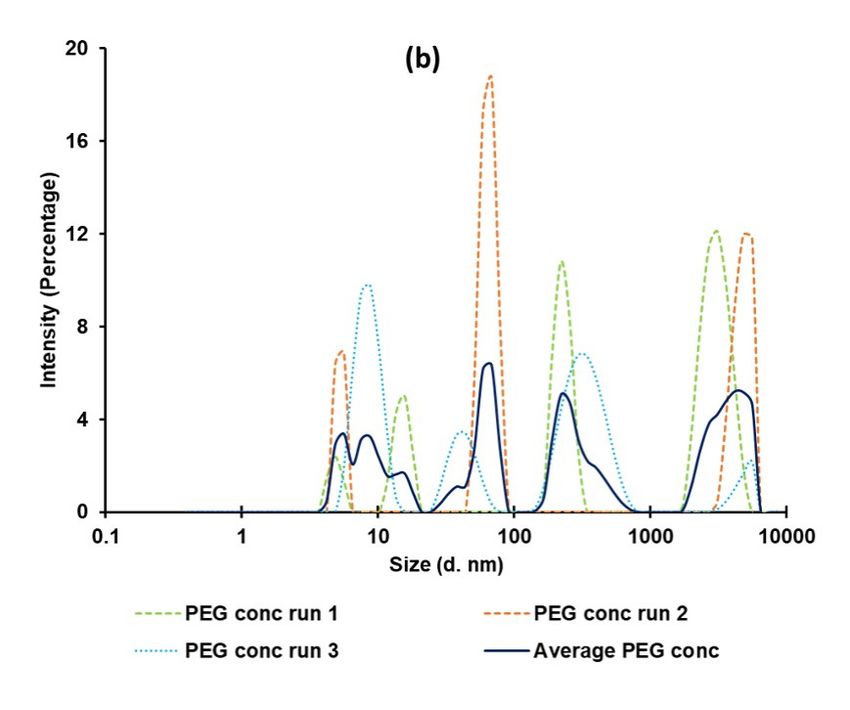
Bioengineering 2021, 8, 38                                                                                            3 of 12

                             sputtering and deposition of multi-metal nanoparticles [31]. IGC with magnetron sputter-
                             ing has been used to sputter several types of metal nanoparticles including aluminum [33],
                             copper [34], molybdenum [35], platinum [27], titanium [36] and iron oxide nanoparticles.
                             Titanium oxide nanoparticles < 5 nm were obtained by IGC for applications in gas sensors
                             and photo-catalytic processes [36]. Although IONPs are already known to be biocompati-
                             ble [16,37,38], to the best of our knowledge, this is the first time that IGC has been used as a
                             method for producing free standing PEG coated IONPs, which, therefore, are highly likely
                             to be biocompatible and this will be confirmed in the future. Hence, this work describes
                             for the first time the use of IGC for production of PEGylated, free-standing, soft landed
                             IONPs with narrow size distribution with, therefore, great potential for application in drug
                             delivery. In fact, the small size and narrow size distribution of the particles described in
                             this work are an advantage over the comparatively wider size distribution produced by
                             other methods [39]. Smaller nanoparticles are suitable for use in biomedical applications,
                             especially when drugs need delivering inside cells. In fact, their small size not only permits
                             the nanoparticles to cross the cells membrane, but allows for a more efficient excretion,
                             hence minimizing accumulation in organs and tissues, where otherwise they may cause
                             long term damage. One of the main features that affects biodistribution of nanomaterials in
                             the body is their size and size distribution [40]. Therefore, it is very important to have tai-
                             lored nanoparticles with narrow size distribution, as for such particles the biodistribution
                             and excretion from the body can be predicted.
                                   Hence, the work here demonstrates that by using the IGC via the Mantis NanoGen Trio
                             system, IONPs with narrow size distribution, coated with biocompatible polymers such as
                             PEG can be synthesized at ambient temperature in a reproducible way with minimal user
                             intervention. Once synthesized the IONPs were characterized and their biocompatibility
                             and use for drug delivery is currently under investigation.

                             2. Materials and Methods
                             2.1. Materials and Equipment
                                  Phosphate buffered saline (PBS), RNAse free water and PEG 1000 Mwt were pur-
                             chased from Sigma (Dorset, UK), while acetone was purchased from Fisher Scientific
                             (Loughborough, UK). Iron oxide (Fe3 O4 ) targets were purchased from Kurt J. Lesker Com-
                             pany Ltd. (East Sussex, UK). Mantis NanoGen Trio was purchased from Mantis Deposition
                             Ltd. (Thame, UK) and was coupled to a Chemical Vapor Deposition chamber purchased
                             from Scientific Vacuum Systems (Wokingham, UK).

                             2.2. Preparation of the Silicon Wafer Substrates
                                  Silicon wafers (1 inch purchased from Agar Scientific Ltd, Essex, UK), were first
                             plasma cleaned for 3 min in oxygen using a plasma cleaner purchased from Diener Plasma
                             Surface Technology (Ebhsausen, Germany), to remove surface impurities and reduce
                             hydrophobicity of the surface. PEG dissolved in acetone (0.2 g/mL) was then spin-coated
                             on the clean wafers at 3000 rpm using a spin coater purchased from Electronic Micro
                             Systems Ltd., (Sutton Coldfield, UK). In order to assess the volume of PEG spin coated
                             on the surface, the wafers were weighed before and after spin coating with the difference
                             in weight representing the mass of PEG attached. After modification with PEG, the
                             wafers were characterized by contact angle measurements taken by a tensiometer equipped
                             with Attension software, Biolin Scientific (Stockport, UK) and using deionized (DI) water.
                             Measurement of the thickness of the PEG layer was conducted using DektakXT stylus
                             profiler, Bruker (Coventry, UK).

                             2.3. Production of IONPs by Mantis NanoGen Trio System
                                  The Mantis NanoGen Trio with three 1-inch diameter targets system sputters into
                             the argon filled agglomeration chamber during formation of a plasma. During the 2-h
                             process conducted here at ambient temperature (20 ºC), the target fixed on the top within
                             chamber was used to generate IONPs in argon with a flow rate between 10–100 sccm.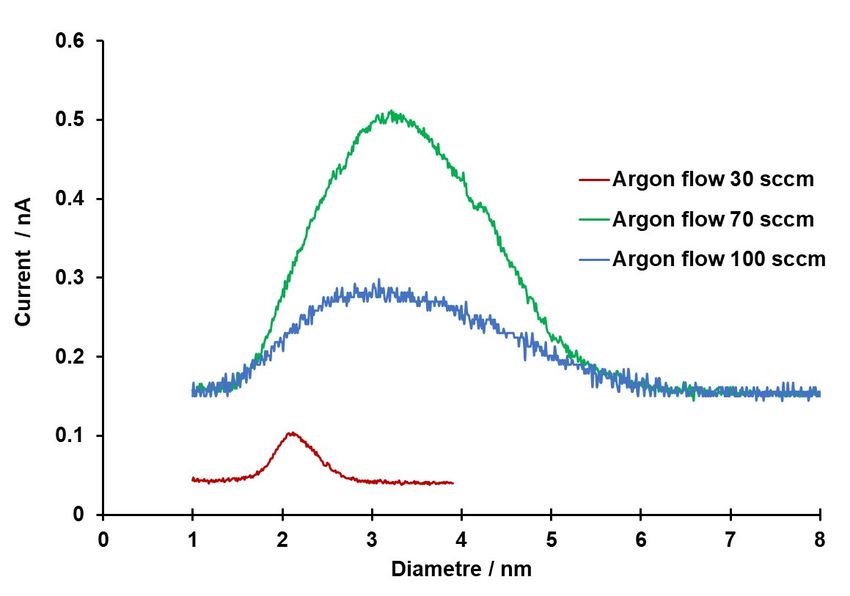
Bioengineering 2021, 8, 38                                                                                       4 of 12

                             Production of IONPs using high or low power achieved by regulating the current applied
                             to the magnetron involved very gradual increments of current (0.001 A per minute) due
                             to the thermoplastic nature of the targets, while generating the plasma. The process was
                             monitored at 30-min intervals. Pressure in main chamber was altered by changing the
                             throttle position (0%–70%) and flow rate of argon (Scheme S1 in Supplementary informa-
                             tion). Distance from the magnetron to the agglomeration chamber with the target was fixed
                             at 13.8 cm. The IONPs produced in this work were pre-sputtered with the shutter closed
                             for 15 min, to clean the target. The shutter was then opened and condensed IONPs, which
                             have attained ground state, were channeled through the mass quadrupole filters to the
                             PEG coated substrate surface. After deposition, PEG coated free- standing IONPs were
                             obtained by immersing the 1-inch silicon wafer substrate in 15 mL RNAse free water in
                             a glass beaker and ultrasonicating for 3 min to dissolve the PEG layer and disperse the
                             IONPs in solution. The PEG added at the time of IONPs preparation prevents aggregation
                             of the free-standing nanoparticles when these are dispersed in RNAse free water [41].

                             2.4. Characterization of Coated Silicon Wafers and Free Standing IONPs by AFM and TEM
                                 Atomic force microscopy (AFM), performed using a microscope from Digital Instru-
                             ment (Boston, USA), was used to characterize the PEG IONPs after production using a
                             2× magnification.
                                 The PEG IONPs were also characterized by Transmission Electron Microscopy (TEM)
                             using a JEM TEM Jeol instrument (Hertfordshire, UK). For both AFM and TEM measure-
                             ments, aliquots of the PEG IONPs solutions were dropped either on a silicon wafer (for
                             AFM) or on a TEM grid and dried in atmosphere before imaging. The TEM grid used had
                             3 mm diameter and a holey carbon support film.

                             2.5. Characterization of IONPs by Dynamic Light Scattering
                                  Dynamic Light Scattering (DLS) measurements were conducted using a Nanosize
                             instrument from Malvern Panalytical Ltd. (Malvern, UK) to assess the PEG IONPs size dis-
                             tribution and measure the amount of PEG surrounding the nanoparticles after production.
                             To prepare the PEG IONPs samples, the solution with dispersed PEG IONPs, obtained
                             after IGC production, was concentrated (3×) by evaporating the liquid at 50 ◦ C for two
                             hours in a centrifugal vacuum concentrator, Eppendorf 5301 from Sigma (Dorset, UK) and
                             this was measured by DLS. In order to prepare a control containing only PEG, a silicon
                             wafer was spin-coated with PEG (0.2 g/mL) and directly dissolved in 15 mL of RNAse free
                             water with ultrasonication for 3 min. Then, similarly to the solution with the PEG IONPs,
                             this was concentrated (3×) by the vacuum concentrator and measured by DLS.

                             2.6. Characterization of IONPs by NanoSight Nanoparticle Tracking Analysis (NTA)
                                  A NanoSight LM20 from Malvern Panalytical Ltd (Worcester, UK) configured with
                             a CCD camera and a red laser light was used to determine the size of the free-standing
                             IONPs in RNAse free water (concentrated 3 times) and compared with the PEG in RNAse
                             free water (also concentrated 3 times). For the measurements, 1 mL of 100 nm polystyrene
                             spheres standard was injected into the NanoSight column to calibrate the instrument before
                             loading each sample. The measurements were displayed by viewing the ’Thumbprint’
                             via NanoSight 3.4 version software connected to a monitor display. Next, 1 mL of each
                             sample was injected into the instrument column and captured for 60 s at a constant
                             temperature of 22 ◦ C. Each sample was measured 3–5 time and the results were reported
                             as averaged histograms.

                             3. Results
                             3.1. Silicon Wafer Substrate Characterization
                                  Silicon wafers are among the most common substrates for use in a pressurized main
                             chamber. Preparation of the substrate for deposition of IONPs involved plasma cleaning to
                             increase wettability of the substrate surface and enabling deposition of a thin PEG layer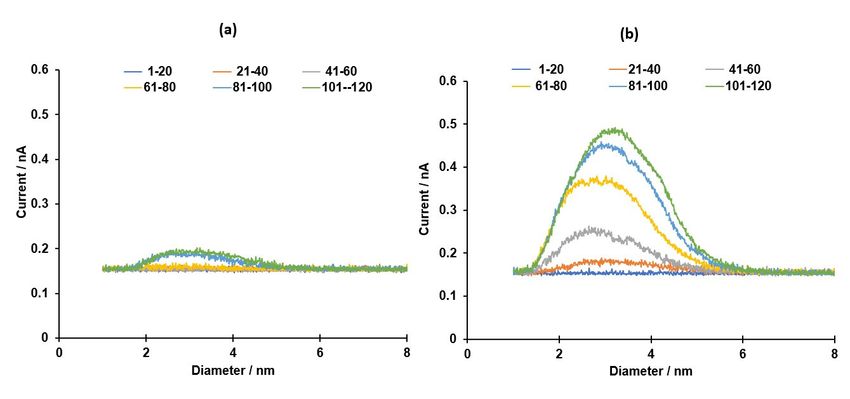
Bioengineering 2021, 8, 38                                                                                              5 of 12

                             using a spin-coater. The polymer was applied to the wafer surface to enhance soft-landing
                             and subsequent capture of the IONPs as well as to assure, after polymer dissolution, the
                             achievement of free-standing PEG coated IONPs. Contact angle measurements using DI
                             water conducted with a Tensiometer showed variation from bare, PEG coated and IONPs
                             soft landed on PEG coated silicon wafer surface Figure S1 (Supplementary information).
                                   Contact angle measurements on the bare, non-plasma cleaned wafer showed hy-
                             drophobicity with a contact angle of ~55◦ , while PEG – coated wafer showed a contact
                             angle of ~7.5◦ . After sputtering IONPs on PEG-coated wafer, the layer showed a contact
                             angle of ~14◦ . These results imply that the thin layer of PEG reduces the hydrophobicity
                             of the silicon wafer as compared with the non-plasma cleaned bare surface. In addition,
                             a small change on the wettability of the surface was also observed after sputtering the
                             IONPs, which could be attributed to the presence of the particles on the PEG-coated wafer.
                             The thickness of the PEG layer was determined along a scratch by using a DektakXT stylus
                             profiler Figure S2 (in Supplementary information). The polymer thickness was determined
                             at five points along the scratch resulting in an average 0.26 µm ± 0.031 µm. The amount
                             of PEG spin coated on the silicon wafer was estimated by the difference in weight of the
                             wafer between before and after spin-coating and it was found to be 15.8 mg ± 3.6%, for
                             experiments performed in triplicates. This was considered a suitable amount of polymer to
                             obtain IONPs deposition.

                             3.2. IONPs Production
                                   IONPs with size between ~ 1–6 nm were produced using the Mantis NanoGen Trio
                             system by application of power to the magnetron. The magnetron transmits energy to
                             the target and to the pressurized inert gas in the agglomeration chamber. Energized
                             supersaturated metallic vapor from the iron oxide target escape the surface of the target
                             and interact with particles of the inert gas. As the process continues over time, the interplay
                             of particulate collision and transfer of energy results in particles sputtering followed by their
                             condensation and deposition onto a commercial 1-inch wafer. In the pressurized chamber
                             supplied with power (20–49 Watts) and with argon as the inert gas carrier, regulation of the
                             gas can result in variation of particle sizes. The instrument used in this work was coupled
                             with a scientific vacuum systems (SVS) main chamber through a software (MesoQ), which
                             also provided control over operating conditions such as chamber pressure, temperature,
                             working distance (WD) and throttle position. The parameters for sputtering can be altered
                             to achieve pre-determined nanoparticles size and size distribution. All the conditions
                             tested in this work are summarized in Table S1 (in Supplementary Information).
                                   Process parameters were adjusted to commence sputtering, while maintaining a stable
                             plasma, Table S2 (Supplementary Information). In addition, the larger the WD between the
                             magnetron head and the agglomeration chamber, the larger the size of IONPs produced [31]
                             and in this work the WD was fixed to 13.8 cm, which in the optimized conditions produced
                             particles with size between ~ 1–6 nm. During a 2 h sputtering session, the generation of
                             nanoparticles in the chamber, shown as spectra of diameter vs. current, was recorded using
                             the MesoQ controller software and exported to Excel. An average of 20 spectra was plotted
                             during low (20 Watts) and high (49 Watts) intensity sputtering (Figure 1a,b).
                                   Comparatively, the average spectra are for the purpose of data presentation and
                             clarity, to depict the production of nanoparticles and show evolution. The spectra show
                             intensity of sputtering as well as the size distribution of the nanoparticles generated in the
                             agglomeration chamber. Prior to commencing IONPs sputtering and whilst the parameters
                             are being optimized to achieve a stable plasma, the spectra are not distinguishable. When a
                             stable plasma is achieved, however, spectra evolution can be seen and, in this work, after
                             15 min of sputtering with the shutter closed to clean the target, the shutter was opened to
                             allow deposition of nanoparticles on the substrate. In the case of low power sputtering,
                             the generation of the IONPs and the evolution of spectra were recorded for 2 h, while
                             maintaining the minimum power (20 Watts or 531.9 V, 0.038 A) necessary to produce a
                             stable plasma. These conditions produced spectra with low intensity particles generation
Bioengineering 2021, 8, 38                                                                                                      6 of 12

                                 (Figure 1a). For high power sputtering (49 Watts or 454.0 V, 110.0 A), however, the power
                                 was increased gradually after successfully striking a stable plasma until the maximum
                                 value recommended by the manufacturer was reached. These conditions produced spectra
                                 with high intensity particles generation (Figure 1b).

                                 Figure 1. Low (a) and high (b) power spectra of Fe3 O4 .

                                              In addition to size pre-selection via MesoQ software, at fixed values of WD and
                                        temperature, size and size distribution of IONPs can be controlled changing the flow rate of
                                        the inert gas [42] in relation to the power and the throttle position (Table S3, Supplementary
                                        Information). To assess the effect of the inert gas (argon) flow rate at fixed WD and room
                                        temperature (20 ◦ C), in this work, IONPs were generated using different flow rates and
                                        by applying enough power to achieve a stable plasma. The results depicted in Figure 2
                                        show that IONPs production was not as high when slower argon flow rates were used
                                        (e.g., 30 sccm) and the production was at its maximum with the intermediate values of
                                        flow rate tested (70 sccm), when currents higher than 0.5 nA were recorded. The argon
                                        flow rate seems to affect not only the amount of particles generated, but also their size
                                        and distribution. In fact, at an argon flow rate of 30 sccm IONPs with size around 2 nm
   Bioengineering 2021, 8, x FOR PEER REVIEW                                                                              7 of 13
                                        were produced, while flow rates of both 70 and 100 sccm produced particles with size
                                        between ~ 1–6 nm (Figure 2).

                                            Comparison
                                 Figure2.2.Comparison
                                Figure                    of spectra
                                                      of spectra     according
                                                                 according       to argon
                                                                           to argon        flow rate.
                                                                                     flow rate.

                                1
                                       Therefore,
                                      Therefore, byby adjusting
                                                    adjusting thethe sputtering
                                                                  sputtering     conditions,
                                                                             conditions,      the process
                                                                                         the process can becan be repeated
                                                                                                            repeated to ob- to obtain
                                 IONPs   with  the  desired dimension    and  size distribution.
                                tain IONPs with the desired dimension and size distribution.

                                3.3. IONPs Characterization
                                     IONPs produced from Fe3O4 targets at room temperature (20 °C) on silicon wafers
                                coated with PEG, with an argon flow rate of around 70 sccm, were dispersed in 15 mL
Bioengineering 2021, 8, 38 7 of 12
3.3. IONPs Characterization
IONPs produced from Fe3 O4 targets at room temperature (20 ◦ C) on silicon wafers
coated with PEG, with an argon flow rate of around 70 sccm, were dispersed in 15 mL
RNAse free water as described in the Materials and Methods section. As the amount
of PEG spin-coated on the silicon wafer was estimated to be around 15.8 mg, the final
concentration in the RNAse free water was calculated as 1.05 mg/mL. RNAse free water
was selected as medium as the nanoparticles produced here will be investigated in the near
future for delivery of gene therapy using RNA. A droplet (20 µL) of the IONPs suspension
Bioengineering 2021, 8, x FOR PEER REVIEW 8 of 13
was then placed on an in-house, circular TEM grid (3 mm Ø), air dried and analyzed by
TEM. The sample showed spherical IONPs (or aggregates) smaller than 20 nm,
Bioengineering 2021, 8, x FOR PEER REVIEW 8 of 13within a
dry PEG matrix (Figure 3).
Figure 3. TEM
Figure micrographs of of
3. TEM PEG encapsulated
encapsulatedFe3O4 NPs in RNAse free water.
Figure 3. TEMmicrographs
micrographs of PEG
PEG Fe
encapsulated3O4 NPs in RNAse free water.
Fe3 O4 NPs in RNAse free water.
TheThe
TEM
The TEM
TEMimage
image confirms
image confirms the
confirms presence
the presence ofofIONPs
the presence IONPs in
inthe
of IONPs the PEG
PEG solution
solution
in the eluted
PEGeluted
solution from
from the from
the
eluted
PEGPEGcoated
coatedsilicon wafer
silicon wafer after
aftersputtering.
sputtering. Once
Once the
the PEG
PEG IONPs
IONPs solution
solution wasdried
was driedon onthe
the
the PEG coated silicon wafer after sputtering. Once the PEG IONPs solution was dried
TEM TEMgridgrid
forforthethe
measurements,
measurements,the theTEM
TEMimage
imageshow show that
that the
the majority
majority of of the
theparticles
particles
on the TEM grid for the measurements, the TEM image show that the majority of the
are are contained
contained within
within thethe dry
dry PEGPEGlayer.
layer.[22].
[22].In Inaddition,
addition, probably
probably duedue to to both
bothfurther
further
particles are contained within the dry PEG layer. [22]. In addition, probably due to both
agglomeration
agglomeration during
during deposition
deposition ononthe
thewafer
waferand andthethedrying
drying process
process ofof the
thePEGPEGIONPs
IONPs
further
before agglomeration
measuring duringthe deposition on the wafer and the drying process of the PEG
before measuring thethe sample,
sample, nanoparticles
the nanoparticles seem
seem to be
to be present inin aggregates
aggregatesand and
IONPs
thereforebefore
show measuring
larger sizes the sample,
than the nanoparticles
thoseobserved
observed duringparticles seem
particles to be present
generation in in aggregates
therefore show larger sizes than those during generation inthe
theplasma
plasma
and therefore
chamber (Figuresshow
2 and larger sizes than those observed during particles generation in the
chamber (Figures 2 and 3).3).
TheThe TEMimage
TEM image alsoshows
also shows aa small
small amount
amount of
of IONPs
IONPsoutside
outside
plasma
the PEG
the PEG layer.
chamber
layer. (Figures 2 and 3). The TEM image also shows a small amount of IONPs
outside
To the
analyzePEG layer.
the sample further, the suspended IONPs were
To analyze the sample further, the suspended IONPs were blotted on a plain siliconblotted on a plain silicon
wafer,
Toair dried and
analyze characterized by AFM (Figure 4). IONPs were blotted on a plain silicon
wafer, air dried andthe sample further,
characterized by AFM the(Figure
suspended 4).
wafer, air dried and characterized by AFM (Figure 4).
Figure 4. Bare Si wafer (a) and PEGylated IONPs dried on Si wafer (b).
Figure 4. Bare Si wafer (a) and PEGylated IONPs dried on Si wafer (b).
Figure 4. Bare Si wafer (a) and PEGylated IONPs dried on Si wafer (b).
Comparison of the bare and coated substrates show topographical variation. The
AFM images show an increased roughness due to the presence of the PEG layer (FigureBioengineering 2021, 8, 38 8 of 12
Comparison of the bare and coated substrates show topographical variation. The
AFM images show an increased roughness due to the presence of the PEG layer (Figure 4b).
Bioengineering 2021, 8, x FOR PEER REVIEW The brighter spots on Figure 4b, might indicate presence of the IONPs within the PEG layer,
9 of 13
confirming what was already seen in the TEM images.
In order to estimate the size and size distribution of the PEG-coated IONPs, the
In nanoparticles
order to estimatesolution was
the size and concentrated
size distribution of3the
times and measured
PEG-coated IONPs, theby na-DLS (Figure 5a). A
solution
noparticles containing
solution only PEG,
was concentrated prepared
3 times as explained
and measured in the
by DLS (Figure 5a).Methods
A solu- section, was also
tion containing only PEG,
concentrated prepared
3 times andasmeasured
explained inasthecontrol
Methods section,5b)
(Figure wasgiving
also concen-
a final concentration of
trated 3PEG
timesin
and measured as control (Figure 5b)
both solutions of around 3 mg/mL. giving a final concentration of PEG in
both solutions of around 3 mg/mL.
Figure 5. Dynamic light scattering of concentrated PEG IONPs solution (a) and concentrated PEG
Figure 5.solution
Dynamic(b),
lightas
scattering
control.ofAveraged
concentrated PEG as
signal IONPs
wellsolution (a) and concentrated
as individual PEG
runs are depicted.
solution (b), as control. Averaged signal as well as individual runs are depicted.
Figure shows that whereas we have distinct peaks in the PEG IONPs solution (Figure 5a)
Figure shows that whereas we have distinct peaks in the PEG IONPs solution (Figure
5a) at 7 at
nm7(bare
nm (bare
IONPs), IONPs), 47 nmcoated
47 nm (IONPs (IONPs withcoated
PEG) and with PEG)
over 2860 and over 2860 nm (aggregation of
nm (aggregation
of PEG)PEG)with with a polydispersity
a polydispersity index
index (PDI) of (PDI)
0.707 ±of0.098, ±PEG
0.707the 0.098, the PEG
solution solution
(Figure 5b) (Figure 5b) shows
shows aa collection
collectionofofpeaks
peaks with
with a higher
a higher PDI PDI (0.846
(0.846 ± 0.160)
± 0.160) demonstrating
demonstrating the absence of discrete
the absence
of discrete nanoparticles. DLS
nanoparticles. DLSmeasurements
measurements also indicate that the IONPs
also indicate might
that the be coated
IONPs might be coated with
with around
around40 nm
40 of
nm PEG. In the In
of PEG. future, the PEGthe
the future, amount
PEGwill be further
amount willoptimized
be further andoptimized and most
most likely reduced, by changing the concentration of the PEG solution used for spin-
likely reduced, by changing the concentration of the PEG solution used for spin-coating
coating the silicon wafer prior sputtering. In fact, a thinner layer of PEG around the IONPs
the silicon wafer prior sputtering. In fact, a thinner layer of PEG around the IONPs should
facilitate cell internalization, while maintaining the desired paramagnetic properties.Bioengineering 8, 388, x FOR PEER REVIEW
2021,2021,
Bioengineering 10 of 13 9 of 12
should facilitate cell internalization, while maintaining the desired paramagnetic proper-
ties. In order to obtain further confirmation of the results observed by DLS, NanoSight
In order to obtain
Nanoparticles furtherAnalysis
Tracking confirmation of theof
(NTA) results observed
the two by DLS,(PEG
solutions NanoSight
IONPS and PEG only
Nanoparticles Tracking Analysis (NTA) of the two solutions (PEG IONPS and PEG only
concentrated 3 times) was also performed. The NTA results are
concentrated 3 times) was also performed. The NTA results are shown in Figure 6.
shown in Figure 6.
Figure6. 6.
Figure NTANTA measurements
measurements of concentrated
of concentrated PEG IONPs
PEG IONPs solution solution
(blue) and (blue)
concentrated and concentrated PEG
PEG
solution (orange), as control. Histograms are average of 3 measurements. Insets show screenshots
solution (orange), as control. Histograms are average of 3 measurements. Insets show screenshots of
of representative NTA video for both PEG IONPs and PEG only solutions.
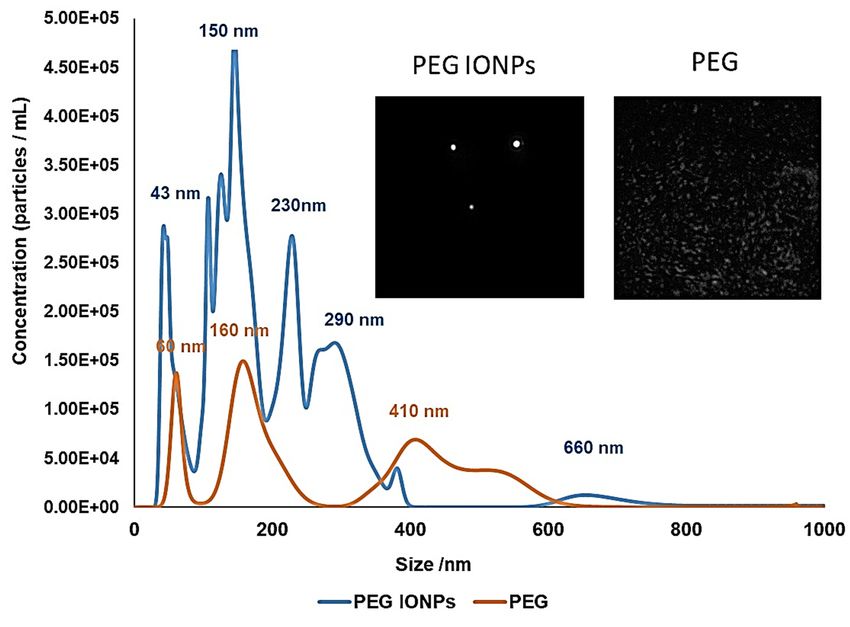
representative NTA video for both PEG IONPs and PEG only solutions.
Both the graphs and the NTA videos (snapshots of the videos are reported as inset in
Bothshowed
the figure) the graphs and difference
a significant the NTAbetween
videosthe (snapshots
PEG IONPs of andthe
the videos are reported as inset in
PEG solutions.
Whereas
the figure)discrete particles
showed were observed
a significant in the NTAbetween
difference videos of the
the PEG
PEGIONPs
IONPssolution,
and the PEG solutions.
(the bright spots on the left snapshot in the inset of Figure 6), no particles were seen in the
Whereas discrete particles were observed in the NTA videos of the PEG IONPs solution,
videos of the PEG only sample. Nevertheless, a background signal was observed for both
(the bright
samples spots on the
and particularly leftPEG
for the snapshot inbackground
only. This the inset of Figure
signal 6), nodue
is probably particles
to the were seen in the
videos
high of the PEG
concentration only
of PEG (~ 3sample. Nevertheless,
mg/mL) present a background
in both samples. signal was observed for both
Such high concentration
of PEG is most
samples andlikely affecting the
particularly forNTA
the measurements
PEG only. This and background
might be responsible
signalforisthe
probably due to the
difference in nanoparticles size observed between NTA
high concentration of PEG (~3 mg/mL) present in both samples. and DLS analysis. Nonetheless,
Such high concentration
NTA as well as DLS, has further confirmed presence of free-standing and discrete IONPs
of PEG is most likely affecting the NTA measurements and might be responsible for the
dispersed in the PEG solution.
difference in nanoparticles
In conclusion, size observed
the characterization results havebetween
confirmedNTA and DLS analysis.
that free-standing PEG Nonetheless,
NTA as
IONPs well
were as DLS,prepared
successfully has further confirmed
and they presence
were dispersible of free-standing
and stable in aqueous solu-and discrete IONPs
tion. In fact, the
dispersed in PEG IONPssolution.
the PEG samples produced here were stored in sealed containers (at -
20 °C to prevent solution bacterial growth) and analyzed for weeks during the character-
In conclusion, the characterization results have confirmed that free-standing PEG
ization without any noticeable deterioration of the samples.
IONPs were successfully prepared and they were dispersible and stable in aqueous solution.
InDiscussion
4. fact, the PEG IONPs samples produced here were stored in sealed containers (at −20 ◦ C
to prevent solution
Iron Oxide bacterial
nanoparticles growth)
with size < 20 nmand analyzed
(confirmed for weeks
by TEM) duringhere
were produced the characterization
at ambientany
without temperature (20 °C).
noticeable Whereas in this
deterioration ofwork the synthesis was performed at 20
the samples.
°C to obtain particles ~ 10 nm, and therefore able to cross the cell membranes, if desired,
larger particles (> 10 nm) can be obtained performing the sputtering at lower temperatures
4. Discussion
(e.g. ‒20 °C). The small particles produced here by our novel approach (IGC by the Mantis
NanoGenIronTrio)
Oxide nanoparticles
has potential to be usedwith size 10 nm) can be obtained performing the sputtering at lower
temperatures (e.g. −20 ◦ C). The small particles produced here by our novel approach (IGC
by the Mantis NanoGen Trio) has potential to be used for example to deliver gene therapy
into target tissues. In addition, the novel production process used here allows us to obtain
particles with narrow size distribution. This is desired as it enhances the predictability of
the IONPs behavior in tissues as well as their excretion from the body after the release of
the therapeutic agent.
Nanoparticles may be formed with spherical or cubic morphology using IGC by
varying the flow rate of the inert gas in the source [30]. Furthermore, shape and sizeBioengineering 2021, 8, 38 10 of 12
can be controlled via precipitation of magnetite at low temperature in the presence of
nitrogen gas [42]. The sputtering intensity at high or low power also affect the morphology,
size and density of the produced IONPs and may affect the formation of the nanocarrier
complex and attachment of biomolecules.
Direct production of metal nanoparticles coated with a biocompatible polymer such as
PEG can be further modified with therapeutic agents (drugs) and antibodies to guide deliv-
ery to a specific cell receptor allowing particles to target specific cell types and successfully
deliver therapeutic drugs [1].
The IGC production method used here has the added advantage of size pre-selection
by regulating sputtering conditions and parameters. Furthermore, no additional purifica-
tion steps are required after the IONPs are produced. If the process is prolonged, the IONPs
form a thicker layer on the substrate increasing the yield of the material and influencing
their magnetic behavior [43].
According to [44], nanoparticles are suitable for fabricating nanostructure materials,
whose physical and chemical properties can be tailored. Nevertheless, IONPs size and size
distribution cannot be easily controlled when they are produced by chemical methods [40].
Another major disadvantage of bulk solution nanoparticle synthesis, such as coprecipita-
tion, is that the pH value of the reaction mixture has to be adjusted during synthesis and
purification [45]. Furthermore, magnetic nanoparticles synthesis and physical methods
such as gas phase deposition and electron beam lithography do not allow for the control
of particle size [46]. The production method proposed here has shown that PEG - coated
IONPs with a specific size and size distribution can be prepared by simple tuning the
sputtering conditions.
In comparison to other organic polymers, PEG is biocompatible and commonly used
to produce nanocarriers suitable for use in biological systems. The chemical nature of
IONPs enables physical adsorption of the hydrophilic polymer on their surface, potentially
reducing biotoxicity and accumulation in non-target tissues. Therefore, the free standing
IONPs surrounded by PEG as a protective soluble coating obtained here, have the potential
to be an efficient pay-loaded nanocarrier complex for transportation in biological systems
and this is currently under investigation.
5. Conclusions
In this study, Fe3 O4 targets were used to successfully sputter and deposit IONPs on
PEG coated silicon wafer substrates using IGC technique by the Mantis NanoGen Trio
system. Characterization of the resulting free-standing PEG coated IONPs has confirmed
the suitability of the technique to produce PEG IONPs dispersed in an aqueous solution.
The nanoparticles produced do not require further purification and are ready to be utilized;
for example, for biomedical applications. Further work is currently investigating the
chemistry to attach therapeutic agents and receptors for the guided and efficient delivery
of RNA based drugs for enhanced gene therapy.
Supplementary Materials: The following are available online at https://www.mdpi.com/2306-535
4/8/3/38/s1.
Author Contributions: Conceptualization of the work was by G.J.T.L., A.H. executed all the lab
works and analyzed the data under the supervision of G.J.T.L. and I.C., who particularly helped
with the DLS analysis and the interpretation of the results. The manuscript was written by A.H.
with I.C. and G.J.T.L.’s contribution. All authors have read and agreed to the published version of
the manuscript.
Funding: This research received no external funding.
Institutional Review Board Statement: Not applicable.
Informed Consent Statement: Not applicable.
Data Availability Statement: Data is contained within the article or supplementary material.Bioengineering 2021, 8, 38 11 of 12
Acknowledgments: Thanks to Quentin Lonné and Weronika Serafimowicz for their initial training
on the use of the Mantis NanoGen Trio system. Thanks also to Igor Kraev and Francesco Crea, Open
University, UK for helpful suggestions and TEM images.
Conflicts of Interest: The authors declare no conflict of interest.
References
1. Gupta, A.K.; Gupta, M. Cytotoxicity suppression and cellular uptake enhancement of surface modified magnetic nanoparticles.
Biomaterials 2005, 26, 1565–1573. [CrossRef]
2. Tsuzuki, T.; McCormick, P.G. Mechanochemical synthesis of nanoparticles. J. Mater. Sci. 2004, 39, 5143–5146. [CrossRef]
3. Cheng, F.Y.; Su, C.H.; Yang, Y.S.; Yeh, C.S.; Tsai, C.Y.; Wu, C.L.; Wu, M.T.; Shieh, D. Bin Characterization of aqueous dispersions of
Fe3O4 nanoparticles and their biomedical applications. Biomaterials 2005, 26, 729–738. [CrossRef] [PubMed]
4. Dupas, C.; Houdy, P.; Lahmani, M. Nanoscience: Nanotechnologies and nanophysics. In Nanoscience; Dupas, C., Houdy, P.,
Lahmani, M., Eds.; Springer: Berlin/Heidelberg, Germany, 2007; pp. 179–278. ISBN 9783540286165/9783540286172.
5. Hench, L.L.; West, J.K. The sol-gel process. Chem. Rev. 1990, 90, 33–72. [CrossRef]
6. LaGrow, A.P.; Besenhard, M.O.; Hodzic, A.; Sergides, A.; Bogart, L.K.; Gavriilidis, A.; Thanh, N.T.K. Unravelling the growth
mechanism of the co-precipitation of iron oxide nanoparticles with the aid of synchrotron X-Ray 444 diffraction in solution.
Nanoscale 2019, 11, 6620–6628. [CrossRef]
7. Duan, H.; Wang, D.; Li, Y. Green chemistry for nanoparticle synthesis. Chem. Soc. Rev. 2015, 44, 5778–5792. [CrossRef] [PubMed]
8. Shi, Y. Hot Wire Chemical Vapor Deposition Chemistry in the Gas Phase and on the Catalyst Surface with Organosilicon
Compounds. Acc. Chem. Res. 2015, 48, 163–173. [CrossRef]
9. Mohanty, U.S. Electrodeposition: A versatile and inexpensive tool for the synthesis of nanoparticles, nanorods, nanowires, and
nanoclusters of metals. J. Appl. Electrochem. 2011, 41, 257–270. [CrossRef]
10. Ziolo, R.F.; Giannelis, E.P.; Shull, R.D. Matrix-mediated synthesis and properties of nanostructured materials. Nanostruct. Mater.
1993, 3, 85–92. [CrossRef]
11. Deng, Y.; Wang, L.; Yang, W.; Fu, S.; Elaïssari, A. Preparation of magnetic polymeric particles via inverse micro-emulsion
polymerization process. J. Magn. Magn. Mater. 2003, 257, 69–78. [CrossRef]
12. Li, S.; Irvin, G.C.; Simmons, B.; Rachakonda, S.; Ramannair, P.; Banerjee, S.; John, V.T.; McPherson, G.L.; Zhou, W.; Bose, A.
Structured materials syntheses in a self-assembled surfactant mesophase. Colloids Surf. A Physicochem. Eng. Asp. 2000, 174,
275–281. [CrossRef]
13. Xie, J.; Huang, J.; Li, X.; Sun, S.; Chen, X. Iron oxide nanoparticle platform for biomedical applications. Curr. Med. Chem. 2009, 16,
1278–1294. [CrossRef] [PubMed]
14. Boyer, C.; Whittaker, M.R.; Bulmus, V.; Liu, J.; Davis, T.P. The design and utility of polymer-stabilized iron-oxide nanoparticles for
nanomedicine applications. NPG Asia Mater. 2010, 2, 23–30. [CrossRef]
15. Samrot, A.V.; Sai, C.; Selvarani, J.; Keeyari, S.; Ponnaiah, P. A review on synthesis, characterization and potential biological
applications of superparamagnetic iron oxide nanoparticles. Curr. Res. Green Sustain. Chem. 2021, 4, 100042. [CrossRef]
16. Soetaert, F.; Korangath, P.; Serantes, D.; Fiering, S.; Ivkov, R. Cancer therapy with iron oxide nanoparticles: Agents of thermal and
immune therapies. Adv. Drug Deliv. Rev. 2020, 163–164, 65–83. [CrossRef] [PubMed]
17. Taylor, A.P.; Barry, J.C.; Webb, R.I. Structural and morphological anomalies in magnetosomes: Possible biogenic origin for
magnetite in ALH84001. J. Microsc. 2001, 201, 84–106. [CrossRef] [PubMed]
18. Zhou, W.; Wang, K.Y.; O’Connor, C.J.; Tang, J. Granular growth of Fe3O4 thin films and its antiphase boundaries prepared by
pulsed laser deposition. J. Appl. Phys. 2001, 89, 7398–7400. [CrossRef]
19. Ko, Y.G.; Kim, Y.H.; Park, K.D.; Lee, H.J.; Lee, W.K.; Park, H.D.; Kim, S.H.; Lee, G.S.; Ahn, D.J. Immobilization of poly(ethylene
glycol) or its sulfonate onto polymer surfaces by ozone oxidation. Biomaterials 2001, 22, 2115–2123. [CrossRef]
20. Tepper, T.; Ilievski, F.; Ross, C.A.; Zaman, T.R.; Ram, R.J.; Sung, S.Y.; Stadler, B.J.H. Magneto-optical properties of iron oxide films.
J. Appl. Phys. 2003, 93, 6948–6950. [CrossRef]
21. Liu, J.; Wu, Z.; Tian, Q.; Wu, W.; Xiao, X. Shape-controlled iron oxide nanocrystals: Synthesis, magnetic properties and energy
conversion applications. CrystEngComm 2016, 18, 6303–6326. [CrossRef]
22. Nosrati, H.; Salehiabar, M.; Davaran, S.; Ramazani, A.; Manjili, H.K.; Danafar, H. New advances strategies for surface functional-
ization of iron oxide magnetic nano particles (IONPs). Res. Chem. Intermed. 2017, 43, 7423–7442. [CrossRef]
23. Naqvi, S.; Samim, M.; Abdin, M.Z.; Ahmed, F.J.; Maitra, A.N.; Prashant, C.K.; Dinda, A.K. Concentration-dependent toxicity of
iron oxide nanoparticles mediated by increased oxidative stress. Int. J. Nanomed. 2010, 5, 983–989. [CrossRef]
24. Gupta, A.K.; Curtis, A.S.G. Lactoferrin and ceruloplasmin derivatized superparamagnetic iron oxide nanoparticles for targeting
cell surface receptors. Biomaterials 2004, 25, 3029–3040. [CrossRef] [PubMed]
25. Hamley, I.W. Nanotechnologie mit weichen Materialien. Angew. Chem. 2003, 115, 1730–1752. [CrossRef]
26. Malek, A.; Merkel, O.; Fink, L.; Czubayko, F.; Kissel, T.; Aigner, A. In vivo pharmacokinetics, tissue distribution and underlying
mechanisms of various PEI(-PEG)/siRNA complexes. Toxicol. Appl. Pharmacol. 2009, 236, 97–108. [CrossRef] [PubMed]
27. Nelli, D.; Krishnadas, A.; Ferrando, R.; Minnai, C. One-Step Growth of Core-Shell (PtPd)@Pt and (PtPd)@Pd Nanoparticles in the
Gas Phase. J. Phys. Chem. C 2020, 124, 14338–14349. [CrossRef]Bioengineering 2021, 8, 38 12 of 12
28. Grammatikopoulos, P.; Kioseoglou, J.; Galea, A.; Vernieres, J.; Benelmekki, M.; Diaz, R.E.; Sowwan, M. Kinetic trapping through
coalescence and the formation of patterned Ag-Cu nanoparticles. Nanoscale 2016, 8, 9780–9790. [CrossRef]
29. Baptista, A.; Silva, F.; Porteiro, J.; Míguez, J.; Pinto, G. Sputtering Physical Vapour Deposition (PVD) Coatings: A Critical Review
on Process Improvement and Market Trend Demands. Coatings 2018, 8, 402. [CrossRef]
30. Johnson, G.E.; Colby, R.; Laskin, J. Soft landing of bare nanoparticles with controlled size, composition, and 501 morphology.
Nanoscale 2015, 7, 3491–3503. [CrossRef]
31. Available online: www.mantisdeposition.com (accessed on 13 January 2021).
32. Li, B.; Zheng, R.; Zhang, X.; Zhao, G.; Liu, H. Molecular dynamics simulation of inert gas condensation of ternary Fe-Ni-Cr
nanoparticles. Comput. Mater. Sci. 2020, 177, 109579. [CrossRef]
33. Veith, G.M.; Lupini, A.R.; Pennycook, S.J.; Ownby, G.W.; Dudney, N.J. Nanoparticles of gold on γ-Al2 O3 produced by dc
magnetron sputtering. J. Catal. 2005, 231, 151–158. [CrossRef]
34. Wang, X.B.; Song, C.; Geng, K.W.; Zeng, F.; Pan, F. Photoluminescence and Raman scattering of Cu-doped ZnO films prepared by
magnetron sputtering. Appl. Surf. Sci. 2007, 253, 6905–6909. [CrossRef]
35. Ig, W.R.; Anitha, V.P.; Major, S.; Chandrashekharam, D.; Bhatnagar, M. Deposition of molybdenum nitride thin films by r.f.
reactive magnetron sputtering. Surf. Coat. Technol. 1996, 79, 50–54.
36. Kusior, A.; Kollbek, K.; Kowalski, K.; Borysiewicz, M.; Wojciechowski, T.; Adamczyk, A.; Trenczek-Zajac, A.; Radecka, M.;
Zakrzewska, K. Sn and Cu oxide nanoparticles deposited on TiO2 nanoflower 3D substrates by Inert Gas Condensation technique.
Appl. Surf. Sci. 2016, 380, 193–202. [CrossRef]
37. Ling, D.; Hyeon, T. Chemical Design of Biocompatible Iron Oxide Nanoparticles for Medical Applications. Small 2013, 9,
1450–1466. [CrossRef]
38. Demirer, G.S.; Okur, A.C.; Kizilel, S. Synthesis and design of biologically inspired biocompatible iron oxide nanoparticles for
biomedical applications. J. Mater. Chem. B 2015, 3, 7831–7849. [CrossRef] [PubMed]
39. Kim, D.; Lee, N.; Park, M.; Kim, B.H.; An, K.; Hyeon, T. Synthesis of Uniform Ferrimagnetic Magnetite Nanocubes. J. Am. Chem.
Soc. 2009, 131, 454–455. [CrossRef]
40. Silva, L.G.; Solís-Pomar, F.; Lazos, C.D.G.; Meléndrez, M.F.; Martinez, E.; Fundora, A.; Pérez-Tijerina, E. Synthesis of Fe
Nanoparticles Functionalized with Oleic Acid Synthesized by Inert Gas Condensation. J. Nanomater. 2014, 2014, 1–6. [CrossRef]
41. Mendenhall, G.D.; Geng, Y.; Hwang, J. Optimization of Long-Term Stability of Magnetic Fluids from Magnetite and Synthetic
Polyelectrolytes. J. Colloid Interface Sci. 1996, 184, 519–526. [CrossRef] [PubMed]
42. Tang, J.; Myers, M.; Bosnick, K.A.; Brus, L.E. Magnetite Fe3O4 Nanocrystals: Spectroscopic Observation of Aqueous Oxidation
Kinetics. J. Phys. Chem. Solids 2003, 107, 7501–7506. [CrossRef]
43. Patsula, V.; Moskvin, M.; Dutz, S.; Horák, D. Size-dependent magnetic properties of iron oxide nanoparticles. J. Phys. Chem. Solids
2016, 88, 24–30. [CrossRef]
44. Uchegbu, I.F.; Florence, A.T. Adverse drug events related to dosage forms and delivery systems. Drug Saf. 1996, 4, 39–67.
[CrossRef] [PubMed]
45. Held, G.A.; Grinstein, G.; Doyle, H.; Sun, S.; Murray, C.B. Competing interactions in dispersions of superpara-magnetic
nanoparticles. Phys. Rev. B 2001, 64, 012408. [CrossRef]
46. Rishton, S.A.; Lu, Y.; Altman, R.A.; Marley, A.C.; Bian, X.P.; Jahnes, C.; Viswanathan, R.; Xiao, G.; Gallagher, W.J.; Parkin, S.S.P.
Magnetic tunnel junctions fabricated at tenth-micron dimensions by electron beam lithography. Microelectron. Eng. 1997, 35,
249–252. [CrossRef]You can also read