Sustainable Cities and Society - CEOM
←
→
Page content transcription
If your browser does not render page correctly, please read the page content below
Sustainable Cities and Society 72 (2021) 103045
Contents lists available at ScienceDirect
Sustainable Cities and Society
journal homepage: www.elsevier.com/locate/scs
Influence of urban morphological characteristics on thermal environment
Jun Yang a, b, *, Yuxin Yang c, Dongqi Sun d, *, Cui Jin a, Xiangming Xiao e
a
Human Settlements Research Center, Liaoning Normal University, Dalian, 116029, China
b
Jangho Architecture College, Northeastern University, Shenyang, 110169, China
c
Human Settlements Research Center, Liaoning Normal University, 116029, Dalian, China
d
Key Laboratory of Regional Sustainable Development Modeling, Institute of Geographic Sciences and Natural Resources Research, CAS, Beijing, 100101, China
e
Department of Microbiology and Plant Biology, Center for Spatial Analysis, University of Oklahoma, Norman, OK, 73019, USA
A R T I C L E I N F O A B S T R A C T
Keywords: Variation in urban microclimate is closely related to the three-dimensional characteristics of cities. To reveal the
Urban morphological characteristics influence of urban spatial forms on land surface temperature (LST), the spatial distribution of LST and five urban
Thermal environment morphology indicators were analyzed, namely floor area ratio (FAR), plot ratio (PR), absolute rugosity (Ra),
Numerical simulation
mean aspect ratio (λc), and sky view factor (SVF). Based on correlation analysis and numerical simulations, the
Dalian
influence of three-dimensional characteristics on the urban thermal environment of Dalian, China was then
analyzed. The results showed that in Dalian, LST ranged from 23.2–50.7 ◦ C, and Moran’s I was 0.94, indicating
that LST presents a strong spatial positive correlation. The buildings in the study area were mainly multi-story
and high-rise buildings and mostly distributed in a medium-density area. LST exhibited the highest positive
correlation (correlation coefficient = 0.569) with FAR and was negatively correlated with SVF (correlation co
efficient =− 0.270). The simulation results showed that in the medium density range (FAR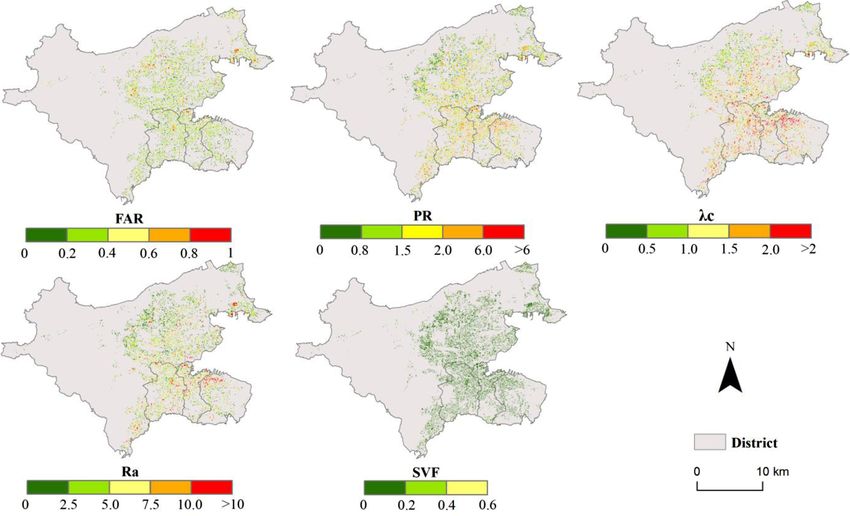
J. Yang et al. Sustainable Cities and Society 72 (2021) 103045
Fig. 1. Location of the study area.
Leadership Group (C40) noted in the ‘Urban Climate Action Impacts simulate and visualize the changes in temperature, wind speed, average
Framework’ that cities must be at the forefront of efforts to avoid the radiation temperature, and other parameters over a small area using
worst of climate change, as they will bear the brunt of its effects (C40 simulation software, which can more accurately reflect the influence of
cities, 2018). In partnership with C40, the McKinsey Centre for Business climate change and urban morphology updates on urban microclimates
and Environment has published ‘Focused Acceleration: A strategic (Zhou & Tian, 2020). Many scholars have used the “local climate zone”
approach to climate action in cities to 2030’. This report lists more than (LCZ) classification system (Stewart & Oke, 2012; Stewart, Oke, &
450 emission-reducing actions, half of which are directly related to Krayenhoff, 2014), selecting the urban morphology indicators closely
buildings (C40 China Buildings Programme, 2018; McKinsey, 2017). In related to the urban thermal environment, such as building density,
order to achieve sustainable urban development, many scholars have building height, plot ratio (PR), sky view factor (SVF), frontal area
proposed the concept of "cool cities." Studies have demonstrated that the index, and other parameters, to analyze the morphology of urban or
main method of alleviating the UHI effect is to reduce the surface tem ganization. By exploring the influence of urban morphology on thermal
perature of buildings and urban spaces. This includes creating cooler environment indices, namely surface temperature and wind potential,
urban surfaces (roofs and sidewalks, etc.) and improving the urban the correlation between the two parameters has been analyzed to further
architectural form and layout. Promoting green infrastructure in urban explore the influence of a specific urban morphology on environmental
construction (trees, parks, forests and green roofs) can also achieve local temperature (Su, Lv, & Yang, 2018; Wang, Cot et al., 2017, Wang, Liang
cooling and alleviate UHI effects (Antonio, Federica, Raffaele, & Fran et al., 2017; Wei, Song, Wong, & Martin, 2016; Yan, Su, & Guan, 2019;
cesca, 2020; Farshid, Ester, Ebrahim, & Soran, 2019; He, 2019; Kibria, Yang, Su, Xia, Jin, & Li, 2018; Yang, Jin, Xiao, Jin, & Xia, 2019; Yang,
Timothy, Jedediah, & OhJin, 2016; Santamouris & Young Yun, 2020; Wang, Xiao, Jin, & Xia, 2019). Other studies have considered the rela
Yue et al., 2019). At present, two-thirds of China’s building stock is tionship between different local urban forms and the thermal environ
located in cities; this figure has been predicted to reach 80 % by 2050 ment as the starting point to explore their relationship through
(C40 China Buildings Programme (C40 CBP, 2018). Therefore, focusing numerical simulations (Galal, Sailor, & Mahmoud, 2020; Liu, Li, Yang,
on urban construction issues is essential to alleviate the UHI effect and Mu, & Zhang, 2020; Toparlar, Blocken, Maiheu, & van Heijst, 2017) and
improve the living environment of residents. have illustrated the complex interactions between three-dimensional
Changes to the urban morphology and microclimate (surface and air morphological characteristics and the local thermal environment in
temperature), caused by the continuous expansion of urban buildings in urban settings (Allegrini, Dorer, & Carmeliet, 2015; Wang, Cot et al.,
both the horizontal and vertical directions, have a significant impact on 2017, Wang, Liang et al., 2017). Some studies have determined the
the health and comfort level of urban residents. Therefore, research has factors affecting the urban thermal environment under a specific layout
focused on the relationship between urban three-dimensional by analyzing the correlation between typical characterization parame
morphology and urban thermal environment (Yang et al., 2021; Yang, ters (such as building height, building density etc.) under different
Shi, Xia, Xue, & Cao, 2020; Yang, Wang, Xiu, Xiao, & Xia, 2020; Yang, building layouts and simulation results (Wang, Zhou, Wang, Fang, &
Sun, Ge, & Li, 2017). Surface temperature can be retrieved from a wide Yuan, 2018; Yang, Shi et al., 2020; Yang, Wang et al., 2020; Yu et al.,
range of remote sensing images; thus, most studies have focused on the 2020). Other studies have focused on the temperature, humidity, wind
correlation between urban morphological characteristics and surface speed, average radiation temperature and predicted mean vote (PMV)
temperature. Current research on the relationship between urban generated in the simulations to explore the influence of urban geometric
three-dimensional morphology and land surface temperatures adopts structure and spatial layout on the thermal environment (Antoniou,
two types of analysis: (1) statistical analysis (i.e., correlation analysis, Montazeri, Neophytou, & Blocken, 2019; Huang, Tsai, & Chen, 2020;
multiple regression, and other statistical methods) is used to analyze the Wang, Cot et al., 2017, Wang, Liang et al., 2017). The results from all of
influence of urban morphology indicators on the land surface temper these studies have demonstrated that a single index is insufficient for
ature (Mahanta & Samuel, 2020; Meng & Xiao, 2018; Wang, Cot, measuring the direct relationship between urban morphology and the
Adolphe, Geoffroy, & Sun, 2017; Wang, Liang, Yang, Liu, & Su, 2017; thermal environment; temperature change is often related to a variety of
Zhang & Cheng, 2019); and (2) numerical simulations, which are used to urban morphological characteristics. It was also observed that
2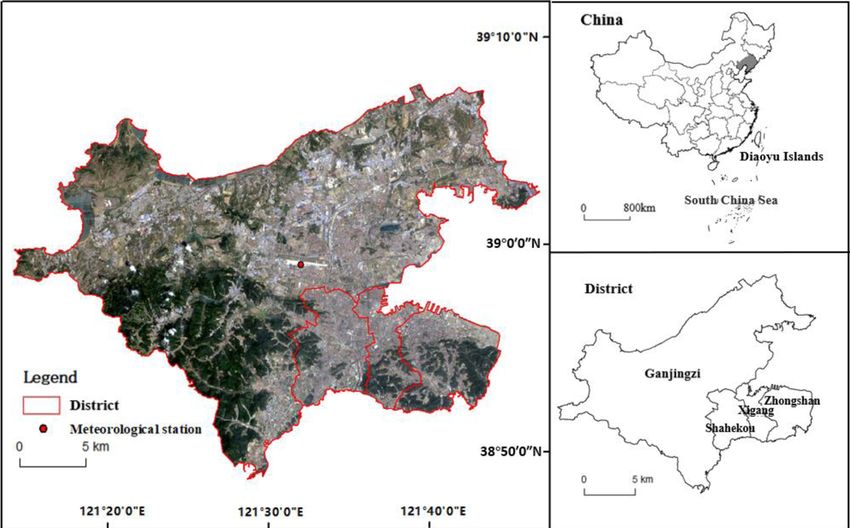
J. Yang et al. Sustainable Cities and Society 72 (2021) 103045
Table 1 thermal environment, based on correlation analysis.
Data sources and descriptions. This study analyzed the spatial relationship between the thermal
Data Descriptions Source Sample environment and three-dimensional architectural form of urban set
tings, by using morphological indicators to determine the architectural
Remoting Landsat8 USGS,
Sensing data OLI (30 m) earthexplorer. parameters that have the greatest impact on surface temperature in
Landsat8 usgs.gov Dalian, China. Subsequently, the software ENVI-met was used to simu
TIRS late the thermal environment of the research area to determine the de
(100 m) tails of the deep connection between urban morphology and the urban
2018-8-9
thermal environment. Thus, this study aims to improve our under
standing of the causes of UHIs in specific environments.
Building data Building Baidumap,
outline, map.baidu.com 2. Data and methods
height, floor
and types.
2018 2.1. Study area
Dalian is located between 121◦ 44’–121◦ 49’ E and 39◦ 01’–39◦ 04’ N
at the southernmost point of the Liaodong Peninsula in northeastern
Meteorological 2018-8-9 China – China, in the East Asian monsoon region. It has a mild climate which
data Meteorological
features four distinct seasons, humid air, concentrated precipitation, and
Data Network,
rp5.ru strong winds. In this study, the Zhongshan, Xigang, Shahekou, and
Ganjingzi Districts were selected as study sites (Fig. 1).
2.2. Research data
Table 2
Building height classification.
The urban morphology parameters were calculated using the build
Building type Classification standard/floor
ing data of Dalian. Land surface temperatures were retrieved from
Low-rise building 1− 3 Landsat8 remote sensing image data (August 9, 2018, cloud content of
Multistory building 4− 6
less than 5 %). The historical meteorological data on August 9, 2018
Middle-high rise building 7− 9
High-rise building 10− 39
were selected as the initial conditions for the numerical simulation
Super-High rise building > = 40 (Table 1). The building data contain information such as the basic height
of the building, the number of floors, the footprint, and the perimeter.
Urban morphology indicators were calculated using geographical in
three-dimensional morphological characteristics have a more significant formation systems (GIS). The buildings in the study area were catego
impact on the urban thermal environment than two-dimensional char rized according to the current national ‘Code for Design of Civil
acteristics (Huang & Chen, 2020; Ku & Tsai, 2020; Li, Ren, & Zhan, Buildings’ (GB50352-2005; (China, 2015) (Table 2). The images were
2020; Tian, Zhou, Qian, Zheng, & Yan, 2019). Therefore, it is necessary first preprocessed in ENVI 5.3 using the FLAASH atmospheric correction
to select indices closely related to the three-dimensional characteristics module to eliminate the influence of the atmosphere and sun on the
of cities and combine them with statistical analysis and numerical reflection information and to obtain accurate surface reflection infor
simulation to explore the influence of urban morphology on the urban mation. The Mono-window algorithm was used to calculate the surface
Table 3
Description of urban morphology indicators.
Urban morphological indicator Formula and Description
∑
Floor area ratio (FAR) FAR = λp = Ai /S
i
Floor area ratio, also called building coverage ratio or building density, is
where Ai is the build area of the ground floor of the ith building, S represents the total area of the
defined as the ratio of footprint of the buildings to the overall site area.
land. The building coverage ratio is an indicator to describe the building density and the land use.
∑( )
Plot ratio(PR) PR = λa = Aij /S
Plot ratio, also called land use coefficient, is defined as the amount of ij
construction permitted (in planning) on a land according to its size. where Aij is the built area of the jth floor of the ith building and S represents the total area of land.
∑
Mean aspect ratio(λc) λc = Ei /S
i
The indicator provides extra information on the links between building
where Ei is the envelop area of the ith building, which includes the surfaces of all the external walls
surfaces and the external environment in relation to the ground surface.
and the roofs.
∑
Absolute rugosity(Ra ) Ra = (Ai Ni )ΔH/S = H ∗ λp
As a parameter to describe the roughness of a surface to resist the free wind, i
absolute rugosity for a city is the average obstacle height over the whole Where Ni is the number of floors of the ith building,ΔH is the average height of a building.
examined area.
Sky view factor(SVF)
SVF is defined as the ratio of the amount of radiation received (or emitted)
on the surface of the earth to the amount emitted (or received) by the entire
hemisphere and is used to measure the extent to which radiation
transmission at a particular location is blocked. SVF = 0 means the sky is
obstructed so that all radiation is blocked; SVF = 1 means there is no
obstruction and the earth receives (or emits) all radiation.
∑n ( α )
2
SVF = 1 − i=0 sin β⋅
360
where n = 360/α.
3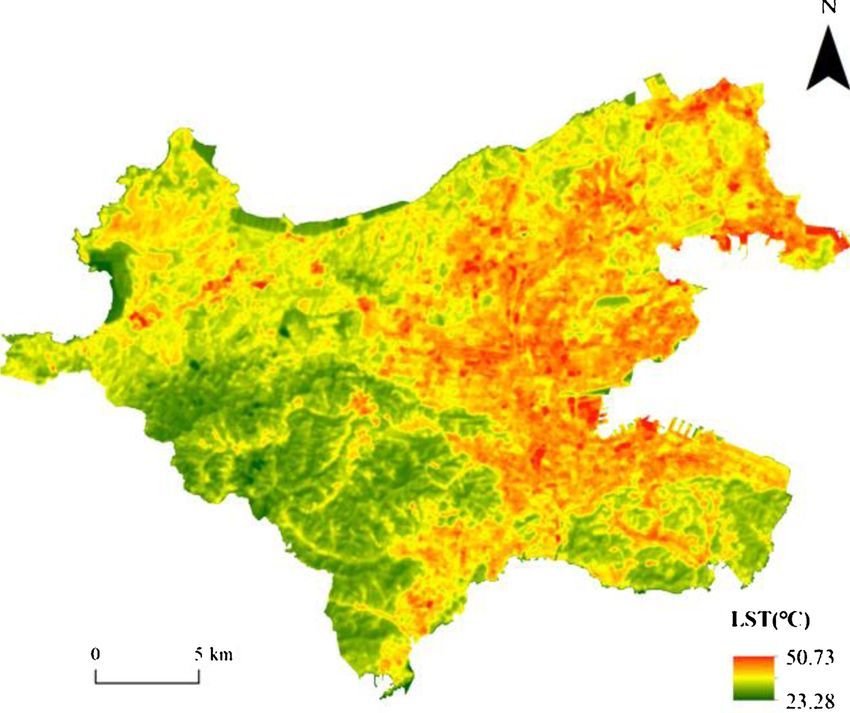
J. Yang et al. Sustainable Cities and Society 72 (2021) 103045
Table 4
Model parameters.
Models
FAR = 0.18 (a)
FAR = 0.36 (b)
FAR = 0.54 (c)
temperature (Qin, Zhang, Karnieli, & Berliner, 2001). Landsat thermal
Table 5
infrared band 10 was used to retrieve the LST through the following
Initial conditions of the simulation.
formulas:
Data type Parameter Value
Ts = (a(1 − C − D) + (b(1 − C − D) + C + D )T10 − DTa )/(C − 237.15)
Date 2018-08-09
(1) Simulation time
Time 24 h
Wind speed 3.0 m/s
C = ετ (2) Wind direction 135 ◦
Minimum air temperature 25.7 ℃
Meteorological parameters
D = (1 − τ)[1 + (1 − ε)τ ] (3) Maximum air temperature 30.7 ℃
Minimum relative humidity 57.00 %
Maximum relative humidity 83.00 %
Here, Ts is the retrieved LST (K); T10 is the brightness temperature (K)
on the sensor; Ta is the average temperature of the atmosphere (K); a and
b are reference coefficients (a = − 67.355351, b = 0.458606); ε is the ∑
land surface emissivity of T10; and τ is the atmospheric transmittance of (x − x)(y − y)
r = √̅̅̅̅̅̅̅̅̅̅̅̅̅̅̅̅̅̅̅̅̅̅̅̅̅̅̅̅̅̅̅̅̅̅̅̅̅̅̅̅̅̅̅̅ (4)
∑ ∑
T10. (x − x)2 (y − y)2
2.3. Research methods where (x, y) and (x, y) are the observed and average values of variables x
and y, respectively.
Firstly, the spatial distribution of the surface temperature in summer
was analyzed, and five urban form indicators, namely floor area ratio 2.3.3. Numerical simulation
(FAR), plot ratio (PR), absolute rugosity (Ra), mean aspect ratio (λc), The microclimate simulation software ENVI-met was developed in
and sky view factor (SVF), were selected for calculation and visualiza 1998 by Michael Bruce and Heribert Fleer of the University of Bochum,
tion. The correlation between the land surface temperature and urban Germany (Yang, Shi et al., 2020; Yang, Wang et al., 2020). This software
morphology parameters was then calculated to obtain the indicators simulates the urban microclimate based on computational fluid dy
with the greatest influence on the surface temperature. This indicator namics, fundamental laws of thermodynamics, and theoretical knowl
was then set as the only variable. Under the premise of only controlling edge of urban meteorology (Abdallah, Hussein, & Nayel, 2020; Sharmin,
the change in this indicator, the urban buildings were simplified and Steemers, & Matzarakis, 2017; Tsoka, Tsikaloudaki, & Theodosiou,
modeled through ENVI-met to explore the influence of this indicator on 2018; Tsoka, Tsikaloudaki, & Theodosiou, 2018). It provides a spatial
the variables that make up the urban thermal environment, such as precision of 0.5–10 m and a temporal precision of 10 s, and the typical
temperature, wind speed, relative humidity, and mean radiant temper simulation duration is 24–48 h. Such simulations provide accurate re
ature. Preprocessing of images, including radiometric calibration and flections of the impact of microclimate change and urban landscape
FLAASH atmospheric correction, was performed in ENVI 5.3. The in renewal on the microclimate of the study are. The version used in this
dicators were calculated using ArcGIS 10.2, Pearson correlation analysis study was ENVI-met 4.4.
was performed using SPSS 24.0, and ENVI-met 4.4 was used for nu Considering the accuracy and scientific nature of the simulation, the
merical simulation. simulation scale was set to 100 m × 100 m. To ensure that other pa
rameters (building height, layout, etc.) were not changed and that
2.3.1. Urban morphology indicators building density was the only variable factor, the urban building model
Urban morphology is connected to the urban canopy and the scale of was simplified. The dimensions of each building model were set based
streets and buildings, and can significantly affect the wind patterns in on the GIS calculation results, as 20 m × 15 m × 15 m. The specific
urban areas and thereby affect human thermal sensation. Therefore, the model parameters are presented in Table 4 and the initial conditions of
urban morphological indicators listed in Table 3 were selected to the simulation are shown in Table 5. Combining the calculation results
analyze the effect of architectural forms on urban surface temperature of this paper and the building density classification standard from the
(Wang, Cot et al., 2017, Wang, Liang et al., 2017). research of Yang et al. (2017), three density grades of 0.18, 0.36 and
0.54 were used to explore the specific influence of building density on
2.3.2. Correlation analysis the four thermal environment representational variables, namely, air
The Pearson’s simple correlation coefficient r was used to calculate temperature, wind speed, relative humidity, and mean radiation
the correlations between parameters: temperature.
In the thermal environment simulation, there was a slight deviation
between the actual measured temperatures and the simulated temper
4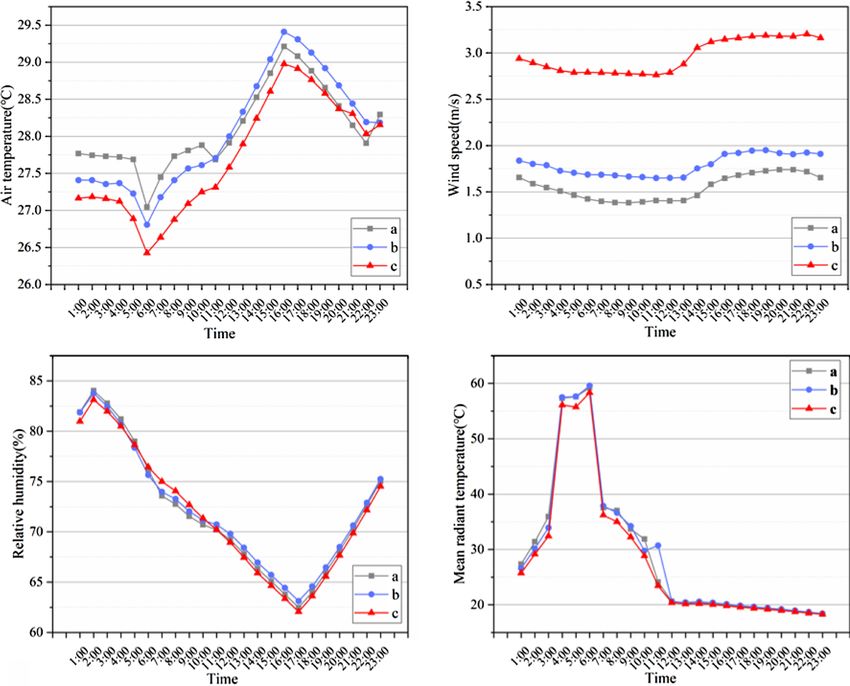
J. Yang et al.                                                                                                                   Sustainable Cities and Society 72 (2021) 103045

Table 6                                                                                        √̅̅̅̅̅̅̅̅̅̅̅̅̅̅̅̅̅̅̅̅̅̅̅̅̅̅̅̅̅̅
                                                                                               √
The statistical results of surface temperature in different regions (℃).                       √1 ∑    N
                                                                                        RMSE = √             (at − bt )                                                     (6)
  District /Value   Minimum     Maximum      Range     Average    Standard                       N t=1
                                                                  deviation

  Ganjingzi         23.28       49.01        25.73     34.82      3.29                  where ‘a’ denotes a measured value, ‘b’ a simulated value, and ‘N’ the
    District
                                                                                        number of measurements.
  Shahekou          27.40       47.02        19.62     36.62      2.88
    District
  Xigang District   28.13       50.73        22.60     36.90      3.40                  3. Results and analysis
  Zhongshan         25.50       43.87        18.37     34.99      2.88
    District                                                                            3.1. Spatial distribution of surface temperature and urban morphology

atures. In this study, percentage error (PE), root mean square error                        The distribution of buildings in the study area is shown in Fig. 3. The
(RMSE), and R2 were used to evaluate the accuracy of the simulation.                    buildings are mostly situated in the eastern part of the study area and are
                                                                                        taller here. Conversely, buildings in the western region are more
        |a − b|                                                                         sparsely distributed and lower in height. Table 6 shows that the surface
PE =            × 100%                                                        (5)
            a                                                                           temperature in the study area ranged from 23.2–50.7 ◦ C, with an
                                                                                        average temperature difference of 2.08 ◦ C. The highest temperature was
where ‘a’ denotes a measured value and ‘b’ denotes a simulated value.
                                                                                        measured in Xigang District (50.73 ◦ C, highest average temperature of
                                                                                        36.90 ◦ C), while the lowest temperature of 23.28 ◦ C was measured in

                                            Fig. 2. The spatial distribution of land surface temperature in the study area.

                                                                 Fig. 3. 3D display of building data.

                                                                                    5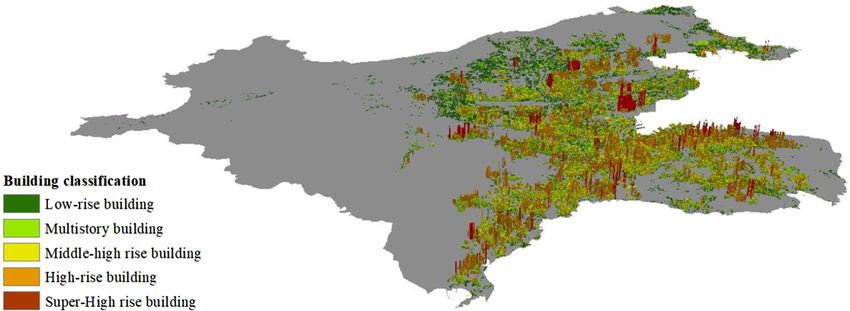
J. Yang et al. Sustainable Cities and Society 72 (2021) 103045
Fig. 4. The spatial distribution of urban morphological parameters.
Table 7
The statistical results of building stock in different regions.
District Low-rise Multistory Middle-high rise High-rise Super-high rise
Ganjingzi District 54.81 % 23.47 % 12.75 % 8.50 % 0.47 %
Shahekou District 25.15 % 31.08 % 28.37 % 14.90 % 0.50 %
Xigang District 33.25 % 30.94 % 24.88 % 10.88 % 0.05 %
Zhongshan District 30.01 % 30.81 % 22.42 % 15.77 % 0.98 %
Total 44.45 % 26.45 % 17.86 % 10.75 % 0.50 %
Ganjingzi District. The spatial autocorrelation analysis of the surface Ra, λc) are mostly distributed in the Zhongshan and Xigang Districts
temperature revealed that the global spatial autocorrelation coefficient because the area around the Qingniwa Bridge and Renmin Road in the
(Moran’s I) had a value of 0.94, indicating that the surface temperature north of Zhongshan District is the most prosperous commercial, finan
exhibits a strong positive spatial correlation. Fig. 2 shows that the cial, and information center in Dalian, with a large number of high-rise
northeast of the study area is the high-temperature region, whereas the office buildings and shopping malls. The total land area of Xigang Dis
southwest generally exhibited lower temperatures, which is consistent trict is relatively small, as is the available land area. However, contin
with the spatial distribution of buildings. This result can be explained by uous expansion of the urban population and urban areas have caused a
the concentration of buildings, dense population, and low vegetation significant increase in building density and building height in the region.
coverage in the northeastern part of the study area, which increases the SVF ranges from 0.0 to 0.6 and is in the range of 0.0–0.4, indicating that
surface temperature, whereas the southwest and southeast of the study the buildings have a stronger shielding effect on solar radiation. The
area contain large green spaces and nature reserves with limited higher the building height and density, the smaller the SVF in the area, i.
building coverage, resulting in relatively low surface temperatures. e., the stronger the shielding effect on solar radiation.
Fig. 4 shows that buildings are mainly distributed in the eastern part
of the study area, with the building density ranging between 0.2 and 0.6,
3.2. Analysis of correlation between LST and urban morphology
indicating a medium-density area. PR values of 6.0 indicates super high-rise
0.446, 0.429, 0.463, and -0.270, respectively, all significant at the level
buildings. Roughness reflects the vertical characteristics of urban
of 0.01 (Table 8). Consistent with the linear fitting results, as FAR, PR,
buildings and represents the average obstacle height of the measured
area. Table 7 shows that with the exception of Ganjingzi District, about Table 8
70 % of the buildings in the study area are multi-story and high-rise The correlation between land surface temperature and urban morphological
buildings, which is consistent with the trend exhibited in Fig. 3, where parameters.
most regions have PR values of >2 and Ra values of >6 m. The λc value FAR PR Ra λc SVF
is influenced by the horizontal and vertical dimensions of the buildings;
LST 0.569** 0.446** 0.429** 0.463** − 0.270**
thus, it plays an important role in heat exchange between the buildings
**
and the environment. The high values of these four indicators (FAR, PR, indicates significant correlation at 0.01 level (double tails).
6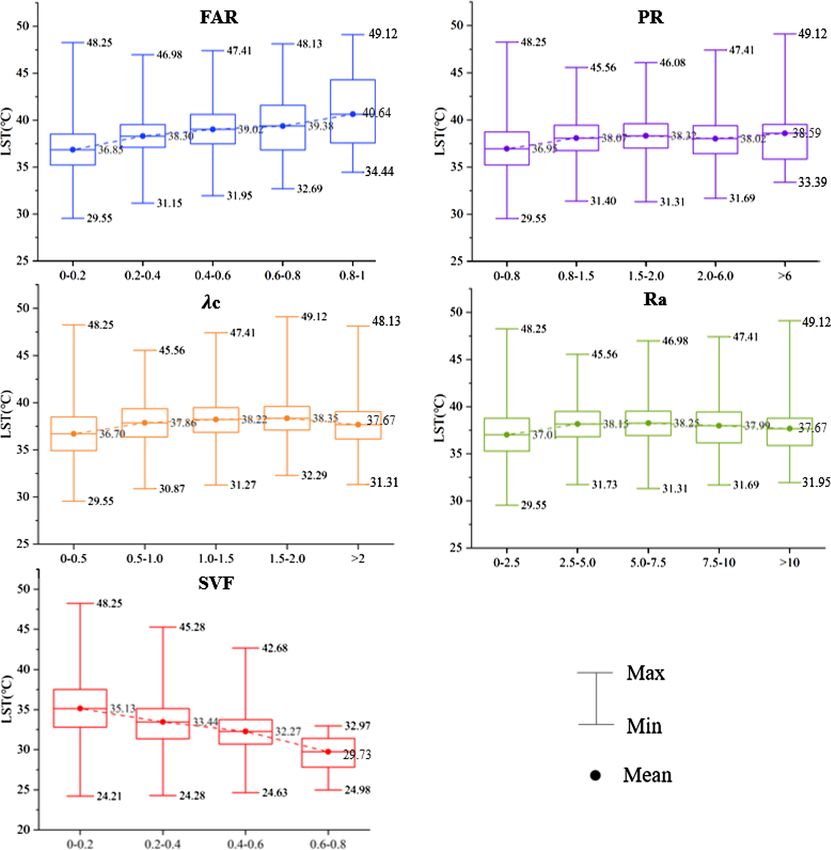
J. Yang et al. Sustainable Cities and Society 72 (2021) 103045
Fig. 5. The analysis results of the distribution interval between morphological parameters and land surface temperature.
Ra, and λc increased, the average surface temperature in each interval simulation accuracy in Table 9, the overall value was within its error
also increased (Fig. 5). With a horizontal increase in building distribu range, indicating that the simulation results are relatively reliable.
tion and a vertical increase in building height, the surface area of the In the results of simulations with different building densities, the
buildings receiving solar radiation will also increase. This results in the three curves of relative humidity variation coincide, the air temperature
lengthening of the heat radiation process between the buildings, and a and mean radiation temperature exhibit slight differences, and only the
reduction in air circulation, which is not conducive to the dissipation of wind speed is significantly affected by building density (Fig. 8). Fig. 7
heat; thus, the land surface temperature will rise. The maximum value of shows the spatial distribution of the three models and illustrates dif
the land surface temperature initially decreased and then increased, and ferences in air temperature, wind speed, relative humidity, and mean
the minimum values generally showed an upward trend. The SVF was radiation temperature at 14:00 between each model. The increase in
negatively correlated with the land surface temperature; thus, as SVF building density causes a gradual decrease in building spacing, which
increased, the average land surface temperature gradually decreased. changes the street aspect ratio to a certain extent. This in turn blocks the
airflow between the buildings, reducing the ventilation and heat dissi
pation in the building group, resulting in a decline in wind speed. The
3.3. Simulation results wind speed is only higher at the tuyere; the higher the building density,
the smaller the high-wind-speed area and the larger the proportion of
To ensure the reliability of the simulation, the results were compared the low-wind-speed area, which leads to poor ventilation and thermal
with data from a local meteorological station located in Dalian at discomfort. According to Fig. 9, the 24 h average wind speeds from
Zhoushuizi Airport (China Meteorological Data Network) (Fig. 6). The models a, b, and c (where a, b, and c represent FARs of 0.18,0.36 and
minimum PE of the temperature was 1.26 %, the maximum PE of the 0.54, respectively) were 1.48, 1.79, and 2.97 m/s, respectively. When
temperature was 6.29 %, and the average statistical error was 3.90 %, FAR increased from 0.18 to 0.36, the average rate of change in the wind
with RMSE = 1.23 ◦ C and R2 = 0.870. Referring to the range of
7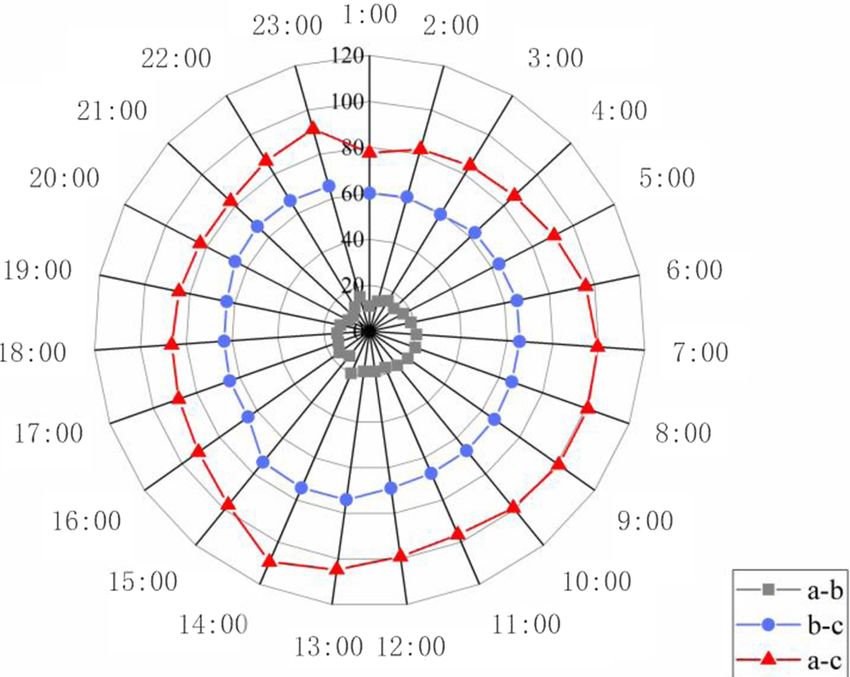
J. Yang et al. Sustainable Cities and Society 72 (2021) 103045
urban buildings and the environment (Wang, Cot et al., 2017, Wang,
Liang et al., 2017). Therefore, it is more scientifically meaningful to
study the correlation between these and the urban land surface
temperature.
With continuing economic and social development, the number of
urban buildings continues to increase, and human activities have altered
the characteristics of the urban land surface, resulting in an intensified
UHI effect, which will inevitably have a negative effect on the urban
microclimate. The characteristics of the urban thermal environment are
closely related to human thermal comfort. Existing studies have proved
that natural parameters like air temperature and humidity, wind speed,
solar radiation, soil temperature, and humidity are very sensitive to any
three-dimensional changes in an urban setting. Urban geometry has a
significant influence on urban microclimate conditions (Omar, David, &
Hatem, 2020; Tania, Koen, & Andreas, 2017). Four of these meteoro
logical parameters, namely temperature, relative humidity, mean radi
ation temperature, and wind speed, are directly affected by urban
morphology and surface materials. They are all closely related to land
surface temperature and the thermal environment and are the most
important climatic parameters that affect thermal comfort (Cao, Zhou,
Fig. 6. The comparison of site temperature and simulated temperature. Zheng, Ren, & Wang, 2021; Goldblatt, Addas, Crull, Maghrabi, & Levin,
2021; Nasrollahi, Ghosouri, Khodakarami, & Taleghani, 2020; Tsoka
et al., 2018a, 2018b; Yang, Shi et al., 2020; Yang, Wang et al., 2020). As
Table 9
the main characterization factor of the urban thermal environment,
Verification of simulation accuracy. excessively high land surface temperatures will ultimately lead to
thermal discomfort in cities, which is not conducive to the thermal
Verification method Error range
experience of urban residents (Goldblatt et al., 2021; Nasrollahi et al.,
Percentage Error 3.75 % 2020; Obiefuna, Okolie, Nwilo, Daramola, & Isiofia, 2021). Therefore, it
RMSE 1.11− 1.62℃
is necessary to understand the formation and variation of the urban
R2 >0.8
thermal environment by determining which indicator has the greatest
impact on LST and then exploring how the four thermal environment
speed was 15.76 %, when FAR increased from 0.36 to 0.54, it was 65.92 representational variables are affected by different building densities.
%, and when FAR increased from 0.18 to 0.54, it was 92.12 %. This
indicates that with a medium building density (FAR < 0.6), the wind 4.2. Correlation analysis results
speed tends to increase with the increase in building density.
The correlations calculated between the surface temperature and its
4. Discussion influencing factors exhibited significant variation at different grid scales
and study sites. For example, at a grid scale of 30 m, the correlation
Rapid urbanization intensifies the UHI effect, which not only poses a between building density and land surface temperature in Dalian in
threat to the sustainable development of cities and affects human health, 2002 and 2014 was 0.514 and 0.537, respectively (Su et al., 2018),
but also brings huge economic and social losses. To reduce the damage while the correlation between building height and land surface tem
caused by the UHI effect, some scholars have proposed the concept of perature in 2007 and 2017 was 0.346 and 0.331, respectively (Yan et al.,
"cool cities", in which the local thermal environment is improved by 2019). However, in Chongqing (which is a mountainous city), under the
optimizing the building layout. Therefore, this study investigated the same spatial scale of 30 m, the correlation between building density and
influence of the three-dimensional morphological characteristics of a land surface temperature was only 0.047. Moreover, PR does not show a
city on the local thermal environment, and by using numerical simula significant correlation with land surface temperature (Guo et al., 2020).
tions, revealed the influence of urban buildings on the surrounding When examining the correlation between SVF and land surface tem
thermal environment. The results will improve our understanding of the perature, Guo et al. (2020) found that as grid size increases, the corre
influence of urban morphology on the variations in the urban thermal lation coefficient increases and is always positive; however, Chun and
environment and will support future urban planning and construction Guldmann (2014) showed that the smaller the grid scale, the weaker the
efforts to realize sustainable urban development. explanatory effect of SVF on land surface temperature, and that the
correlation coefficient was always negative. Therefore, different study
4.1. Selection of parameters sites and scales will influence the calculation results (Berger et al., 2017;
Chun & Guldmann, 2014; Guo et al., 2020; Scarano & Mancini, 2017).
Most studies on the correlation between urban morphology and land This study used a grid scale of 100 m to remain consistent with the scale
surface temperature have selected two-dimensional or three- of the simulation, so that the correlation coefficient could be calculated.
dimensional indicators and examined them separately: a common two- The resulting correlation coefficients between land surface temperature
dimensional indicator is building density (Berger, Rosentreter, Vol and FAR, PR, Ra, λc, and SVF were 0.569, 0.446, 0.429, 0.463, and
tersen, Baumgart, & Schmullius, 2017; Yang et al., 2018); -0.270, respectively, indicating that the optimal scale of the correlation
three-dimensional indicators include building height, PR, and SVF (Guo, analysis should be determined according to the specific morphological
Han, Xie, Cai, & Zhao, 2020; Li et al., 2020; Yang, Shi et al., 2020; Yang, indicators and the study site.
Wang et al., 2020). In this study, where the effects of both
two-dimensional and three-dimensional factors were considered, λc and 4.3. ENVI-met simulation
Ra were also introduced. These two indicators can characterize the
three-dimensional morphology of the city, and also have a degree of In this study, the data from the meteorological station were used as
influence on the local ventilation effect and the heat exchange between the initial conditions; PE, RMSE, and R2 were used to evaluate the
8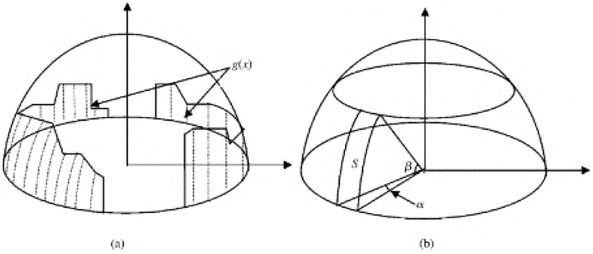
J. Yang et al. Sustainable Cities and Society 72 (2021) 103045
Fig. 7. Visualization results of air temperature, wind speed, relative humidity and mean radiation temperature for three models at 14:00.
accuracy of the simulation. The evaluation results were as follows: environment on a larger urban scale. Determining the relationship be
temperature exhibited a minimum PE of 1.26 %, maximum PE of 6.29 %, tween regional microclimate characteristics and building density, based
and average statistical error of 3.90 %, with RMSE of 1.23 ◦ C, and R2 of on ENVI-met simulations, is helpful for the optimization of urban resi
0.870. Compared with the accuracy range of other studies, the overall dential planning and design, and provides a basis for environmental
value is within the range of acceptable error (PE = 3.75 %, improvement of built-up areas. Due to the limitation of scale and other
RMSE = 1.11–1.62 ◦ C, R2 >0.80) (Chen, Wu, Yu, & Wang, 2020; Wang problems, the simulation results cannot accurately reflect specific im
et al., 2018; Yang, Shi et al., 2020; Yang, Wang et al., 2020), indicating pacts of building density changes on the urban environment, but it still
that the simulation results are relatively reliable. provides the overall variation trend of the thermal environment. How
As a micro-scale model, ENVI-met is an important tool for urban ever, future studies should consider the scale of the research and explore
climate analysis. Most of the existing research has focused on the scale of the scientific relationship between building density and wind speed in
a community or block, generally within 500 m, and the simulation re real urban spaces.
sults have been proved to be relatively scientific and reliable (Dario,
Giorgio, Biagio, Iole, & Stefano, 2014; P López-Cabeza, Galán-Marín, 4.4. Limitations
Rivera-Gómez, & Roa-Fernández, 2018; Tsoka et al., 2018a, 2018b).
Therefore, this study simplified the modeling of small-scale buildings, There are many limitations to this study, including the lack of a
aiming to simulate the impact of changing building density on the sur standard reference scale for the grid division of the study area, which
rounding thermal environment, and study the variation in the thermal may affect the accuracy of the calculated urban morphological in
environment on a micro scale, to further reflect on the urban scale. The dicators and the correlations between the indicators and land surface
results showed that even in a small area, the urban microclimate showed temperature. In numerical simulations, data from the meteorological
significant variation. Therefore, we have reason to believe that changes stations were used directly as the initial conditions, the urban building
in building density will inevitably lead to changes in the thermal model and layout were simplified without considering objective factors
9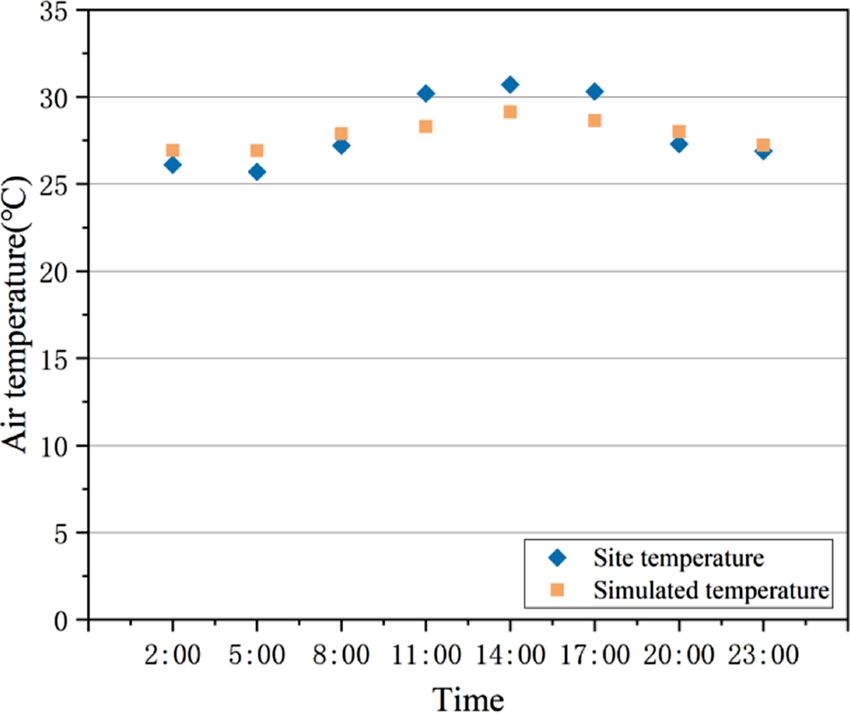
J. Yang et al. Sustainable Cities and Society 72 (2021) 103045
Fig. 8. 24-h change curves of air temperature, wind speed, relative humidity and mean radiation temperature(a, b and c represent FAR of 0.18,0.36 and 0.54,
respectively).
vegetation distribution and three-dimensional characteristics of the city.
5. Conclusions
In this study, Landsat-8 OLI remote sensing data was used to obtain
the urban surface temperature of Dalian, China; a series of urban
morphology indicators were selected and calculated to study the rela
tionship between the thermal environment and the three-dimensional
building morphology in Dalian’s central urban area. Furthermore, the
numerical simulation software ENVI-met was used to simulate the
thermal environment of the study area to determine the effects of
architectural morphology on the surrounding thermal environment. The
results can be summarized as follows:
(1) The land surface temperature of the study area ranged from
23.2–50.7 ◦ C, and the global spatial autocorrelation coefficient
(Moran’s I) was 0.94, indicating that land surface temperature
exhibits a strong positive spatial correlation. The FAR ranged
from 0.2 to 0.6, PR ranged from 2 to 6, and SVF ranged from 0 to
0.4, demonstrating that the buildings in the study area are mainly
Fig. 9. 24 h wind speed change rate(%)(a, b and c represent FAR of 0.18,0.36 multi-story and high-rise buildings and primarily distributed
and 0.54, respectively). within a medium-density area. The high-density and high-rise
buildings are mostly distributed in the financial and commer
such as building materials and vegetation, which means that the cooling cial center of the research area, which conforms to the reality that
effect of vegetation was ignored, which may impact the simulation re high-rise buildings have become common in cities due to the
sults. Therefore, the role of vegetation in reducing the UHI effect should continuous increase in urban construction and continuous
be considered in future research, and changes to the thermal environ decrease in available urban land associated with rapid economic
ment within urban spaces should be discussed by integrating the and social development.
10J. Yang et al. Sustainable Cities and Society 72 (2021) 103045
(2) The correlation coefficients between the land surface tempera images/72_C40_China_Buildings_Programme_Launch_Report_-_English_Layout_Web.
original.pdf?1538030392.
ture and FAR, PR, Ra, λc, and SVF were calculated as 0.569,
C40 cities. (2018). Urban climate action impacts framework: A framework describing and
0.446, 0.429, 0.463, and − 0.270, respectively. In other words, measuring the wider impacts of urban climate action. Retrieved from https://c40-pr
building density has the greatest influence on and is positively oduction-images.s3.amazonaws.com/other_uploads/images/1670_C-40_UCAIF_rep
correlated with the land surface temperature, whereas SVF has ort_26_Feb_2.original.pdf?1521042661.
Cao, J., Zhou, W., Zheng, Z., Ren, T., & Wang, W. (2021). Within-city spatial and
the smallest influence and is negatively correlated with the land temporal heterogeneity of air temperature and its relationship with land surface
surface temperature. temperature. Landscape and Urban Planning, 206, Article 103979. https://doi.org/
(3) Building density mainly affects the urban thermal environment 10.1016/j.landurbplan.2020.103979
Chen, Y., Wu, J., Yu, K., & Wang, D. (2020). Evaluating the impact of the building density
by influencing the wind speed. In medium density (FAR < 0.6) and height on the block surface temperature. Building and Environment, 168, Article
areas, there is a positive correlation between wind speed and 106493. https://doi.org/10.1016/j.buildenv.2019.106493
building density. As the building density increases, the wind China MOCP. (2015). Code for design of civil buildings. GB 50352-52005. Retrieved from.
China Architecture & Building Press https://www.soujianzhu.cn/Norm/JzzyXq.
speed increases. However, wind speed is also affected by building aspx?id=386.
height, building materials and other aspects, thus influencing the Chun, B., & Guldmann, J. M. (2014). Spatial statistical analysis and simulation of the
land surface temperature. Therefore, under the premise of fixed urban heat island in high-density central cities. Landscape and Urban Planning, 125,
76–88. https://doi.org/10.1016/j.landurbplan.2014.01.016
building density, measures such as increasing building height, Dario, A., Giorgio, G., Biagio, M., Iole, N., & Stefano, S. (2014). Evaluating mitigation
changing building materials, and planning building layout to effects of urban heat islands in a historical small center with the ENVI-Met® climate
construct reasonable ventilation corridors can improve urban model. Sustainability, 6, 7013–7029. https://doi.org/10.3390/su6107013
Fan, P., Yue, W., Zhang, J., Huang, H., Messina, J., et al. (2020). The spatial restructuring
ventilation and reduce the UHI effect.
and determinants of industrial landscape in a mega city under rapid urbanization.
Habitat International, 95, Article 102099. https://doi.org/10.1016/j.
By combining correlation analysis and numerical simulations, this habitatint.2019.102099
study analyzed the relationship between three-dimensional morpho Farshid, A., Ester, H. G., Ebrahim, S., & Soran, M. (2019). Urban green space cooling
effect in cities. Heliyon, 5, 1339. https://doi.org/10.1016/j.heliyon.2019.e01339
logical characteristics and the local thermal environment in Dalian, Feng, Z., Wang, S., Jin, S., & Yang, J. (2019). The influence of urban morphology and
China. This study, therefore, improves our understanding how the three- wind environment on surface temperature in Changchun city. Journal of Geographical
dimensional morphology impacts the urban thermal environment and Sciences, 74, 902–911. http://kns.cnki.net/KCMS/detail/detail.aspx?FileName=D
LXB201905006&DbName=CJFQ2019.
can provide scientific suggestions for future urban planning and con Galal, O. M., Sailor, D. J., & Mahmoud, H. (2020). The impact of urban form on outdoor
struction, thereby effectively alleviating the UHI effect and realizing thermal comfort in hot arid environments during daylight hours, case study: New
sustainable urban development. Aswan. Building and Environmnet, 184, 107222. https://doi.org/10.1016/j.
buildenv.2020.107222
Goldblatt, R., Addas, A., Crull, D., Maghrabi, A., Levin, G. G., et al. (2021). Remotely
Declaration of Competing Interest sensed derived land surface temperature (LST) as a proxy for air temperature and
thermal comfort at a small geographical scale. Land, 10, 410. https://doi.org/
10.3390/land10040410.Guo
This manuscript has not been published or presented elsewhere in Guo, J., Han, G., Xie, Y., Cai, Z., & Zhao, Y. (2020). Exploring the relationships between
part or in entirety and is not under consideration by another journal. We urban spatial form factors and land surface temperature in mountainous area: A case
have read and understood your journal’s policies, and we believe that study in Chongqing city, China. Sustainable Cities and Society, 61, Article 102286.
https://doi.org/10.1016/j.scs.2020.102286
neither the manuscript nor the study violates any of these. There are no He, B. (2019). Towards the next generation of green building for urban heat island
conflicts of interest to declare. mitigation: Zero UHI impact building. Sustainable Cities and Society, 50, Article
101647. https://doi.org/10.1016/j.scs.2019.101647
He, B., Ding, L., & Prasad, D. (2020a). Relationships among local-scale urban
Acknowledgements
morphology, urban ventilation, urban heat island and outdoor thermal comfort
under sea breeze influence. Sustainable Cities and Society, 60, Article 102289. https://
The authors would like to acknowledge all colleagues and friends doi.org/10.1016/j.scs.2020.102289
who have voluntarily reviewed the translation of the survey and the He, B., Ding, L., & Prasad, D. (2020b). Wind-sensitive urban planning and design:
Precinct ventilation performance and its potential for local warming mitigation in an
manuscript of this study. This research study was supported by the open midrise gridiron precinct. Journal of Building Engineering, 29. https://doi.org/
National Natural Science Foundation of China (grant no. 41771178, 10.1016/j.jobe.2019.101145
42030409, 41671151), the Fundamental Research Funds for the Central Huang, J., & Chen, L. (2020). A numerical study on mitigation strategies of urban heat
islands in a tropical megacity: A case study in Kaohsiung City, Taiwan. Sustainability
Universities (grant no. N2111003), the Second Tibetan Plateau Scien (Basel, Switzerland), 12, 3952. https://doi.org/10.3390/su12103952
tific Expedition and Research Program (STEP) (grant no. Huang, C., Tsai, H., & Chen, H. (2020). Influence of weather factors on thermal comfort
2019QZKK1004), and Innovative Talents Support Program of Liaoning in subtropical urban environments. Sustainability (Basel, Switzerland), 12(2001).
https://doi.org/10.3390/su12052001
Province (Grant No. LR2017017). Jiang, S., Zhan, W., Yang, J., Liu, Z., & Huang, F. (2020). Research progress on
spatiotemporal differentiation of urban heat island under the framework of local
References climate zoning. Journal of Geographical Sciences, 75, 1860–1878. http://kns.cnki.
net/KCMS/detail/detail.aspx?FileName=DLXB202009005&DbName=DKFXTEMP.
Kibria, K. R., Timothy, O., Jedediah, B. A., & OhJin, W. (2016). Simulating the effects of
Abdallah, A. S. H., Hussein, S. W., & Nayel, M. (2020). The impact of outdoor shading
cool roof and PCM (phase change materials) based roof to mitigate UHI (urban heat
strategies on student thermal comfort in open spaces between education building.
island) in prominent US cities. Energy, 96, 103–117. https://doi.org/10.1016/j.
Sustainable Cities and Society, 58, Article 102124. https://doi.org/10.1016/j.
energy.2015.11.082
scs.2020.102124
Ku, C., & Tsai, H. (2020). Evaluating the influence of urban morphology on urban wind
Allegrini, J., Dorer, V., & Carmeliet, J. (2015). Influence of morphologies on the
environment based on computational fluid dynamics simulation. ISPRS International
microclimate in urban neighborhoods. Journal of Wind Engineering and Industrial
Journal of Geo-Information, 9, 399. https://doi.org/10.3390/ijgi9060399
Aerodynamics, 144, 108–117. https://doi.org/10.1016/j.jweia.2015.03.024
Kuang, W. (2018). Research progress and prospect of urban land use/cover change and
Antonio, L., Federica, G., Raffaele, P., & Francesca, C. (2020). Nature-based climate
ecological regulation of thermal environment. Scientia Geographica Sinica, 38,
adaptation for compact cities: Green courtyards as urban cool islands. Plurimondi, 18,
1643–1652. http://kns.cnki.net/KCMS/detail/detail.aspx?FileName=DLKX20
83–110. http://plurimondi.poliba.it/index.php/Plurimondi/article/view/156.
1810008&DbName=DKFX2018.
Antoniou, N., Montazeri, H., Neophytou, M., & Blocken, B. (2019). CFD simulation of
Li, G., Ren, Z., & Zhan, C. (2020). Sky View Factor-based correlation of landscape
urban microclimate: Validation using high-resolution field measurements. The
morphology and the thermal environment of street canyons: A case study of Harbin,
Science of the Total Environment, 695, Article 133743. https://doi.org/10.1016/j.
China. Building and Environmnet, 169, Article 106587. https://doi.org/10.1016/j.
scitotenv.2019.133743
buildenv.2019.106587
Berger, C., Rosentreter, J., Voltersen, M., Baumgart, C., Schmullius, C., et al. (2017).
Liu, Y., Li, Q., Yang, L., Mu, K., Zhang, M., et al. (2020). Urban heat island effects of
Spatio-temporal analysis of the relationship between 2D/3D urban site
various urban morphologies under regional climate conditions. The Science of the
characteristics and land surface temperature. Remote Sensing of Environment, 193,
Total Environment, 743, Article 140589. https://doi.org/10.1016/j.
225–243. https://doi.org/10.1016/j.rse.2017.02.020
scitotenv.2020.140589
C40 China Buildings Programme (C40 CBP). (2018). Constructing a New Low Carbon
Luo, X., Yang, J., Sun, W., & He, B. (2021). Suitability of human settlements in
Future: How Chinese cities are scaling ambitious building energy efficiency solutions.
mountainous areas from the perspective of ventilation: A case study of the main
Retrieved from https://c40-production-images.s3.amazonaws.com/res-earches/
11J. Yang et al. Sustainable Cities and Society 72 (2021) 103045
urban area of Chongqing. Journal of Cleaner Production, 310, Article 127467. https:// vegetation applications–A review. Sustainable Cities and Society, 43, 55–76. https://
doi.org/10.1016/j.jclepro.2021.127467 doi.org/10.1016/j.scs.2018.08.009
Mahanta, N. R., & Samuel, A. K. (2020). Study of land surface temperature (LST) and Tsoka, S., Tsikaloudaki, A., & Theodosiou, T. (2018b). Analyzing the ENVI-met
land cover for urban heat island (UHI) analysis in Dubai. 2020 8th International microclimate model’s performance and assessing cool materials and urban
Conference on Reliability, Infocom Technologies and Optimization (Trends and Future vegetation applications–A review. Sustainable Cities and Society, 43, 55–76. https://
Directions) (ICRITO), 1285–1288. https://doi.org/10.1109/ doi.org/10.1016/j.scs.2018.08.009
ICRITO48877.2020.9198038 Wang, Y., Zhou, D., Wang, Y., Fang, Y., Yuan, Y., et al. (2018). Comparative study of
McKinsey. (2017). Focused acceleration: A strategic approach to climate action in cities to urban residential design and microclimate characteristics based on ENVI-met
2030. Retrieved from https://www.c40.org/researches/mckinsey-center-for-busin simulation. Indoor and Built Environment, 28, 1200–1216. https://doi.org/10.1177/
ess-and-environment. 1420326X19860884
Meng, F., & Xiao, Q. (2018). Landsat 8 image-based analysis of the urban heat island Wang, B., Cot, L. D., Adolphe, L., Geoffroy, S., & Sun, S. (2017). Cross indicator analysis
characteristics in Jinan, China. IEEE International Geoscience and Remote Sensing between wind energy potential and urban morphology. Renewable Energy, 113,
Symposium, 2976–2979. https://doi.org/10.1109/IGARSS.2018.8517305 989–1006. https://doi.org/10.1016/j.renene.2017.06.057
Nasrollahi, N., Ghosouri, A., Khodakarami, J., & Taleghani, M. (2020). Heat-mitigation Wang, W., Liang, H., Yang, L., Liu, K., Su, H., et al. (2017). Analyzing the urban heat
strategies to improve pedestrian thermal comfort in urban environments: A review. island using time series land surface temperature (LST) data. IEEE International
Sustainability, 12, 10000. https://doi.org/10.3390/su122310000 Geoscience and Remote Sensing Symposium (IGARSS), 5874–5876. https://doi.org/
Obiefuna, J. N., Okolie, C. J., Nwilo, P. C., Daramola, O. E., & Isiofia, L. C. (2021). 10.1109/IGARSS.2017.8128345
Potential influence of urban sprawl and changing land surface temperature on Wei, R., Song, D., Wong, N. H., & Martin, M. (2016). Impact of urban morphology
outdoor thermal comfort in Lagos State, Nigeria. Quaestiones Geographicae, 40. parameters on microclimate. Procedia Engineering, 169, 142–149. https://doi.org/
https://doi.org/10.2478/quageo-2021-0001 10.1016/j.proeng.2016.10.017
Omar, M. G., David, J. S., & Hatem, M. (2020). The impact of urban form on outdoor Yan, G., Su, J., & Guan, D. (2019). Influence of vertical characteristics of urban buildings
thermal comfort in hot arid environments during daylight hours, case study: New on urban thermal environmental effect in the middle mountainous area of Dalian
Aswan. Building and Environment, 184, Article 107222. https://doi.org/10.1016/j. city. Scientia Geographica Sinica, 39, 125–130. http://kns.cnki.net/KCMS/detail
buildenv.2020.107222 /detail.aspx?FileName=DLKX201901014&DbName=DKFX2019.
P López-Cabeza, C. V., Galán-Marín, C., Rivera-Gómez, C., & Roa-Fernández, J. (2018). Yang, J., Sun, J., Ge, Q., & Li, X. (2017). Assessing the impacts of urbanization-associated
Courtyard microclimate ENVI-met outputs deviation from the experimental data. green space on urban land surface temperature: A case study of Dalian, China. Urban
Building and Environmnet, 144, 129–141. https://doi.org/10.1016/j. Forestry & Urban Greening, 22, 1–10. https://doi.org/10.1016/j.ufug.2017.01.002
buildenv.2018.08.013 Yang, J., Su, J., Xia, J., Jin, C., Li, X., et al. (2018). The impact of spatial form of urban
Qiao, Z., Huang, N., Xu, X., Sun, Z., Wu, C., et al. (2019). Temporal and spatial architecture on the urban thermal environment: A case study of the Zhongshan
differentiation characteristics and evolution rules of surface thermal landscape in District, Dalian, China. IEEE Journal of Selected Topics in Applied Earth Observations
Beijing from 2003 to 2017. Journal of Geographical Sciences, 74, 475–489. http://kns. and Remote Sensing, 11, 2709–2716. https://doi.org/10.1109/
cnki.net/KCMS/detail/detail.aspx?FileName=DLXB201903007&DbName=CJFQ20 JSTARS.2018.2808469
19. Yang, L., Niyogi, D., Tewari, M., Aliaga, D., Chen, F., et al. (2016). Contrasting impacts of
Qiao, Z., Sun, Z., Sun, X., Xu, X., & Yang, J. (2019). Urban thermal environment risk urban forms on the future thermal environment: Example of Beijing metropolitan
prediction and spatial and temporal pattern analysis. Acta Ecologica Sinica, 39, area. Environmental Research Letters, 11, 34018. https://doi.org/10.1088/1748-
649–659. http://kns.cnki.net/KCMS/detail/detail.aspx?FileName=STXB2019020 9326/11/3/034018
26&DbName=CJFQ2019. Yang, J., Jin, S., Xiao, X., Jin, C., Xia, J. C., et al. (2019). Local climate zone ventilation
Qin, Z., Zhang, M., Karnieli, A., & Berliner, P. (2001). Mono-window algorithm for and urban land surface temperatures: Towards a performance-based and wind-
retrieving land surface temperature from Landsat TM6 data. Acta Geographica Sinica, sensitive planning proposal in megacities. Sustainable Cities and Society, 47, Article
68, 456–466. http://www.wanfangdata.com.cn/details/detail.do?_type=perio 101487. https://doi.org/10.1016/j.scs.2019.101487
&id=dlxb200104009. Yang, J., Ren, J., Sun, D., Xiao, X., Xia, J. C., et al. (2021). Understanding land surface
Ren, C., Cai, M., Li, X., Shi, Y., & Linda, S. (2020). Developing a rapid method for 3- temperature impact factors based on local climate zones. Sustainable Cities and
dimensional urban morphology extraction using open-source data. Sustainable Cities Society, 69, Article 102818. https://doi.org/10.1016/j.scs.2021.102818
and Society, 53. https://doi.org/10.1016/j.scs.2019.101962 Yang, J., Shi, B., Xia, G., Xue, Q., & Cao, S. (2020). Impacts of urban form on thermal
Ren, C., Yang, R., Cheng, C., Xing, P., Fang, X., et al. (2018). Creating breathing cities by environment near the Surface Region at pedestrian height: A case study based on
adopting urban ventilation assessment and wind corridor plan – The implementation high-density built-up areas of Nanjing City in China. Sustainability (Basel,
in Chinese cities. Journal of Wind Engineering and Industrial Aerodynamisc, 182, Switzerland), 12, 1737. https://doi.org/10.3390/su12051737
170–188. https://doi.org/10.1016/j.jweia.2018.09.023 Yang, J., Wang, Y., Xiu, C., Xiao, X., Xia, J., et al. (2020). Optimizing local climate zones
Salata, F., Golasi, I., Vollaro, A. D. L., & Vollaro, R. D. L. (2015). How high albedo and to mitigate urban heat island effect in human settlements. Journal of Cleaner
traditional buildings’ materials and vegetation affect the quality of urban Production, 275, Article 123767. https://doi.org/10.1016/j.jclepro.2020.123767
microclimate. A case study. Energy and Buildings, 99, 32–49. https://doi.org/ Yang, J., Wang, Y., Xiao, X., Jin, C., Xia, J. C., et al. (2019). Spatial differentiation of
10.1016/j.enbuild.2015.04.010 urban wind and thermal environment in different grid sizes. Urban Climate, 28,
Santamouris, M., & Young Yun, G. (2020). Recent development and research priorities on Article 100458. https://doi.org/10.1016/j.uclim.2019.100458
cool and super cool materials to mitigate urban heat island. Renewable Energy, 161, Yao, Y., Chen, X., & Qian, J. (2018). Research progress of urban surface thermal
792–807. https://doi.org/10.1016/j.renene.2020.07.109 environment. Acta Ecologica Sinica, 38, 1134–1147. http://kns.cnki.net/KCMS
Scarano, M., & Mancini, F. (2017). Assessing the relationship between sky view factor /detail/detail.aspx?FileName=STXB201803038&DbName=CJFQ2018.
and land surface temperature to the spatial resolution. International Journal of Remote Yu, Z., Chen, S., & Wong, N. H. (2020). Temporal variation in the impact of urban
Sensing, 38, 6910–6929. https://doi.org/10.1080/01431161.2017.1368099 morphology on outdoor air temperature in the tropics: A campus case study. Building
Sharmin, T., Steemers, K., & Matzarakis, A. (2017). Microclimatic modelling in assessing and Environment, 181, Article 107132. https://doi.org/10.1016/j.
the impact of urban geometry on urban thermal environment. Sustainable Cities and buildenv.2020.107132
Society, 34, 293–308. https://doi.org/10.1016/j.scs.2017.07.006 Yue, W., Liu, X., Zhou, Y., & Liu, Y. (2019). Impacts of urban configuration on urban heat
Stewart, I. D., & Oke, T. R. (2012). Local climate zones for urban temperature studies. island: An empirical study in China mega-cities. The Science of the Total Environment,
Bulletin of the American Meteorological Society, 93, 1879–1900. https://doi.org/ 671, 1036–1046. https://doi.org/10.1016/j.scitotenv.2019.03.421
10.1175/BAMS-D-11-00019.1 Yue, W., Zhang, L., & Liu, Y. (2016). Measuring sprawl in large Chinese cities along the
Stewart, I. D., Oke, T. R., & Krayenhoff, E. S. (2014). Evaluation of the ‘local climate Yangtze River via combined single and multidimensional metrics. Habitat
zone’ scheme using temperature observations and model simulations. International International, 57, 43–52. https://doi.org/10.1016/j.habitatint.2016.06.009
Journal of Climatology, 34, 1062–1080. https://doi.org/10.1002/joc.3746 Zhai, P., Yuan, Y., Yu, R., & Guo, J. (2019). Climate change and sustainable urban
Su, J., Lv, F., & Yang, J. (2018). The Influence of urban building Level characteristics on development. Chinese Science Bulletin, 64, 1995–2001. http://kns.cnki.net/K
urban thermal environmental effect - A case study of Zhongshan District in Dalian. CMS/detail/detail.aspx?FileName=KXTB201919004&DbName=CJFQ2019.
Bulletin of Surveying and Mapping, 111–114. http://kns.cnki.net/KCMS/detail/detail. Zhang, Y., & Cheng, J. (2019). Spatio-temporal analysis of urban heat island using
aspx?FileName=CHTB201808023&DbName=CJFQ2018. multisource remote sensing data: A case study in Hangzhou, China. IEEE Journal of
Sun, F., Liu, M., Wang, Y., Wang, H., & Che, Y. (2020). The effects of 3D architectural Selected Topics in Applied Earth Observations and Remote Sensing, 12, 3317–3326.
patterns on the urban surface temperature at a neighborhood scale: Relative https://doi.org/10.1109/jstars.2019.2926417
contributions and marginal effects. Journal of Cleaner Production, 258, Article Zhang, A., Li, W., Wu, J., Lin, J., Chu, J., et al. (2020). How can the urban landscape
120706. https://doi.org/10.1016/j.jclepro.2020.120706 affect urban vitality at the street block level? A case study of 15 metropolises in
Tania, S., Koen, S., & Andreas, M. (2017). Microclimatic modelling in assessing the China. Environment and Planning B, Urban Analytics and City Science. https://doi.org/
impact of urban geometry on urban thermal environment. Sustainable Cities and 10.1177/2399808320924425, 239980832092442.
Society, 34, 293–308. https://doi.org/10.1016/j.scs.2017.07.006 Zhao, Z., Shen, L., Li, L., Wang, H., & He, B. (2020). Local climate zone classification
Tian, Y., Zhou, W., Qian, Y., Zheng, Z., & Yan, J. (2019). The effect of urban 2D and 3D scheme can also indicate local-scale urban ventilation performance: An evidence-
morphology on air temperature in residential neighborhoods. Landscape Ecology, 34, based study. Atmosphere, 11, 776. https://doi.org/10.3390/atmos11080776
1161–1178. https://doi.org/10.1007/s10980-019-00834-7 Zhou, W., & Tian, Y. (2020). Research progress in the thermal environmental effects of
Toparlar, Y., Blocken, B., Maiheu, B., & van Heijst, G. J. F. (2017). A review on the CFD three-dimensional urban spatial morphology. Acta Ecologica Sinica, 40, 416–427.
analysis of urban microclimate. Renewable and Sustainable Energy Reviews, 80, http://kns.cnki.net/KCMS/detail/detail.aspx?FileName=STXB202002003&DbNam
1613–1640. https://doi.org/10.1016/j.rser.2017.05.248 e=CJFQ2020.
Tsoka, S., Tsikaloudaki, A., & Theodosiou, T. (2018a). Analyzing the ENVI-met
microclimate model’s performance and assessing cool materials and urban
12You can also read