Brain Surface Area Alterations Correlate With Gait Impairments in Parkinson's Disease - Frontiers
←
→
Page content transcription
If your browser does not render page correctly, please read the page content below

ORIGINAL RESEARCH
                                                                                                                                               published: 27 January 2022
                                                                                                                                          doi: 10.3389/fnagi.2022.806026

                                           Brain Surface Area Alterations
                                           Correlate With Gait Impairments in
                                           Parkinson’s Disease
                                           Xuan Wei 1† , Zheng Wang 1† , Mingkai Zhang 2 , Min Li 3 , Yu-Chen Chen 4 , Han Lv 1 *,
                                           Houzhen Tuo 2 *, Zhenghan Yang 1 , Zhenchang Wang 1 * and Fang Ba 5 *
                                           1
                                            Department of Radiology, Beijing Friendship Hospital, Capital Medical University, Beijing, China, 2 Department of Neurology,
                                           Beijing Friendship Hospital, Capital Medical University, Beijing, China, 3 Clinical Epidemiology and EBM Unit, National Clinical
                                           Research Center for Digestive Diseases, Beijing Friendship Hospital, Capital Medical University, Beijing, China, 4 Department
                                           of Radiology, Nanjing First Hospital, Nanjing Medical University, Nanjing, China, 5 Division of Neurology, Department of
                                           Medicine, University of Alberta, Edmonton, AB, Canada
                            Edited by:
                  Ana María Genaro,
Consejo Nacional de Investigaciones        Parkinson’s disease (PD) is a common neurodegenerative disease with progressive gait,
  Científicas y Técnicas (CONICET),        cognition, and overall functional decline. Surface area changes are frequently seen
                           Argentina
                                           with aging. In neurodegenerative diseases, the changes can be evident with disease
                      Reviewed by:
                      Zhenyu Xiong,        progression. The current study aimed to study the regional microstructural alterations
   University of Texas Southwestern        using surface-based morphometry to correlate with gait measures of the pace and
     Medical Center, United States
                                           rhythm domains in PD patients. We hypothesize that specific regional surface changes
                  Chencheng Zhang,
Shanghai Jiao Tong University, China       can be associated with PD gait impairments. Surface analysis might provide a useful
                    *Correspondence:       tool for assessing PD for functional status and specific motor domains, such as gait in
                                 Han Lv    PD, and potentially could serve as an imaging marker in conjunction with other imaging
                   chrislvhan@126.com
                            Houzhen Tuo
                                           markers. Twenty-seven PD patients and 37 healthy controls were included. The clinical
                         tuohzh@sina.cn    assessment included Mini-Mental State Exanimation, PD motor assessment, clinical gait
                      Zhenchang Wang
                                           testing, and objective/quantitative gait assessment. For patients with PD, all motor and
               cjr.wzhch@vip.163.com
                                Fang Ba    gait testing were performed during both OFF and ON medication states. Three Tesla
                          fb@ualberta.ca   MRI and high-resolution 3D structural images were acquired with an MP-RAGE pulse
    †
        These authors have contributed     sequence. Structural image data preprocessing was performed using the DPABISurf
                   equally to this work    toolbox. Clinical characteristics between PD and control group were compared, and
                 Specialty section:        correlation between the surface area and behavioral data were analyzed. At the left
       This article was submitted to
            Parkinson’s Disease and        lateral temporal cortex (LTC) and right inferior parietal cortex (IPC), PD patients have
 Aging-related Movement Disorders,         significantly larger surface areas when compared to controls (P < 0.05) using surface-
              a section of the journal
    Frontiers in Aging Neuroscience
                                           based morphometry. The surface area changes of the left LTC and right IPC were
                                           associated with the worse performance of gait assessed by Berg Balance Scale and
          Received: 31 October 2021        Timed Up and Go during OFF (P < 0.01). The left LTC area changes significantly
          Accepted: 03 January 2022
          Published: 27 January 2022
                                           correlated with the number of steps, velocity, and the stride length of the pace domain
                                           in the ON state. Our findings suggest that PD is associated with a characteristic regional
                           Citation:
     Wei X, Wang Z, Zhang M, Li M,         pattern of larger surface area in the left LTC and right IPC. These regional changes were
     Chen Y-C, Lv H, Tuo H, Yang Z,        associated with the pace domain of the gait in the ON state. Overall, surface-based
      Wang Z and Ba F (2022) Brain
  Surface Area Alterations Correlate       analyses might provide a useful tool for assessing PD for functional status and specific
With Gait Impairments in Parkinson’s       motor domains, such as gait in PD, and potentially could serve as an imaging marker.
                            Disease.
 Front. Aging Neurosci. 14:806026.         Keywords: surface area, structural magnetic resonance imaging, Parkinsion’s disease (PD), surface-based
    doi: 10.3389/fnagi.2022.806026         morphometry (SBM), gait impairment

Frontiers in Aging Neuroscience | www.frontiersin.org                               1                                         January 2022 | Volume 14 | Article 806026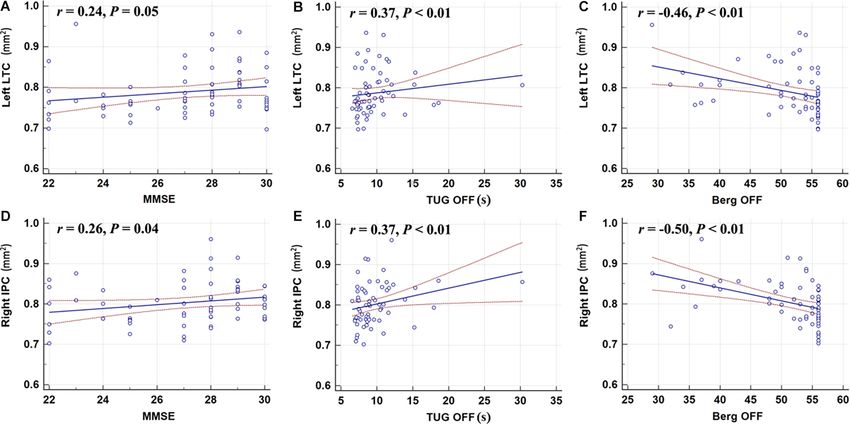
Wei et al.                                                                                                       Surface Area Correlates With Gait

INTRODUCTION                                                              for morphological analysis of the brain (Sartoretti et al.,
                                                                          2020).
Parkinson’s disease (PD) is a common neurodegenerative                        The two commonly used methods to measure brain
disease. The prevalence increases with age. PD pathology affects          morphological changes with structural MRI are voxel-based
multiple neural circuitries. Gait and balance impairments occur           morphometry (VBM) and surface-based morphometry (Winkler
more frequently as the disease progresses, and are usually                et al., 2010). VBM is a volume-level analysis, which can
more disabling than many other motor symptoms. The detailed               reconstruct regions of interest or the entire brain through 3D
pathophysiology of gait impairment in PD, including the                   T1 weighted imaging, and can extract cortical and subcortical
freezing of gait (FOG) is not fully understood. In brief, gait            measurements, thus quantifying the volume of brain tissue
control requires the activation of the entire nervous system and          at the voxel level (Ashburner and Friston, 2000). Volume-
musculoskeletal system, including the spinal locomotor network,           based analysis has been widely used. In PD research, VBM has
mesencephalic locomotor region (MLR), basal ganglia output                been applied in cortical thickness, surface area, and subcortical
to MLR, and motor control in the frontal lobe (Takakusaki,                volume assessment (Gerrits et al., 2016; Wilson et al., 2019;
2013). In addition, the parietofrontal connection and the                 Fang et al., 2020). Previous studies have shown changes in
corticoreticulospinal pathway also contribute to gait control             cortical and subcortical gray matter in PD-FOG individuals,
given its role in anticipatory postural control. Multisensory input       such as thinning of the cortex, or decreased volume. In
provides cognitive and emotional references to the cerebral               more advanced disease, PD patients exhibit progressive cortical
cortex and limbic system, to guide voluntary movements                    thinning and subcortical volume loss which correlated with
or emotional motor behavior depending on the context                      the development of cognitive impairment (Wilson et al., 2019).
(Takakusaki, 2013). In PD, although the motor symptoms are                Kostic et al. studied the degree and distribution of cortical
thought to be a result of the loss of dopaminergic neurons in             atrophy and showed that PD-FOG patients had frontal and
the substantia nigra pars compacta (SNc), PD is more complex              parietal cortical atrophy, and the severity of FOG correlated with
than a dopamine-responsive motor disorder, particularly in its            the degree of the bilateral atrophy in these regions (Kostic et al.,
advanced stages. Widespread neuronal loss is evident in the               2012). VBM has also been applied in PD (Kobayakawa, 2017),
locus coereleus, the nucleus basalis of Meynert, the dorsal motor         in non-dementia PD patients, left anterior cingulate atrophy
nucleus of the vagus nerve, the pedunculopontine nucleus, the             was observed when compared with healthy controls (HCs;
raphe nuclei, the hypothalamus, and the olfactory bulb (Giguere           Summerfield et al., 2005).
et al., 2018). Other non-dopaminergic neurotransmitter systems                Cortical involvement is well documented in PD as the disease
are affected, such as the cholinergic, noradrenergic, serotonergic,       progresses (Braak et al., 2003). Surface-based morphometry
adenosinergic, glutamatergic, GABAergic, etc. (Kalia et al., 2013).       extracts and analyzes various brain features based on the
Cognitive decline (likely secondary to the cholinergic deficiency         characteristics of the cerebral cortex (Yun et al., 2013), including
and brain atrophy) is a common non-motor feature of PD and                curvature (Van Essen, 2005), thickness (Wei et al., 2021),
can be very disabling (Delgado-Alvarado et al., 2016; Aarsland            sulcal depth (Kippenhan et al., 2005) and area (Storsve et al.,
et al., 2017). The relationship between gait and cognitive decline        2014). A previous study in normal aging individuals combining
has been observed in PD patients as their poor cognitive function         volume-based and surface-based methods to measure cortical
contributes to worse gait, making them more prone to falls                thickness and surface area found that the surface-based method
(Camicioli et al., 1998).                                                 yielded higher sensitivity, although overall results showed the
    Gait can be modeled as a combination of five domains:                 same trend (Hutton et al., 2009). Cortical thickness has been
pace, rhythm, variability, asymmetry, and postural control                used as a sensitive measure for gray matter loss in Lewy
(Lord et al., 2013). Abnormal gait and postural control can               body spectrum disorders (Watson et al., 2015), and negative
produce FOG, which frequently leads to falls, and is the main             correlations exist between the cortical thickness of occipital
reason for loss of life independence and increased mortality.             areas and performance on a verbal memory task (Gerrits et al.,
In PD, the risk factors for FOG include longer duration of                2016). In a large study, Sheng et al. reported that compared
disease and no systematic treatment, suggesting that FOG                  with 1,172 healthy controls, no significant cortical thickness
can be related to the degree of dopaminergic neuron loss                  alterations were seen in patients with PD, questioning the validity
(Camicioli et al., 1998). Neuroimaging is a non-invasive tool             of the cortical thickness as an imaging marker for PD (Sheng
to analyze brain structure and function. The recent advances              et al., 2021). In addition, other findings indicated significantly
in imaging techniques allow the assessment of gross and                   increased cortical areas in PD patients with depression in the
microstructural changes of the brain in neurodegenerative                 orbitofrontal regions and insula when compared with those
diseases. Such assessment in relation to clinical parameters              without depression (Huang et al., 2016). The results of the
can potentially serve as biomarkers to monitor disease                    studies on cortical thickness are somewhat inconsistent, but so
progression. Dysfunction in each of the gait domains may                  far there is far less research on the surface area of the brain in
correlate with specific cognitive domains corresponding                   PD patients (Pietracupa et al., 2018; Zhang et al., 2021), and only
to specific cortical areas (Shine et al., 2013). Among the                limited data on quantitative gait assessment examining velocity,
imaging modalities, high-resolution three-dimensional (3D)                cadence, variability, asymmetry, and postural control, especially
structural T1-weighted imaging technology with whole brain                in the context of structural changes in PD (Surkont et al.,
structure information of each brain region is a valid tool                2021). Therefore, studying the quantitative gait parameter in the

Frontiers in Aging Neuroscience | www.frontiersin.org                 2                                 January 2022 | Volume 14 | Article 806026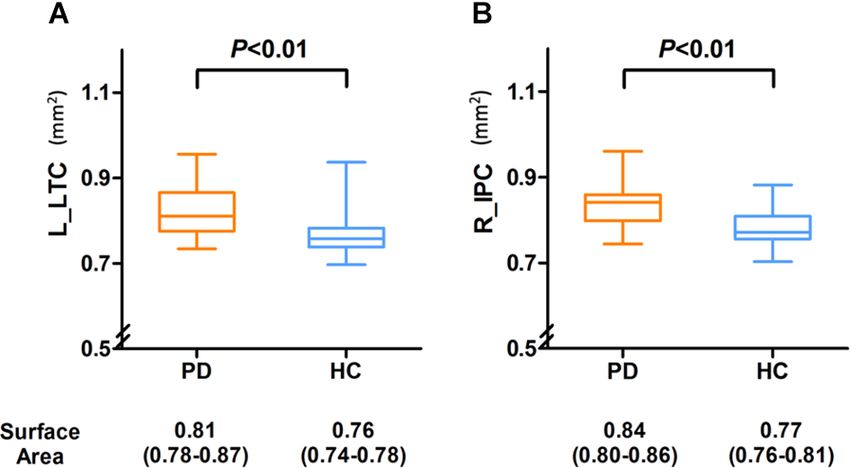
Wei et al.                                                                                                                                     Surface Area Correlates With Gait

context of brain surface area can provide more insight into PD                               Patients Enrollment
gait impairment.                                                                             Patients with PD receiving optimal treatment with dopaminergic
   In the current study, our goal is to evaluate how regional                                medications were recruited from the Movement Disorders
surface area change of the brain correlates with gait performance                            Program at Beijing Friendship Hospital of Capital Medical
in PD patients. We performed clinical assessments, including                                 University. All PD participants were assessed by movement
PD motor examination and gait measures during both ON                                        disorders neurologists who confirmed the diagnosis of idiopathic
and OFF states in PD participants, and aimed to explore the                                  PD based on UK Parkinson’s Disease Society Brain Bank
relationship between dopamine-responsive and non-responsive                                  criteria (Hughes et al., 2002). The exclusion criteria were:
gait impairment and to correlate with MR changes in PD.                                      atypical or secondary Parkinsonism; confounding medical or
Specifically, we aimed to determine the extent to which regional                             psychiatric condition(s); any condition that prevents the ability
microstructural alterations correlate with gait measures focusing                            to give informed consent; and other neurological diseases leading
on the pace and rhythm domains of gait. Systematical studies                                 to motor deficit. Community volunteers without neurological
on the relative changes at the surface-based structural level in                             and/or psychiatric disorders were recruited as HCs. Twenty-
PD, and correlating such changes with clinical parameters can                                seven patients and 37 HCs were enrolled from April 2020 to
provide more insight into the mechanism of gait impairment in                                March 2021. Demographics and clinical status are listed in
PD. The current study addresses an emerging topic since such                                 Table 1. Patients with gait impairment were identified from
assessments in relation to clinical parameters can potentially                               the history and on the International Parkinson and Movement
serve as biomarkers to monitor disease progression, particularly                             Disorder Society Unified Parkinson’s Disease Rating Scale
in gait impairment in PD.                                                                    (MDS-UPDRS) part-II, and III (a score ≥1 on 2.12, 2.13 on
                                                                                             MDS-UPDRS-II or a score ≥1 on items 3.10 or 3.11 on
                                                                                             MDS-UPDRS-III). PD participants were assessed with the
MATERIALS AND METHODS                                                                        following tests to characterize disease status and gait impairment:
                                                                                             full MDS-UPDRS, Berg Balance Scale (BBS), Dynamic Gait
Standard Protocol Approval, Registration,                                                    Index, New Freezing of Gait Questionnaire (nFOGQ), and the
and Patient Consent                                                                          Timed-Up and Go (TUG). These tests have been shown to be
This study was approved by the ethics committees of                                          valid tools in PD assessment.
Beijing Friendship Hospital, Capital Medical University,                                         The clinical assessments were performed in the ‘‘defined
2019-P2-283-02. All participants provided written informed                                   OFF’’ state, which is 12 h after their last PD medications, and
consent prior to participation.                                                              ON state in the same day with a supra-ON dose of levodopa

TABLE 1 | Demographic and clinical characteristics of the control and PD participants.

Measurements                                         Control                                                                           PD
                                                                                                                             PD Clinical parameters
                                                                                                     ON State                                          OFF State

Age                                                  57.0 (51.0–65.0)                                                            68.0 (63.0–70.0)**
Sex (% Male)                                         10 (37.74)                                                                      15 (40.54)
Education (> 9year)                                  25 (67.57)                                                                      20 (74.07)
Duration of disease (months)                         n/a                                                                          48.0 (28.0–84.0)
MMSE                                                 27.0 (25.0–28.0)                                                            28.00 (28.0–29.0)
MASE                                                 11.0 (7.0–17.0)                                                              12.00 (5.0–17.0)
BAI                                                  25.0 (22.0–26.0)                                                            26.0 (24.0–29.0)**
BDI                                                  3.0 (1.0–5.0)                                                                7.0 (4.0–10.0)**
LEDD (mg)                                            n/a                                                                        550.0 (450.0- 725.0)
NFOGQ                                                n/a                                                                             11 (40.74)
MDS-UPDRS-III                                        n/a                                             16.0 (13.0–23.0)                                  29.0 (20.0–36.0)#
MDS-UPDRS Total                                      n/a                                             39.0 (26.0–47.0)                                  47.0 (35.0–61.0)#
TUG                                                  8.17 (7.35–8.82)                                9.95 (8.47–11.89)**                               10.92 (9.02–13.93)**
BBS                                                  56.0 (55.0–56.0)                                52.0 (46.0–54.0)**                                49.0 (39.0–52.0)**
Velocity SSP (cm/s)                                  123.46 (115.32–130.29)                          104.41 (79.30–115.77)**                           99.86 (78.86–109.35)**
Cadence SSP (step/min)                               113.31 (107.64–121.01)                          114.50 (105.51–119.18)                            113.88 (103.32–120.53)
Stride time SSP (s)                                  1.05 (0.99–1.11)                                1.04 (1.01–1.12)                                  1.05 (1.00–1.16)
Stride length SSP (cm)                               129.38 (119.66–139.21)                          107.13 (95.60–124.36)**                           105.50 (83.21–115.82)**
Velocity FP (cm/s)                                   151.26 (144.33–168.62)                          125.59 (104.28–141.53)**                          121.97 (98.18–137.26)**#
Cadence FP (step/min)                                127.21 (118.03–135.34)                          120.73 (115.12–130.74)                            124.66 (112.06–132.04)
Stride time FP (s)                                   0.95 (0.89–0.98)                                0.99 (0.91–1.04)                                  0.96 (0.91–1.07)
Stride length FP (cm)                                143.21 (130.64–156.61)                          122.25 (105.02–138.49)**                          118.68 (93.31–127.12)**#

PD, Parkinson’s disease; MMSE, Mini-Mental State Examination; MAES, Modified Apathy Evaluation Scale; LEDD, levodopa equivalent daily dose (mg); nFOGQ, New Freezing of Gait
Questionnaire; MDS-UPDRS, International Parkinson and Movement Disorder Society-Unified Parkinson’s Disease Rating Scale; MDS-UPDRS-III, MDS-UPDRS motor score; TUG,
Timed up and Go Test; BBS, Berg Balance Scale; SSP, self-selected pace; FP, fast pace.For control, there is no ON or OFF state. Same set of clinical data from the control was used
to analyze against PD group. **P < 0.01, compared with control group. # P < 0.05, compared with ON State.

Frontiers in Aging Neuroscience | www.frontiersin.org                                    3                                         January 2022 | Volume 14 | Article 806026
Wei et al. Surface Area Correlates With Gait
(125% of the morning dose of LED; Tomlinson et al., 2010) a custom variation of the method to reconcile ANTs-derived
after participants reported ON when medications kicked in, and FreeSurfer-derived segmentation of the cortical gray matter
since many PD participants experienced motor fluctuations. If of Mindboggle (Klein et al., 2017). Volume-based spatial
dose failure occurred, patients were allowed to take another normalization to one standard space (MNI152NLin2009cAsym)
dose after 1 h. Patients were examined by a movement was performed through nonlinear registration with ANTs
disorders neurologist during the defined OFF and ON time, and Registration (ANTs 2.2.0) using brain-extracted versions of both
MDS-UPDRS score was documented. For all PD and control the T1w reference and the T1w template. The following template
participants, objective gait assessments were assessed using a 20- was selected for spatial normalization: ICBM 152 Nonlinear
foot-long computerized Zeno Walkway system (Proto Kinetics, Asymmetrical template version 2009c (Fonov et al., 2009). The
Havertown, PA, USA) at a self-selected pace (SSP) and fast surface area was calculated in the above process.
pace (FP). Mini-Mental State Examination (MMSE; Folstein
et al., 1975) was used to test cognition for all participants.
Improvement in gait measure from ‘‘OFF’’ state to ‘‘ON’’ state
Statistical Analysis
Demographic and clinical characteristics were described as
in the relevant domains on MDS-UPDRS and with objective gait
the percentage for categorical variables and median with
testing indicated a dopamine-responsive gait improvement. As
interquartile range for continuous variables. Comparisons
co-morbidity anxiety and depression are widely reported, the
between PD patients and HCs were made by using the chi-square
Beck Depression Inventory (BDI) score, Beck Anxiety Inventory
test for categorical variables and the test for continuous
(BAI) score and Modified Apathy Evaluation Scale (MAES) were
variables. Spearman’s rank correlation was calculated to assess
used to assess the presence of co-morbid mood and anxiety
the relationship between the surface area and patient/disease
disorders (Table 1).
related rating scale (MDS-UPDRS-III scores, MMSE scores, the
MRI Imaging Protocol TUG test scores, and BBS scores). Normality testing revealed that
Data Acquisition not all clinical and objective gait measure data met normality
Images were obtained using a 3.0 T MRI system (Prisma, assumptions.
Siemens, Erlangen, Germany) with a 64-channel phase-array Objective gait parameters of PD patients and HCs were
head coil. Imaging studies were performed at the Medical compared using Wilcoxon rank-sum test. For PD participants,
Imaging Research Center of Beijing friendship hospital. changes in objective gait parameters between ON and OFF state
High-resolution 3D structural T1-weighted images were were analyzed by using paired two-sample Wilcoxon rank-sum
acquired using a 3D magnetization-prepared rapid gradient echo test. The correlation between surface area and gait parameters
(MP-RAGE) sequence with the following parameters: FA = 7◦ , was analyzed using a generalized linear model, adjusted for age
inversion time (TI) = 1,100 ms, slice thickness = 1 mm, repetition and sex, respectively in the PD and HCs groups. Standardized
time (TR) = 2530 ms, echo time (TE) = 2.98 ms, number of regression coefficients (β) and their corresponding P-value were
slices = 192, field of view (FOV) = 256 mm × 224 mm, and calculated. The analyses were done using SAS version 9.3 (SAS
matrix = 256 × 224, bandwidth = 240 Hz/Px, resulting in an Inc., Cary, NC, USA).
isotropic voxel size of 1 mm × 1 mm × 1 mm. For the surface area data, a P-value from the area analysis
less than 0.05 (P < 0.025 for each hemisphere) was considered
Anatomical Data Preprocessing statistically significant (Monte Carlo simulation corrected).
Data preprocessing was performed using DPABISurf1 , which P < 0.05 was set as the threshold to determine significance. The
is a surface-based resting-state fMRI data analysis toolbox surface area results were visualized with DPABISurf.
(Chen and Yan, 2021). HCP template is a built-in template
in it, used to divide the cortex. The results included in this
manuscript come from preprocessing performed by DPABISurf
RESULTS
using fMRIPrep 20.0.5 (Esteban et al., 2019), which is based
on Nipype 1.4.2 (Gorgolewski et al., 2011). The T1-weighted
(T1w) image was corrected for intensity nonuniformity (INU)
Demographics and Behaviors Measures of
with N4BiasFieldCorrection (Tustison et al., 2010), distributed the Study Participants
with ANTs 2.2.0 (Avants et al., 2008), and used as the Demographic and clinical data are shown in Table 1. The control
T1w-reference throughout the workflow. The T1w-reference group is younger than the PD group (P < 0.01). There were no
was then skull-stripped with a Nipype implementation of significant differences in MMSE or MAES scores between the
the antsBrainExtraction.sh workflow (from ANTs), using two groups. The scores of BAI and BDI in the PD group were
OASIS30ANTs as the target template. Brain tissue segmentation significantly higher than those in the control group (Table 1).
of cerebrospinal fluid, white matter (WM) and gray matter was Normality testing revealed that not all clinical and objective
performed on the brain-extracted T1w images using FMRIB’s gait measure data met normality assumptions (Tables 1, 3).
Automated Segmentation Tool (FSL 5.0.9; Zhang et al., 2001). Compared with the HCs, the score of BBS in the PD group was
Brain surfaces were reconstructed using recon-all (Dale et al., significantly lower, while the TUG value was higher (Table 1).
1999), and the previously estimated brain mask was refined with The velocity and stride length of the HCs were higher than those
of PD patients. In the PD group, the ON state improved the
1 http://rfmri.org/DPABISurf velocity and stride length at SSP and FP (Table 1).
Frontiers in Aging Neuroscience | www.frontiersin.org 4 January 2022 | Volume 14 | Article 806026Wei et al. Surface Area Correlates With Gait
FIGURE 1 | It showed differences in surface area in the left LTC and right IPC (P < 0.05; P < 0.025 for each hemisphere) corrected by Monte Carlo simulation; L,
left; R, right; Abbreviations: LTC, lateral temporal cortex; IPC, right inferior parietal cortex.
Analysis of the Surface Areas of the left LTC and right IPC with BDI, BAI, MDS-UPDRS-III,
Between the PD and the control groups, there were significant or N-FOGQ.
differences in surface area of the left lateral temporal
cortex (LTC) and the right inferior parietal cortex (IPC;
P < 0.05 corrected by Monte Carlo simulation; Figure 1,
Table 2).
As shown in Figure 2, the surface area of the left LTC and
right IPC was larger in the PD patients compared with HCs,
and the differences remained after adjusting for age and gender
(P = 0.002 and P = 0.008, respectively).
Correlation Analysis
The surface area of the right IPC was weakly correlated with
the MMSE score (r = 0.26, P = 0.04); however, the left LTC
showed no correlation with the MMSE (Figure 3). The surface FIGURE 2 | Compared with the PD group, the surface area was significantly
area of the left LTC and right IPC were positively correlated decreased in the left LTC (A) and right IPC (B) of HC group and compared
with TUG-off scores, and negatively correlated with and BBS-off with the HC group, and the PD group demonstrated a slightly larger area in
score (all P < 0.01; Figure 3), suggesting a larger surface area of the left LTC and right IPC, and there were also significant differences between
the two groups. Abbreviations: L, left; R, right; LTC, lateral temporal cortex;
these two regions correlated with worse gait performance during
IPC, inferior parietal cortex.
OFF state. There were no correlations between the surface area
TABLE 2 | Difference in cortical area of the left and right hemisphere between PD patients and the controls.
Brain regions HCP Cluster size (mm) Coordinates MNI Peak F score
x y z
Left lateral temporal cortex 136 66 −49 −42 −21 4.59
Right inferior parietal cortex 155 140 31 −37 −11 4.59
Statistically significant differences in the cortical area were defined as P < 0.05 (P < 0.025 for each hemisphere), Monte Carlo Simulation corrected after correcting for age, sex,
education, and the head motion. Abbreviations: MNI, Montreal Neurological Institute; HCP, Human Connectome Project.
Frontiers in Aging Neuroscience | www.frontiersin.org 5 January 2022 | Volume 14 | Article 806026Wei et al. Surface Area Correlates With Gait
FIGURE 3 | Correlation analyses showed that the left LTC (A–C) and the right IPC (D–F) were positively correlated with the TUG-off test score; the surface area of
the right IPC was weakly correlated with the MMSE score; the left LTC and right IPC were negatively correlated with and BBS-off score (all P < 0.01). MMSE,
Mini-Mental State Examination; TUG, Timed-Up and Go; BBS, Berg Balance Scale.
Using Standardized regression coefficients, the surface-based TABLE 3 | Analysis of the surface area changes in left LTC and right IPC
measures from the left LTC showed the strongest correlation correlate with the gait changes in Parkinson’s disease using the regression model.
with the objective gait parameters (Table 3). While in the ON Gait measures Left LTC Right IPC
state, larger left LTC surface area values were positively correlated β/P value β/P value
with velocity SSP (Table 3, P = 0.04) and stride length SSP ON
(Table 3, P = 0.03). Larger left LTC surface area values were Velocity SSP (cm/s) 0.50/0.04 −0.06/0.82
positively correlated with velocity FP (Table 3, P = 0.01) and Cadence SSP (step/min) 0.11/0.58 −0.17/0.36
Stride time SSP (s) −0.13/0.53 0.162/0.40
stride length FP (Table 3, P = 0.002). The surface area in the right Stride length SSP (cm) 0.52/0.03 0.02/0.92
IPC did not show any significant correlation with quantitative OFF
gait parameters (Table 3). Velocity SSP (cm/s) 0.03/0.90Wei et al. Surface Area Correlates With Gait
itself, and are unlikely to change in response to dopaminergic complete and reliable multi-module biomarker profile for PD
treatment, which is what we observed with TUG and BBS, diagnosis and prognosis.
both did not improve from OFF state to ON state. The left
LTC area changes with gait impairments were found in our
study. This is consistent with previous evidence showing gait DATA AVAILABILITY STATEMENT
impairment was related to temporal lobe atrophy (Annweiler
et al., 2014). Most importantly, we found that the structural The original contributions presented in the study are included in
changes in the left LTC correlated with gait measures of the the article, further inquiries can be directed to the corresponding
pace domain in the ON state only (gait velocity and stride author/s.
length), suggesting such correlation is dopamine-independent
(Surkont et al., 2021). ETHICS STATEMENT
Although we have observed the surface areas expansion in
the left LTC and right IPC, and both regions are critical in The studies involving human participants were reviewed and
cognition and higher-level information processing, we did not approved by the Ethics Committees of our Research Institution
reveal a strong correlation with MMSE in the PD group. The (Beijing Friendship Hospital, Capital Medical University, 2019-
fact that most PD patients’ MMSE scores were within the normal P2-283-02). The patients/participants provided their written
range might have explained the lack of correlation between the informed consent to participate in this study. Written informed
cognitive test and imaging measures. In addition, we did not consent was obtained from the individual(s) for the publication
perform more detailed neuropsychological testing since it is not of any potentially identifiable images or data included in this
the main objective of the study. article.
The scores of BAI and BDI in the PD group were
significantly higher than those in the HCs group. Anxiety
and depressive disorders are common in PD, which are AUTHOR CONTRIBUTIONS
associated with structural and functional changes of multiple
brain regions (Schrag and Taddei, 2017; Carey et al., 2021). XW: research project—execution; statistical analysis—design
In PD with mild to moderate depression, cortical thickness of and execution; and manuscript—writing of the first draft.
the precuneus cortex was also significantly increased (Zanigni ZW and MZ: research project—execution; statistical
et al., 2017). However, in our cohort, we did not observe any analysis—execution; and manuscript—review and critique.
significant correlations. ML and Y-CC: statistical analysis—design, execution, review
The strengths of the study include detailed clinical assessment, and critique. HL and HT: research project—organization
and detailed gait assessment using computerized objective gait and execution; manuscript—review and critique. ZY:
measures during both ON and OFF states. We also focused research project—organization and execution. ZW:
on specific gait domains. There are some limitations to this research project—conception and organization. FB:
study. It is a single-centered study with a relatively small research project—conception and organization; statistical
sample size. Secondly, we did not apply volume-based analysis analysis—design, review and critique; manuscript—review and
to further explore the structural characteristics of PD in critique. All authors contributed to the article and approved the
conjunction with the surface analysis for a more complete submitted version.
picture. However, our findings are still valid and can provide
new insight into the field. In future studies, we will combine
other structural and functional surface-based indicators, such as
FUNDING
ReHo, degree centrality, fALFF, to gain a more comprehensive This work was supported by Grant No. 81871322 to FB, No.
and complete understanding of the PD pathology, and 82071258 to HT, and No. 82103902 to ML from the National
aim to establish a more reliable imaging portfolio for PD Natural Science Foundation of China, No. [2015] 160 from
gait impairment. Beijing Scholars Program to ZW, No. 2020M680607 from
China Postdoctoral Science Foundation to XW, No. 2021-
CONCLUSION zz-008 from Beijing Postdoctoral Research Foundation to
XW, No. yyqdkt2019-31 from Research Foundation of Beijing
Our findings suggest that PD is associated with a regional surface Friendship Hospital, Capital Medical University to XW, and No.
area change—a larger surface area alteration in the LTC and ZYLX202101 from Beijing Hospitals Authority Clinical Medicine
IPC. These changes in surface area may suggest a combined gray Development of Special Funding Support to ZY.
matter and white matter dysfunction. Moreover, the regional
microstructural integrity changes in the left LTC were associated
with the pace domain of the gait. Overall, surface area analyses ACKNOWLEDGMENTS
might provide a useful tool for assessing PD motor function,
such as gait impairments. In conjunction with other biochemical We especially thank Beijing Friendship Hospital, Capital Medical
markers and clinical biomarkers, such imaging tools potentially University, for the support with our research. We also thank all
could serve as an imaging marker, and contribute to a more the study participants for their time and support.
Frontiers in Aging Neuroscience | www.frontiersin.org 7 January 2022 | Volume 14 | Article 806026Wei et al. Surface Area Correlates With Gait
REFERENCES Hutton, C., Draganski, B., Ashburner, J., and Weiskopf, N. (2009). A comparison
between voxel-based cortical thickness and voxel-based morphometry in
Aarsland, D., Creese, B., Politis, M., Chaudhuri, K. R., Ffytche, D. H., normal aging. Neuroimage 48, 371–380. doi: 10.1016/j.neuroimage.2009.
Weintraub, D., et al. (2017). Cognitive decline in Parkinson disease. Nat. Rev. 06.043
Neurol. 13, 217–231. doi: 10.1038/nrneurol.2017.27 Jubault, T., Gagnon, J. F., Karama, S., Ptito, A., Lafontaine, A. L., Evans, A. C.,
Annweiler, C., Montero-Odasso, M., Bartha, R., Drozd, J., Hachinski, V., and et al. (2011). Patterns of cortical thickness and surface area in early Parkinson’s
Beauchet, O. (2014). Association between gait variability and brain ventricle disease. Neuroimage 55, 462–467. doi: 10.1016/j.neuroimage.2010.12.043
attributes: a brain mapping study. Exp. Gerontol. 57, 256–263. doi: 10.1016/j. Kalia, L. V., Brotchie, J. M., and Fox, S. H. (2013). Novel nondopaminergic targets
exger.2014.06.015 for motor features of Parkinson’s disease: review of recent trials. Mov. Disord.
Ashburner, J., and Friston, K. J. (2000). Voxel-based morphometry—the methods. 28, 131–144. doi: 10.1002/mds.25273
Neuroimage 11, 805–821. doi: 10.1006/nimg.2000.0582 Kippenhan, J. S., Olsen, R. K., Mervis, C. B., Morris, C. A., Kohn, P., Meyer-
Avants, B. B., Epstein, C. L., Grossman, M., and Gee, J. C. (2008). Symmetric Lindenberg, A., et al. (2005). Genetic contributions to human gyrification:
diffeomorphic image registration with cross-correlation: evaluating automated sulcal morphometry in Williams syndrome. J. Neurosci. 25, 7840–7846.
labeling of elderly and neurodegenerative brain. Med. Image Anal. 12, 26–41. doi: 10.1523/JNEUROSCI.1722-05.2005
doi: 10.1016/j.media.2007.06.004 Klein, A., Ghosh, S. S., Bao, F. S., Giard, J., Hame, Y., Stavsky, E., et al.
Braak, H., Del Tredici, K., Rub, U., de Vos, R. A., Jansen Steur, E. N., and Braak, E. (2017). Mindboggling morphometry of human brains. PLoS Comput. Biol.
(2003). Staging of brain pathology related to sporadic Parkinson’s disease. 13:e1005350. doi: 10.1371/journal.pcbi.1005350
Neurobiol. Aging 24, 197–211. doi: 10.1016/s0197-4580(02)00065-9 Kobayakawa, M. (2017). [Voxel-based morphometry and social cognitive function
Camicioli, R., Oken, B. S., Sexton, G., Kaye, J. A., and Nutt, J. G. (1998). Verbal in Parkinson’s disease]. Brain Nerve 69, 1323–1329. doi: 10.11477/mf.
fluency task affects gait in Parkinson’s disease with motor freezing. J. Geriatr. 1416200911
Psychiatry Neurol. 11, 181–185. doi: 10.1177/089198879901100403 Kostic, V. S., Agosta, F., Pievani, M., Stefanova, E., Jecmenica-Lukic, M.,
Carey, G., Gormezoglu, M., de Jong, J. J. A., Hofman, P. A. M., Backes, W. H., Scarale, A., et al. (2012). Pattern of brain tissue loss associated with freezing
Dujardin, K., et al. (2021). Neuroimaging of anxiety in Parkinson’s disease: a of gait in Parkinson disease. Neurology 78, 409–416. doi: 10.1212/WNL.
systematic review. Mov. Disord. 36, 327–339. doi: 10.1002/mds.28404 0b013e318245d23c
Chen, X., and Yan, C. G. (2021). Hypostability in the default mode network Lee, S. H., Kim, S. S., Tae, W. S., Lee, S. Y., Choi, J. W., Koh, S. B., et al. (2011).
and hyperstability in the frontoparietal control network of dynamic functional Regional volume analysis of the Parkinson disease brain in early disease stage:
architecture during rumination. Neuroimage 241:118427. doi: 10.1016/j. gray matter, white matter, striatum and thalamus. Am. J. Neuroradiol. 32,
neuroimage.2021.118427 682–687. doi: 10.3174/ajnr.A2372
Dale, A. M., Fischl, B., and Sereno, M. I. (1999). Cortical surface-based Lord, S., Galna, B., and Rochester, L. (2013). Moving forward on gait
analysis. I. Segmentation and surface reconstruction. Neuroimage 9, 179–194. measurement: toward a more refined approach. Mov. Disord. 28, 1534–1543.
doi: 10.1006/nimg.1998.0395 doi: 10.1002/mds.25545
Delgado-Alvarado, M., Gago, B., Navalpotro-Gomez, I., Jimenez-Urbieta, H., Mota, B., and Herculano-Houzel, S. (2015). BRAIN STRUCTURE. Cortical
and Rodriguez-Oroz, M. C. (2016). Biomarkers for dementia and mild folding scales universally with surface area and thickness, not number of
cognitive impairment in Parkinson’s disease. Mov. Disord. 31, 861–881. neurons. Science 349, 74–77. doi: 10.1126/science.aaa9101
doi: 10.1002/mds.26662 Pietracupa, S., Suppa, A., Upadhyay, N., Gianni, C., Grillea, G., Leodori, G.,
Esteban, O., Markiewicz, C. J., Blair, R. W., Moodie, C. A., Isik, A. I., et al. (2018). Freezing of gait in Parkinson’s disease: gray and white
Erramuzpe, A., et al. (2019). fMRIPrep: a robust preprocessing pipeline matter abnormalities. J. Neurol. 265, 52–62. doi: 10.1007/s00415-017
for functional MRI. Nat. Methods 16, 111–116. doi: 10.1038/s41592-018 -8654-1
-0235-4 Sartoretti, T., Sartoretti, E., van Smoorenburg, L., Schwenk, A., Mannil, M.,
Fang, E., Ann, C. N., Marechal, B., Lim, J. X., Tan, S. Y. Z., Li, H., et al. (2020). Graf, N., et al. (2020). Spiral 3-dimensional T1-weighted turbo field
Differentiating Parkinson’s disease motor subtypes using automated volume- echo: increased speed for magnetization-prepared gradient echo brain
based morphometry incorporating white matter and deep gray nuclear lesion magnetic resonance imaging. Invest. Radiol. 55, 775–784. doi: 10.1097/RLI.
load. J. Magn. Reson. Imaging 51, 748–756. doi: 10.1002/jmri.26887 0000000000000705
Folstein, M. F., Folstein, S. E., and McHugh, P. R. (1975). "Mini-mental state". A Schrag, A., and Taddei, R. N. (2017). Depression and anxiety in Parkinson’s
practical method for grading the cognitive state of patients for the clinician. disease. Int. Rev. Neurobiol. 133, 623–655. doi: 10.1016/bs.irn.2017.
J. Psychiatr. Res. 12, 189–198. doi: 10.1016/0022-3956(75)90026-6 05.024
Fonov, V. S., Evans, A. C., McKinstry, R. C., Almli, C. R., and Collins, D. L. Sheng, L., Zhao, P., Ma, H., Radua, J., Yi, Z., Shi, Y., et al. (2021). Cortical thickness
(2009). Unbiased nonlinear average age-appropriate brain templates from birth in Parkinson’s disease: a coordinate-based meta-analysis. Aging (Albany NY)
to adulthood. NeuroImage 47:S102. doi: 10.1016/S1053-8119(09)70884-5 13, 4007–4023. doi: 10.18632/aging.202368
Gerrits, N. J., van Loenhoud, A. C., van den Berg, S. F., Berendse, H. W., Shine, J. M., Matar, E., Ward, P. B., Bolitho, S. J., Gilat, M., Pearson, M. et al. (2013).
Foncke, E. M., Klein, M., et al. (2016). Cortical thickness, surface area Exploring the cortical and subcortical functional magnetic resonance imaging
and subcortical volume differentially contribute to cognitive heterogeneity changes associated with freezing in Parkinson’s disease. Brain 136, 1204–1215.
in Parkinson’s disease. PLoS One 11:e0148852. doi: 10.1371/journal.pone. doi: 10.1093/brain/awt049
0148852 Storsve, A. B., Fjell, A. M., Tamnes, C. K., Westlye, L. T., Overbye, K.,
Giguere, N., Burke Nanni, S., and Trudeau, L. E. (2018). On cell loss and selective Aasland, H. W., et al. (2014). Differential longitudinal changes in cortical
vulnerability of neuronal populations in Parkinson’s disease. Front. Neurol. thickness, surface area and volume across the adult life span: regions
9:455. doi: 10.3389/fneur.2018.00455 of accelerating and decelerating change. J. Neurosci. 34, 8488–8498.
Gorgolewski, K., Burns, C. D., Madison, C., Clark, D., Halchenko, Y. O., doi: 10.1523/JNEUROSCI.0391-14.2014
Waskom, M. L., et al. (2011). Nipype: a flexible, lightweight and extensible Summerfield, C., Junque, C., Tolosa, E., Salgado-Pineda, P., Gomez-Anson, B.,
neuroimaging data processing framework in python. Front. Neuroinform. 5:13. Marti, M. J., et al. (2005). Structural brain changes in Parkinson disease
doi: 10.3389/fninf.2011.00013 with dementia: a voxel-based morphometry study. Arch. Neurol. 62, 281–285.
Huang, P., Lou, Y., Xuan, M., Gu, Q., Guan, X., Xu, X., et al. (2016). Cortical doi: 10.1001/archneur.62.2.281
abnormalities in Parkinson’s disease patients and relationship to depression: Surkont, J., Joza, S., Camicioli, R., Martin, W. R. W., Wieler, M., and Ba, F. (2021).
a surface-based morphometry study. Psychiatry Res. Neuroimaging 250, 24–28. Subcortical microstructural diffusion changes correlate with gait impairment
doi: 10.1016/j.pscychresns.2016.03.002 in Parkinson’s disease. Parkinsonism Relat. Disord. 87, 111–118. doi: 10.1016/j.
Hughes, A. J., Daniel, S. E., Ben-Shlomo, Y., and Lees, A. J. (2002). The accuracy of parkreldis.2021.05.005
diagnosis of parkinsonian syndromes in a specialist movement disorder service. Takakusaki, K. (2013). Neurophysiology of gait: from the spinal cord to the frontal
Brain 125, 861–870. doi: 10.1093/brain/awf080 lobe. Mov. Disord. 28, 1483–1491. doi: 10.1002/mds.25669
Frontiers in Aging Neuroscience | www.frontiersin.org 8 January 2022 | Volume 14 | Article 806026Wei et al. Surface Area Correlates With Gait Tomlinson, C. L., Stowe, R., Patel, S., Rick, C., Gray, R., and Clarke, C. E. (2010). Zanigni, S., Sambati, L., Evangelisti, S., Testa, C., Calandra-Buonaura, G., Systematic review of levodopa dose equivalency reporting in Parkinson’s Manners, D. N., et al. (2017). Precuneal thickness and depression in Parkinson disease. Mov. Disord. 25, 2649–2653. doi: 10.1002/mds.23429 disease. Neurodegener. Dis. 17, 97–102. doi: 10.1159/000450614 Tustison, N. J., Avants, B. B., Cook, P. A., Zheng, Y., Egan, A., Yushkevich, P. A., Zhang, Y., Brady, M., and Smith, S. (2001). Segmentation of brain MR et al. (2010). N4ITK: improved N3 bias correction. IEEE Trans. Med. Imaging images through a hidden Markov random field model and the expectation- 29, 1310–1320. doi: 10.1109/TMI.2010.2046908 maximization algorithm. IEEE Trans. Med. Imaging 20, 45–57. doi: 10.1109/42. Van Essen, D. C. (1997). A tension-based theory of morphogenesis and 906424 compact wiring in the central nervous system. Nature 385, 313–318. Zhang, J., Gao, Y., He, X., Feng, S., Hu, J., Zhang, Q., et al. (2021). doi: 10.1038/385313a0 Identifying Parkinson’s disease with mild cognitive impairment by using Van Essen, D. C. (2005). A population-average, landmark- and surface-based combined MR imaging and electroencephalogram. Eur. Radiol. 31, 7386–7394. (PALS) atlas of human cerebral cortex. Neuroimage 28, 635–662. doi: 10.1016/j. doi: 10.1007/s00330-020-07575-1 neuroimage.2005.06.058 Watson, R., Colloby, S. J., Blamire, A. M., and O’Brien, J. T. (2015). Assessment of Conflict of Interest: The authors declare that the research was conducted in the regional gray matter loss in dementia with Lewy bodies: a surface-based MRI absence of any commercial or financial relationships that could be construed as a analysis. Am. J. Geriatr. Psychiatry 23, 38–46. doi: 10.1016/j.jagp.2014.07.005 potential conflict of interest. Wei, X., Lv, H., Chen, Q., Wang, Z., Liu, C., Zhao, P., et al. (2021). Cortical thickness alterations in patients with tinnitus before and after sound Publisher’s Note: All claims expressed in this article are solely those of the authors therapy: a surface-based morphometry study. Front. Neurosci. 15:633364. and do not necessarily represent those of their affiliated organizations, or those of doi: 10.3389/fnins.2021.633364 the publisher, the editors and the reviewers. Any product that may be evaluated in Wilson, H., Niccolini, F., Pellicano, C., and Politis, M. (2019). Cortical thinning this article, or claim that may be made by its manufacturer, is not guaranteed or across Parkinson’s disease stages and clinical correlates. J. Neurol. Sci. 398, endorsed by the publisher. 31–38. doi: 10.1016/j.jns.2019.01.020 Winkler, A. M., Kochunov, P., Blangero, J., Almasy, L., Zilles, K., Fox, P. T., Copyright © 2022 Wei, Wang, Zhang, Li, Chen, Lv, Tuo, Yang, Wang and Ba. et al. (2010). Cortical thickness or grey matter volume? The importance This is an open-access article distributed under the terms of the Creative Commons of selecting the phenotype for imaging genetics studies. Neuroimage 53, Attribution License (CC BY). The use, distribution or reproduction in other forums 1135–1146. doi: 10.1016/j.neuroimage.2009.12.028 is permitted, provided the original author(s) and the copyright owner(s) are credited Yun, H. J., Im, K., Jin-Ju, Y., Yoon, U., and Lee, J. M. (2013). Automated sulcal and that the original publication in this journal is cited, in accordance with accepted depth measurement on cortical surface reflecting geometrical properties of academic practice. No use, distribution or reproduction is permitted which does not sulci. PLoS One 8:e55977. doi: 10.1371/journal.pone.0055977 comply with these terms. Frontiers in Aging Neuroscience | www.frontiersin.org 9 January 2022 | Volume 14 | Article 806026
You can also read