Synergistic effect of graphene oxide and zoledronic acid for osteoporosis and cancer treatment - Nature
←
→
Page content transcription
If your browser does not render page correctly, please read the page content below
www.nature.com/scientificreports

            OPEN           Synergistic effect of graphene
                           oxide and zoledronic acid for
                           osteoporosis and cancer treatment
                           Gökçen Boran1, Sepideh Tavakoli1,2, Ingo Dierking3, Ali Reza Kamali4 & Duygu Ege1 ✉
                           Zoledronic acid (ZOL) is a third generation bisphosphonate which can be used as a drug for the
                           treatment of osteoporosis and metastasis. In this study, graphene oxide (GO) is conjugated with ZOL,
                           and the nanostructured material is evaluated in terms viability, proliferation and differentiation.
                           Furthermore, the associated morphological changes of bone marrow-derived mesenchymal stem
                           cells (BM-MSC), and Michigan Cancer Foundation-7 (MCF-7) breast cancer cells, as well as the effect
                           of the drugs on mineralization of BM-MSCs are investigated using a variety of characterization
                           techniques including Fourier Transform Infrared Spectroscopy (FTIR), scanning electron microscopy
                           (SEM) as well as alamar blue, acridine orange, and alizarin red assays. Nanostructured ZOL-GO with an
                           optimum performance is synthesized using ZOL and GO suspensions with the concentration of 50 µM
                           and 2.91 ng/ml, respectively. ZOL-GO nanostructures can facilitate the mineralization of BM-MSC
                           cells, demonstrated by the formation of clusters around the cells. The results obtained confirm the
                           performance of ZOL-GO nanostructures as promising drug complexes for the treatment of osteoporosis
                           and metastasis.

                           Secondary bone cancer (metastasis) occurs when cancer spreads to the bones from different organs includ-
                           ing lung, kidney, thyroid1–3, and particularly from the prostate and breast, as observed in 70% of cases2.
                           Bisphosphonates have commonly been used for decades as a treatment for metastasis4,5. Zoledronic acid (ZOL)
                           is a more recently developed bisphosphonate which is found to be more potent in the treatment of metastasis6–11.
                           Despite this, the utilization of small ZOL molecules in this application is difficult, since the free drug can easily
                           be filtrated before arriving at the tumor site12,13. As a result, higher doses of the drug must be administered which
                           increases the chance for the occurrence of side effects, including acute systemic inflammatory reactions, oste-
                           onecrosis of the jaw, renal failure, nephrotic syndrome, electrolyte imbalance and ocular inflammation14–16. To
                           increase the efficiency of the drug and reducing the chance of side effects, ZOL can be loaded on different drug
                           carriers such as poly(lactide-co-glycolide)17, folate targeted liposomes18, β-tricalcium phosphate19, hydroxyapa-
                           tite20 and gelatin21.
                               Carbon allotropes show potential as alternatives to conventional drug carriers due to their high surface area
                           and biocompatibility as well as the capability of being chemically modified22. In particular, graphene oxide (GO),
                           carbon nanotubes (CNT), nanodiamond and carbon black are known to be capable of delivering drugs into can-
                           cer cells, improving the efficiency of the drug23. Among these carbons, GO has obvious advantages such as low
                           cost, the presence of two external chemically active surfaces, easy fabrication and modification, and the absence of
                           toxic metal particles during its production24. Studies also indicated that the loading capacity of GO is higher than
                           CNT and carbon black25,26. Moreover, the degree of cytotoxicity of CNT and carbon black are found to be higher
                           than GO27. Therefore, in this study, GO was chosen as the preferred carrier for ZOL.
                               GO is the oxidized form of graphene, functionalized with groups such as hydroxyls, epoxides, diols, ketones,
                           and carboxyls28. GO has been used as a drug carrier for anti-cancer drugs such as doxorubicin29, camptothecin30,
                           paclitaxel31, pirfenidone32 and adriamycin30,33. Since both GO and ZOL contain aromatic rings in their chemical
                           structure, ZOL could conjugate with GO by non-covalent π − π interactions. Additionally, hydrogen bonding
                           and hydrophobic interactions can also occur based on the ZOL and GO structures. Conjugation of ZOL on GO

                           1
                            Boğaziçi University, Institute of Biomedical Engineering, İstanbul, Turkey, 34368. 2Northeastern University, College
                           of Engineering, Boston, Massachusetts USA 02115, Boğaziçi University, Institute of Biomedical Engineering,
                           İstanbul, Turkey, 34368. 3University of Manchester, Department of Physics and Astronomy, Manchester, M13 9PL,
                           United Kingdom. 4Energy and Environmental Materials Research Centre (E2MC), School of Metallurgy, Northeastern
                           University, Shenyang, China, 110819. ✉e-mail: duygu.ege@boun.edu.tr

Scientific Reports |   (2020) 10:7827 | https://doi.org/10.1038/s41598-020-64760-4                                                            1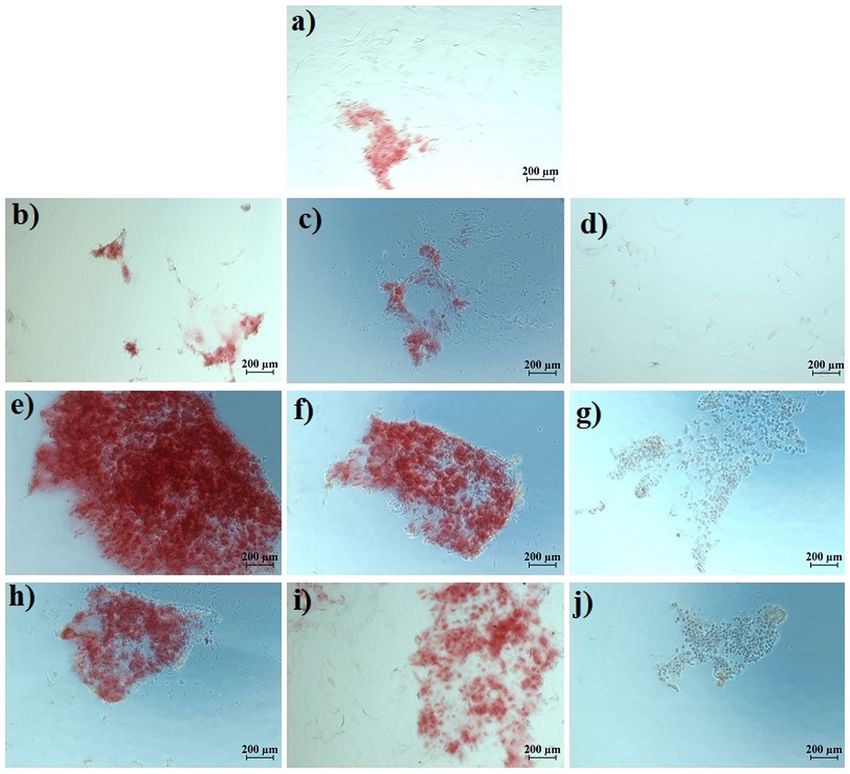
www.nature.com/scientificreports/                                                              www.nature.com/scientificreports

                           Figure 1. FTIR spectra of (a) GO, and (b) 200 µM −11.7 ng/ml ZOL-GO.

                           may increase the size of the complex reducing the fast renal filtration, and consequently, increasing the circulation
                           time throughout the body12. Furthermore, the slow release of ZOL from GO may prevent harmful side effects
                           which mostly result from the presence of high doses of the drug in the body34.
                               In this study, ZOL and GO were conjugated to increase the effect of ZOL on MCF-7 breast cancer cells and to
                           elevate the mineralization of BM-MSCs. To this end, conjugated ZOL-GO complexes were prepared with differ-
                           ent concentrations, and characterized by Alamar blue viability assay, Acridine orange staining, SEM morphologi-
                           cal analysis and alizarin red staining. The results suggested that the conjugation of ZOL and GO did not affect the
                           viability of MCF-7 breast cancer cells and BM-MSCs compared to pure ZOL. Despite this, the prepared complex
                           significantly increased the degree of mineralization of BM-MSCs.

                           Results
                           Photonic characterization of the ZOL-GO complex.                The FTIR spectra of GO and 200µM-11.7 ng/ml
                           of ZOL-GO complex produced in this study are shown in Fig. 1.
                               In the FTIR spectrum of GO, the band at 3596, 3228, 1629 and 1284 cm−1 characterize the stretching vibration
                           mode of O-H35,36. The band at 1731 cm−1 could be related to the C=O stretching vibration from the carboxyl
                           group35–38. The O-H deformation vibration band was found at 1430 cm−138,39.The band at 1095 cm−1 possibly
                           arose due to C-O functional group36. Moreover, the band at 960 cm−1 can be ascribed to the epoxy groups in the
                           GO structure37,38.
                               In the ZOL-GO spectrum, likewise to the case of GO, the bands at 3577 and 3145 cm−1 were related to the
                           stretching vibration mode of O-H groups35,36,40. Additionally, bands at 1543 and 1646 cm−1 are attributed to
                           the vibration of CH=CH groups in the imidazole rings; and the band at 944 cm−1 to the stretching vibration
                           of C-C bonds40,41. The band at 1444 cm−1 can be attributed to stretching vibrations of C-H bonds in the imida-
                           zole ring40–42. The bands found at 1153 and 1295 cm−1 possibly arise due to P-O and P=O stretching vibrations,
                           respectively41.
                               In the spectrum of ZOL-GO, in addition to the bands found for ZOL, there were two bands related to GO. The
                           band at 1731 cm−1 was possibly due to the C=O stretching vibration from carboxyl groups of GO35–38. The band
                           found at 1059 cm−1 possibly emerges due to the C-OH functional group of GO. The presence of these bands were
                           proving conjugation of ZOLand GO.

                           The cell viability and morphology of MCF-7 breast cancer cells.                      Figure 2 shows the viability of
                           MCF-7 cells after GO, ZOL and GO-ZOL treatments.
                               According to Fig. 2, MCF-7 cells had a significant viability decrease after the treatment with all ZOL and
                           ZOL-GO complexes on day 3. Incorporation of pure GO also significantly effected the percentage viability of
                           MCF-7 cells. The percentage viability of MCF-7 cells decreased to 76% after addition of 11.7 ng/ml GO on day
                           7. After the treatment with 50 µM and 200 µM ZOL the percentage viability of MCF-7 cells dropped by 35%.
                           Conjugation of GO and ZOL did not alter the %-viability of MCF-7 cells compared to ZOL.
                               Figure 3 clearly depicts the viability of MCF-7 cells after the different treatments.
                               According to Fig. 3, the viability of MCF-7 cells was 83% and 87% for TCP and 2.91 ng/ml of GO sample,
                           respectively. With the addition of ZOL, a viability of 34% was observed. Moreover, the cell viability was signif-
                           icantly lower after the ZOL-GO treatment which was only 9%. For the alamar blue assay, this drop was not as
                           significant; however, the AO assay showed a more defined drop after the ZOL-GO treatment in comparison to the
                           ZOL treatment. Table 1 shows percentage of live cells for different study groups.
                               Figure 4 shows SEM images of MCF-7 cells after treatment using ZOL and GO for 3 days.
                               The MCF-7 cells had similar morphology and cell population features after the GO treatment and on TCP. The
                           ZOL treatment led to a decrease in the number of cells.

Scientific Reports |   (2020) 10:7827 | https://doi.org/10.1038/s41598-020-64760-4                                                            2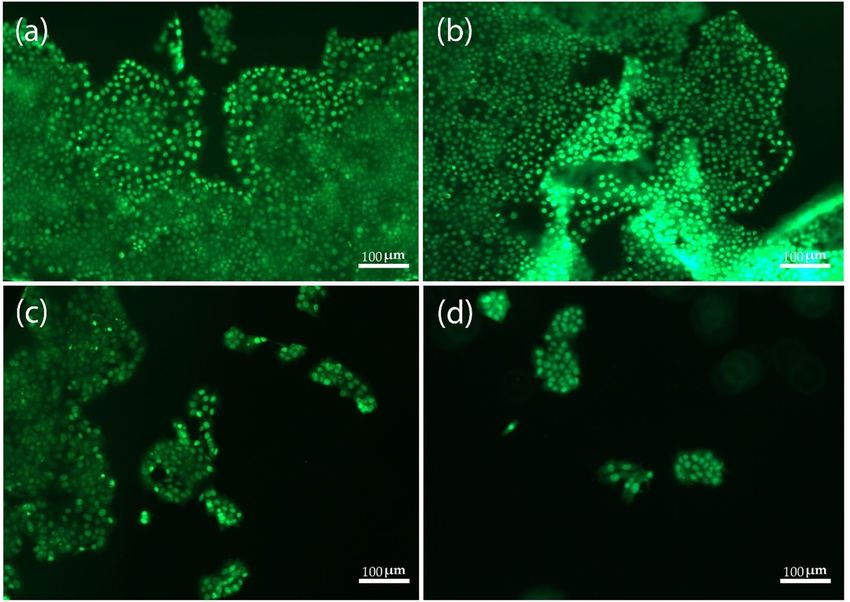
www.nature.com/scientificreports/                                                            www.nature.com/scientificreports

                           Figure 2. Percentage viability of MCF-7 cells after treatment with (a) different GO concentrations, and (b-
                           d) selected concentrations of GO, ZOL and ZOL-GO. Metabolic activity was normalized to day 1 of TCP.
                           The significant differences between TCP and other study groups is indicated by •(P < 0.01 vs. control) and о
                           (P < 0.05).

                           Figure 3. MCF-7 cells staining by AO. (a) TCP, and the samples treated with (b) 2.91 ng/ml of GO, (c) 50 µM
                           ZOL and (d) 50 µM ZOL −2.91 ng/ml GO, after 3 days.

Scientific Reports |   (2020) 10:7827 | https://doi.org/10.1038/s41598-020-64760-4                                                        3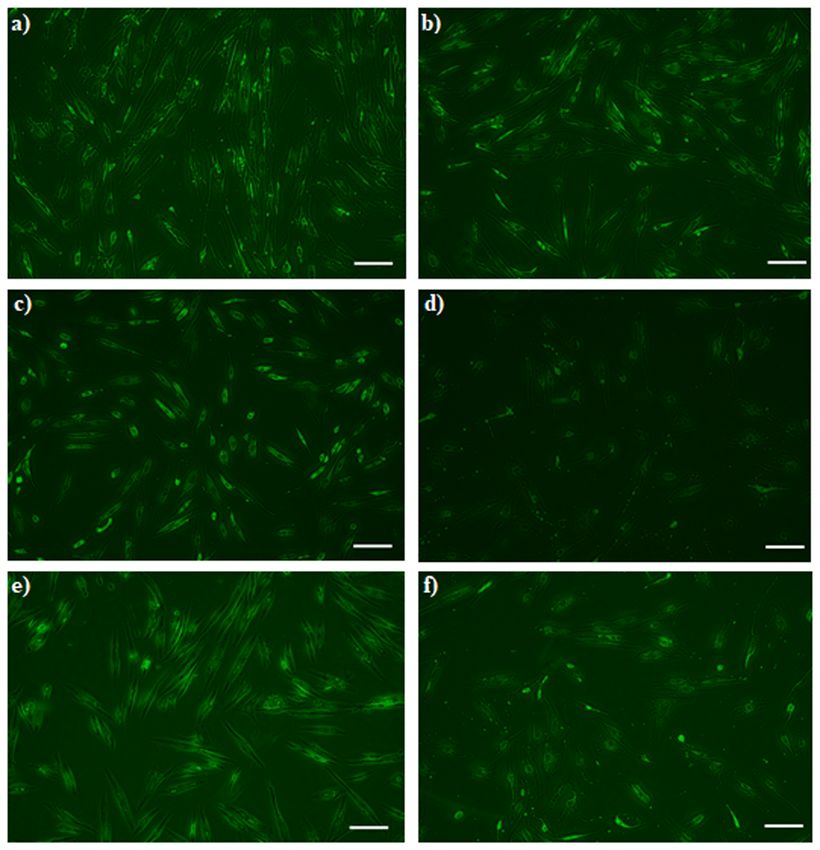
www.nature.com/scientificreports/                                                           www.nature.com/scientificreports

                            GO-ZOL        GO concentration (ng/   ZOL concentration
                            Samples       ml)                     (µM)
                            1             11.7                    200
                            2             2.91                    50
                            3             0.73                    12.5

                           Table 1. Composition of different ZOL-GO samples prepared.

                           Figure 4. SEM images of MCF-7 cells after treatment using (a) TCP (b) 0.73 ng/ml GO (c) 12.5 µM ZOL (d)
                           12.5µM-0.73 ng/ml ZOL-GO (scale bar: 20 µm).

                           Figure 5. Percentage viability of MSC cells after treatment with different concentrations of (a) ZOL (b) GO
                           and (c) ZOL-GO complexes (Metabolic activity was normalized to day 1 of TCP.) The significant differences
                           between TCP and other study groups is indicated by •(P < 0.01 vs. control) and о (P < 0.05).

Scientific Reports |   (2020) 10:7827 | https://doi.org/10.1038/s41598-020-64760-4                                                       4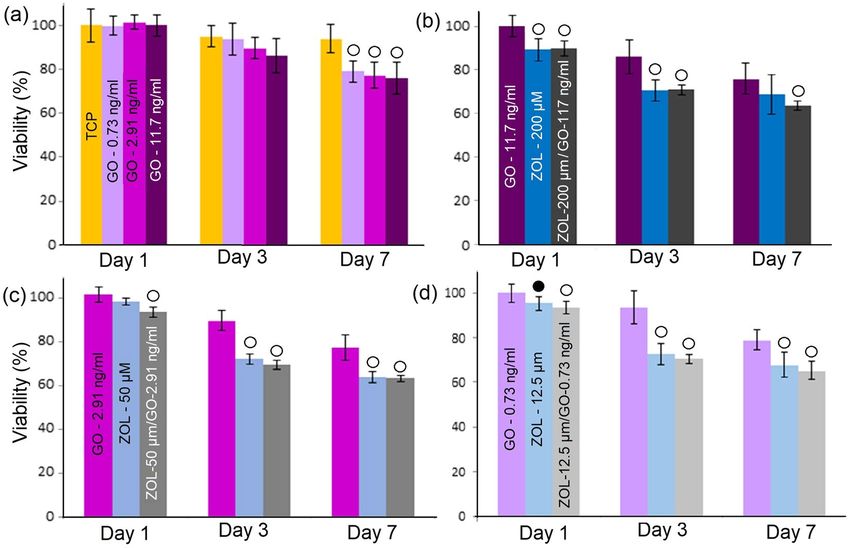
www.nature.com/scientificreports/                                                             www.nature.com/scientificreports

                           Figure 6. BM-MSCs staining by AO (a) 0.73 ng/ml GO (b) 11.7 ng/ml GO (c) 12.5 µM ZOL (d) 200 µM ZOL
                           (e) 12.5 µM ZOL-GO (f) 200 µM ZOL-GO after 3 days (scale bar: 200 µm).

                           The cell viability of BM-MSCs.             Figure 5 shows the viability of BM-MSCs after interaction with GO, ZOL
                           and ZOL-GO complexes.
                               For BM-MSCs, pure GO did not significantly affect the viability of BM-MSCs with any of the concentrations
                           used. ZOL did not cause a significant drop in the percentage cell viability on day 1. On day 3, there was only a
                           considerable decrease for the concentration of 200 µM. On day 7, considerable decreases were found for both
                           50 and 200 µM ZOL. However, even on these days, the drop was only 8% larger than TCP. On the other hand,
                           for ZOL-GO samples, on day 7, the most significant reduction of cells was observed for the 50 µM − 2.91 ng/ml
                           ZOL-GO sample. This decrease was nevertheless still only 14% larger than TCP. The percentage of cell viability
                           was over 83% for all study groups.
                               Figure 6 shows the viability of BM-MSCs after different treatments. Compared to TCP, with the addition of
                           0.73 ng/ml GO, the amount of BM-MSCs has increased, whilst the addition of 11.7 ng/ml GO, caused a slight
                           decrease in the number of cells. With the addition of 12.5 µM ZOL, no significant decrease of the cell content
                           was observed. However, an increase of the ZOL concentration to 200 µM significantly decreased the cell concen-
                           tration, which was equivalent to the results obtained by the alamar blue assay (Fig. 5). For the cells treated with
                           12.5µM-0.73 ng/ml ZOL-GO, there was no decrease in the cell concentration compared to TCP. This was also
                           paralleled by the results obtained by the alamar blue assay.
                               Additionally, in this case, the cells appeared to become more elongated, in comparison with the case observed
                           in pure 0.73 ng/ml GO or 12.5 µM ZOL. For the cells treated with 200µM-11.7 ng/ml ZOL-GO, their MSC con-
                           centration was decreased. Despite this decrease, the cell concentration was much higher in comparison to the
                           case of 200 µM ZOL. Also, compared to 11.7 ng/ml GO, the cells concentration was not significantly decreased,
                           confirming that GO had a positive impact on the viability of BM-MSCs when complexed with ZOL.

Scientific Reports |   (2020) 10:7827 | https://doi.org/10.1038/s41598-020-64760-4                                                          5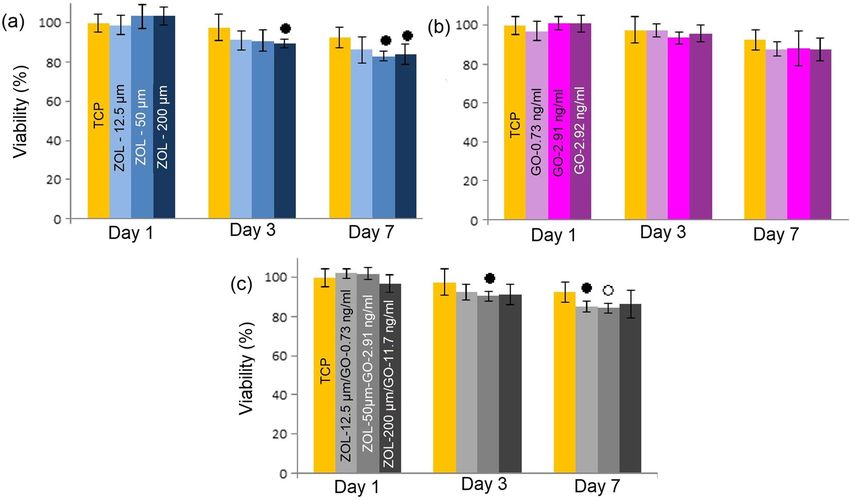
www.nature.com/scientificreports/ www.nature.com/scientificreports
Figure 7. SEM images of BM-MSCs after treatment using (a) TCP, (b) 0.73 ng/ml GO, (c) 12.5 µM ZOL (d)
12.5 µM ZOL -0.73 ng/ml GO (scale bar: 20 µm).
The cell morphology and mineralization of BM-MSCs. Figure 7 shows images of an SEM study of
BM-MSCs after treatment using ZOL, GO and ZOL-GO for 3 days.
According to the images, BM-MSCs had a similar morphology after treatment with GO, ZOL-GO and TCP.
Figure 8 shows the alizarin red results obtained on day 14.
In general, on day 14, there was not much mineralization on the TCP and the GO treated samples. On the
other hand, 12.5 µM ZOL led to a significant amount of mineralization. The degree of mineralization disappeared
with the increase of ZOL concentration to 200 µM. ZOL-GO with the lowest concentration also caused mineral-
ization; however, samples treated with 200 µM -11.7 ng/ml ZOL-GO showed no sign of mineralization. Figure 9
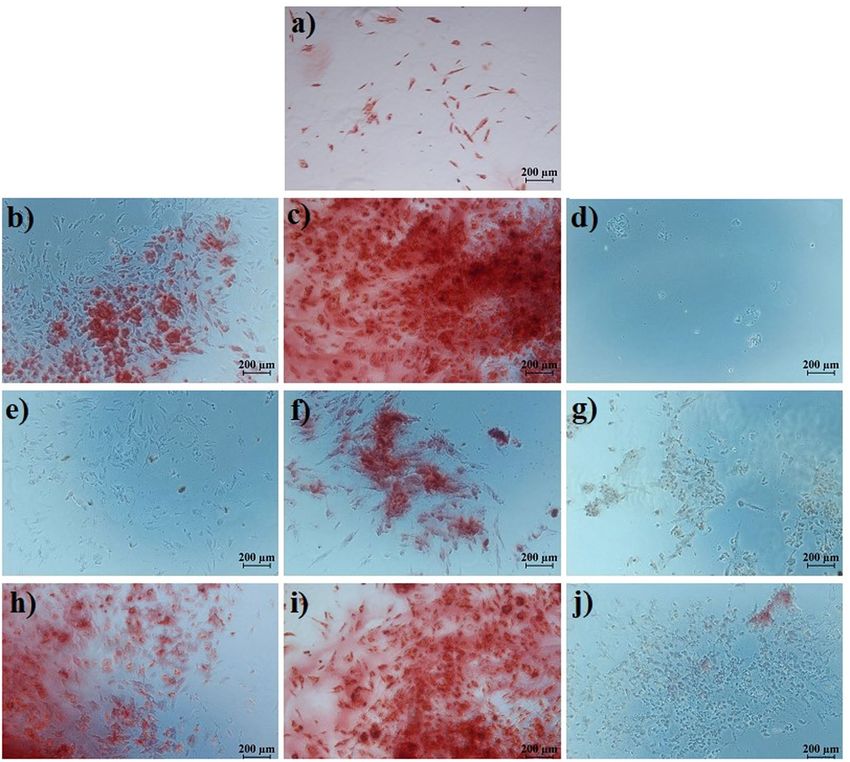
shows the alizarin red results on day 21.
On day 21, GO treated samples with a concentration of 0.73 and 2.91 mg/ml exhibited mineralization; how-
ever, no mineralization was observed for 11.7 ng/ml GO. For ZOL samples, there was a significant degree of min-
eralization for 50 µM ZOL, but no mineralization was observed for lower or higher concentrations. For ZOL-GO,
there was a much more significant degree of mineralization than for pure ZOL for concentrations of 12.5 µM
and 50 µM ZOL-GO. However, 200 µM ZOL-GO treated sample showed a minimal degree of mineralization.
According to the alizarin red results, 50 µM ZOL significantly increased the mineralization of the cells.
Discussion
In this study ZOL-GO complexes were produced for potential drug delivery purposes. FTIR results indicated that
the drug complexes were produced successfully. These observations were supporting our results from a prelimi-
nary study where we have proven conjugation of ZOL and GO by using UV-vis spectroscopy43.
Alamar blue result was in accordance to the results obtained by other groups which indicated that ZOL inhib-
its MCF-7 cell proliferation and invasion at a dose level of 50 µM44. In the literature, the inhibition of breast
cancer cells by ZOL was related to inhibition of farnesyl pyrophosphate (FPP) synthase in the mevalonate biosyn-
thetic pathway13,45–47. Firstly, the inhibition of FPP synthase prevent prenylation of GTP-binding proteins such
as Rho, Rac Ras and Rab due to depletion of farnesylpyrophosphate (FPP) and geranylgeranylphyrophosphate
(GGPP)45,48–50. The prenylation of GTP-binding proteins are essential for cell survival and their impairment leads
to cell apoptosis51. Secondly, FPP synthase inhibition leads to accumulation of isopentenyl pyrophosphate (IPP)
and apoptotic ATP analogue (Apppl)52. Apppl inhibit adenine nucleotide translocase in the mitochondria and IPP
activates Vγ9Vδ2-T cells which eliminate cancer cells45. The synergistic effect of ZOL and GO on the mevalonate
pathway remains unknown and requires further research.
% cell viability observed via acridine orange assay shows that ZOL-GO provides a synergistic effect, reducing
the % viability of MCF-7 significantly more than if solely ZOL was used. This is possibly due to improvement of
the drug efficiency in the presence of GO carrier. GO leads to the effective internalization of the drug to the cells
by endocytosis and/or cell penetration through lipid bilayer53. Utilization of the ZOL-GO complex led to a mor-
phological change in MCF-7 cells, which requires further investigations.
Alamar blue study on BM-MSCs showed that ZOL-GO complexes did not have a significantly adverse effect
on BM-MSC. These results align with a number of other studies which also suggests that ZOL does not have a
negative effect on BM-MSC viability54–57. Overall, ZOL and ZOL-GO complexes did not drastically decrease the
viability of BM-MSCs, but more significantly that of MCF-7 cells, which is advantageous for bone metastasis
treatment.
Scientific Reports | (2020) 10:7827 | https://doi.org/10.1038/s41598-020-64760-4 6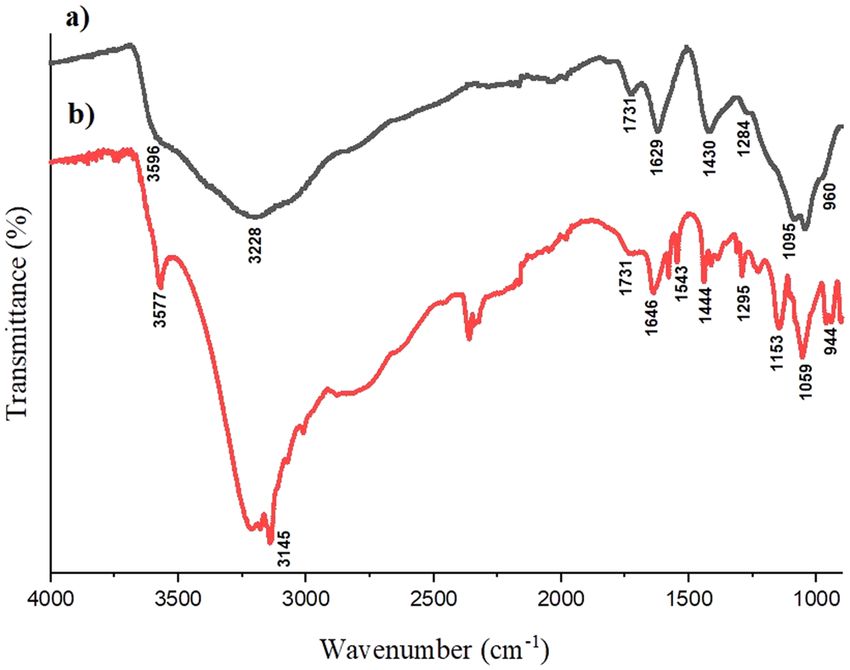
www.nature.com/scientificreports/                                                               www.nature.com/scientificreports

                           Figure 8. Alizarin red results of (a) TCP, (b) 0.73 ng/ml GO, (c) 2.91 ng/ml GO, (d) 11.7 ng/ml GO, (e) 12.5 µM
                           ZOL, (f) 50 µM ZOL, (g) 200 µM ZOL, (h) 12.5 µM ZOL -0.73 ng/ml GO (i), 50 µM ZOL - 2.91 ng/ml GO, and
                           (j) 200 µM ZOL -11.7 ng/ml GO, on the day 14.

                                Moreover, acridine orange assay results indicated that ZOL-GO complex led to elongation of BM-MSCs. In the
                           literature, the elongation of MSCs has been related to the differentiation of MSCs to osteoblasts58–60. In our study,
                           the combination of GO and ZOL could possibly trigger the differentiation of cells to osteoblasts. Literature also
                           suggests that both GO and ZOL are effective at differentiating MSCs to osteoblasts at certain concentrations61–63.
                           At high concentrations, ZOL was found toxic to cells which led to decrease of % viability of BM-MSCs64,65.
                                Additionally, SEM results revealed that the samples treated with ZOL-GO shows the presence of clusters
                           which might be due to the indicated mineralization of BM-MSCs. The morphology of ZOL treated samples exhib-
                           its a change, compared to the other samples, which could be due to mineralization of the cells under the influence
                           of the ZOL treatment, which is in agreement with reports in the literature57,66. Ebert et al.57, Carbonare et al.62
                           and Hu et al.67 also indicated that at the µM level, bisphosphonates trigger the osteogenic differentiation of MSCs,
                           leading to their mineralization. Additionally, GO also leads to mineralization of MSCs, therefore in this study we
                           have observed a synergistic effect of ZOL-GO complexes on mineralization of MSCs61–63.
                                According to the studies of Igarashi et al.68 and Pan et al.69, the addition of 25 µM ZOL increased the min-
                           eralization of cells. However, lower concentrations did not lead to a considerable degree of mineralization.
                           Accordingly, Basso et al.70 also found inhibition of mineralization with application of only 5 µM of ZOL on osteo-
                           blast cells. Vaisman et al.71 and Patntirapong et al.11 indicated that higher doses of ZOL than 100 µM inhibited the
                           mineralization of bone66. This is also in agreement with the results of the current study. Gao et al.72 indicated that
                           ZOL induces osteogenic differentiation and mineralization via inhibition of mammalian target of the rapamycin
                           complex 1 (mTORC1) activity. This leads to an upregulation of the bone morphogenetic protein-2 (BMP-2) and
                           osteocalcin (OCN) gene expressions69,72. At higher doses, differentiation and mineralization were prevented via
                           promotion of the mTORC1 activity72.
                               As indicated earlier, GO induces mineralization of cells28,73–75. Therefore, in our case, the ZOL-GO complex
                           exhibited a synergistic effect, improving the mineralization of cells to high degrees, greater than those obtained
                           solely by GO or ZOL. The results obtained are interesting and provide an opportunity to enhance the efficiency
                           of the ZOL drug by using carbon-based carriers. Future research should concern in vivo studies to evaluate the

Scientific Reports |   (2020) 10:7827 | https://doi.org/10.1038/s41598-020-64760-4                                                             7
www.nature.com/scientificreports/ www.nature.com/scientificreports
Figure 9. Alizarin red results (a) TCP, (b) 0.73 ng/ml GO, (c) 2.91 ng/ml GO, (d) 11.7 ng/ml GO, (e) 12.5 µM
ZOL, (f) 50 µM ZOL, (g) 200 µM ZOL, (h) 12.5 µM ZOL- 0.73 ng/ml GO, (i) 50 µM ZOL -2.91 ng/ml GO, (j)
200 µM ZOL -11.7 ng/ml GO, on the day 21.
performance of ZOL-GO complex structures in more details. Animal models may be used after conducting an
appropriate harm-benefit analysis, considering animal rights and ethical issues beforehand. Moreover, anti-cancer
effects should be studied correlating interactions with gene expressions, such as Bax and Bcl-2.
Conclusion
In this study, different concentrations of GO were loaded on ZOL, and the effects of ZOL, GO and ZOL-GO
complexes on the characteristics of the BM-MSCs and MCF-7 cell lines were studied. ZOL did not significantly
reduce the viability of BM-MSCs, and GO had no effect on the viability of BM-MSCs. On the other hand, both
ZOL and ZOL-GO complexes significantly decreased the viability of MCF-7 cells. Staining of cells led to results
that were equivalent to the alamar blue study. Alizarin red results showed that ZOL with a concentration of 50 µM
induces a high degree of mineralization. This was significantly increased with the addition of GO to 50 µM ZOL.
Overall, the results revealed that ZOL-GO complexes could decrease the viability of MCF-7 breast cancer cells,
whilst they did not drastically affect the viability of BM-MSCs. Additionally, 50 µM-2.91 ng/ml ZOL-GO caused a
significant degree of BM-MSCs mineralization. Such ZOL-GO complexes show a promising performance for the
drug treatment of osteoporosis and metastasis.
Experimental
Preparation of ZOL, GO and complexes. To prepare ZOL samples, 5 ml of ultra-pure water was added
to 10 mg of zoledronic acid monohydrate (Sigma-Aldrich, >98%, HPLC) to obtain the stock solution with a con-
centration of 2 mg/ml. Then, three different samples with concentrations of 12.5, 50 and 200 µM were obtained
by diluting the stock solution with DMEM (Dulbecco’s Modified Eagle Medium), and magnetically stirring
(Isolab-340) over night. To prepare various concentrations of GO, 4.5 ml of ultra-pure water was added to 0.5 ml
of GO (Sigma- Aldrich, 2 mg/ml, mean sheet diameter: 22 µm) to form the stock solution which was stirred by a
vortex at room temperature for 30 min. The stock solution was then diluted with DMEM and stirred for 30 min-
utes by a sonicator to obtain solutions with GO amounts of 11.7, 2.91 and 0.73 ng/ml.
Scientific Reports | (2020) 10:7827 | https://doi.org/10.1038/s41598-020-64760-4 8www.nature.com/scientificreports/ www.nature.com/scientificreports
Sample groups % of live cells
TCP 83
GO 87
ZOL 34
ZOL-GO 9
Table 2. Percentage of live MCF-7 cells for different study groups.
Finally, ZOL-GO complexes with different compositions were prepared by mixing of the GO and ZOL suspen-
sions, as shown in Table 2. To dilute GO and ZOL suspensions in order to achieve the required concentrations,
the stock solutions were diluted with DMEM, stirred by the sonicator for 15 min, and then magnetically stirred
overnight.
Characterization methods. FTIR spectroscopy was performed by using Nicolet FTIR Instruments,
Thermofischer to analyze the chemical structure of ZOL conjugation with GO at the wavenumber regime from
4000 to 400 cm −1 with a 2 cm−1 resolution76.
To study the performance of ZOL-GO drug complexes, cell culture studies were carried out using the human
breast cancer cell line (MCF-7, ATCC HTB-22) and human bone marrow-derived MSCs (BM-MSCs, ATCC
PCS-500-012).
For the alamar Blue assay, the cell line of MCF-7 cells were plated in a 96 well-plate (Sigma) with a density
of 5 × 10³ cell/cm2,77 and BM-MSC with a density of 2 × 10³ cell/cm2 in complete growth medium with DMEM
(Sigma), 10% Fetal Bovine Serum (FBS) (Sigma) and 1% penicillin/streptomycin (Sigma) at 37 °C with 5% CO267.
For BM-MSC, additionally, 4 mM L-Glutamine (Sigma) was added into the growth medium. 24 hours after seed-
ing of the cells, they were treated with samples including ZOL, GO and ZOL-GO complexes in total growth
medium. The drug treatment in this assay was applied on day 1, 3, and 7. For the alamar blue assay, 10% of alamar
blue solution (Sigma) was mixed with DMEM and 100 µl of the prepared solution was added in each well on day
1, 3, and 778. A microplate reader (BIO-RAD Mark, Microplate Reader) was used to study viability of the cells79.
Statistical analyses were conducted by one-way analysis of variance (ANOVA) with post-hoc Tukey test.
Both BM-MSC and MCF-7 cells were seeded in a 48 well-plate at a density of 7.5 × 10³ cells per well and were
incubated with the complete medium overnight. Then, cells were treated with the samples for 3 days. The wells
were washed with the media twice and Acridine orange (AO) was added to the wells to stain the live cells. Images
were taken after a few seconds by inverted phase contrast microscopy. Open-source software ImageJ was used to
calculate the percentage of live MCF-7 cells for AO staining.
A FEI-Philips XL30 Environmental Scanning Electron Microscope (SEM) with Field Emission Gun, equipped
with an Energy Dispersive X-ray (EDX) analyzer, was used operating at 5 kV in the secondary electron imaging
mode for the study of morphological changes of BM-MSC and MCF-7 cells after the drug treatment on day 3. For
the investigations, 2.5% glutaraldehyde was added on the cells for the fixation purpose in a dark room. For dehy-
dration, the samples were immersed in 30%, 50%, 80%, and 95% ethanol for 2 minutes each. Then, the ethanol
was removed and a few droplets of hexamethyldisilazan (HMDS) were added. The samples were left to become
dry overnight80.
For alizarin red staining, BM-MSC with a density of 10 × 103 cell/cm2 was seeded in a 24 well-plate and treated
with the growth medium. After 24 hours, the cells were treated with osteogenic differentiation medium, compris-
ing of the complete growth medium, 50 µg/ml of L-Ascorbic acid-2-phosphate, 5 mM of β-Glycerophosphate and
10 nM of Dexamethasone; all purchased from Sigma, to achieve final concentrations as shown in Table 1. The
osteogenic differentiation medium was changed every 2 or 3 days. Alizarin red salt was used for the staining of
free calcium ions and certain calcium compounds as an indicator of the mineralization. First, cells were fixed with
4% paraformaldehyde and 3xDPBS for 30 minutes at 4 °C and then washed with Dulbecco’s phosphate-buffered
saline (DPBS) twice81. Thereafter, 2% alizarin Red S was added and the suspension was kept for 45 minutes in the
dark at room temperature. The solution was removed and cells were washed with DPBS. Then, cells were observed
by fluorescence microscopy (Axio Vert A.1-Zeiss) on days 14 and 21.
Received: 26 February 2020; Accepted: 21 April 2020;
Published: xx xx xxxx
References
1. Schmid-Alliana, A. et al. Understanding the progression of bone metastases to identify novel therapeutic targets. Int. J. Mol. Sci. 19,
148–168 (2018).
2. Macedo, F. et al. Bone metastases: An overview. Oncol. Rev. 11, 43–49 (2017).
3. Svensson, E., Christiansen, C. F., Ulrichsen, S. P., Rørth, M. R. & Sørensen, H. T. Survival after bone metastasis by primary cancer
type: A Danish population-based cohort study. BMJ Open 7, 1–7 (2017).
4. Fournier, P. G., Stresing, V., Ebetino, F. H. & Clézardin, P. How do bisphosphonates inhibit bone metastasis in vivo? Neoplasia 12,
571–8 (2010).
5. Junankar, S. & Rogers, M. J. In Bone Cancer 615–627 (Elsevier, 2015).
6. Nadar, R. A. et al. Bisphosphonate-Functionalized Imaging Agents, Anti-Tumor Agents and Nanocarriers for Treatment of Bone
Cancer. Adv. Healthc. Mater. 6, 1601119–1601137 (2017).
7. Polascik, T. J. Bisphosphonates in oncology: Evidence for the prevention of skeletal events in patients with bone metastases. Drug
Des. Devel. Ther. 3, 27–40 (2009).
Scientific Reports | (2020) 10:7827 | https://doi.org/10.1038/s41598-020-64760-4 9www.nature.com/scientificreports/ www.nature.com/scientificreports
8. Torger, B. et al. Cast adhesive polyelectrolyte complex particle films of unmodified or maltose-modified poly (ethyleneimine) and
cellulose sulphate: Fabrication, film stability and retarded release of zoledronate. Biointerphases 8, 1–11 (2013).
9. Jagdev, S. P., Coleman, R. E., Shipman, C. M., Rostami-H, A. & Croucher, P. I. The bisphosphonate, zoledronic acid, induces
apoptosis of breast cancer cells: Evidence for synergy with paclitaxel. Br. J. Cancer 84, 1126–1134 (2001).
10. Kellinsalmi, M. et al. In vitro Comparison of Clodronate, Pamidronate and Zoledronic Acid Effects on Rat Osteoclasts and Human
Stem Cell-Derived Osteoblasts. J. Pharmacol. Toxicol. 97, 382–391 (2005).
11. Patntirapong, S., Singhatanadgit, W. & Chanruangvanit, C. Zoledronic acid suppresses mineralization through direct cytotoxicity
and osteoblast differentiation inhibition. J. Oral Pathol. Med. 41, 713–720 (2012).
12. Lin, J. H. Bisphosphonates: A review of their pharmacokinetic properties. Bone 18, 75–85 (1996).
13. Göbel, A. et al. Combined inhibition of the mevalonate pathway with statins and zoledronic acid potentiates their anti-tumor effects
in human breast cancer cells. Cancer Lett. 375, 162–171 (2016).
14. Tanvetyanon, T. & Stiff, P. J. Management of the adverse effects associated with intravenous bisphosphonates. An. Oncol. 17, 897–907
(2006).
15. Shane, E., Khosla, S. & Burr, D. in Osteoporosis 1873–1883 (Academic Press, 2013).
16. Khajuria, D. K., Vasireddi, R., Trebbin, M., Karasik, D. & Razdan, R. Novel therapeutic intervention for osteoporosis prepared with
strontium hydroxyapatite and zoledronic acid: In vitro and pharmacodynamic evaluation. Mater. Sci. Eng. C 71, 698–708 (2017).
17. Gou, W. et al. Controlled delivery of zoledronate improved bone formation locally In Vivo. PLoS One 9, 1–9 (2014).
18. Shmeeda, H. et al. Delivery of zoledronic acid encapsulated in folate-targeted liposome results in potent in vitro cytotoxic activity on
tumor cells. J. Control. Release 146, 76–83 (2010).
19. Kadow-Romacker, A., Greiner, S., Schmidmaier, G. & Wildemann, B. Effect of β-tricalcium phosphate coated with zoledronic acid
on human osteoblasts and human osteoclasts in vitro. J. Biomater. Appl. 27, 577–585 (2013).
20. Raina, D. B. et al. A Biphasic Calcium Sulphate/Hydroxyapatite Carrier Containing Bone Morphogenic Protein-2 and Zoledronic
Acid Generates Bone. Sci. Rep. 6, 1–13 (2016).
21. Raina, D. B. et al. Gelatin- hydroxyapatite- calcium sulphate based biomaterial for long term sustained delivery of bone morphogenic
protein-2 and zoledronic acid for increased bone formation: In-vitro and in-vivo carrier properties. J. Control. Release 272, 83–96
(2018).
22. Liu, Z., Robinson, J. T., Tabakman, S. M., Yang, K. & Dai, H. Carbon materials for drug delivery & cancer therapy. Mater. Today 14,
316–323 (2011).
23. Lim, D. J., Sim, M., Oh, L., Lim, K. & Park, H. Carbon-based drug delivery carriers for cancer therapy. Arch. Pharm. Res. 37, 43–52
(2014).
24. Banks, C. E., Crossley, A., Salter, C., Wilkins, S. J. & Compton, R. G. Carbon nanotubes contain metal impurities which are
responsible for the ‘electrocatalysis’ seen at some nanotube-modified electrodes. Angew. Chemie - Int. Ed. 45, 2533–2537 (2006).
25. Zhang, R. & Olin, H. Carbon nanomaterials as drug carriers: Real time drug release investigation. Mater. Sci. Eng. C 32, 1247–1252
(2012).
26. Sahoo, N. G. et al. Functionalized carbon nanomaterials as nanocarriers for loading and delivery of a poorly water-soluble anticancer
drug: A comparative study. Chem. Commun. 47, 5235–5237 (2011).
27. Pan, Y., Sahoo, N. G. & Li, L. The application of graphene oxide in drug delivery. Expert Opin. Drug Deliv. 9, 1365–1376 (2012).
28. Ege, D., Kamali, A. R. & Boccaccini, A. R. Graphene Oxide/Polymer-Based Biomaterials. Adv. Eng. Mater. 1700627, 16–34 (2017).
29. Yang, X. et al. High-efficiency loading and controlled release of doxorubicin hydrochloride on graphene oxide. J. Phys. Chem. C 112,
17554–17558 (2008).
30. Wu, J. et al. Graphene oxide used as a carrier for adriamycin can reverse drug resistance in breast cancer cells. Nanotechnology 23,
1–9 (2012).
31. Hussien, N. A., Işıklan, N. & Türk, M. Pectin-conjugated magnetic graphene oxide nanohybrid as a novel drug carrier for paclitaxel
delivery. Artif. Cells, Nanomedicine Biotechnol. 46, 264–273 (2018).
32. Yang, L. et al. Functionalized graphene oxide as a drug carrier for loading pirfenidone in treatment of subarachnoid hemorrhage.
Colloids Surfaces B Biointerfaces 129, 21–29 (2015).
33. Gautam, S. Graphene Oxide: A Potential Drug Carrier for Cancer Therapy — Review. Res. Rev. A J. Pharm. Sci. 8, 20–31 (2018).
34. Tiwari, G. et al. Drug delivery systems_ An updated review. Int J Pharm Investig. 2, 2–11 (2012).
35. Zhang, X., Hu, W., Li, J., Tao, L. & Wei, Y. A comparative study of cellular uptake and cytotoxicity of multi-walled carbon nanotubes,
graphene oxide, and nanodiamond. Toxicol. Res. (Camb). 1, 62–68 (2012).
36. Manoratne, C. H., Rosa, S. R. D. & Kottegoda, I. R. M. XRD-HTA, UV Visible, FTIR and SEM Interpretation of Reduced Graphene
Oxide Synthesized from High Purity Vein Graphite. Mater. Sci. Res. India 14, 19–30 (2017).
37. Parades, J. I., Villar-Rodil, S., Martínez-Alonso, A. & Tascón, J. M. D. Graphene oxide dispersions in organic solvents. Langmuir 24,
10560–10564 (2008).
38. He, D. et al. Mechanism of a green graphene oxide reduction with reusable potassium carbonate. RSC Adv. 5, 11966–11972 (2015).
39. Çiplak, Z., Yildiz, N. & Cąlimli, A. Investigation of graphene/Ag nanocomposites synthesis parameters for two different synthesis
methods. Fullerenes Nanotub. Carbon Nanostructures 23, 361–370 (2015).
40. Khajuria, D. K., Razdan, R. & Mahapatra, D. R. Development, in vitro and in vivo characterization of zoledronic acid functionalized
hydroxyapatite nanoparticle based formulation for treatment of osteoporosis in animal model. Eur. J. Pharm. Sci. 66, 173–183
(2015).
41. Prasanthi, M. M., Rao, B. A., Rao, B. V. N., Krishna, Y. P. & Ramana, D. V. Formulation and Evaluation of Zoledronic Acid for
Injection By Lyophilization Technique. Int. Res. J. Pharm. 8, 50–56 (2017).
42. Chen, S., Wan, P., Zhang, B., Yang, K. & Li, Y. Facile fabrication of the zoledronate-incorporated coating on magnesium alloy for
orthopaedic implants. J. Orthop. Transl. (2019).
43. Tavakoli, S. & Ege, D. Graphene Oxide as a drug carrier for delivery of zoledronic acid in secondary bone cancer treatment. MRS
Adv. 4, 1231–1235 (2019).
44. Ural, A. U., Avcu, F., Candir, M., Guden, M. & Ozcan, M. A. In vitro synergistic cytoreductive effects of zoledronic acid and radiation
on breast cancer cells. Breast Cancer Res. 8, R52–R59 (2006).
45. Zlatev, H. P., Auriola, S., Mönkkönen, J. & Määttä, J. A. Uptake of free, calcium-bound and liposomal encapsulated nitrogen
containing bisphosphonates by breast cancer cells. Eur. J. Pharm. Sci. 86, 58–66 (2016).
46. Park, Y. E. et al. Bone-Bound Bisphosphonates Inhibit Proliferation of Breast Cancer Cells. Calcif. Tissue Int. 105, 497–505 (2019).
47. Waller, D. D., Park, J. & Tsantrizos, Y. S. Inhibition of farnesyl pyrophosphate (FPP) and/or geranylgeranyl pyrophosphate (GGPP)
biosynthesis and its implication in the treatment of cancers. Crit. Rev. Biochem. Mol. Biol. 54, 41–60 (2019).
48. Elsayed, M. et al. Synergistic antiproliferative effects of zoledronic acid and fluvastatin on human pancreatic cancer cell lines: An in
Vitro study. Biol. Pharm. Bull. 39, 1238–1246 (2016).
49. Agabiti, S. S., Yilan, L. & Wiemer, A. J. Molecular mechanisms linking geranylgeranyl diphosphate synthase to cell survival and
proliferation. Mol. Membr. Biol. 33, 1–11 (2016).
50. Waller, D. D., Park, J. & Tsantrizos, Y. S. Inhibition of farnesyl pyrophosphate (FPP) and/or geranylgeranyl pyrophosphate (GGPP)
biosynthesis and its implication in the treatment of cancers. Crit. Rev. Biochem. Mol. Biol. 54, 41–60 (2019).
51. Park, J., Matralis, A. N., Berghuis, A. M. & Tsantrizos, Y. S. Human isoprenoid synthase enzymes as therapeutic targets. Front. Chem.
2, 1–21 (2014).
Scientific Reports | (2020) 10:7827 | https://doi.org/10.1038/s41598-020-64760-4 10www.nature.com/scientificreports/ www.nature.com/scientificreports
52. Räikkönen, J., Mönkkönen, H., Auriola, S. & Mönkkönen, J. Mevalonate pathway intermediates downregulate zoledronic acid-
induced isopentenyl pyrophosphate and ATP analog formation in human breast cancer cells. Biochem. Pharmacol. 79, 777–783
(2010).
53. Mohajeri, M., Behnam, B. & Sahebkar, A. Biomedical applications of carbon nanomaterials: Drug and gene delivery potentials. J.
Cell. Physiol. 234, 298–319 (2018).
54. Schindeler, A. & Little, D. G. Osteoclasts but not osteoblasts are affected by a calcified surface treated with zoledronic acid in vitro.
Biochem. Biophys. Res. Commun. 338, 710–716 (2005).
55. Recker, R. R. et al. Effects of intravenous zoledronic acid once yearly on bone remodeling and bone structure. J. Bone Miner. Res. 23,
6–16 (2008).
56. Peter, B. et al. Calcium phosphate drug delivery system: Influence of local zoledronate release on bone implant osteointegration.
Bone 36, 52–60 (2005).
57. Ebert, R. et al. Pulse treatment with zoledronic acid causes sustained commitment of bone marrow derived mesenchymal stem cells
for osteogenic differentiation. Bone 44, 858–864 (2009).
58. Frandsen, C. J., Brammer, K. S. & Jin, S. Variations to the nanotube surface for bone regeneration. Int. J. Biomater. 2013, 1–10 (2013).
59. Logan, N. & Brett, P. The control of mesenchymal stromal cell osteogenic differentiation through modified surfaces. Stem Cells Int.
2013, 1–10 (2013).
60. Allan, C. et al. Osteoblast response to disordered nanotopography. J. Tissue Eng. 9, 1–7 (2018).
61. Boccaccini, A. R., Ege, D., Kamali, A. R. & Boccaccini, A. R. Graphene Oxide / Polymer-Based Biomaterials Graphene Oxide /
Polymer-Based Biomaterials. Adv. Eng. Mater. 1700627, 16–34 (2017).
62. Carbonare, L. D. et al. Enhanced osteogenic differentiation in zoledronate-treated osteoporotic patients. Int. J. Mol. Sci. 18, 1–12
(2017).
63. Kolanthai, E. et al. Graphene Oxide - A Tool for the Preparation of Chemically Crosslinking Free Alginate-Chitosan-Collagen
Scaffolds for Bone Tissue Engineering. ACS Appl. Mater. Interfaces 10, 12441–12452 (2018).
64. Ou, L. et al. Toxicity of graphene-family nanoparticles: A general review of the origins and mechanisms. Part. Fibre Toxicol. 13,
57–81 (2016).
65. Basso, F. G. et al. Response of a co-culture model of epithelial cells and gingival fibroblasts to zoledronic acid. Braz. Oral Res. 30, e122
(2016).
66. Pozzi, S. et al. High-Dose Zoledronic Acid Impacts Bone Remodeling with Effects on Osteoblastic Lineage and Bone Mechanical
Properties. Clin. Cancer Res. 15, 5829–5840 (2009).
67. Hu, L. et al. Pretreatment with Bisphosphonate Enhances Osteogenesis of Bone Marrow Mesenchymal Stem Cells. Stem Cells Dev.
26, 123–132 (2016).
68. Igarashi, K., Hirafuji, M., Adachi, H., Shinoda, H. & Mitani, H. Effects of bisphosphonates on alkaline phosphatase activity,
mineralization, and prostaglandin E2 synthesis in the clonal osteoblast-like cell line MC3T3-E1. Prostaglandins Leukot. Essent. Fat.
Acids 56, 121–125 (1997).
69. Pan, B. et al. The nitrogen-containing bisphosphonate, zoledronic acid, increases mineralisation of human bone-derived cells in
vitro. Bone 34, 112–123 (2004).
70. Basso, F. G., Turrioni, A. P. S., Hebling, J. & De Souza Costa, C. A. Inhibition of osteoblast activity by zoledronic acid. J. Bras. Patol.
e Med. Lab. 49, 368–371 (2013).
71. Vaisman, D. N., McCarthy, A. D. & Cortizo, A. M. Bone-specific alkaline phosphatase activity is inhibited by bisphosphonates. Biol.
Trace Elem. Res. 104, 131–140 (2005).
72. Gao, F., Liu, Y., Liu, M. & Zhu, L. Zoledronic acid regulates osteoblast differentiation via the mTORC1 signaling pathway. 11,
4585–4594 (2018).
73. Yang, X. et al. Effects of graphene oxide and graphene oxide quantum dots on the osteogenic differentiation of stem cells from
human exfoliated deciduous teeth. Artif. Cells, Nanomedicine Biotechnol. 47, 822–832 (2019).
74. Kang, E. S. et al. Size-dependent effects of graphene oxide on the osteogenesis of human adipose-derived mesenchymal stem cells.
Colloids Surfaces B Biointerfaces 169, 20–29 (2018).
75. Lee, W. C. et al. Origin of Enhanced Stem Cell Growth and Differentiation on Graphene and Graphene Oxide. ACS Nano 5,
7334–7341 (2011).
76. Bagri, A. et al. Structural evolution during the reduction of chemically derived graphene oxide. Nat. Chem. 2, 581–587 (2010).
77. Schech, A. J., Nemieboka, B. E. & Brodie, A. H. Zoledronic acid inhibits aromatase activity and phosphorylation: Potential
mechanism for additive zoledronic acid and letrozole drug interaction. J. Steroid Biochem. Mol. Biol. 132, 195–202 (2012).
78. Talukdar, Y., Rashkow, J. T., Lalwani, G., Kanakia, S. & Sitharaman, B. The effects of graphene nanostructures on mesenchymal stem
cells. Biomaterials 35, 4863–4877 (2014).
79. Rampersad, S. N. Multiple applications of alamar blue as an indicator of metabolic function and cellular health in cell viability
bioassays. Sensors 12, 12347–12360 (2012).
80. Das Murtey, M. & Ramasamy, P. in Modern Electron Microscopy in Physical and Life Sciences (ed. Janecek, M.) 161–183
(InTechOpen, 2016).
81. Brennan, M. Á., Renaud, A., Gamblin, A., Arros, C. D. & Nedellec, S. 3D cell culture and osteogenic differentiation of human bone
marrow stromal cells plated onto jet- sprayed or electrospun micro-fiber scaffolds 3D cell culture and osteogenic differentiation of
human bone marrow stromal cells plated onto jet-sprayed or el. Biomed. Mater. 10, 1–13 (2015).
Acknowledgements
This work was supported by Boğaziçi University Research fund (No. 13601) and the Scientific and Technological
Research Council of Turkey (TUBITAK) (No. 117M231).
Author contributions
Dr. Duygu Ege and Sepideh Tavakoli worked on the conception and design of the work. Sepideh Tavakoli and
Gökçen Boran did the data collection. Dr. Duygu Ege, Sepideh Tavakoli and Gökçen Boran, Prof. Ingo Dierking
and Ali Reza Kamali worked on data analysis and interpretation. Dr. Duygu Ege and Gökçen Boran worked on
the drafting of the article. Dr. Duygu Ege, Prof. Ingo Dierking and Prof. Ali Reza Kamali did the critical revision
of the article. All authors did the final approval of the version to be published. Best regards, Duygu Ege.
Competing interests
The authors declare no competing interests.
Additional information
Correspondence and requests for materials should be addressed to D.E.
Scientific Reports | (2020) 10:7827 | https://doi.org/10.1038/s41598-020-64760-4 11www.nature.com/scientificreports/ www.nature.com/scientificreports
Reprints and permissions information is available at www.nature.com/reprints.
Publisher’s note Springer Nature remains neutral with regard to jurisdictional claims in published maps and
institutional affiliations.
Open Access This article is licensed under a Creative Commons Attribution 4.0 International
License, which permits use, sharing, adaptation, distribution and reproduction in any medium or
format, as long as you give appropriate credit to the original author(s) and the source, provide a link to the Cre-
ative Commons license, and indicate if changes were made. The images or other third party material in this
article are included in the article’s Creative Commons license, unless indicated otherwise in a credit line to the
material. If material is not included in the article’s Creative Commons license and your intended use is not per-
mitted by statutory regulation or exceeds the permitted use, you will need to obtain permission directly from the
copyright holder. To view a copy of this license, visit http://creativecommons.org/licenses/by/4.0/.
© The Author(s) 2020
Scientific Reports | (2020) 10:7827 | https://doi.org/10.1038/s41598-020-64760-4 12You can also read