Tableau CRM Bindings Developer Guide - Salesforce, Winter '22 - @salesforcedocs
←
→
Page content transcription
If your browser does not render page correctly, please read the page content below

Tableau CRM Bindings
Developer Guide
Salesforce, Winter ’22

                                 @salesforcedocs
                         Last updated: October 14, 2021
© Copyright 2000–2021 salesforce.com, inc. All rights reserved. Salesforce is a registered trademark of salesforce.com, inc.,

       as are other names and marks. Other marks appearing herein may be trademarks of their respective owners.
CONTENTS

Interactions in Tableau CRM Dashboards . . . . . . . . . . . . . . . . . . . . . . . . . . . . . . . . . . . 1
Selection Interaction . . . . . . . . . . . . . . . . . . . . . . . . . . . . . . . . . . . . . . . . . . . . . . . . . . . . 1
Result Interaction . . . . . . . . . . . . . . . . . . . . . . . . . . . . . . . . . . . . . . . . . . . . . . . . . . . . . . 2
Interactions in Dashboard Designer Dashboards . . . . . . . . . . . . . . . . . . . . . . . . . . . . . . . . 3

INTERACTIONS IN TABLEAU CRM DASHBOARDS

Interactions allow you to work with different components in a dashboard. You control the interactions by binding queries to each other.
There are two types of interactions: selection interaction and results interaction. The selection or results of one query triggers updates
in other queries in the dashboard.

      Note: Prior to the Spring '20 release, interactions were called bindings. Prior to the Winter '20 release, queries were called steps.

      Tip: Before you create interactions to make widgets interactive, consider faceting. Facets are the simplest and most common way
      to specify interactions between widgets. When faceted, selections made in one widget automatically filter all other widgets using
      queries from the same dataset. Faceting is easy to set up, but it is limited. It can only filter other queries and works only on queries
      from the same dataset. To create interactions outside this scope, use interactions.
For more information about queries, see Widget Steps in an Tableau CRM Dashboard. For more information about faceting, see Making
Widgets Interactive Using Facets and Bindings.

    Selection Interaction
    Selection interaction is a method used to update a query based on the selection in another query. Selection interactions are evaluated
    each time the user selects something in a widget.
    Result Interaction
    Results interaction is a method used to update a query based on the results of another query.
    Interactions in Dashboard Designer Dashboards
    The dashboard designer treats selection and results interactions the same. Both types of interactions operate on tabular data and
    return complete rows, even for columns not used in widgets. The dashboard designer treats multiple selections as tabular data and
    single selections as a single row of tabular data. The designer expresses each row of tabular data in the form of an array of objects,
    where each object is keyed by the column name.

Selection Interaction
Selection interaction is a method used to update a query based on the selection in another query. Selection interactions are evaluated
each time the user selects something in a widget.
For example, you have the following dashboard.

                                                                      1
Interactions in Tableau CRM Dashboards Result Interaction
A selection in the Industry Filter widget filters the results in the # of Deals by Industry chart.
A selection interaction can be used to:
• Specify interactions between widgets which use queries from different datasets.
• In addition to filters, specify the measures, groupings, and other aspects of a query.
• Set widget display properties for some widget types (number and chart only).
Note: Interactions on widget titles and subtitles are ignored when you open the widget in an explorer lens.
Result Interaction
Results interaction is a method used to update a query based on the results of another query.
A results interaction is typically used to:
• Define intermediate results for a complex calculation. For example, to calculate the total opportunity amount for the top-five products,
use one query to calculate the top-five products. Then use those results to filter another query that calculates the total number of
open cases for each product.
• Set an initial filter selection for a dashboard based on a characteristic of the logged-in user, like their country.
• Dynamically change the display of a widget based on the results of a query. For example, you can configure a number widget to
show different colors based on the value of the measure. (In dashboard designer only.)
2Interactions in Tableau CRM Dashboards Interactions in Dashboard Designer Dashboards
Interactions in Dashboard Designer Dashboards
The dashboard designer treats selection and results interactions the same. Both types of interactions operate on tabular data and return
complete rows, even for columns not used in widgets. The dashboard designer treats multiple selections as tabular data and single
selections as a single row of tabular data. The designer expresses each row of tabular data in the form of an array of objects, where each
object is keyed by the column name.
Syntax
You must specify the right syntax when creating an interaction in a dashboard designer dashboard. The syntax is different for each
dashboard designer.
Interaction Functions
Dashboard designer dashboards support a variety of interaction functions that get data from a source query, manipulate it, and
serialize it to make it consumable by the target query.
Interaction Limitations for Dashboard Designer Dashboards
Tableau CRM supports interactions in numerous places, but not everywhere. Review the following limitations before you create any
interactions.
Interaction Errors
If you create an invalid interaction in a dashboard, the widget that uses the interaction displays an error in the dashboard.
Use Cases
To help you better understand how to build interactions, look at these different interaction use cases.
Syntax
You must specify the right syntax when creating an interaction in a dashboard designer dashboard. The syntax is different for each
dashboard designer.
To specify a selection or results interaction in the dashboard designer, use the following syntax.
.
For example,
mySourceStep.selection
Note: When specifying the query, you specify the ID, not the label.
Interaction Functions
Dashboard designer dashboards support a variety of interaction functions that get data from a source query, manipulate it, and serialize
it to make it consumable by the target query.
If the input data has empty results, the function returns a null value. If the specified location of the data doesn’t exist, an error occurs.
For example, the interaction is defined to get data from row 3, but row 3 doesn’t exist. An error also occurs if the shape of the input data
doesn’t meet the requirement for the function.
Interaction functions operate on input data with one the following shapes.
• Scalar value, like 0, "this is scalar", or null.
• One-dimensional array, like ([1, 2, 3]) or (["one","two","three"])
3Interactions in Tableau CRM Dashboards Interaction Functions
• Two-dimensional array (an array of arrays), like ([ [1, 2], [3, 4] ])
The required shape of the input data varies with each function. After processing the data, the functions can change the shape of the
data.
Each interaction consists of nested functions. Each interaction must have one data selection function and one data serialization function.
Optionally, interactions can have multiple data manipulation functions. (The following sections describe these types of functions.) The
following example illustrates how nested functions in an interaction work together to produce the expected result for a target query in
which they are defined. The example is based on the following interaction.
coalesce(cell(mySourceStep.selection, 0, \"grouping\"), \"state\").asString()
The mySourceStep query has the following input data.
display grouping
Regional Area region
Country country
State state
Technically, the data for this query is stored as a two-dimensional array, where each row is stored as a map of key-value pairs.
[
["display":"Regional Area", "grouping":"region"],
["display":"Country", "grouping":"country"],
["display":"State", "grouping":"state"]
]
At runtime, Tableau CRM evaluates the interaction functions, starting with the innermost function. Using that logic, Tableau CRM evaluates
the example’s interaction functions in the following order.
Function Description
mySourceStep.selection Tableau CRM returns each row of selected data as a map of
key-value pairs. If a single selection is made, only one row returns.
If multiple selections are made, multiple rows return.
[
["display":"Regional Area",
"grouping":"region"],
["display":"Country",
"grouping":"country"],
["display":"State", "grouping":"state"]
]
cell(mySourceStep.selection, 0, The cell function returns a scalar value from the "grouping"
\"grouping\") column of the first row (indicated by the 0 index) returned by
mySourceStep.selection. Based on the selection, the
return value can be "region", "country", or "state". If
no selection is made, the function returns null.
4Interactions in Tableau CRM Dashboards Interaction Functions
Function Description
coalesce(cell(mySourceStep.selection, 0, The coalesce function returns the value of the cell function
\"grouping\"), \"state\") if a selection was made. If no selection was made, the coalesce
function returns the specified default value "state".
Tip: Use the coalesce function to provide a default
value so that an error doesn’t occur when a null value is
encountered.
coalesce(cell(mySourceStep.selection, 0, The .asString function returns the result of the coalesce
\"grouping\"), \"state\").asString() function as a SAQL string.
To see how these functions are used in interactions, see Use Cases.
Data Selection Functions
A data selection function selects data from a source. The source can be either a selection or results of a query. The function returns
a table of data, where each column has a name, and each row has an index, starting with 0. From the table, you can select one or
more rows, one or more columns, or a cell to include in your interaction.
Data Manipulation Functions
A data manipulation function changes the data into the format required by the data serialization function (see the next section).
You can apply a manipulation function on the results from a data selection or other data manipulation function. If the input data is
null, the manipulation function returns null, unless otherwise specified.
Data Serialization Functions
Serialization functions convert the data into the form expected by the query in which the interaction is inserted. For example, if the
interaction is used in a compact-form query, use the asObject() function to format the data into a one-dimensional object.
Data Selection Functions
A data selection function selects data from a source. The source can be either a selection or results of a query. The function returns a
table of data, where each column has a name, and each row has an index, starting with 0. From the table, you can select one or more
rows, one or more columns, or a cell to include in your interaction.
In cases where multiple rows or columns of data are selected, the function returns a two-dimensional array. When a single row or single
column is selected, the function returns a one-dimensional array. When a cell is selected, the function returns a scalar value. The function
returns null if the source is empty. If the function tries to select data that doesn’t exist, an interaction error occurs. For example, the table
only has two rows, but you try to select data from the third row.
cell Function
Returns a single cell of data as a scalar, like "This salesperson rocks", 2, or null. An error occurs if the rowIndex is not an integer,
the columnName is not a string, or the cell doesn’t exist in the table.
column Function
Returns one column of data (as a one-dimensional array) or multiple columns of data (as a two-dimensional array).
5Interactions in Tableau CRM Dashboards Interaction Functions
row Function
Returns one row of data (as a one-dimensional array) or multiple rows (as a two-dimensional array). For selection interactions, you
typically use this function to return the first row or all rows. For results interactions, you might want specific rows. To determine the
row index, display the query results in a values table.
cell Function
Returns a single cell of data as a scalar, like "This salesperson rocks", 2, or null. An error occurs if the rowIndex is not an integer,
the columnName is not a string, or the cell doesn’t exist in the table.
Syntax
cell(source, rowIndex, columnName)
Arguments
Argument Description
source (Required) Specify the name of the query and selection or
result.
rowIndex (Required) Specify the row using its index. Row index starts at 0.
columnName (Required) Specify the column name.
The following example is based on the myStep source query. Assume that myStep.selection retrieves the following rows from
the query.
[
{stateName: ‘CA’, Amount:100},
{stateName: ‘TX’, Amount:200},
{stateName: ‘OR’’, Amount:300},
{stateName: ‘AL’, Amount:400},
]
Although Tableau CRM doesn’t store this data as a table, let’s show the data in this format to make it easier to understand the example.
(row index) stateName Amount
0 CA 100
1 TX 200
2 OR 300
3 AL 400
Example:
cell(myStep.selection, 1, "stateName")
6Interactions in Tableau CRM Dashboards Interaction Functions
Output:
"TX"
column Function
Returns one column of data (as a one-dimensional array) or multiple columns of data (as a two-dimensional array).
Syntax
column(source, [columnNames...])
Arguments
Argument Description
source (Required) Specify the name of the query and selection or
result.
columnNames (Required) Specify an array of column names. The order of the
listed columns affects the order that the columns appear in the
output. The order is important for serialization functions. For
example, the asOrder function requires the first element to be
a field name and the second to be the direction.
The following examples are based on the myStep source query. Assume that myQuery.selection retrieves the following rows
from the query.
[
{stateName: ‘CA’, Amount:100},
{stateName: ‘TX’, Amount:200},
{stateName: ‘OR’’, Amount:300},
{stateName: ‘AL’, Amount:400},
]
Although Tableau CRM doesn’t store this data as a table, let’s show the data in this format to make it easier to understand the examples
that follow.
(row index) stateName Amount
0 CA 100
1 TX 200
2 OR 300
3 AL 400
7Interactions in Tableau CRM Dashboards Interaction Functions
Example:
column(myStep.selection, ["stateName"])
Output:
["CA", "TX", "OR", "AL"]
Example:
column(myStep.selection, [])
Output:
[ ["CA", "TX", "OR", "AL"], ["100", "200”," "300", "400"] ]
row Function
Returns one row of data (as a one-dimensional array) or multiple rows (as a two-dimensional array). For selection interactions, you
typically use this function to return the first row or all rows. For results interactions, you might want specific rows. To determine the row
index, display the query results in a values table.
Syntax
row(source), [rowIndices...], [columnNames...])
Arguments
Argument Description
source (Required) Specify the name of the query and selection or
result.
rowIndices (Required) Specify an array of row indices, where each element of
the array identifies a row. Row index 0 identifies the first row. To
include all rows, specify an empty array.
columnNames (Optional) Specify an array of column names to select and order
them. If not specified, all columns are selected and every row has
the same order of columns. However, that order isn't guaranteed
to be the same across different queries.
The following examples are based on the myStep source query. Assume that myStep.selection retrieves the following rows
from the query.
[
{stateName: ‘CA’, Amount:100},
{stateName: ‘TX’, Amount:200},
{stateName: ‘OR’’, Amount:300},
{stateName: ‘AL’, Amount:400},
]
8Interactions in Tableau CRM Dashboards Interaction Functions
Although Tableau CRM doesn’t store this data as a table, let’s show the data in this format to make it easier to understand the examples
that follow.
(row index) stateName Amount
0 CA 100
1 TX 200
2 OR 300
3 AL 400
Example:
row(myStep.selection, [0], ["Amount"])
Output:
["100"]
Example:
row(myStep.selection, [0,2], [])
Output:
[ ["CA", "100"], ["OR", "300"] ]
Example:
row(myStep.selection, [], ["stateName"])
Output:
[ ["CA"], ["TX"], ["OR"], ["AL"] ]
Example:
row(myStep.selection, [0,2], ["stateName", "Amount"])
Output:
[ ["CA", "100"], ["OR", "300"] ]
Data Manipulation Functions
A data manipulation function changes the data into the format required by the data serialization function (see the next section). You
can apply a manipulation function on the results from a data selection or other data manipulation function. If the input data is null, the
manipulation function returns null, unless otherwise specified.
Note: If data manipulation isn’t required, add a data serialization function to the results of the data selection functions.
9Interactions in Tableau CRM Dashboards Interaction Functions
coalesce Function
Returns the first non-null source from a list of sources. Useful for providing a default value in case a function returns a null value.
concat Function
Joins streams from multiple sources into a one- or two-dimensional array. Null sources are skipped.
flatten Function
Flattens a two-dimensional array into a one-dimensional array.
join Function
Converts a one- or two-dimensional array into a string by joining the elements using the specified token. An error occurs if the data
has any other shape.
slice Function
Selects one or more values from a one-dimensional array given a start and, optionally, an end position, and returns a one-dimensional
array. An error occurs if the start value is greater than the end value. Negative indices are supported.
toArray Function
Converts scalars to a one-dimensional array, and one-dimensional arrays to a two-dimensional array. For example, use this function
to convert the scalar result of a cell function to an array, which is required by compact-form measures, groups, and order clauses.
The function returns an error if the input is a series of static one-dimensional arrays, a two-dimensional array, or a mix of scalars and
one-dimensional arrays.
valueAt Function
Returns the single scalar value at the given index.
coalesce Function
Returns the first non-null source from a list of sources. Useful for providing a default value in case a function returns a null value.
Syntax
coalesce(source1, source2,...)
Arguments
Argument Description
source (Required) Source can be the results of a data selection or other
data manipulation function. The source can have any shape.
Example:
coalesce(cell(step1.selection, 0, "column1"), "green")
Output: The output is the result returned by cell(step1.selection, 0, "column1"). However, if
cell(step1.selection, 0, "column1") returns null, then the output is
"green"
For an application of this function in an interactions use case, see Change the Map Type Based on a Toggle Widget.
10Interactions in Tableau CRM Dashboards Interaction Functions
concat Function
Joins streams from multiple sources into a one- or two-dimensional array. Null sources are skipped.
Syntax
concat(source1, source2,...)
Arguments
Argument Description
source (Required) Each source can be the results of a data selection or
other data manipulation function. Each source must be either a
one- or two-dimensional array. An error occurs if you try to
concatenate data from sources of different shapes. For example,
the following function produces an error: concat(["a",
"b"], ["c", "d", "e"]).
Example:
concat(["a", "b"], ["c", "d"])
Output:
["a", "b", "c", "d"]
Example:
concat([["a", "b"]], [["c", "d"]])
Output:
[["a", "b"], ["c", "d"]]
flatten Function
Flattens a two-dimensional array into a one-dimensional array.
Syntax
flatten(source)
Arguments
Argument Description
source (Required) Source can be the results of a data selection or other
data manipulation function. The source must be a two-dimensional
11Interactions in Tableau CRM Dashboards Interaction Functions
Argument Description
array; otherwise, an error occurs because there’s no reason to flatten
a one-dimensional array or scalar.
Example:
flatten([["CDG", "SAN"], ["BLR", "HND"], ["SMF", "JFK"])
Output:
["CDG", "SAN", "BLR", "HND", "SMF", "JFK"]
join Function
Converts a one- or two-dimensional array into a string by joining the elements using the specified token. An error occurs if the data has
any other shape.
Syntax
join(source, token)
Arguments
Argument Description
source (Required) Source can be the results of a data selection or other
data manipulation function. The source must be a two-dimensional
array; otherwise, an error occurs.
token (Required) Any string value, like + or ,.
Example:
join(["a", "b", "c"], "+")
Output:
["a+b+c"]
Example:
join([["a", "b", "c"], [1, 2]], "~")
Output:
["a~b~c~1~2"]
12Interactions in Tableau CRM Dashboards Interaction Functions
slice Function
Selects one or more values from a one-dimensional array given a start and, optionally, an end position, and returns a one-dimensional
array. An error occurs if the start value is greater than the end value. Negative indices are supported.
Syntax
slice(source, start, end)
Arguments
Argument Description
source (Required) Source can be the results of a data selection or other
data manipulation function. The source can have any shape.
start (Required) Index that identifies the start value in the array. For
example, 0 represents the first element in the array.
end (Optional) Index that identifies the end value in the array.
Example:
slice(step.selection, -1, 0)
Returns the last selected row.
toArray Function
Converts scalars to a one-dimensional array, and one-dimensional arrays to a two-dimensional array. For example, use this function to
convert the scalar result of a cell function to an array, which is required by compact-form measures, groups, and order clauses. The
function returns an error if the input is a series of static one-dimensional arrays, a two-dimensional array, or a mix of scalars and
one-dimensional arrays.
Syntax
toArray (source1, source2,...)
Argument
Argument Description
source (Required) The input must be scalars, including static values, or
one-dimensional arrays.
13Interactions in Tableau CRM Dashboards Interaction Functions
Example: Consider the following Opportunities query result.
Oppty_Name Owner Region Amount Created_Date
Alpha Danny Americas 1000 2/20/2017
Bravo Danny Americas 500 4/15/2017
Charlie Jeff EMEA 2000 5/1/2017
These interactions use the Opportunities query as a source.
Interaction Result
toArray( cell(Opportunities.selection, [“Americas”]
0, “Region”) )
toArray( “APAC” ) [“APAC”]
toArray( cell(Opportunities.selection, [“Americas”, “APAC”]
0, “Region”), “APAC” )
toArray( column(Opportunities.selection, [[“Alpha”, “Bravo”, “Charlie”], [“Americas”, “Americas”, “EMEA”]]
[“Oppty_Name”]),
column(Opportunities.selection, [“Region]
)
toArray( column(Opportunities.selection, Error. The column interaction function returns a two-dimensional
[“Oppty_Name”, “Region”]) ) array, which is an invalid input.
toArray( [1, 2, 3], [4, 5, 6] ) Error. The input can’t be a series of static one-dimensional arrays.
valueAt Function
Returns the single scalar value at the given index.
Syntax
valueAt(source, index)
Arguments
Argument Description
source (Required) Source can be the results of a data selection or other
data manipulation function. The source can have any shape.
index (Required) Negative indexes are supported. If you specify an index
that doesn’t exist, the function returns null.
14Interactions in Tableau CRM Dashboards Interaction Functions
Example:
valueAt(cell(step.selection, 0, "column"), -1)
Returns the last selected value.
Data Serialization Functions
Serialization functions convert the data into the form expected by the query in which the interaction is inserted. For example, if the
interaction is used in a compact-form query, use the asObject() function to format the data into a one-dimensional object.
asDateRange() Function
Returns the date range filter condition as a string for a SAQL query. The date range is inclusive. Use the string as part of a filter based
on dates.
asEquality() Function
Returns an equality or "in" filter condition as a string for a SAQL query. The input data must be a scalar, one-dimensional array, or
two-dimensional array.
asGrouping() Function
Returns a grouping as a string. Can also return multiple groupings
asObject() Function
Passes data through with no serialization. Returns data as an object (an array of strings).
asOrder() Function
Returns the sort order as a string for a SAQL query.
asProjection() Function
Returns the query expression and alias as a string that you can use to project a field in a query. The query expression determines the
value of the field. The alias is the field label.
asRange() Function
Returns a range filter condition as a string for a SAQL query. The range is inclusive.
asString() Function
Serializes a scalar, one-dimensional array, or two-dimensional array as a string. Escapes double quotes in strings.
asDateRange() Function
Returns the date range filter condition as a string for a SAQL query. The date range is inclusive. Use the string as part of a filter based on
dates.
The input data must be a one- or two-dimensional array. If the input data is a one-dimensional array with two elements, the function
uses the first element as the minimum and the second element as the maximum. Null results in fieldName in all, which applies
no filter.
Syntax
.asDateRange(fieldName)
15Interactions in Tableau CRM Dashboards Interaction Functions
Arguments
Argument Description
fieldName (Required) The name of the date field.
The following example is based on the stepFoo source query. Assume that stepFoo.selection retrieves the following rows
from the query.
[
{min: 1016504910000, max: 1281655993000}
]
Example:
row(stepFoo.selection, [0], ["min", "max"]).asDateRange("date(year, month, day)")
Output:
date(year, month, day) in [dateRange([2002,3,19], [2010,8,12])]
See also Date Range Filters.
asEquality() Function
Returns an equality or "in" filter condition as a string for a SAQL query. The input data must be a scalar, one-dimensional array, or
two-dimensional array.
If a single field name is provided, the returned string contains the in operator for a one-dimensional array (fieldName in ["foo",
"bar"]) or the equality operator for a scalar (fieldName == "foo").
If multiple field names are provided, the returned string contains a composite filter. For this case, a two-dimensional array is expected.
The number of values in each array must match the number of specified fields.
In Spring ‘21, the behavior of null values has changed due to the addition of nulls in group values. The updated behavior if the input to
this function is null, is the function now returns is null, instead of by all, where
is the first field. For example, if cell(step1.selection, 0, "column1") evaluates to null,
cell(step1.selection, 0, "column1").asEquality("field1") now evaluates to 'field1' is null,
instead of 'field1' by all. If there are no selected rows, cell(step1.selection, "column1"), the function evaluates
to in all.
Syntax
.asEquality(fieldName)
Arguments
Argument Description
fieldName (Required) The name of the field.
16Interactions in Tableau CRM Dashboards Interaction Functions
The following examples are based on the myStep source query. Assume that myStep.selection is the following.
[
{grouping: "first", measure: 19}
{grouping: "second", measure: 32}
]
Example:
cell(myStep.selection, 1, "measure").asEquality("bar")
Output:
bar == 32
Example:
column(myStep.selection, ["grouping"]).asEquality("bar")
Output:
bar in ['first','second']
Example: This example illustrates how a lack of input data is handled. Imagine that myStep.selection resolves as
[]
cell(myStep.selection, 0, "value").asEquality("bar")
Output:
'bar' in all
Example: The next examples illustrate how null values and empty arrays are evaluated when present in the
myStep.selection.
[
{grouping: "first", measure: null},
{grouping: "second", measure: 32}
]
cell(myStep.selection, 0, "measure").asEquality("bar")
Output:
'bar' is null
[
{label: "Bananas", value: []}
]
cell(myStep.selection, 0, "value").asEquality("bar")
Output
'bar' in all
17Interactions in Tableau CRM Dashboards Interaction Functions
See also Filters.
asGrouping() Function
Returns a grouping as a string. Can also return multiple groupings
The input data must be a scalar or one-dimensional array of groupings. Null results in a group by all.
Syntax
.asGrouping()
Let’s look at some examples where the selection determines the groupings in a SAQL-form query. The following examples are based on
the stepFoo source query. Assume that stepFoo.selection retrieves the following rows from the query.
[
{grouping: "first", alias: "foo"}
{grouping: "second", alias: "bar"}
]
Example:
cell(stepFoo.selection, 1, "grouping").asGrouping()
Output:
'second'
Example: To make the interaction return multiple fields for the grouping, replace the cell interaction function with a column
function and update the arguments.
column(stepFoo.selection, ["grouping"]).asGrouping()
Output:
('first', 'second')
See also Group Interactions.
asObject() Function
Passes data through with no serialization. Returns data as an object (an array of strings).
Syntax
.asObject()
Example:
column(StaticMeasureNamesStep.selection, [\"value\"]).asObject()
For an application of this function in an interactions use case, see Bind Parts of a Query.
18Interactions in Tableau CRM Dashboards Interaction Functions
Example:
cell(static_1.selection, 0, \"value\").asObject()
asOrder() Function
Returns the sort order as a string for a SAQL query.
The input data must be a scalar, one-dimensional array, or two-dimensional array. A two-dimensional array is treated as a tuple of
interactions.
Syntax
.asOrder()
The following example is based on the stepFoo source query. Assume that stepFoo.selection retrieves the following rows
from the query.
[
{order: "first", direction: "desc"}
{order: "second", direction: "asc"}
]
Example:
cell(stepFoo.selection, 1, "order").asOrder()
Output:
'second'
Example:
column(stepFoo.selection, ["order"]).asOrder()
Output:
('first', 'second')
Example:
row(stepFoo.selection, [], ["order", "direction"]).asOrder()
Output:
('first' desc, 'second' asc)
See also Order Interactions.
asProjection() Function
Returns the query expression and alias as a string that you can use to project a field in a query. The query expression determines the
value of the field. The alias is the field label.
19Interactions in Tableau CRM Dashboards Interaction Functions
Use this function to write a foreach statement for a field projection. The function concatenates the query expression, ‘as’, and the
field label in the following format.
as
Here’s a sample projection that rounds the price to two decimals and stores the result in the SalesPrice field.
q = foreach q generate round(Price, 2) as SalesPrice;
In this example, round(Price, 2) is the expression and SalesPrice is the field label.
Syntax
.asProjection()
The following example is based on the stepFoo source query. Assume that stepFoo.selection retrieves the following rows
from the query.
[
{expression: "first", alias: "foo"}
{expression: "second", alias: "bar"}
]
Example:
stepFoo.selection, [0], ["expression", "alias"]).asProjection()
Output:
first as 'foo'
Example:
stepFoo.selection, [], ["expression", "alias"]).asProjection()
Output:
first as 'foo', second as 'bar'
See also Projection Interactions.
asRange() Function
Returns a range filter condition as a string for a SAQL query. The range is inclusive.
The input data must be a one-dimensional array with at least two elements. The function uses the first as the minimum and the second
as the maximum. null results in fieldName by all, which applies no filter.
Syntax
.asRange(fieldName)
20Interactions in Tableau CRM Dashboards Interaction Limitations for Dashboard Designer Dashboards
Arguments
Argument Description
fieldName (Required) The name of the field.
The following example is based on the myStep source query. Assume that myStep.selection retrieves the following rows from
the query.
[
{grouping: "first", measure: 19}
{grouping: "second", measure: 32}
]
Example:
row(myStep.selection, [0], ["min", "max"]).asRange("bar")
Output:
bar >= 19 && barInteractions in Tableau CRM Dashboards Interaction Errors
Widget Type Unsupported Widget Properties
Number • borderEdges
• borderWidth
• compact
• exploreLink
• measureField
• textAlignment
Chart • borderEdges
• borderRadius
• borderWidth
• exploreLink
• measureField
You can’t bind the following query properties:
Query Property
selectMode
Interaction Errors
If you create an invalid interaction in a dashboard, the widget that uses the interaction displays an error in the dashboard.
Generally, there are two types of errors.
Validation errors
These errors occur when Tableau CRM is unable to parse the interaction due to the wrong syntax or illegal arguments used in your
interactions. Another typical issue is that you didn’t escape double quotes when they are inside other double quotes. For example,
notice how the inner set of double quotes is escaped.
"numberColor": "{{cell(color_1.result, 0, \"color\").asString()}}"
Execution errors
These errors occur when Tableau CRM executes the interaction and either the expected columns or rows are missing or the data is
in the wrong shape. For example, the interaction received a row, when it expected a cell.
Review error messages to understand how to resolve interaction issues. For example, here’s an example of an interaction error in a
dashboard.
22Interactions in Tableau CRM Dashboards Use Cases
Use Cases
To help you better understand how to build interactions, look at these different interaction use cases.
To get hands-on with interactions, check out the Einstein Analytics Learning Adventure app available on Salesforce AppExchange. The
app walks you through best-practice interaction examples for building powerful, dynamic apps. Download the app today and get your
hands dirty!
Bind Parts of a Query
You can dynamically set parts of a query based on the selection or results of another query. For example, you can set the grouping
in a query based on the grouping selected in a chart.
Bind Queries from Different Datasets
You can bind queries from different datasets. For example, the following dashboard contains two charts, each based on its own
dataset.
Bind a Custom Query with Other Queries
You can create custom queries to specify your own values for a query, instead of getting values from a query. For example, you might
create a custom query to show “Top 5 Customers” and “Bottom 5 Customers” in a toggle widget. After you create the custom query,
to make it interact with the other widgets in the dashboard, manually bind the custom query to the queries of the other widgets.
Bind Widget Properties
In a dashboard designer dashboard only, you can implement interactions to dynamically change properties for number or chart
widgets.
Bind the Initial Filter Selection
You can use a results interaction to dynamically set the initial selection of a query based on a characteristic of the logged-in user.
For example, you can filter a region-based dashboard based on the country of the logged-in user.
Create Deeper Dependencies with Nested Interactions
Nested interactions enable you to create deeper dependencies among widgets.
23Interactions in Tableau CRM Dashboards Use Cases
Bind Parts of a Query
You can dynamically set parts of a query based on the selection or results of another query. For example, you can set the grouping in a
query based on the grouping selected in a chart.
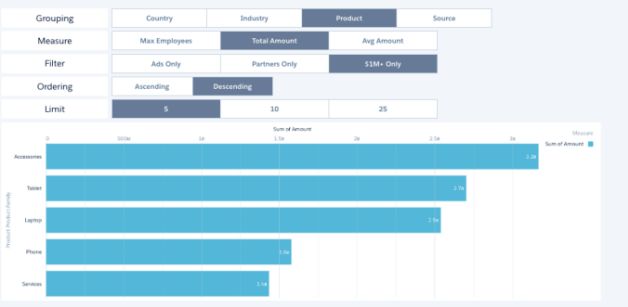
Before we discuss how to bind the different parts of the query, let’s look at a comprehensive example. This example illustrates what the
interactions look like for different parts of a query. The chart is bound based on selections for grouping, measure, filter, order, and limit.
When you make a selection in one of the toggle widgets, the chart morphs to visualize the results of the modified query.
Here’s the JSON for the queries that power this dashboard. The Account_BillingCount_1 query is the underlying query for the chart
widget. This query contains multiple interactions based on other queries.
"steps": {
"Account_BillingCount_1": {
"datasets": [
{
"id": "0FbB00000000oEkKAI",
"label": "Opportunities",
"name": "opportunity",
"url": "/services/data/v38.0/wave/datasets/0FbB00000000oEkKAI"
}
],
"isFacet": true,
"isGlobal": false,
"query": {
"measures": "{{column(StaticMeasureNames.selection,
[\"value\"]).asObject()}}",
"limit": "{{column(StaticLimits.selection, [\"value\"]).asObject()}}",
"groups": "{{column(StaticGroupingNames.selection,
[\"value\"]).asObject()}}",
"filters": "{{column(StaticFilters.selection, [\"value\"]).asObject()}}",
24Interactions in Tableau CRM Dashboards Use Cases
"order": "{{column(StaticOrdering.selection, [\"value\"]).asObject()}}"
},
"selectMode": "single",
"type": "aggregateflex",
"useGlobal": true,
"visualizationParameters": {
"visualizationType": "hbar",
"options": {}
}
},
"StaticGroupingNames": {
"datasets": [],
"dimensions": [],
"isFacet": true,
"isGlobal": false,
"selectMode": "single",
"start": {
"display": [
"Country"
]
},
"type": "staticflex",
"useGlobal": true,
"values": [
{
"display": "Country",
"value": "Account.BillingCountry"
},
{
"display": "Industry",
"value": "Account.Industry"
},
{
"display": "Product",
"value": "Product.Product.Family"
},
{
"display": "Source",
"value": "Account.AccountSource"
}
],
"visualizationParameters": {
"options": {}
}
},
"StaticFilters": {
"datasets": [],
"dimensions": [],
"isFacet": true,
"isGlobal": false,
"selectMode": "single",
"start": {
"display": "Ads Only"
25Interactions in Tableau CRM Dashboards Use Cases
},
"type": "staticflex",
"useGlobal": true,
"values": [
{
"display": "Ads Only",
"value": [
"LeadSource",
[
"Advertisement"
],
"in"
]
},
{
"display": "Partners Only",
"value": [
"Account.Type",
[
"Partner"
],
"in"
]
},
{
"display": "$1M+ Only",
"value": [
"Amount",
[
[
1000000,
11921896
]
],
">=Interactions in Tableau CRM Dashboards Use Cases
{
"display": "Ascending",
"value": [
-1,
{
"ascending": true
}
]
},
{
"display": "Descending",
"value": [
-1,
{
"ascending": false
}
]
}
],
"visualizationParameters": {
"options": {}
}
},
"StaticLimits": {
"datasets": [],
"dimensions": [],
"isFacet": true,
"isGlobal": false,
"selectMode": "single",
"start": {
"display": [
"5"
]
},
"type": "staticflex",
"useGlobal": true,
"values": [
{
"display": "5",
"value": 5
},
{
"display": "10",
"value": 10
},
{
"display": "25",
"value": 25
}
],
"visualizationParameters": {
"options": {}
}
},
27Interactions in Tableau CRM Dashboards Use Cases
"StaticMeasureNames": {
"datasets": [],
"dimensions": [],
"isFacet": true,
"isGlobal": false,
"selectMode": "singlerequired",
"start": {
"display": [
"Total Amount"
]
},
"type": "staticflex",
"useGlobal": true,
"values": [
{
"display": "Max Employees",
"value": [
"max",
"Account.NumberOfEmployees"
]
},
{
"display": "Total Amount",
"value": [
"sum",
"Amount"
]
},
{
"display": "Avg Amount",
"value": [
"avg",
"Amount"
]
}
],
"visualizationParameters": {
"options": {}
}
},
"Account_AccountSourc_1": {
"datasets": [
{
"id": "0FbB00000000oEkKAI",
"label": "Opportunities",
"name": "opportunity",
"url": "/services/data/v38.0/wave/datasets/0FbB00000000oEkKAI"
}
],
"isFacet": true,
"isGlobal": false,
"query": {
"measures": [
[
28Interactions in Tableau CRM Dashboards Use Cases
"count",
"*"
]
],
"groups": [
"Account.AccountSource"
],
"order": [
[
-1,
{
"ascending": false
}
]
]
},
"type": "aggregateflex",
"useGlobal": true,
"visualizationParameters": {
"visualizationType": "hbar",
"options": {}
}
}
},
"widgetStyle": {
"backgroundColor": "#FFFFFF",
"borderColor": "#E6ECF2",
"borderEdges": [],
"borderRadius": 0,
"borderWidth": 1
}
Note: If you bind a measure or grouping in a query used for a chart created during or after Spring ’18, you must also replace the
columnMap section in the widget-level chart JSON with an empty columns array. For more information, see Measure
Interactions and Group Interactions.
Measure Interactions
Bind the measure to allow the dashboard viewer to select which measures to show in a widget. For example, you can show different
measures in a chart based on the selection in a toggle widget.
Filter Interactions
You can create different types of filters in a SAQL query. The following sections walk you through some example filters that use
different types of interactions.
Projection Interactions
Use the asProjection() serialization function to specify the projection of a field in a SAQL query.
Group Interactions
Bind the grouping to allow the dashboard viewer to select which dimensions to group the results by. For example, you can show
different groupings in a chart based on the selection in a toggle widget.
Order Interactions
Use the asOrder() serialization function to specify the sort order in a SAQL query.
29Interactions in Tableau CRM Dashboards Use Cases
Limit and Offset Interactions
You can also bind the limit and offset of a SAQL query. These interactions don’t require data serialization functions.
Measure and Group Bindings in Compact-Form and SAQL-Form Queries
Bindings can be used both in compact-form queries and SAQL-form queries.
Measure Interactions
Bind the measure to allow the dashboard viewer to select which measures to show in a widget. For example, you can show different
measures in a chart based on the selection in a toggle widget.
To dynamically set the measure in a query based on a selection, complete the following tasks.
• Bind the measures property of the query.
• If the query is used for a chart created during or after Spring ’18, replace the columnMap section of the widget with an empty
columns array. Why? Because when you change the query, the set of fields will likely be different from what’s in the columnMap
section. When you replace the columnMap property with an empty columns array, the system remaps the columns based on
the new query definition.
Let’s look at an example where we bind the measure for a donut chart based on the selection in the toggle widget.
The toggle widget uses the following custom query.
"MeasuresController_1": {
"type": "staticflex",
"label": "MeasuresController",
"values": [
{
"display": "Total Amount",
"step_property": [ "sum", "Amount" ]
},
{
"display": "Average Amount",
"step_property": [ "avg", "Amount" ]
},
{
"display": "Count of Rows",
"step_property": [ "count", "*" ]
}
],
30Interactions in Tableau CRM Dashboards Use Cases
"selectMode": "singlerequired",
"start": {
"display": [ "Total Amount" ]
},
"broadcastFacet": true,
"groups": [],
"numbers": [],
"strings": []
}
Each toggle option has one display label (display) that appears in the toggle. It also has one value (step_property) that
determines the measure.
Let’s bind the step_property field of the custom query (MeasuresController_1) to the measure in the donut chart’s step
(PieByProduct_2). Any selection in the custom query passes the aggregation method (like sum or count) and the measure field
to the PieByProduct_2 query.
"PieByProduct_2": {
"label": "PieByProduct_2",
"query": {
"measures": [
"{{ cell(MeasuresController_1.selection, 0, \"step_property\").asObject() }}"
],
"groups": [ "Product" ]
},
"visualizationParameters": {
...
},
"receiveFacet": true,
"selectMode": "single",
"type": "aggregateflex",
"isGlobal": false,
"useGlobal": true,
"broadcastFacet": true,
"datasets": [
{
"id": "0FbB00000000q5gKAA",
"label": "Flexy Sales",
"name": "Flexy_Sales",
"url": "/services/data/v42.0/wave/datasets/0FbB00000000q5gKAA"
}
]
}
When you create the donut chart, by default, the widget (chart_2) contains the columnMap section that maps measures and
groupings to chart attributes.
"chart_2": {
"type": "chart",
"parameters": {
"visualizationType": "pie",
"step": "PieByProduct_2",
31Interactions in Tableau CRM Dashboards Use Cases
"columnMap": {
"trellis": [],
"dimension": [ "Product" ],
"plots": [ "sum_Amount" ]
},
...
}
}
}
Note: The properties under the columnMap property vary based on the chart type.
To enable the interaction to work, replace the columnMap section with an empty columns array because interactions cannot be
used to specify columnMap.
"chart_2": {
"type": "chart",
"parameters": {
"visualizationType": "pie",
"step": "PieByProduct_2",
"columns" : [],
...
}
}
}
Filter Interactions
You can create different types of filters in a SAQL query. The following sections walk you through some example filters that use different
types of interactions.
Filters
You can bind filters based on certain conditions. Tableau CRM supports multiple operators that provide flexibility when defining the
conditions.
Range Filters
Use the asRange() serialization function to bind filters based on numeric ranges.
Date Range Filters
Use the asDateRange() serialization function to bind filters based on date ranges. You can create filters using absolute or
relative date ranges.
Filters
You can bind filters based on certain conditions. Tableau CRM supports multiple operators that provide flexibility when defining the
conditions.
32Interactions in Tableau CRM Dashboards Use Cases
Filter Example (SAQL Form)
Let's say you have the following results from the source query.
[
{grouping: "first", measure: 19}
{grouping: "second", measure: 32}
]
You can bind a filter using the asEquality() interaction function. The following filter condition determines whether the returned
value equals “bar.”
q = filter q by {{cell(stepFoo.selection, 1, "measure").asEquality("bar")}};
After evaluating the interaction based on the data returned from the source query, Tableau CRM produces the following filter.
q = filter q by bar == 32;
Note: If a selection returns multiple values, asEquality() inserts the 'in' operator, instead of ==, in the filter statement. For
example, the following filter condition determines if any value in the “grouping” column equals “bar.”
q = filter q by {{column(stepFoo.selection, ["grouping"]).asEquality("bar")}};
If the selection returns first and second, the filter becomes:
q = filter q by bar in ["first","second"];
Filter Example with the 'in' Operator (Compact Form)
Let’s say you want to filter the Case by Status widget in the following dashboard based on the account selected in the Account list
widget.
33Interactions in Tableau CRM Dashboards Use Cases
Faceting doesn’t work in this case because the queries on these widgets are based on different datasets. To enable filtering, create an
interaction in the Cases by Status widget’s query (Status_1) based on the selection in the Account widget’s query
(AccountId_Name_1). This interaction compares the value of the AccountId.Name field in the Status_1 query to the
selected values in the AccountId.Name field of the AccountId_Name_1 query. Because there can be multiple selected account
names, we’ll use the 'in' operator.
"steps": {
"Status_1": {
"datasets": [{
"id": "0FbB00000000rlDKAQ",
"label": "CasesAccounts",
"name": "CasesAccounts",
"url": "/services/data/v38.0/wave/datasets/0FbB00000000rlDKAQ"
}],
"isFacet": true,
"isGlobal": false,
"query": {
"measures": [
[
"count",
"*"
]
],
"groups": [
"Status"
],
"filters": [
[
"AccountId.Name",
"{{column(AccountId_Name_1.selection, [\"AccountId.Name\"]).asObject()}}",
"in"
]
]
},
"type": "aggregateflex",
"useGlobal": true,
"visualizationParameters": {
"visualizationType": "hbar",
"options": {}
}
},
"AccountId_Name_1": {
"datasets": [{
"id": "0FbB00000000rlIKAQ",
"label": "OpptiesAccountsSICsUsers",
"name": "OpptiesAccountsSICsUsers",
"url": "/services/data/v38.0/wave/datasets/0FbB00000000rlIKAQ"
}],
"isFacet": true,
"isGlobal": false,
"query": {
"measures": [
[
"count",
34Interactions in Tableau CRM Dashboards Use Cases
"*"
]
],
"groups": [
"AccountId.Name"
]
},
"selectMode": "single",
"type": "aggregateflex",
"useGlobal": false,
"visualizationParameters": {
"options": {}
}
}
...
Filter Example with an Inequality Operator (SAQL Form)
Let's say you have the following results from a source query.
[ {grouping: "first", measure: 19} {grouping: "second", measure: 32} ]
You can create a filter interaction using on an inequality operator.
q = filter q by bar > {{cell(queryFoo.selection, 1, "measure").asString()}};
After evaluating the interaction, the filter becomes:
q = filter q by bar > 32;
Filter Example with the 'matches' Operator (SAQL Form)
Let's say you have the following results from a source query.
[ {grouping: "first", measure: 19} {grouping: "second", measure: 32} ]
You can create a filter interaction using on the matches operator.
q = filter q by bar matches "{{cell(queryFoo.selection, 1, "grouping").asString()}}";
After evaluating the interaction, the filter results to this.
q = filter q by bar matches "second";
Range Filters
Use the asRange() serialization function to bind filters based on numeric ranges.
Let’s look at some examples with inclusive ranges.
The source query for an interaction produces the following results.
[ {grouping: "first", measure: 19} {grouping: "second", measure: 32} ]
You can bind the filter using the following syntax.
q = filter q by {{row(stepFoo.selection, [0], ["min", "max"]).asRange("bar")}};
35You can also read