Tackling pandemics in smart cities using machine learning architecture
←
→
Page content transcription
If your browser does not render page correctly, please read the page content below
MBE, 18(6): 8444–8461.
                                                                             DOI: 10.3934/mbe.2021418
                                                                             Received: 06 July 2021
                                                                             Accepted: 12 August 2021
    http://www.aimspress.com/journal/MBE                                     Published: 27 September 2021

Research article
Tackling pandemics in smart cities using machine learning architecture

Desire Ngabo1,2,∗ , Wang Dong1 , Ebuka Ibeke3 , Celestine Iwendi4,5 and Emmanuel Masabo2,6
1
     College of Computer Science and Electronic Engineering, Hunan University, Changsha 410000,
     China
2
     African Center of Excellence in the Internet of Things, University of Rwanda, Kigali 3900, Rwanda
3
     School of Creative and Cultural Business, Robert Gordon University, Aberdeen, Scotland, UK
4
     School of Creative Technologies, University of Bolton, Bolton BL3 5AB, UK
5
     Department of Mathematics and Computer Science, Coal City University Enugu, Enugu 400231,
     Nigeria
6
     African Center of Excellence in Data Science (ACE-DS), College of Business and Economics,
     University of Rwanda, Kigali 4285, Rwanda

* Correspondence: Email: dngabo@hnu.edu.cn.

Abstract: With the recent advancement in analytic techniques and the increasing generation of
healthcare data, artificial intelligence (AI) is reinventing the healthcare system for tackling pandemics
securely in smart cities. AI tools continue register numerous successes in major disease areas such
as cancer, neurology and now in new coronavirus SARS-CoV-2 (COVID-19) detection. COVID-19
patients often experience several symptoms which include breathlessness, fever, cough, nausea, sore
throat, blocked nose, runny nose, headache, muscle aches, and joint pains. This paper proposes an
artificial intelligence (AI) algorithm that predicts the rate of likely survivals of COVID-19 suspected
patients based on good immune system, exercises and age quantiles securely. Four algorithms (Nave
Bayes, Logistic Regression, Decision Tree and k-Nearest Neighbours (kNN)) were compared. We
performed True Positive (TP) rate and False Positive (FP) rate analysis on both positive and negative
covid patients data. The experimental results show that kNN, and Decision Tree both obtained a score
of 99.30% while Nave Bayes and Logistic Regression obtained 91.70% and 99.20%, respectively on
TP rate for negative patients. For positive covid patients, Nave Bayes outperformed other models with
a score of 10.90%. On the other hand, Nave Bayes obtained a score of 89.10% for FP rate for negative
patients while Logistic Regression, kNN, and Decision Tree obtained scores of 93.90%, 93.90%, and
94.50%, respectively.

Keywords: pandemics; smart cities; artificial intelligence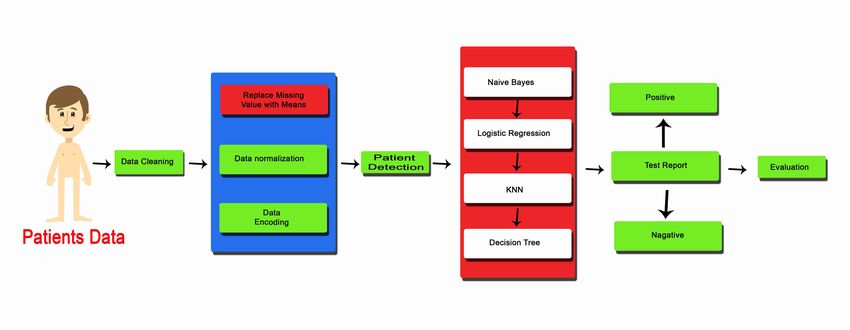
8445

1. Introduction

    The term “pandemic” has recently become a household term, although it has been a known term for
centuries. This term until the mid-19th century was used interchangeably with “epidemic” in medical
dictionaries [1]. In the manual of General Pathology, Wagner [2] makes a distinction between epidemic
and pandemic. He stated that an epidemic exists only within a community, whereas, a pandemic
spreads over the whole land. The World Health Organization (WHO) further defines a pandemic as a
global spread of a new disease. The past century recorded 3 pandemics; Spanish Flu in 1918, Asian Flu
in 1957, and Hong Kong Flu in 1968. The Spanish Flu was particularly destructive [3]. Pandemics kill
millions of people globally due to their high attack rates and rapid spreads [4, 5]. In December 2019,
Coronavirus (COVID-19) was reported in Wuhan, Hubei province of China, and declared a pandemic
by the World Health Organization on the 11th of March 2020. This virus whose early cases were
transmitted to humans from bats has now become a global health and socio-economic threat [6, 7], and
left our cities empty and silent.
    Globally, cities have and continue to witness rapid urbanization. In 2018, the United Nations noted
that 55% of the worlds population live in urban areas. This proportion is projected to increase to 68%
by 2050 due to urbanization and population growth [8]. According to the World Bank, over 80% of the
global GDP is generated in the cities. When properly managed, urbanization can lead to the emergence
of new ideas, innovation and increased productivity [9]. However, rapid urbanization comes with
several challenges. One of the challenges is the vulnerability of cities to large-scale outbreaks; global
cities bear the burden of pandemics and at the same time are in the frontline in combating pandemics.
    The advent of smart cities offers increased quality of life through cleaner environments, more
efficient infrastructures, as well as through public and commercial services [10]. Smart cities use
sensors to gather and process information. As COVID-19 continues its waves, researchers,
governments, and local authorities employ sensor data to trace both infected people and those who
have been in contact with them, predict human behaviour, monitor social distancing and provide
real-time information on the outbreak [11]. Smart cities host an array of smart technologies (such as
big data, fibre optic networks, Internet of Things (IoT), open data and analytics) which, among other
aspects, assist in the early detection and management of outbreaks [11, 12]. These technologies when
integrated with Artificial Intelligence (AI) offer additional benefits.
    AI aims to mimic human intelligence. Earlier, AI algorithms solved master checker, mathematical
as well as geometric problems, but are increasingly getting more sophisticated at performing human
cognitive activities [13]. With the advancement in analytical techniques and increasing generation of
healthcare data, AI is reinventing the healthcare system. AI tools have registered numerous successes
in major disease areas such as cancer and neurology [14], and can help combat pandemics. Pathogens
are bacteria, viruses, fungi and other microorganisms that cause diseases and potentially lead to a
pandemic. AI can be used to detect and trace the spread of these pathogens, identify infected patients,
and pilot the control of the infection. This research, therefore, proposes a method for tackling
pandemics using Artificial Intelligence. The contribution of this paper includes:
1) Detailed overview of pandemic in smart city and AI revolution.
2) Machine learning/AI solution for predicting the rise and rate of infection.
3) Data normalization was performed on a given dataset, in order to bring down the values to one scale

Mathematical Biosciences and Engineering                                    Volume 18, Issue 6, 8444–8461.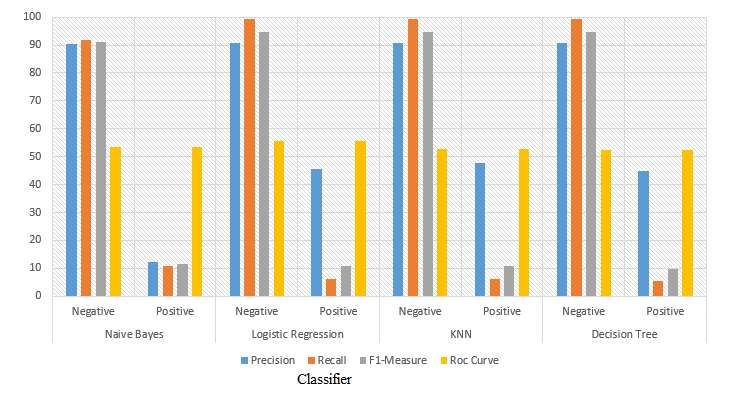
8446
and region.
4) Predicting the rate of likely survivals based on good immune system, exercises and age quantiles.
5) Several performance metrics were employed to evaluate the proposed solution, including checking
for the precision, recall, F1-Measure, False Alarm Rate (FAR), Detection Rate (DR) and Accuracy.
While the above stipulated performance metrics were based on True Positive (TP), True Negative
(TN), False Positive (FP), and False Negative (FN).
6) Longevity risk and survival rate of patients of COVID-19 have been studied and performed using
nave Bayes, kNN, logistic regression and decision tree.
The rest of the paper is organized as follows. Section 2 gives the general review of Artificial
Intelligence, Section 3 gives the application of Artificial Intelligence during a disease pandemic,
Section 4 describes the methodology applied in this research, Section 5 gives the artificial intelligence
results and Section 6 gives the conclusion drawn from the work.
2. Related work
2.1. Overview of artificial intelligence
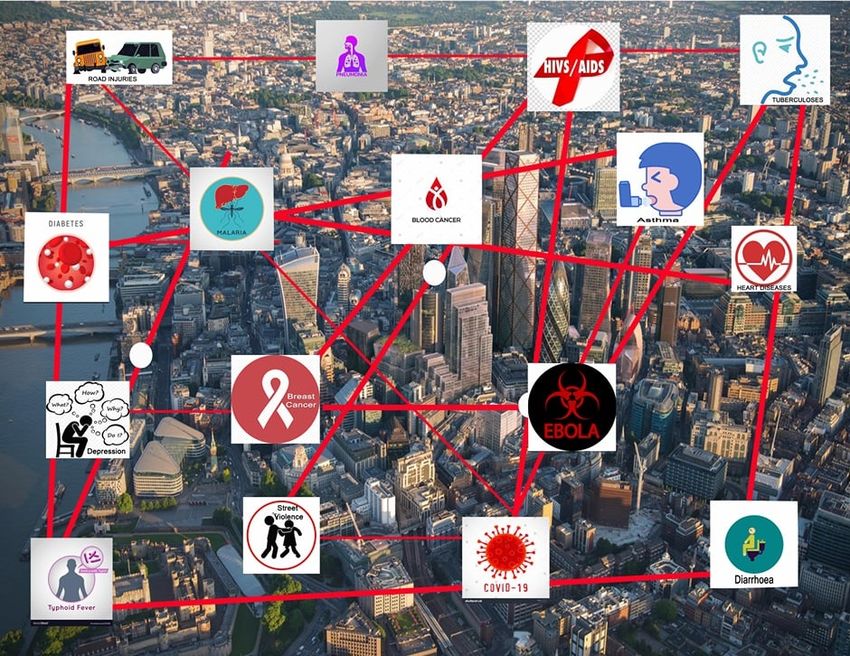
During the late 1700s and early 1800s, the world went through major industrialization and
innovation; an industrial revolution ravaged by pandemic in smart cities (see Figure 1). This
revolution impacted the world in many ways—it influenced our way of life and impacted the way
businesses operate, it is also responsible for the modern global cities. The first industrial revolution,
known as Industry 1.0 was marked by the invention of the steam engine. The steam engine enhanced
production by reducing manufacturing time. The second industrial revolution, Industry 2.0, was
marked by the invention of electrical-energy based productions and communication channels in the
late 19th century. In the late 20th century, the third industrial revolution or Industry 3.0 heralded the
first information and digital revolution. This period signifies the use of automation, internet-based
knowledge, and human-computer interaction. Then comes the fourth industrial revolution, Industry
4.0, in the early 21st century. This period saw the fusion of products and services through the internet
and other network services. Industry 4.0 has transformed daily human activities with the integration
of modern technologies including Artificial Intelligence (AI), Internet of Things (IoT), Industrial
Internet of Things (IIoT), wireless technologies, cloud computing, big data, among others.
In the current revolutionary era, AI plays a significant part in the automation of global
connectivity. With the rise and progress in AI-driven research, intelligent machines are gaining the
ability to perform activities that previously relied on human intelligence, creativity, and experience. In
2017, the United Nations (UN) organized a summit aimed at the development of AI solutions towards
the 17 UNs Sustainable Development Goals (SDGs). These goals include health, environment and
education. The summit offered a platform for stakeholders to discuss issues related to AI, offer
recommendations, promote international dialogue and support AI innovation [15]. For the healthcare
sector, data generation has continued rapid and exponential growth. Most of these data are obtained
from surveillance systems, thanks to AI. The surveillance systems enable fast detection and spread of
infectious disease. National and regional disease centres such as the European Influenza Surveillance
Scheme (EISS) and the US Center for Disease Control and Prevention (CDC) record and publish
Mathematical Biosciences and Engineering Volume 18, Issue 6, 8444–8461.
8447

                   Figure 1. Industrial revolution ravaged by pandemic in smart city.

these data. Other sources of healthcare data include outbreak investigation reports, social media such
as Twitter [16, 17], and vaccine reports [18].
   The dramatic increase in both the sources and amount of public healthcare data generation comes
with the challenge for effective data integration and management. The authors in [19] illustrated an
integrated disease alertness and response approach that utilizes shared data repository and AI methods.
McCall in [20] analysed AIs readiness to deliver an effective and timely solution to curb COVID-19
pandemic. AI is categorized into Artificial Narrow Intelligence (ANI), Artificial General Intelligence
(AGI), and Artificial Human Intelligence (AHI). ANI refers to AIs ability to effectively perform a
single task, AGI refers to AIs ability to mimic human behaviour, while AHI refers to AIs ability to
perform activities more capable than human experts [21]. ANI is the only type of AI that has been
successfully achieved.

2.2. Major subfields of artificial intelligence
   AI has numerous subfields. In the health-related context, these AI methods have been applied to
control the spread of tuberculosis and gonorrhoea, track down rodent reservoir of zoonotic diseases
[22], detect [23] or predict [24] diabetic retinopathy or to analyse diagnostic images [25]. It has been
applied to monitor the socio-technological factor affecting the adoption of eHealth functionalities
[26]. In other contexts, AI has been applied to watermarking algorithm and cyber detection [27],
enabled road vehicle-train frameworks [28], and used for improving intrusion detection systems [29].
Following, we present summaries of the key subfields of AI.

Mathematical Biosciences and Engineering                                    Volume 18, Issue 6, 8444–8461.
8448
Machine Learning (ML): This is the subfield of Artificial Intelligence that enables computers to
self-learn from experience and available information and apply this learning without human
involvement. ML algorithms can automatically learn and improve their performance; they facilitate
the discovery of patterns in data. ML can be split into three sub-categories:
- Supervised Learning: learns patterns from training data and predict the outcomes. Algorithms in
this category include classification and regression.
- Reinforcement Learning: extends supervised learning by awarding positive or negative rewards
when an application performs a right or wrong action, respectively.
- Unsupervised Learning: learns without training or supervision; algorithms learn from patterns of
data without output values. Algorithms in this category include clustering and association.
Deep Learning (DL): DL is also known as Deep Neural Network or Deep Neural Learning. It is
implemented via a neural network architecture. DL is a subset of ML that enables AI agents to mimic
the human brain. It requires a vast amount of data and computational power. DL is the main technology
behind several technological developments [30] such as image and speech recognition, self-driving
cars, and automatic machine translation. It has a vast application to healthcare systems. DL has been
applied to screen COVID-19 pneumonia [31, 32] and detect COVID-19 in X-ray images [33].
Natural Language Processing (NLP): NLP is a branch of AI that bridges the language gap by
enabling machines to understand human languages. NLP algorithms can work out human
instructions, identify keywords and phrases from unstructured texts or speech. Some examples of
NLP enabled technologies includes Google, Siri or Cortana.
Expert Systems (ES): ES are rule-based systems that rely on knowledge of human experts to solve
problems; their decision-making ability is dependent on human experts. ES are capable of using
incomplete and uncertain information to solve complex problems. Characteristics of ES include
reliability, understandable, high performance and highly responsive. The evolution of ES has seen the
emergence of fuzzy logic; a mathematical principle introduced in 1965 for representing vagueness
and imprecise information. Fuzzy logic was utilized in the prediction of cholera outbreak by South
African researchers [34].
Image Recognition (IR): IR enables software to analyse images in other to identify objects, people,
places, writings and other targeted subjects. Top techniques in IR involve the use of the convolutional
neural network (CNN) to filter images. Image recognition has been applied in healthcare systems.
The authors in [35] proposed a system to identify arbovirus outbreaks. Arbovirus refers to viruses
transmitted by arthropod vectors. The proposed system identifies images of mosquito larvae. The
rationale behind this is that the recognition of specimen in images enables researchers to generate
visualizations of geographical locations susceptible to the outbreak of the arbovirus. They reported a
high accuracy in the identification of mosquito larvae.
3. Application of artificial intelligence during disease pandemic
Pandemics require a quick and efficient response, therefore, emergency response systems need to
get smarter relative to smart cities. The following sub-sections discuss the application of AI in the
detection and control of a pandemic.
Mathematical Biosciences and Engineering Volume 18, Issue 6, 8444–8461.8449 3.1. Early detection and alerts On the 8th of December 2019, the first batch of six COVID-19 patients was reported in Wuhan, Hubei province of China. The World Health Organization (WHO) officially issued a warning of the outbreak on the 9th of January 2020. The outbreak was declared a pandemic on the 11th of March 2020 after over 118,000 cases had been recorded in 114 countries. Before the warning by WHO, a Toronto-based company BlueDot which consists of data scientists, software developers, epidemiologists, physicians and veterinarians [1] predicted the spread of the virus on the 31st of December 2019 and warned its clients [36]. The AI technology employed by BlueDot also predicted the spread of the virus to other Chinese cities. It correctly predicted the outbreak of Zika virus six months before the outbreak of the virus in Florida [37]. Besides BlueDot, other AI-based models predicted the outbreak of COVID-19. HealthMap, at Boston Childrens Hospital, and Metabiota based in San Francisco also identified the early signs of COVID-19 [38]. HealthMap sounded an alarm on the 30th of December 2019, a day earlier than BlueDot. These alerts suggest that Smart Cities through AI and big data technologies play an important role in the detection and control of pandemics [39]. However, AI technologies still require humans to provide context and interpret the predicted threat. In a podcast [40], Kamran Khan, the founder of BlueDot noted that the BlueDot prediction required humans to evaluate and interpret its output. The author in [41] stressed that human input is required across disciplines for the optimal application and performance of AI models. 3.2. Tracking diseases/disease surveillance Scientists and city officials can utilize disease-tracking or -surveillance AI-based applications to track the spread of viruses in real-time. AI technologies are used to extract and gather a large amount of data from countless different sources. When it comes to AI, there is nothing like data overload; the more, the better. These data facilitate the prediction of disease outbreaks and track their spread, and thereby improve response time, significantly [16]. Many human activities have a direct or indirect effect on the global spread of viruses, and the consequences may be difficult to assess [42]. Most of the anthropogenic drivers are city-desired activities, such as migration and trade. Swift collection and analysis of data from these activities enable the identification and tracking of the spread of viruses. In the case of COVID-19, a few companies leverage AI models to identify, track and report the spread of the virus a week before the WHO and the US Centre for Disease Control and Prevention officially issued a warning. 3.3. Internet capabilities The internet has completely changed the way we communicate and disseminate information. This has transformed many communication channels such as Television and given rise to several social media platforms such as Twitter and Facebook, where people get news and updates in seconds; we now live in a digital world. Most smart cities offer free Wi-Fi access in public areas, some have smart kiosks to assist the elderly or people who cannot purchase smart devices. With internet connectivity, information can easily circulate and actions quickly taken; for instance, the stay at home order. Smart cities have certainly learned some lessons from the COVID-19 outbreak, which it will use to prepare and plan for future pandemics. The connected world will enable information sharing and its Mathematical Biosciences and Engineering Volume 18, Issue 6, 8444–8461.
8450

accessibility between scientists, researchers, governments, and indeed, smart cities.

3.4. Thermal surveillance
    Thermal surveillance involves the use of thermal camera-equipped devices to monitor the
movements of people and measure body temperatures. Fever is one of the most common symptoms of
COVID-19. As a result of this, countries like China use drones equipped with thermal cameras, and
thermal cameras installed in public buses and street corner to assess individuals temperatures. Other
thermal camera-equipped portable devices are also used by health workers and public officers to
monitor peoples temperature. The World Health Organization in its travelling guidance advised that
temperature screening alone may be inefficient in detecting COVID-19 patients, as this might miss
asymptomatic travellers [43]. Smart cities can adopt thermal cameras to help in monitoring the spread
of the virus in addition to other measures.

3.5. Robot delivery
    Many countries have adopted stay-at-home and social distancing as defence strategies against
COVID-19. This means that people who are out of their homes for work or other essential needs must
keep two metres apart, avoid crowded places and group gatherings. During a pandemic, essential
workers put their lives at risk in the service of others. This includes delivery personnel who transport
and deliver food and other products. Autonomous delivery robots would be very helpful in waning the
threat of the pandemic on delivery personnel and potentially reduce human-to-human transmission.
    Many smart cities already embraced autonomous delivery by using drones and autonomous trucks
to facilitate the delivery of goods and services in times of pandemic or other crisis. As a result, smart
cities can control and prioritize the delivery of essential items such as medicine.

4. Methodology

                                     Figure 2. Proposed methodology.

Mathematical Biosciences and Engineering                                    Volume 18, Issue 6, 8444–8461.
8451
4.1. Dataset
The dataset from [44] was considered. Many features of the data have empty cells. We were careful
to use features that have data of 5645 patients with patients age quantile. A quantile designates age
by a fraction of the population of survivors. The investigation of quantiles permits the researchers to
pay more attention to the irregularities documented at different age-ranges of the distribution, without
resorting to comparisons among central propensities, or among central propensities and inconsistency
measures. The proposed methodology is depicted in Figure 2.
The detail of the dataset shows the SARS-Cov-2 examination result for each patient admitted to
regular ward (1 = yes 0 = no), patient admitted to the semi-intensive unit (1 = yes 0 = no) and patient
admitted to intensive care unit (1 = yes 0 = no). Further details show that, 11 features were considered
with data for patients admitted to regular ward, semi-intensive ward, intensive care units, these are:
Hematocrit, Basophils, Eosinophils, Platelets, Mean platelet volume, Hemoglobin, Mean corpuscular
hemoglobin concentration (MCHC), Leukocytes, Lymphocytes, Mean corpuscular hemoglobin (MCH)
and Red blood Cells. Therefore, the model that we have proposed is actually based on the quantiles
of the distribution of this life table survivorship function. The analysis addressed in this research is
particularly significant for studying longevity risk and survival rate of patients. Using this dataset, we
have considered four algorithms to determine which is better for this predication [44].
4.2. Data cleaning
4.2.1. Replacing missing values
After the collection of patient data, data cleaning methods were used to clean the dataset and remove
noise in the dataset. The dataset has a lot of missing values which affected the predictive performance
of the model. For this purpose, we replaced missing values with the mean of that feature’s data.
4.2.2. Data normalization
After replacing missing values, then data normalization was performed on the dataset in order to
bring down the values to one scale. Normalization allows a dataset to be scaled in one range. The
features of the dataset are scaled differently; some have single-digit values, others two-digit values,
and some others three-digit values. Therefore, normalization is vital as it enhances the performance
of machine learning models. In this research, we utilized the min-max normalization. This type of
normalization scales the values into a (0, 1) range. We represent the mathematical form of min-max
normalization in Eq (4.1).
Ai − Min(A)
Zi = (4.1)
Max(A) − Min(A)
where y = A1 , A2 , . . . , An . Ai is the attribute that we want to normalize, n is the number of attributes,
and Zi represents the normalized attribute. After normalization, all attributes have the same scope and
weights.
4.2.3. Data encoding
In this research, prior to data encoding, non-numeric data were converted to numeric data. Backend
calculations of the ML algorithms were also carried out on numeric values, not on nominal values.
Mathematical Biosciences and Engineering Volume 18, Issue 6, 8444–8461.8452
4.3. Machine learning classifiers
4.3.1. Nave Bayes
Nave Bayes is a set of algorithms exchanging a mutual rule, in which all function pairs are separate.
In the algorithm, two assumptions are considered: each function is individual, and the texts will be
converted into numerical values in the instance with document attributes. According to Bayes theorem,
X P( X )P(X)
P( ) = Y (4.2)
Y P(Y)
where, X and Y are events. P(X) = prior probability (events probability before evidence), P(X/Y) = Y’s
posterior probability (events probability after evidence). Implementing Bayes theorem now shown in
Eq (4.3).
b P( Ab )P(b)
P( ) = (4.3)
A P(A)
where A = dependent feature vector and b = class variable.
A is of size n such that A = (A1, A2, A3..., An). To split evidence into independent segments for
events X and Y; P(X, Y) = P(X)P(Y) and now results in Eq (4.4).
b P(b)Πni=1 P( Ab1 )P( Ab2 )P( Ab3 ) . . . P( Abn )
P( )= (4.4)
A1 , A2 , . . . , An P(A1 )P(A2 )P(A3 ) . . . P(An )
The equation can be further written as in Eq (4.5).
b P(b)Πni=1 P( Abi )
P( )= (4.5)
A1 , A2 , . . . , An P(A1 )P(A2 )P(A3 ) . . . P(An )
The denominator is constant for input, so we produce Eq (4.6).
b Ai
P( ) = ∞P(b)Πni=1 P( ) (4.6)
A1 , A2 , . . . , An b
In order to generate a model classifier, we must decide the feedback probabilities for y and take the
output that has the highest probability. Hence, we get Eq (4.7).
Ai
b = argmax P(b)Πni=1 P( ) (4.7)
b
Finally, we calculate P( Abi ) and P(b).
4.3.2. Logistic regression
In machine learning, Logistic Regression is a classification algorithm that models a binary class
but can be extended to several classes. In general, a dichotomous result with Logistic Regression
is obtained. The purpose of the algorithm is to try a connection between the probability of specific
results and the characteristics. In Logistic Regression, a logit function or the log odds function is used.
Logistic Regression mathematical form is given in Eq (4.8).
Mathematical Biosciences and Engineering Volume 18, Issue 6, 8444–8461.8453
P(A)
log( ) = a0 + a1 A (4.8)
1 − P(A)
P(A) P(A)
In Eq (4.8), logit function is log( 1−P(A) ) and odd function is 1−P(A) . The odds reflect the probability
ratio of inclusion of the feature to the possibility of failure or absence of a feature. The output is
usually one in this algorithm after mapping inputs to log-odds in a linear combination. Now, if we find
the opposite of the previously mentioned function, we produce Eq (4.9).
ea0 +a1
P(A) = (4.9)
1 + ea0 +a1
Equation (4.9) is known as a sigmoid function, and it creates a curve like S-shaped. The probability
value is generated within the scope of 0 < P < 1. Therefore, we picked the parameters in the logarithm
in a way to maximize the possibilities of observing sample values.
4.3.3. k Nearest Neighbour (kNN)
k-Nearest Neighbour Classifier (KNN) uses measures of similarity to predict new data points. The
reason this research uses the kNN algorithm is that it depends on similarity of the features. The
selection of the correct value of k is significant for achieving optimum results. k’s value is the number
of nearest neighbours that are considered in a vector classification.
v
t n
X
Euclidean equation = (Xi − Yi )2 (4.10)
i=1
n
X
Manhattan equation = |Xi − Yi | (4.11)
i=1
n
X 1
Minkowski = ( (|Xi − Yi |)q ) q (4.12)
i=1
4.3.4. Decision tree
Decision Tree (DT) is one of the popular algorithm used in classification problems, which is
equivalent to any tree structure composed of roots, nodes, leaves etc. Usually a feature and threshold
is applied to a node, and the data is split down the tree. One DT approach is ID3 algorithm that uses
entropy to calculate details. The Entropy equations are given in Eq (4.13).
n
X 1
Entropy : E (P1 , P2 , . . . , Pn ) = (pi log( )) (4.13)
i=1
pi
where (P1 , P2 , . . . , Pn ) represent the probabilities of the class labels. The information gain equation
is given in Eq (4.14).
s
X
Gain (D, S ) = H(D) P(Di )H(Di ) (4.14)
i=1
Mathematical Biosciences and Engineering Volume 18, Issue 6, 8444–8461.8454
5. AI results and discussion
Various performance metrics are used to evaluate the proposed solution, including precision,
recall, F1-Measure, False Alarm Rate (FAR), Detection Rate (DR) and Accuracy. Above mention
performance metrics base on True Positive (TP), True Negative (TN), False Positive (FP), and False
Negative (FN).
Accuracy is a measure of correctly classified instances, in this case, normal and attacks classes. This
measure is a summation of the correctly classified instances, divided by the total number of instances.
This is represented in Eq (5.1).
T p + Tn
Accuracy = (5.1)
T p + F p + Fn + T n
Tp
Precision = (5.2)
Tp + Fp
Tp
Recall = (5.3)
T p + Fn
Precision*Recall
F1 Measure = 2 ∗ (5.4)
Precision + Recall
From Figure 3, we can see that KNN and Decision Tree both obtained a score of 99.30% on TP
rate for negative patients, while Nave Bayes and Logistic Regression obtained 91.70% and 99.20%,
respectively.
Figure 3. TP Rate for negative patients.
Mathematical Biosciences and Engineering Volume 18, Issue 6, 8444–8461.8455
Figure 4. TP Rate for positive patients.
Figure 4 the result of TP rate for positive patients. Here, Nave Bayes obtained a score of 10.90%
and outperformed the other models. Logistic Regression, KNN and Decision Tree obtained 6.10%,
6.10%, 5.50%, respectively.
Figure 5. Classification report for all patients.
Nave Bayes classifier negative class achieved 90.50% precision, 91.70% recall, 91.10%
F1-Measure. For positive class, precision, recall and F1-Measure scores are 12.40%, 10.90%, and
11.60% respectively. Precision score for Logistic Regression, kNN and Decision Tree algorithm is
90.70% respectively for negative class and for positive class precision score for these algorithms is
Mathematical Biosciences and Engineering Volume 18, Issue 6, 8444–8461.8456
45.50%, 47.60% and 45.00%, respectively. Recall and F1-Measure for Logistic Regression is 99.20%
and 94.80% respectively. Similarly, recall and F1-Measure for positive class is 6.10% and 10.70%
respectively. kNN and Decision Tree both achieved 99.30% recall score for negative class. For
positive class, recall scores are 6.10% and 5.50% respectively. kNN and Decision Tree both achieved
94.80% F1-Measure for negative class. For positive class F1-scores for kNN is 10.80% and using
Decision Tree it is 9.70%; these results are presented in Figure 5.
Figure 6 presents that Nave Bayes algorithm has 89.10% FP rate for negative patients. While
Logistic Regression, KNN and Decision Tree have 93.90%, 93.90%, 94.50%. Nave Bayes performed
better for negative patients prediction compared to the other classifiers.
Figure 6. FP Rate for negative patients.
From Figure 7 we can conclude that Nave Bayes has 8.30% FP rate for positive test. While Logistic
Regression, kNN and Decision Tree achieved 0.80%, 0.70%, 0.70%, respectively. kNN and Decision
Tree performed better for positive patients prediction compared to the other classifiers. The overall
summary of all the results mentioned and explained in this study is also combined in Table 1.
Table 1. Summary of all evaluation metrics.
Classifier Label TP Rate FP Rate Precision Recall F1-Measure Roc Curve
Negative 91.70 89.10 90.50 91.70 91.10 53.50
Nave Bayes
Positive 10.90 8.30 12.40 10.90 11.60 53.50
Negative 99.20 93.90 90.70 99.20 94.80 55.80
Logistic Regression
Positive 6.10 0.80 45.50 6.10 10.70 55.80
Negative 99.30 93.90 90.70 99.30 94.80 52.70
KNN
Positive 6.10 0.70 47.60 6.10 10.80 52.70
Negative 99.30 94.50 90.70 99.30 94.80 52.30
Decision Tree
Positive 5.50 0.70 45.00 5.50 9.70 52.30
Mathematical Biosciences and Engineering Volume 18, Issue 6, 8444–8461.8457
Figure 7. FP Rate for positive patients.
6. Conclusions
Application of Artificial Intelligence to smart city is very crucial to process the patient data for
efficient treatment strategies and checking for the survival rate. In this paper, we have presented a better
model than the one presented by [45] which only implemented the AdaBoost algorithm, with F1 Score
of 0.86 on another COVID-19 patient dataset. We have discovered that some datasets are imbalanced
and cannot be predicted. Meanwhile, 11 features were considered in this latest research with data
for patients who were admitted to regular ward, semi-intensive ward, intensive care units which are:
Hematocrit, Basophils, Eosinophils, Platelets, Mean platelet volume, Hemoglobin, Mean corpuscular
hemoglobin concentration (MCHC), Leukocytes, Lymphocytes, Mean corpuscular hemoglobin (MCH)
and Red blood Cells. Therefore, the model that we have proposed is actually based on the age quantiles
of the distribution of this life table survivorship function. The analysis addressed in this research is
significant for studying longevity risk and survival rate of patients. Several performance metrics
were employed to evaluate the proposed solution, including checking for the precision, recall, F1-
Measure, False Alarm Rate (FAR), Detection Rate (DR) and Accuracy. While the above stipulated
performance metrics were based on True Positive (TP), True Negative (TN), False Positive (FP), and
False Negative (FN). On the dataset usage, we have considered four algorithms to determine which is
better for this predication. The experimental results show that kNN, and Decision Tree both obtained a
score of 99.30% while Nave Bayes and Logistic Regression obtained 91.70% and 99.20%, respectively
on TP rate for negative patients. For positive covid patients, Nave Bayes outperformed other models
with a score of 10.90%. On the other hand, Nave Bayes obtained a score of 89.10% for FP rate
for negative patients while Logistic Regression, kNN, and Decision Tree obtained scores of 93.90%,
93.90%, and 94.50%, respectively. Whereas, kNN, and Decision Tree both obtained a score of 0.70%
outperforming Nave Bayes and Logistic Regression whose FP rate for positive patients are 8.30% and
0.80%, respectively. The future work will be implementing a deep neural smart city network with the
Mathematical Biosciences and Engineering Volume 18, Issue 6, 8444–8461.8458
combination of CXR scanning computer vision models to showcase the life survivorship demographic
and healthcare data with different processing models. This can provide an automation of the prediction
and diagnostic system to provide rapid screening and detection for COVID-19 affected and regions
patients and prepare us for future pandemic outbreaks.
Acknowledgments
This work was supported in part by the National Natural Science Foundation of China under Grant
61502162, Grant 61702175 and Grant 61772184, in part by the Fund of the State Key Laboratory of
Geoinformation Engineering under Grant SKLGIE2016-M-4-2, in part by the Hunan Natural Science
Foundation of China under Grant 2018JJ2059,in part by the Key R D Project of Hunan Province of
China under Grant 2018GK2014.
Conflict of interest
There is no conflict of interest.
References
1. AFB, How a canadian startup used ai to tack china virus, 2020. Available
from: https://www.thestar.com.my/tech/tech-news/2020/02/20/how-a-canadian-startup-used-ai-
totrack-china-virus.
2. E. Wagner, A manual of General Pathology: For the use of students and practitioners of Medicine,
W. Wood, 1877.
3. C. E. Mills, J. M. Robins, M. Lipsitch, Transmissibility of 1918 pandemic influenza, Nature, 432
(2004), 904–906.
4. K. G. Nicholson, R. G. Webster, A. J. Hay, Textbook of influenza, Blackwell Science Ltd, 1998.
5. K. D. Patterson, G. F. Pyle, The geography and mortality of the 1918 influenza pandemic, Bull.
History Med., 65 (1991), 4–21.
6. P. Walker, C. Whittaker, O. Watson, M. Baguelin, K. Ainslie, S. Bhatia, et al., Report 12: The
global impact of COVID-19 and strategies for mitigation and suppression, Am. Association Adv.
Sci., 2020 (2020).
7. S. Bhattacharya, P. K. R. Maddikunta, Q. V. Pham, T. R. Gadekallu, C. L. Chowdhary, M. Alazab,
et al., Deep learning and medical image processing for coronavirus (COVID-19) pandemic: A
survey, Sustainable Cities Soc., 65 (2021), 102589.
8. U. Nations, 2018 revision of world urbanization prospects, 2018. Available from:
https://www.un.org/development/desa/publications/2018-revision-of-world-urbanization-
prospects.html.
9. The World Bank, Urban development, 2020. Available
from:https://www.worldbank.org/en/topic/urbandevelopment/overview.
Mathematical Biosciences and Engineering Volume 18, Issue 6, 8444–8461.8459
10. F. P. Appio, M. Lima, S. Paroutis, Understanding smart cities: Innovation ecosystems,
technological advancements, and societal challenges, Technol. Forecast. Soc. Change, 142 (2019),
1–14.
11. Z. Allam, D. S. Jones, On the coronavirus (COVID-19) outbreak and the smart city network:
universal data sharing standards coupled with artificial intelligence (ai) to benefit urban health
monitoring and management, Healthcare, 8 (2020), 46.
12. Z. Allam, Cities and the Digital Revolution: Aligning technology and humanity, Springer, 2019.
13. S. Dananjayan, G. M. Raj, Artificial intelligence during a pandemic: The COVID-19 example,
Int. J. Health Plann. Manage., 2020 (2020).
14. F. Jiang, Y. Jiang, H. Zhi, Y. Dong, H. Li, S. Ma, et al., Artificial intelligence in healthcare: past,
present and future, Stroke Vascular Neurol., 2 (2017), 230–243.
15. ITU, AI for good global summit, geneva, 2017. Available from: http://www.itu.int/en/ITU-
T/AI/Pages/201706-default.aspx.
16. V. Gianfredi, N. L. Bragazzi, D. Nucci, M. Martini, R. Rosselli, L. Minelli, et al., Harnessing big
data for communicable tropical and sub-tropical disorders: Implications from a systematic review
of the literature, Front. Public Health, 6 (2018), 90.
17. A. Signorini, A. M. Segre, P. M. Polgreen, The use of twitter to track levels of disease activity and
public concern in the us during the influenza a h1n1 pandemic, PloS One, 6 (2011), e19467.
18. N. L. Bragazzi, V. Gianfredi, M. Villarini, R. Rosselli, A. Nasr, A. Hussein, et al., Vaccines meet
big data: State-of-the-art and future prospects. from the classical 3is (isolate–inactivate–inject)
vaccinology 1.0 to vaccinology 3.0, vaccinomics, and beyond: A historical overview, Front.
Public Health, 6 (2018), 62.
19. Z. S. Wong, J. Zhou, Q. Zhang, Artificial intelligence for infectious disease big data analytics,
Infect. Dis. Health, 24 (2019), 44–48.
20. B. McCall, COVID-19 and artificial intelligence: protecting health-care workers and curbing the
spread, Lancet Digital Health, 2 (2020), e166–e167.
21. B. Meskó, G. Hetényi, Z. Győrffy, Will artificial intelligence solve the human resource crisis in
healthcare?, BMC Health Serv. Res., 18 (2018), 545.
22. B. A. Han, J. P. Schmidt, S. E. Bowden, J. M. Drake, Rodent reservoirs of future zoonotic diseases,
Proc. National Acad. Sci., 112 (2015), 7039–7044.
23. T. R. Gadekallu, N. Khare, S. Bhattacharya, S. Singh, P. K. Reddy Maddikunta, I. H. Ra, et al.,
Early detection of diabetic retinopathy using pca-firefly based deep learning model, Electronics, 9
(2020), 274.
24. T. R. Gadekallu, N. Khare, S. Bhattacharya, S. Singh, P. K. R. Maddikunta, G. Srivastava, Deep
neural networks to predict diabetic retinopathy, J. Ambient Intell. Humaniz. Comput., 2020 (2020),
1–14.
25. R. J. Gillies, P. E. Kinahan, H. Hricak, Radiomics: images are more than pictures, they are data,
Radiology, 278 (2016), 563–577.
Mathematical Biosciences and Engineering Volume 18, Issue 6, 8444–8461.8460
26. S. Kutia, S. H. Chauhdary, C. Iwendi, L. Liu, W. Yong, A. K. Bashir, Socio-technological factors
affecting users adoption of ehealth functionalities: A case study of china and ukraine ehealth
systems, IEEE Access, 7 (2019), 90777–90788.
27. C. Iwendi, Z. Jalil, A. R. Javed, T. R. G., R. Kaluri, G. Srivastava, et al., Keysplitwatermark: Zero
watermarking algorithm for software protection against cyber-attacks, IEEE Access, 8 (2020),
72650–72660.
28. V. Singhal, S. S. Jain, D. Anand, A. Singh, S. Verma, Kavita, et al., Artificial intelligence enabled
road vehicle-train collision risk assessment framework for unmanned railway level crossings,
IEEE Access, 8 (2020), 113790–113806.
29. C. Iwendi, S. Khan, J. H. Anajemba, M. Mittal, M. Alenezi, M. Alazab, The use of ensemble
models for multiple class and binary class classification for improving intrusion detection systems,
Sensors, 20 (2020), 2559.
30. S. Bhattacharya, T. R. Gadekallu, M. Alazab, P. K. R. Maddikunta, A review on deep learning for
future smart cities, Internet Technol. Lett., 2020 (2020), e187.
31. C. Butt, J. Gill, D. Chun, B. A. Babu, Deep learning system to screen coronavirus disease 2019
pneumonia, Appl. Intell., 2020 (2020).
32. X. Xu, X. Jiang, C. Ma, P. Du, X. Li, S. Lv, et al., Deep learning system to screen coronavirus
disease 2019 pneumonia, preprint, arXiv:2002.09334.
33. A. Rosebrock, Detecting covid-19 in x-ray images with keras, tensor flow, and deep learning,
Assessment, 2 (2020).
34. G. Fleming, M. Van der Merwe, G. McFerren, Fuzzy expert systems and gis for cholera health
risk prediction in southern africa, Environ. Modell. Software, 22 (2007), 442–448.
35. J. P. Munoz, R. Boger, S. Dexter, R. Low, J. Li, Image recognition of disease-carrying insects: a
system for combating infectious diseases using image classification techniques and citizen science,
Global Health Strategies, 2018 (2018).
36. K. Kreuzhuber, How AI, big data and machine learning can be used against the corona virus, ARS
Electron. Blog, 19 (2020).
37. K. Allen, How a toronto company used big data to predict the spread of zika, 2016. Available
from: https://www.thestar.com/news/insight/2016/02/22/how-a-toronto-company-used-big-data-
to-predict-the-spread-of-zika.html.
38. W. Heaven, AI could help with the next pandemic-but not with this one, MIT Technol. Rev., 2020
(2020).
39. T. L. Inn, Smart city technologies take on COVID-19, World Health, 841 (2020).
40. K. Khan, How AI predicted the coronavirus outbreak, Available from:
https://www.youtube.com/watch?v=V6BpKSGquRw&feature=youtu.be.
41. M. Hollister, AI can help with the covid-19 crisis-but the right human input is key, 2020. Available
from: https://www.weforum.org/agenda/2020/03/covid-19-crisis-artificial-intelligence-creativity/.
42. J. F. Lindahl, D. Grace, The consequences of human actions on risks for infectious diseases: a
review, Infect. Ecol. Epidemiol., 5 (2015), 30048.
Mathematical Biosciences and Engineering Volume 18, Issue 6, 8444–8461.8461
43. WHO, Key considerations for repatriation and quarantine of travellers in
relation to the outbreak of novel coronavirus 2019-ncov, 2020. Available from:
https://www.who.int/ith/Repatriation Quarantine nCoV-key-considerations HQ-final11Feb.pdf.
44. T. Souza, G. Sainatto, COVID-19 machine learning-based rapid diagnosis from common
laboratory tests, Available from: https://www.kaggle.com/felixthecat/covid-19-ml-policy-based-
rapid-diagnosis/.
45. C. Iwendi, A. K. Bashir, A. Peshkar, R. Sujatha, J. M. Chatterjee, S. Pasupuleti, et al., COVID-19
patient health prediction using boosted random forest algorithm, Front. Public Health, 8 (2020),
357.
c 2021 the Author(s), licensee AIMS Press. This
is an open access article distributed under the
terms of the Creative Commons Attribution License
(http://creativecommons.org/licenses/by/4.0)
Mathematical Biosciences and Engineering Volume 18, Issue 6, 8444–8461.You can also read