Identifying storm hotspots and the most unsettled areas in Bar-celona by analysing significant rainfall episodes in Barcelona during the 2013 ...
←
→
Page content transcription
If your browser does not render page correctly, please read the page content below

Preprints (www.preprints.org) | NOT PEER-REVIEWED | Posted: 21 May 2021 doi:10.20944/preprints202105.0523.v1

 Article

 Identifying storm hotspots and the most unsettled areas in Bar-
 celona by analysing significant rainfall episodes in Barcelona
 during the 2013 – 2018 period.

 Laura Esbrí 1,*, Tomeu Rigo 2, María Carmen Llasat 1, and Blanca Aznar 3

 1 GAMA team, Department of Applied Physics, University of Barcelona, Spain; lesbri@meteo.ub.edu
 2 Meteorological Service of Catalonia (Servei Meteorològic de Catalunya - SMC), Barcelona, Spain
 3 Barcelona Cicle de l’Aigua S.A. (BCASA), Barcelona Spain

 * Correspondence: lesbri@meteo.ub.edu

 Abstract: Flash floods repeatedly threaten Barcelona, damaging the city infrastructure and endan-
 gering the safety of the population. The city’s urban planning and socioeconomic distribution, as-
 sociated with the topography and other geographic factors, means that these flood events do not
 affect the entire city in the same way. This is a key point for surveillance and emergency tasks, which
 need some patterns and models to improve response capacity. This work aims to gain a better un-
 derstanding of such events, to add valuable information on how to predict and manage these situ-
 ations. For this purpose, both radar and ground observational data have been combined to identify
 the most important precipitation episodes in Barcelona between 2013 and 2018. To make the analysis
 easier, a new algorithm has been developed to determine the thunderstorm hotspots. Episodes with
 a higher impact have been analysed in depth. The final objective is to improve the actions taken by
 the organisation responsible for managing urban floods, which have seen Barcelona recognised as
 a model city for flood resilience by the United Nations.

 Keywords: flash floods; urban floods; storms; hazard management; urban hydrology; convection;
 convective cells; thunderstorms; radar; flood prevention; Mediterranean

 1. Introduction
 Hydrometeorological hazards especially affect the Mediterranean basin, where in-
 tense rainfall, which produces flash floods, plays an important role. Most of the floods are
 concentrated inside a geographical belt that runs from the western Mediterranean to the
 Black Sea [1]. In Catalonia (NE of the Iberian Peninsula, and NW of the Mediterranean
 Basin), floods are the most damaging natural hazard [2], with a mean rate of over eight
 flood episodes per year [3]. During the 1981-2015 period, more than 250 cases were iden-
 tified, most of them near the coastline [3–5]. As a result, the Spanish Insurance Compen-
 sation Consortium (in Spanish, Consorcio de Compensación de Seguros - CCS) paid out
 over 450 million euros between 1996 and 2015. Furthermore, other private insurance ex-
 penses must be added. Highly convective and very localised precipitation is responsible
 for 70% of the flood episodes along the Catalan coast [6,7], affecting the most densely
 populated Catalan counties in 1 out of 3 cases.
 According to the flood classification in Barrera et al. [8], 36% of Catalan floods were
 ordinary, 53% could be considered extraordinary [9] and 11% were catastrophic (1981-
 2010 period). There is no significant trend related to catastrophic floods in Catalonia, but
 the number of extraordinary floods has increased in recent years [3,8–10]. Explaining this
 trend requires taking into account not only hydrometeorological hazards but also vulner-

 © 2021 by the author(s). Distributed under a Creative Commons CC BY license.
Preprints (www.preprints.org) | NOT PEER-REVIEWED | Posted: 21 May 2021 doi:10.20944/preprints202105.0523.v1

 ability, exposure and coping capacity [11–14]. Still, recent studies point towards an in-
 crease in flood risk but, more to an increase in the associated socioeconomic impact [15].
 To increase flood prevention and resilience, strong social commitment and sustainable
 efforts are needed [16]. This can only be achieved through better empowerment and co-
 responsibility at every level, based on an improved knowledge of prevention and predic-
 tion [17].
 A study on regions in the United States by Naylor and Sexton [18], concludes that the
 urbanisation of metropolitan areas may have changed the location of convective storm-
 cells and precipitation fields. In the Mediterranean region, there is a significant interaction
 between urbanisation and convective precipitation, as most floods are caused by very
 heavy and local precipitation in urbanised areas [7]. The topographic characteristics of the
 Mediterranean region, in combination with its geographical location and the presence of
 a warm sea, mean that dangerous convective systems can develop, or unsettled Atlantic
 perturbations can be strengthened [19]. Rigo and Llasat [20] determined that Mesoscale
 Convective Systems (MCS) and multicellular systems are responsible for the most signif-
 icant floods in Catalonia, while isolated convection or multicellular systems produce local
 and heavy rainfall and consequently cause flash floods [7]. To be managed as well as pos-
 sible, good meteorological forecasts and primary warning systems are required. Numeri-
 cal weather predictions are usually not accurate for such small scales with complicated
 orography, and advanced monitoring systems have limitations as well. New and more
 advanced decision support systems are needed to provide valuable information in critical
 situations [1].
 In this context, radar data offers good complementary information, and can work as
 an observational system and also as an assimilating source for meteorological models
 [21,22] Radar networks provide reflectivity compositions with wide spatial coverage and
 a continuous timeline. This information helps MCS to be better understood in the Medi-
 terranean region [23] by providing information about rainfall fields and rainfall intensity.
 Even so, rainfall amount is usually underestimated by radar calculations, which increases
 with range and beam blocking [24]. A rain gauge network with good coverage provides
 useful information about rainfall properties in the region of interest [3], and can be quite
 useful to manage rainfall alerts in real time. But there are some downsides when working
 with rain gauge data: devices are prone to malfunction if they are not under constant re-
 view and an additional and high-density network is necessary to reproduce small scale
 variability in rainfall [25].
 The main objective of the present work is to determine whether storm cells are more
 concentrated in some areas of Barcelona than in others. In the first step, radar data will be
 combined with observations from rain gauges to find significant rainfall episodes in Bar-
 celona. Secondly, a new radar-based methodology is developed to identify convective
 cells in those relevant episodes, and a further study is carried out to localise the areas of
 the city where convective cells are most frequently located. The identification and charac-
 terisation of storms aims to increase understanding to improve short-term forecasts. The
 performance of early warning systems will improve in conjunction with better forecasts,
 reducing the impact of severe weather.
 Section 2 details the different data sources and explains the methodology. Then in
 Section 3, all the different results are shown and discussed. Finally, Section 4 includes a
 summary, and final conclusions are reached.

 2. Data and Methodology
 This section first describes the region of study and explains the water cycle manage-
 ment system in Barcelona. Then it goes on to share the data sources and finally, detail the
 methodology.

Preprints (www.preprints.org) | NOT PEER-REVIEWED | Posted: 21 May 2021 doi:10.20944/preprints202105.0523.v1

 2.1. Region of interest
 The Barcelona Metropolitan Area (AMB) belongs to the Mediterranean basin, in the
 northeast of the Iberian Peninsula, about 120 km to the south of the Pyrenees (Figure 1). It
 has covers more than 600 km2 and it is densely urbanised (36 municipalities comprising
 over 3.2 million people) with very frequent heavy rainfall events. Two mechanisms favour
 flash floods in this area: heavy precipitation caused by orographic effects, and a topo-
 graphic relief that encourages flux concentration and convergence [1]. In turn, Barcelona
 city (Figure 2) is naturally limited by the Mediterranean Sea (east), the Collserola moun-
 tain range (west), the river Llobregat (south) and the river Besós (north). It is the second
 most populated city in Spain with more than 1,600,000 inhabitants (2018). It covers around
 101 km2. Floods are relatively frequent in the city, with more than 3 pluvial flood episodes
 per year (109 flood events were registered between 1981–2015 according to [17]). In gen-
 eral, they cause damage to basements and ground floors, power outages, and create prob-
 lems for urban traffic and public transportation. Floods can even affect historical or herit-
 age buildings, given their locations in flood prone areas.

 Figure 1: Geographical location of Catalonia and the Region of Interest (ROI) inside Europe and
 the Mediterranean basin.

 In the present study, the comparison between radar data, surface observations and
 the impact of damage will focus on Barcelona city and Cornellà (see section 2.3.2 for more
 details). The latter area (the cities of Barcelona and Cornellà) will be referenced as the
 Region of Interest (ROI). Nevertheless, to have a better understanding of the phenomena
 within the ROI, the analysed area for each episode from a radar point of view has been
 extended about 10 km2 from the ROI (Figure 2).

Preprints (www.preprints.org) | NOT PEER-REVIEWED | Posted: 21 May 2021 doi:10.20944/preprints202105.0523.v1

 Figure 2: ROI and the surrounding area of around 10 km2 that represent the region of study. The
 white dots are the rain gauge locations of the BCASA network. Also, the main rivers surrounding
 Barcelona (Llobregat and Besós) are labelled, as well as the main mountain range (Collserola).

 2. 2. Water cycle management and alert system in Barcelona
 The first attempt to improve resilience to city floods in Barcelona was in 1988 with
 the design of a specific sewerage plan (within the context of the 1992 Olympics) that aimed
 to favour water evacuation off the streets by means of building large water collectors near
 the sea (breakwaters). On 1992, Barcelona City Council promoted a consortium partner-
 ship to complete the task, Clavagueram de Barcelona S.A. (CLABSA, nowadays Barcelona
 Cicle de l’Aigua S.A., BCASA). Some time later, on 21 September 1995, a flood caused one
 death and the city collapsed (2,500 emergency calls, 25 flooded metro stations, 80 incidents
 in the sewer system, etc.) because of a local cumulative rainfall of 91.9 mm and a maxi-
 mum 5-min rainfall intensity rate of 235 mm/h [26]. That unfortunate flood event showed
 the need for more actions to improve the management of intense rainfall events in the city.
 In 1997, BCASA published a new specific sewerage plan for Barcelona (PECLAB’97) diag-
 nosing the drainage problems in the city and proposing a new series of actions for im-
 provement. From 1997 to 2004 a series of slide gates and underground storm water reten-
 tion tanks were built, and rain gauges began to be installed in several locations in the city.
 Also, a remote system to control the slide gates and water tanks was implemented. Over-
 all, the system was designed to prevent floods for 10-year event precipitation, and even at
 some points for a 50-year event [27]. In 2014, Barcelona City Council decided to turn the
 CLABSA consortium into a public enterprise to manage the entire water cycle in the city:
 Barcelona Cicle de l’Aigua S.A. (BCASA). They handle all the related water processes:
 sewerage, rainwater tanks, groundwater system, sea water quality control, flooding risk
 at riverside parks and rainfall intensity warnings.
 Nowadays, BCASA manages 13 underground water tanks and 2 surface flooding ar-
 eas with a capacity for 477,010 m3. They also monitor real-time rainfall data from their rain
 gauge network, compounded by 23 Lambrecht and Geónica tipping bucket sensors (with
 an accuracy of 0.1 mm), that cover the entire area of Barcelona (Figure 2). The prediction
 team at BCASA is always informed with the latest weather forecast and the radar weather

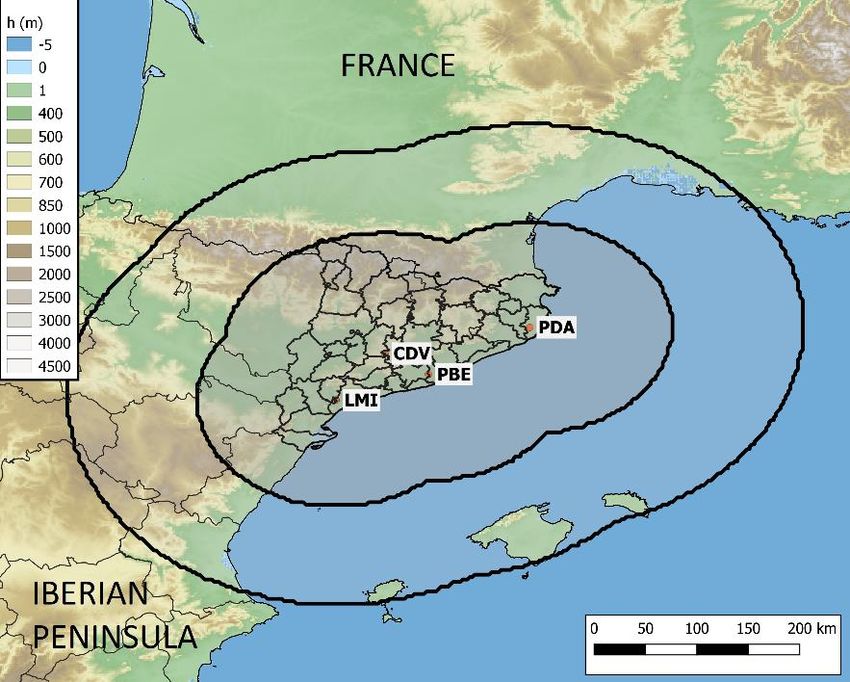
Preprints (www.preprints.org) | NOT PEER-REVIEWED | Posted: 21 May 2021 doi:10.20944/preprints202105.0523.v1

 observations from the Meteorological Service of Catalonia (SMC) along with nearly real-
 time rain gauge data from the network (5-min. updating frequency). The automatic alert
 system processes the data from the rain gauge network and, based on 20-minute and 60-
 minute rainfall intensities (maximum and average), it issues five different alert levels for
 Barcelona (NAB) (Table 1). The first three levels act as a warning, so the current automatic
 protocols are revised by experts and the different contributors to emergency prevention
 and mitigation are revised to ensure the situation is being controlled automatically, with
 no incidents. Level four suggests that Civil Protection should activate the Alert Plan for
 possible floods in Barcelona. Finally, level five activates an emergency, and the expert
 committee meets to coordinate the situation in the city. At this point, BCASA contributes
 as an information provider and experienced consultant.

 Table 1: BCASA criteria to activate the alert level in Barcelona (NAB). Levels are based on two
 precipitation intensity thresholds (20 min. intensity, I20 and 60 min. intensity, I60). PAB = Forecast
 of a possible alert Barcelona.

 Rainfall Level
 NAB PAB High Intensity indi- Prolonged rain indicator
 cator (I20) (I60)
 0 INACTIVE 0 - -
 1 STANDBY 0 mm/h (T20 > 0) 0 mm/h (T60 > 0)
 1,2
 2 SURVEILLANCE 20 mm/h (T20 < 0,1) 10 mm/h (T60 < 0,1)
 3 PRE-ALERT 30 mm/h (T20 ≈ 0.15) 15 mm/h (T60 ≈ 0.15)
 >=3
 4 ALERT 50 mm/h (T20 ≈ 0.4) 25 mm/h (T60 ≈ 0.4)
 5 EMERGENCY 70 mm/h (T20 ≈ 1) 35 mm/h (T60 ≈ 1)

 The average number of alerts activated per year is between 3 and 4, but it varies from
 one year to the next. Also, as urban floods in Barcelona have very short time scales and
 are rapidly solved, the emergency level is rarely activated. The combination of the auto-
 matic sewerage and drainage systems, along with an alert protocol, allows a coordinated
 effort with Civil Protection and authorities when flash floods occur in the city.

 2.3. Data sources
 2.2.1. Radar data from the Meteorological Service of Catalonia(SMC)
 Radar data used in this study belong to the radar network of Meteorological Service
 of Catalonia (XRAD). XRAD is composed of four radars distributed in strategic points
 throughout Catalonia (Figure 3): Puig Bernat in Vallirana (PBE, installed in 2000), Puig
 d'Arques in Cruïlles, Monells and Sant Sadurní de l'Heura (PDA, 2002), la Creu del vent
 in La Panadella, Montmaneu (CDV, 2003) and La Miranda, in Tivissa-Llaberia (LMI, 2008).
 Each of them works on three tasks: one long-range task (250 km), which operates at a set
 of elevations that are part of the radar volume with similar characteristics, and two short-
 range tasks (130-150 km), from which different products are created. Composite products
 are created from individual radar products. They cover the whole region of Catalonia and
 its surroundings (Figure 3).
Preprints (www.preprints.org) | NOT PEER-REVIEWED | Posted: 21 May 2021 doi:10.20944/preprints202105.0523.v1

 Figure 3: Map showing the north-eastern Iberian Peninsula and southern France. The black outer
 line represents long-range coverage of XRAD, and the inner line represents the short-range cover-
 age. The labels and orange dots correspond to each XRAD radar. LMI (La Miranda), CDV (Creu
 del vent), PBE (La Panadell), and PDA (Puig d’Arques i Cruïlles).

 All radar products used here are a composition of the four different radars. The first
 one is the daily Quantitative Precipitation Estimation (QPE), corrected with EHIMI (Hy-
 drometeorological Integrated Forecasting Tool) [23] and observational data from the Au-
 tomatic Weather Stations network of the SMC (XEMA). It is a short-range product with
 1x1 km2 spatial resolution. Data files have been available in ‘GeoTIFF’ format since 2013.
 In a second stage, to identify convective cells, the maximum surface reflectivity composi-
 tions, and short-range reflectivity compositions on 10 vertical levels, CAPPIs (Plan Posi-
 tion Indicator of Constant Altitude), are also used. This product has a vertical extension
 between 1 km and 10 km (by 1 km) and has a time resolution of 6 min and a spatial reso-
 lution of 2x2 km2. Considering all vertical levels available adds more robustness to the
 method when identifying convective cells than when only considering the lowest levels
 (see section 2.3.4).

 2.2.2. BCASA rain gauge network and database
 As mentioned in Section 2.1, the rain gauge data for each rocker device from the
 BCASA network (Figure 2) is stored in a database. As the network is composed of tipping
 bucket devices, the information is stored when the bucked fills up and turns over. This
 information must be converted to minute intensities or hourly rainfall accumulations, de-
 pending on how it will be applied. Since 2011, there has also been a separate database
 with post-event rainfall reports for all the different episodes that have exceeded the rain-
 fall volume of 1 mm (in the same device). This second database includes the date of oc-
 currence, average and maximum precipitation, average and maximum 20-minute and 60-
 minute intensities, and NAB for the episode proposed by BCASA (Table 1). When the
 NAB reaches or exceeds level 3, related incidents are requested from Barcelona City Coun-
 cil and are also included on the database. These incidents are usually related to the sewer
 system, but they also include flooding on streets, in the metro and in basements.

Preprints (www.preprints.org) | NOT PEER-REVIEWED | Posted: 21 May 2021 doi:10.20944/preprints202105.0523.v1

 Hourly rainfall data from the rain gauge network was used in the study to calculate
 24-hour rainfall accumulation. This data was cleaned and prepared in advance for the
 purposes of the study. The rainfall reports are also used to classify rainfall events in Bar-
 celona into different categories according to its impact by means of NAB.

 2.3. Methodology
 Diagram showing the different steps followed in the present study, in Figure 4. In
 the following subsections, every process is explained in greater detail.

 Figure 4: Conceptual scheme of the followed methodology

 2.3.1. Database creation: Rainfall episodes inside ROI
 The first objective is to identify all the relevant rainfall episodes inside the ROI (cities
 of Barcelona and Cornellà de Llobregat) to create the database for the period of study. For
 the purposes of this study, a rainfall episode is defined as a single rainfall day in which at
 least 10 mm of accumulated rain is exceeded at a given point. The location of this point
 must be inside the ROI. Rainfall accumulations are calculated between 00:00 UTC and
 23:59 UTC for a single day. If the precipitation continues after 23:59 UTC, two different
 episodes are identified. SMC started to generate volumetric georeferenced radar files
 (with the actual format) at the beginning of 2013, but during the first few months some
 adjustments had to be made. It is for this reason that the period of study is from April
 2013 to December 2018. Following this criteria, episodes are identified from XRAD data
 by analysing the maximum accumulated QPE over 24 hours (Pmax) for each pixel of the
 radar frame. The identification of episodes is then repeated, selecting the days that meet
 the criteria from the list of rainfall reports (with rain gauge data) from BCASA. Episodes
 obtained from both sources are then compared. If episodes do not appear in both lists, an
 analysis is carried out to determine if the rainfall within the ROI was significant, or if it
 was an inaccuracy in the data from one of the systems.
 To analyse the episodes that caused major stress to the city in more detail, episodes
 were selected based on BCASA NAB criteria (Table 1). The selected episodes were those
 for which BCASA issued an NAB alert level greater than or equal to 3. Furthermore, to
 have a more complete view of the impact on the city, rain reported incidents related to the
 episodes were requested from BCASA for the studied period (April 2013 to December
 2018). The original data from reported incidents belonged to Barcelona City Council.

 2.3.2. Comparison of rain gauge data and radar data for rainfall episodes
Preprints (www.preprints.org) | NOT PEER-REVIEWED | Posted: 21 May 2021 doi:10.20944/preprints202105.0523.v1

 Rain gauge data is only available for the specific locations where devices are in-
 stalled. So, when comparing with data from the radar network, radar QPE values must be
 extracted for each episode on the same coordinates (longitude and latitude) where the
 BCASA rain gauges are located. Using similar statistics as Trapero et al. [24,28], the Bias
 (expressed in mm) and the Root Mean Square Factor (RMSf) were calculated for each rain-
 fall episode:

 1
 = ∑ 10 ∗ log [ ] (1)

 =1

 2
 1
 = √ ∑ (ln [ ]) (2)

 =1

 where N is the number of points where either QPErad and QPEgau are greater than 0.1 mm.
 The RMSf is a dispersion indicator, so it should be larger whenever the episode has high
 variability. That will happen if the rainfall episode is highly convective. Otherwise, if Bias
 is close to zero, radar and rain gauges agree in rainfall accumulations while Bias values
 smaller or greater than zero will indicate either that the radar underestimated or overes-
 timated the rainfall amounts.

 2.3.4. Analysis of storm hotspots with radar
 At this point, two approaches are applied to the previously identified significant ep-
 isodes in order to test whether there are areas inside the ROI where intense rainfall is most
 prone to occur.
 On the one hand, radar data files containing maximum reflectivity intensities for an
 episode (24h) at surface level were analysed for significant episodes. For each radar file
 (containing the maximum values of surface reflectivity for the day), three different thresh-
 olds of maximum surface reflectivity were established: 30 dBZ, 45 dBZ and 55 dBZ. Any
 pixels surpassing the tested threshold during an episode were counted and then added
 up if the threshold was also surpassed for the same pixels for another episode. The results
 for each threshold show the number of episodes that surpassed the threshold for each
 pixel (1x1 km2). Those products will be shown for each threshold, where maximum sur-
 face reflectivity values were observed with a higher frequency when a significant episode
 took place.
 The other approach is to establish a very simple radar-based methodology to identify
 and locate convective storm cells for significant episodes (if any). For this task, CAPPI
 products from XRAD were used. As explained in Section 2.2.1, these are volumetric files
 containing different vertical levels of reflectivity at a time resolution of 6 minutes. The
 algorithm was programmed as an R script and follows the subsequent procedure for each
 one of the files:
 1. It searches for pixels (2x2 km2) inside Barcelona and the surrounding area (a radius
 about 10 km from the limits of the city), that simultaneously: surpass the threshold
 of 35 dBZ for the maximum reflectivity value, achieve at least 30 dBZ of reflectivity
 above 3 km of altitude, and where at least 5 contiguous pixels match the criteria.
 2. All the adjacent pixels that meet these conditions will be grouped into a single con-
 vective cell. If more than one convective cell is identified in the same data-file, differ-
 ent coexisting convective cells will be considered.
 3. The information characterising the convective cell is stored with one entry into a text-
 file. This information covers: the date of the event, the time when the cell was de-
 tected, the longitude and latitude coordinates of the centre of the cell, how many
Preprints (www.preprints.org) | NOT PEER-REVIEWED | Posted: 21 May 2021 doi:10.20944/preprints202105.0523.v1

 pixels it is made of, the overall area, and if there were other cells at the same time
 inside the analysed area.
 The restriction of the minimum number of pixels to meet the reflectivity conditions is im-
 posed to avoid isolated maxima of reflectivity without enough organisation to be consid-
 ered a convective storm cell. Both [29] or [30] proposed more robust methods to identify
 convective storm cells with 3D algorithms. However, the present work has greater robust-
 ness than other 2D algorithms [31,32] as the altitude of convective structures has also been
 taken into account, following a simplified 3D algorithm. The main reason for applying
 this methodology is its computational efficiency, which allows analysis of a very large
 number of episodes.

 3. Results and discussion
 3.1. Database creation: rainfall episodes
 Between April 2013 and December 2018, 163 rainfall episodes that met the criteria
 (section 2.3.1) were found in both data sets (XRAD and BCASA networks). However, there
 were 58 additional episodes detected only by radar. For those episodes, a deeper analysis
 was carried out concluding the following:
 • In 38 cases, BCASA rainfall observations registered precipitation between 1 and 10
 mm at some point.
 • In 6 cases, rainfall collection by the BCASA network was under 1 mm, but radar
 showed a consistent rainfall field.
 • In a further 14 cases, the algorithm used classified the day as a rainfall episode, but
 the rainfall field barely crossed the border of ROI, or rainfall occurred mainly over
 the sea. These cases were not included on the final list of episodes.
 • Major differences in the number of episodes between both sources were shown by
 the end of spring and the beginning of autumn: a difference of 9 episodes in June, 12
 in July, 11 in September and 12 in October. Summer events are usually very convec-
 tive, short and local, and for this reason they may not detected by the rain gauge
 network. Despite the rain gauge network having a good spatial resolution, convec-
 tive precipitation can be highly localised and in some cases is not detected with any
 available surface sensor [33]. The resulting final list is made up of 207 rainfall epi-
 sodes within the ROI for the studied period (shown on Appendix A, Table A.1).
 From now on, the selected episodes will be referred to as rainfall episodes in the ROI.
 The climatology for these significant episodes is shown on Figure 5. December is the
 month with the least episodes, and September has the most. Overall, from February to
 August, there are between 12 and 18 episodes per month. It is during autumn (from Sep-
 tember to November) when the greater numbers of episodes are found.
Preprints (www.preprints.org) | NOT PEER-REVIEWED | Posted: 21 May 2021 doi:10.20944/preprints202105.0523.v1

 Figure 5: Climatology for the significant episodes from April 2013 to December 2018.

 The climatology of significant rainfall episodes in this work is consistent with previ-
 ous studies carried out in the same region for longer study periods. In Catalonia there is
 a large spatial and temporal variability in terms of the annual rainfall cycle, with typically
 short thunderstorms during summer and spring and larger events during late autumn
 and winter [20,33]. Also, Barrera et al. [8] and Cortès et al. [5] showed that most of the
 floods in Barcelona are concentrated between the end of summer and autumn, with the
 maximum number of episodes per month in September.
 When filtering rainfall episodes using the NAB level issued by BCASA, that are
 greater than or equal to 3, there were 64 cases in the studied period (Table A.2 in the ap-
 pendix A). Analysing the dates for the episodes with the highest alert level (NAB = 4) on
 Table A.2, one observe they are not uniformly distributed along the year. They seem more
 likely to occur from July to November, but since there are only 17 cases over a 6-year
 period it is not possible to determine any kind of trend. Referring those with NAB equal
 to 3, the probability of occurrence is higher from May to November, with a maximum
 average of cases per month in August and September. These results are consistent with
 [33]. According to the data, there is no evidence of an upward trend for episodes with
 greater NAB, but again, the study period is too short.
 NAB is an alert indicator, but it is not directly related to the consequences for the city
 or to actual hazards. For this reason, incidents reported to Barcelona City Council are also
 included for those episodes (Table A.2 in the appendix). It stands out that not all the epi-
 sodes with the highest precipitation values had the most reported incidents. In fact, inci-
 dents were only reported for 28 of them. The first four episodes that reported the largest
 number of events took place in the last year of the study (2018). From October to Novem-
 ber of the same year there was an unusually high occurrence of extraordinary rainfall ep-
 isodes in the city. In general, NAB = 4 cases have more reported incidents per episode than
 NAB = 3 ones. These episodes were mainly concentrated in November, March, September
 and October. Considering the total number of incidents per year, 2018 (with 353) was the
 most reported year. The second was 2014 (174), then 2017 (75), 2016 (58), 2015 (17) and
 finally 2013 (15). Since 2013, there has been an increasing trend in the number of incidents
 per year, but this could be caused by the reporting methodology. In the past, Barcelona
Preprints (www.preprints.org) | NOT PEER-REVIEWED | Posted: 21 May 2021 doi:10.20944/preprints202105.0523.v1

 City Council gathered water related incidents through phone calls from citizens. Today,
 BCASA manages the database and has changed the way in which information is obtained.
 They want to obtain a greater variety of rain-related incidents, in order to create a more
 robust database. Table 2 shows the annual distribution of the rainfall episodes with re-
 ported incidents. In all the winter seasons, no episode was reported with these character-
 istics. The episodes with the highest alert level are most concentrated in autumn seasons.
 Nevertheless, the number of those events reported during summers is also significant.
 Overall, there is a similar number of cases with NAB = 3, spread over the spring, summer
 and autumn periods.

 Table 2: Seasonal distribution of episodes with the most impact in Barcelona with reported incidents from April 2013 to December
 2018. The seasons considered were winter (December, January, and February), spring (May, April, and March), summer (June, July,
 and August) and autumn (September, October, and November). The values shown are: the number of episodes for each category
 (NAB euqel to 3 or 4) per season, observed maximum, minimum and median values for maximum cumulated precipitation in an
 episode for each season, and 25 and 75 percentiles for the same variable for each season.

 NAB 3 4
 No. of Pmax 24h (mm) No. of Pmax 24h (mm)
 Ep. Max Min Med 25% 75% Ep. Max Min Med 25% 75%
 Winter 0 - - - - - 0 - - - - -
 Spring 4 33.00 12.40 26.85 26.23 38.65 2 101.20 57.80 79.50 68.65 90.35
 Summer 3 26.15 30.35 35.60 65.80 28.80 5 65.80 28.80 44.40 39.40 55.3
 Autumn 5 40.30 37.50 53.30 133.40 28.10 9 133.40 28.10 94.90 45.50 101.2

 After analysing the maximum cumulative precipitation (BCASA network) on the
 previously sub-selected episodes with reported incidents (Table 2), the ones with NAB
 equal to 3 indicate a maxima between 12.45 and 40.30 mm. Episodes with NAB equal to 4
 showed a wider range of values: there are episodes with maximums from 28.10 to more
 than 110 mm (cumulative rainfall over 24 hours) and an exceptional case with 133.4 mm.
 Table 2 also displays seasonal variability of maximums collected in those rainfall episodes.
 Higher maximum values are observed in both spring and autumn seasons. Looking at the
 75% percentile, episodes with NAB = 3 have larger rainfall accumulations in spring, while
 for those with NAB = 4, the larger accumulations occur during autumn.
 When trying to establish trends and patterns in terms of impacts on the city of Bar-
 celona, it seems that the number of episodes with reported incidents shows a decreasing
 trend over the years studied, except for 2018, where an unusual high number of extraor-
 dinary rainfall episodes compromised the normal running of the city. There is no doubt
 that rainwater management systems (such as rainwater tanks) and correct maintenance of
 the sewerage system, coordinated by BCASA, have had an important role on decreasing
 damage in the city [8], which again highlights the importance of early warning systems in
 order to be prepared against the most significant events.

 3.2. Comparison of rain gauge data and radar data for rainfall episodes
 For each episode on the database, maximum cumulative precipitation on rain gauge
 locations form radar products and rain gauge data are compared, as explained in the sec-
 tion 2.3.2 of methodology. For the 207 cases presented in the previous section, the overall
 difference (BIAS) is calculated, as well as the RMSE. In Figure 6, the seasonal distribution
 of the results in the comparison is shown. Episodes with no observational rain gauge data
 (3 of them) are counted as radar overestimation cases. For some months (from May to
 October) the radar struggled to reproduce the observations from the BCASA network, and
Preprints (www.preprints.org) | NOT PEER-REVIEWED | Posted: 21 May 2021 doi:10.20944/preprints202105.0523.v1

 a trend to rainfall overestimation is observed. This is a consequence of using a single Z-R
 relationship throughout the year. Radar QPE calculations do not distinguish the water
 phase, but when there is ice in the clouds, the reflectivity values are much higher than
 usual and the resulting QPE may be much higher than the real figures. This applies for
 hail episodes (relatively frequent in Catalonia and the ROI [29]).

 Figure 6: Seasonal distribution of the calculated 24h rainfall BIAS and RMSE between XRAD prod-
 ucts and the BCASA rain gauge network for the 207 rainfall episodes in the ROI.

 SMC had previously calculated the overall bias of its radar network in Catalonia. For
 each episode, they compared, point by point, the accumulated precipitation with the ob-
 servations from an automatic weather station network (XEMA), also managed by the
 SMC. From June to September, SMC gets an overall positive bias, which is consistent with
 the results in Figure 6. But in this work, the positive bias also extends to October. This is
 also consistent with the SMC calculations, as they also documented a positive bias along
 the coastline of Catalonia from September to November. However, overall, this bias is
 compensated with a negative bias inland (not shown).
 By comparing maximum cumulative precipitation values from both sources for epi-
 sodes with NAB greater than or equal to 3, a trend towards radar overestimation can be
 observed. A larger study with a greater number of episodes with the same characteristics
 is needed to analyse this tendency in more detail. With the available data, it seems XRAD
 has a better ability to reproduce more accurate maximum values when NAB is equal to 3
 than when it is equal to 4. It is also important to note that the rain gauge network is not as
 dense as the radar resolution data, so for highly convective precipitation with wide inten-
 sity gradients, radar measurements may be more accurate [25].

 3.4. Storm hotspot analysis with radar
 3.4.1. Analysis of surface maximum reflectivity maps
Preprints (www.preprints.org) | NOT PEER-REVIEWED | Posted: 21 May 2021 doi:10.20944/preprints202105.0523.v1

 For significant episodes, the frequency of exceeding a surface reflectivity of 30 dBZ
 is shown (Figure 7). The procedure is repeated two more times, raising the target thresh-
 old to surpass a surface reflectivity of 45 dBZ (Figure 8) and once again for 55 dBZ (not
 shown).

 Figure 7: Distribution of maximum surface reflectivity surpassing 30 dBZ. It shows the frequency
 on each pixel for significant rainfall episodes. The grey contour lines show regions of a constant
 height (m). The red solid line outlines the ROI. Inside, black solid lines divide the different dis-
 tricts labelled as follows: 01 – Ciutat Vella, 02 – Eixample, 03 – Sants-Montjuïc, 04 – Les Corts, 05 –
 Sarrià, 06-Sant Gervasi, 07 – Horta-Guinardó, 08 - Nou Barris, 09 – Sant Andreu, 10 – Sant Martí,
 and 20 – Cornellà de Llobregat.
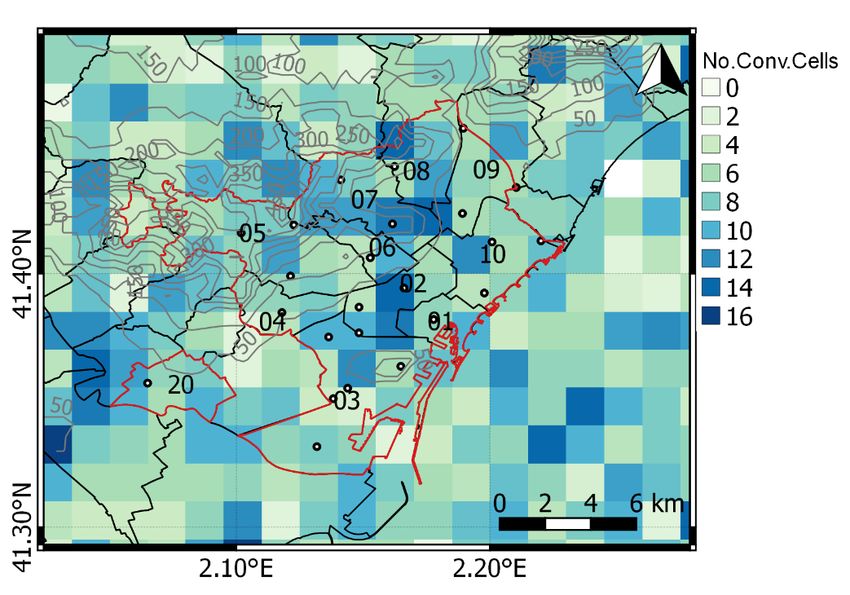
Preprints (www.preprints.org) | NOT PEER-REVIEWED | Posted: 21 May 2021 doi:10.20944/preprints202105.0523.v1

 Figure 8: Same as Figure 7, for 45 dBZ.

 Figure 7 shows a greater concentration of pixels with the highest frequencies in the
 north-eastern part of the ROI, mostly near the coast. In the Sant Martí district, for more
 than 81% of the cases, maximum surface reflectivity exceeds 30 dBZ. Another hotspot can
 be observed in Ciutat Vella and Nou Barris (for more than 80% of significant episodes).
 Also, Cornellà de Llobregat, Sant Andréu and Horta-Guinardó surpass the threshold in
 up to 80% of the studied episodes. When repeating the procedure with the 45 dBZ thresh-
 old, the number of significant episodes exceeding the threshold significantly decrease
 (Figure 8), but three different areas have a higher frequency of episodes surpassing the
 threshold. This occurs in the Sant Martí and Sant Andreu districts, with maximum fre-
 quencies up to 16%, in Ciutat Vella and Eixample with frequencies around 15%, and lo-
 cally in the north-eastern part of Sarrià with 14% of cases. On the other hand, surface re-
 flectivity values above 55 dBZ are rarely achieved inside the ROI, just in 1% of the signif-
 icant episodes analysed for some of the pixels inside Sarrià and Ciutat Vella districts (not
 shown).

 3.4.2. Analysis of convective cells on rainfall episodes
 The algorithm was applied to the 207 rainfall episodes to identify convective cells
 within the area (ROI and a surrounding 10 km buffer). As a result, more than 8000 cen-
 troids of convective cells from 189 cases were obtained. Error! Reference source not
 found. shows the spatial distribution of these centroids inside ROI. A higher density of
 centroids was identified in four different zones:
 • In the north-north-eastern part of the city, mostly affecting the Nou Barris and Horta-
 Guinardó districts, and the northern part of the Gràcia district.
 • Right in the middle of the city, affecting the Eixample district, southern Gràcia and
 northern Sants-Montjuïc.
 • The west part of the municipality of Cornellà de Llobregat.
 • In the northwest of the Sant Martí district.
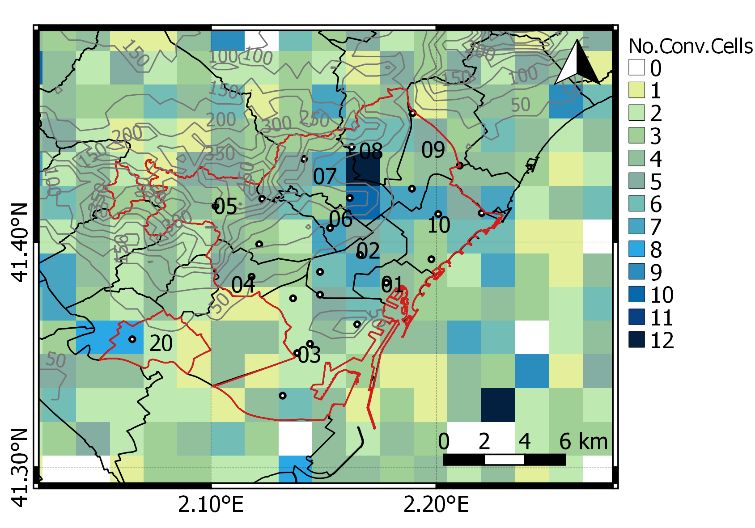
Preprints (www.preprints.org) | NOT PEER-REVIEWED | Posted: 21 May 2021 doi:10.20944/preprints202105.0523.v1

 Figure 9: Distribution of centroids of convective cells for significant episodes. The numbers refer to
 Barcelona districts, and they are detailed on Figure 7.

 Some of the mentioned districts also had high rates of surpassing the 45 dBZ thresh-
 old for surface reflectivity. Nevertheless, when comparing spatial distributions between
 Figure 8 and Figure 9Error! Reference source not found., they are not so similar. While
 maximum surface reflectivity values over 45 dBZ are more prone to occur near the coast-
 line, the centroids of storm cells tend to concentrate more inland, right in the middle of
 the studied area.
 For all the episodes with an NAB greater than or equal to 3, one or more convective
 cells were found by the algorithm. When analysing the hourly distribution of convective
 cells for these episodes, two maximums were obtained:
 • Around 07:00 UTC time (in the morning), a relative maximum.
 • From 15:00 to 20:00 UTC time (afternoon), reaching the peak at 17:00 UTC.
 These results are consistent with a diurnal convection cycle, with the first maxima right
 after convection starts, due to diurnal heating, and the second one after the peak, causing
 convection to develop. Nonetheless, it is worth mentioning that a lower frequency of con-
 vective storm cells was expected during the night, especially during the early hours of the
 day. One possible explanation could be related with anomalous propagation on radar dis-
 play. During steady nights where a temperature inversion was more likely, anomalous
 propagation may generate false echoes of intense reflectivity and the effect is most prone
 to occur in coastal regions [34,35]. Those echoes can be wrongly identified as storm cells.
 Although the ensemble of episodes with greater NAB is limited, Figure 10 shows the
 spatial distribution of centroids (a) and the same for episodes with reported incidents.
Preprints (www.preprints.org) | NOT PEER-REVIEWED | Posted: 21 May 2021 doi:10.20944/preprints202105.0523.v1

 (a) (b)
 Figure 10: Distribution of storm cells centroids across all episodes with NAB 3 or 4 (a) and for epi-
 sodes with the mentioned NAB levels and also, reported incidents (b).

 When comparing Figure 9 and Figure 10, some common features are revealed. Pixels
 with the highest concentrations of centroids are located on the lower side of complex ter-
 rain, with a higher number of centroids per pixel in the middle of the ROI. Darker pixels
 on Figure 10 (a) are similar to those on Figure 9, but with a smaller number of centroids
 per pixel and a larger gradient between the most affected districts and the ones that are
 not so affected. Both figures agree that most of the centroids are found in the districts of
 Nou Barris, Horta-Guinardó, Eixample and Sants-Montjuïc. On the other side, Figure 10
 (b) highlight maximum concentrations on Cornellà and on the border between Nou Barris
 and Horta-Guinardó districts. Also, some pixels have slightly higher concentration of cen-
 troids on the southern part of Gràcia, on Sarrià and les Corts and on the border between
 Montjuïc, Ciutat Vella and Eixample.

 4. Conclusions
 During this research, a new methodology was established to identify storm episodes
 in the city of Barcelona. A database was created by combining data from the BCASA rain
 gauge network and XRAD radar products from April 2013 to December 2018. The meth-
 ods used were also able to identify some areas in the city with a greater concentration of
 storm centroids than others. The following paragraphs summarise the conclusions
 reached.
 Identifying rainfall episodes with XRAD data results in a greater number of episodes
 than using data from the BCASA rain gauge network. The difference relays on limitations
 on the coverage for the rain gauge network, anomalous propagation of the radar beam
 under certain atmospheric conditions [34] or also to other anomalous echoes that may
 identify precipitating nuclei when they do not exist. During the winter, XRAD performed
 well in reproducing maximum cumulated precipitations in Barcelona. However, through-
 out May, June, August, September and October, there is a trend towards radar overesti-
 mation of the maximum cumulated rainfall.
 Rainfall episodes with a greater impact on Barcelona are not the only factor linked to
 flood hazards, and vulnerability and exposure also play an important role [3]. That ex-
 plains why on some intense rainfall episodes, few or no incidents were reported. Along
 the same lines, episodes with a significant impact on the city, but without large rainfall
 accumulations were also found. The year with the highest number of episodes with inci-
 dents was 2014. Even so, the greatest number of incidents per episode occurred in 2018.
Preprints (www.preprints.org) | NOT PEER-REVIEWED | Posted: 21 May 2021 doi:10.20944/preprints202105.0523.v1

 BCASA rainwater management has contributed to reducing the number of episodes with
 reported incidents per year. However, during 2018 there was anomaly with a greater
 number of extremely intense rainfall episodes that compromised the normal running of
 the city.
 Greater concentrations of convective cells centroids were identified on the lower side
 of the complex orography of Barcelona, with a greater incidence in some areas inside the
 districts of Cornellà de Llobregat, Nou Barris, Horta-Guinardó, Gràcia, Montjuïc, Ciutat
 Vella and Eixample. Also, locations more prone to surpass 45 dBZ were proven to be near
 the coastline, and do not exactly match the areas with the greatest concentration of storm
 centroids. This means that, even when the intensity of radar reflectivity is related to rain-
 fall intensity, it is not the only factor to monitor to prevent flash floods. Some intense
 storms may not have high intensity values of reflectivity, but may still have a high impact.
 Finally, for rainfall episodes with an NAB level of 3 or 4, a higher concentration of
 convective cells is found in the middle of the city. The time distribution of these cells
 shows the overlap of two phenomena: maximum number of convective cells agrees with
 the maxima for convection activity (diurnal heating) and the rate of convective cells with
 reported incidents its much higher from 6 UTC to 20 UTC, when the population is active.
 Also, the unexpectedly large number of centroids identified at night may be a result of
 anomalous propagation, unfiltered by the radar.
 Although this study focused on a small area, a more detailed analysis would provide
 greater understanding of flash floods in Barcelona. A wider study period is needed and
 impacts on the city must be gathered more robustly. Also, the usage of urban meteorolog-
 ical and hydrological models should be considered. For all these reasons, the role of spe-
 cific institutions, such as BCASA, is increasingly important. Data needs to be stored,
 cleaned, and analysed in robust ways, and monitoring and management systems need to
 be continually reviewed and improved in order to increase resilience to flash floods in
 Barcelona.

 Author Contributions: Conceptualisation, L.E., M.L. and T. R.; methodology, L.E. and T.R.; soft-
 ware, L.E.; validation, L.E. T.R., B.A. and M.L; writing—original draft preparation, L.E.; writing—
 review and editing, M.L. and T.R. All authors have read and agreed to the published version of the
 manuscript.
 Funding: This research received no external funding.
 Institutional Review Board Statement: Not applicable.
 Informed Consent Statement: Not applicable.
 Data Availability Statement: Not applicable.
 Acknowledgments: This work was carried out under the framework of the SINOPTICA (H2020-
 SESAR-2019-2, 892362) European project of Horizon 2020 and the M-CostAdapt (CTM2017-83655-
 C2-2-R) research project, funded by the Spanish Ministry of Economy and Competitiveness
 (MINECO/AEI/FEDER, UE). The authors would like to thank to BCASA for their commitment, col-
 laboration, and data. Thanks also go to the Meteorological Service of Catalonia for their collabora-
 tion and the data provided. Finally, thanks go to the Water Research Institute (Instituto de Investi-
 gación del Agua - IdRA) and the SINOPTICA (H2020-SESAR-2019-2, 892362) European project of
 Horizon 2020 for enabling this paper to be written. Thank you to Hannah Bestow for her revision of
 the English.
 Conflicts of Interest: The authors declare no conflict of interest.
Preprints (www.preprints.org) | NOT PEER-REVIEWED | Posted: 21 May 2021 doi:10.20944/preprints202105.0523.v1

 Appendix A

 Table A.1: List of the 207 rainfall episodes inside ROI resulting from the combination of XRAD and BCASA data

 Pmax Pmax Pmax Pmax Pmax Pmax Pmax Pmax
 Date Date Date Date
 BCASA XRAD BCASA XRAD BCASA XRAD BCASA XRAD

 25/04/2013 17.4 16.2 17/09/2014 4.3 13.0 22/07/2016 18.6 21.9 26/01/2018 62.1 51.5
 27/04/2013 23.6 28 22/09/2014 9.7 20.1 30/08/2016 12.3 13.0 01/02/2018 16.2 10.0
 28/04/2013 13.4 14.4 23/09/2014 6.0 10.0 10/09/2016 11.5 5.0 04/02/2018 27.9 38.9
 29/04/2013 16.7 27.8 28/09/2014 95.4 101.2 13/09/2016 24.9 28.1 05/02/2018 39.2 39.9
 15/05/2013 32.7 38.3 29/09/2014 21.3 7.0 14/09/2016 18.2 20.8 08/02/2018 45.2 16.8
 16/05/2013 6.7 17.7 30/09/2014 46.3 35.3 23/09/2016 57.4 69.4 12/02/2018 20.6 19.0
 18/05/2013 7.9 10.8 05/10/2014 12.4 17.8 06/10/2016 31.5 28.1 28/02/2018 13.9 15.9
 19/05/2013 16.5 23.8 03/11/2014 44.6 45.5 12/10/2016 61.1 77.7 20/03/2018 45.4 35.4
 20/05/2013 10.3 12.1 04/11/2014 18.9 15.3 13/10/2016 62.2 54.0 24/03/2018 58.4 47.7
 08/06/2013 25.1 28.8 26/11/2014 35.4 35.3 22/10/2016 8.2 10.0 26/03/2018 13.5 16.0
 21/06/2013 5.6 15.5 27/11/2014 14.4 16.4 22/11/2016 12.6 13.4 08/04/2018 10.3 9.0
 18/07/2013 33.4 36 29/11/2014 52.1 40.3 23/11/2016 28.5 32.5 10/04/2018 10.0 8.0
 29/07/2013 3.8 12.1 30/11/2014 40.4 53.3 27/11/2016 14.0 21.9 11/04/2018 35.4 30.7
 26/08/2013 19.3 15.5 15/12/2014 18.6 18.0 16/12/2016 19.3 16.5 13/04/2018 6.3 10.7
 27/08/2013 2 19.4 19/01/2015 13.4 13.9 19/12/2016 16.9 17.9 14/04/2018 10.1 12.0
 28/08/2013 2.6 15.1 04/02/2015 19.3 20.1 22/01/2017 6.9 13.0 01/05/2018 82.0 62.4
 07/09/2013 24.4 23.2 05/02/2015 0.0 23.9 27/01/2017 23.6 23.1 13/05/2018 7.9 12.7
 10/09/2013 1.5 83.4 04/03/2015 13.1 12.2 08/02/2017 14.2 16.4 22/05/2018 0.7 17.1
 11/09/2013 18.2 10.2 14/03/2015 22.5 12.5 13/02/2017 19.1 15.8 29/05/2018 11.0 9.0
 04/10/2013 14.1 15.8 21/03/2015 36.3 21.6 24/02/2017 15.7 14.7 03/06/2018 21.0 29.2
 06/10/2013 10.4 24.7 26/03/2015 11.8 17.5 03/03/2017 16.2 13.0 06/06/2018 39.8 37.2
 07/10/2013 17.2 55.8 19/05/2015 43.4 55.6 04/03/2017 12.7 10.0 07/06/2018 18.3 30.9
 08/10/2013 0.6 13.1 20/05/2015 34.3 28.5 24/03/2017 107.4 101.2 28/06/2018 3.5 12.2
 09/10/2013 3.8 14.1 11/06/2015 11.9 13.7 25/03/2017 24.1 25.6 16/07/2018 50.5 44.4
 11/10/2013 13.4 11.2 15/06/2015 29.9 26.6 01/04/2017 15.4 13.1 22/07/2018 18.7 15.5
 16/11/2013 40.1 56.7 16/06/2015 3.4 10.9 05/04/2017 9.1 10.1 17/08/2018 64.9 65.8
 17/11/2013 43.4 62.9 31/07/2015 10.0 14.2 26/04/2017 12.9 10.6 25/08/2018 4.0 13.0
 18/11/2013 41.4 49.3 01/08/2015 23.4 14.0 27/04/2017 25.4 22.9 30/08/2018 11.7 12.5
 19/12/2013 10.1 11.5 13/08/2015 32.7 32.3 11/05/2017 21.9 16.8 31/08/2018 73.2 77.5
 19/01/2014 35.4 25.1 15/08/2015 17.0 17.5 04/06/2017 24.0 24.1 01/09/2018 14.2 15.7
 29/01/2014 28.8 26.7 18/08/2015 18.2 26.7 05/06/2017 10.3 12.2 06/09/2018 92.2 94.9
 09/02/2014 13.9 13.6 10/09/2015 35.2 37.5 30/06/2017 8.9 12.9 07/09/2018 39.6 76.3
 30/03/2014 13.2 14.3 23/09/2015 19.0 13.9 25/07/2017 25.3 46.7 12/09/2018 40.5 41.1
 31/03/2014 10.9 12.2 29/09/2015 17.4 20.7 08/08/2017 14.0 14.2 15/09/2018 1.1 40.2
 03/04/2014 55.9 57.8 30/09/2015 26.5 23.2 31/08/2017 19.6 18.5 18/09/2018 40.0 27.0
 22/04/2014 30.5 12.4 03/10/2015 38.0 80.1 06/09/2017 11.1 20.8 07/10/2018 21.2 26.3
 26/05/2014 26.0 33.0 07/10/2015 38.9 69.4 09/09/2017 21.3 30.7 09/10/2018 102.8 118.2
 28/05/2014 28.1 25.2 08/10/2015 5.6 17.9 12/09/2017 7.5 33.2 10/10/2018 21.9 21.7
 30/05/2014 17.7 19.4 13/10/2015 13.9 22.2 14/09/2017 14.7 14.2 13/10/2018 14.0 12.2
 15/06/2014 27.7 38.9 26/10/2015 9.0 17.0 15/09/2017 8.0 10.0 14/10/2018 44.5 49.8
 16/06/2014 7.0 14.4 27/10/2015 7.8 14.9 18/09/2017 6.1 13.6 19/10/2018 18.9 28.9
 17/06/2014 14.3 28.4 02/11/2015 60.6 52.8 22/09/2017 37.1 17.8 27/10/2018 29.9 31.2
 04/07/2014 17.0 17.8 03/11/2015 7.2 53.4 26/09/2017 9.4 19.0 28/10/2018 9.8 14.1
 07/07/2014 30.0 47.2 27/02/2016 30.4 26.4 01/10/2017 13.4 35.8 29/10/2018 0.0 12.6
Preprints (www.preprints.org) | NOT PEER-REVIEWED | Posted: 21 May 2021 doi:10.20944/preprints202105.0523.v1

 28/07/2014 30.5 39.4 16/03/2016 29.4 19.7 18/10/2017 29.4 27.8 31/10/2018 60.1 52.5
 29/07/2014 6.6 15.1 20/03/2016 23.8 18.4 19/10/2017 92.0 95.4 05/11/2018 9.9 11.9
 02/08/2014 11.9 16.9 01/04/2016 19.5 19.2 20/10/2017 6.1 14.2 09/11/2018 37.7 32.1
 15/08/2014 14.4 19.9 05/04/2016 21.5 21.3 04/11/2017 10.8 14.6 14/11/2018 2.6 11.0
 22/08/2014 54.3 55.3 21/04/2016 30.0 35.3 25/11/2017 9.0 16.3 15/11/2018 138.5 133.4
 05/09/2014 10.9 14.1 18/06/2016 28.8 23.9 02/12/2017 0.0 21.4 18/11/2018 18.7 12.1
 14/09/2014 18.8 27.3 13/07/2016 4.8 12.8 07/01/2018 13.9 19.5 20/11/2018 11.0 10.9
 16/09/2014 20.3 46.8 14/07/2016 0.9 24.0 13/01/2018 9.3 11.2

 Table A.2: Rainfall episodes in Barcelona with NAB levels greather than or equal to 3. Maximum cumulative values of
 precipitation from radar data and rain gauges data are also provided along with the NAB level achieved and the number of
 incidents reported to Barcelona City Council.

 Date Pmax Rad Pmax BCASA NAB Incidents
 08/06/2013 28.8 25.1 4 15
 18/07/2013 36.0 33.4 4
 07/09/2013 23.2 24.4 3
 04/10/2013 15.8 14.1 3
 17/11/2013 62.9 43.4 3
 19/01/2014 25.1 35.4 4
 29/01/2014 26.7 28.8 3
 03/04/2014 57.8 55.9 4 29
 22/04/2014 12.4 30.5 3
 26/05/2014 33.0 26.0 3 28
 28/05/2014 25.2 28.1 3
 30/05/2014 19.4 17.7 3 8
 15/06/2014 38.9 27.7 3 6
 17/06/2014 28.4 14.3 3 2
 04/07/2014 17.8 17.0 3
 07/07/2014 47.2 30.0 3
 28/07/2014 39.4 30.5 4 20
 29/07/2014 15.1 6.6 3
 02/08/2014 16.9 11.9 3
 15/08/2014 19.9 14.4 3
 22/08/2014 55.3 54.3 4 8
 14/09/2014 27.3 18.8 3
 16/09/2014 46.8 20.3 3
 28/09/2014 101.2 95.4 4 26
 30/09/2014 35.3 46.3 3
 03/11/2014 45.5 44.6 4 34
 26/11/2014 35.3 35.4 3 7
 29/11/2014 40.3 52.1 3 5
 30/11/2014 53.3 40.4 3 1
 19/05/2015 55.6 43.4 3 1
 20/05/2015 28.5 34.3 3 4
 01/08/2015 14.0 23.4 3
 13/08/2015 32.3 32.7 3 4
 15/08/2015 17.5 17.0 3
 10/09/2015 37.5 35.2 3 6
 29/09/2015 20.7 17.4 3
Preprints (www.preprints.org) | NOT PEER-REVIEWED | Posted: 21 May 2021 doi:10.20944/preprints202105.0523.v1

 30/09/2015 23.2 26.5 3
 03/10/2015 80.1 38 3 1
 07/10/2015 69.4 38.9 3
 02/11/2015 52.8 60.6 4 2
 20/03/2016 18.4 23.8 3
 18/06/2016 23.9 28.8 3
 13/09/2016 28.1 24.9 3
 23/09/2016 69.4 57.4 3
 06/10/2016 28.1 31.5 4 58
 13/10/2016 54.0 62.2 3
 24/03/2017 101.2 107.4 4 11
 25/07/2017 46.7 25.3 3
 31/08/2017 18.5 19.6 3
 19/10/2017 95.4 92.0 4 64
 26/01/2018 51.5 62.1 3
 01/05/2018 62.4 82.0 3
 06/06/2018 37.2 39.8 3
 16/07/2018 44.4 50.5 4 72
 17/08/2018 65.8 64.9 4 25
 31/08/2018 77.5 73.2 3
 06/09/2018 94.9 92.2 4 72
 07/09/2018 76.3 39.6 3
 12/09/2018 41.1 40.5 4 11
 18/09/2018 27.0 40.0 3
 09/10/2018 118.2 102.8 4 79
 14/10/2018 49.8 44.5 3
 09/11/2018 32.1 37.7 3
 15/11/2018 133.4 138.5 4 94

 References
 1. Marchi, L.; Borga, M.; Preciso, E.; Gaume, E. Characterisation of Selected Extreme Flash Floods in Europe and
 Implications for Flood Risk Management. J. Hydrol. 2010, 394 (1–2), 118–133.
 https://doi.org/10.1016/j.jhydrol.2010.07.017.
 2. Llasat, M. C.; Barriendos, M.; Barrera, A.; Rigo, T. Floods in Catalonia (NE Spain) since the 14th Century.
 Climatological and Meteorological Aspects from Historical Documentary Sources and Old Instrumental Records.
 J. Hydrol. 2005, 313 (1–3), 408–418. https://doi.org/10.1016/j.jhydrol.2005.02.004.
 3. Llasat, M. C.; Llasat-Botija, M.; Rodriguez, A.; Lindbergh, S. Flash Floods in Catalonia: A Recurrent Situation.
 Adv. Geosci. 2010, 26, 105–111. https://doi.org/10.5194/adgeo-26-105-2010.
 4. Barnolas, M.; Llasat, M. C. A Flood Geodatabase and Its Climatological Applications: The Case of Catalonia for
 the Last Century. Natural Hazards and Earth System Science. European Geosciences Union 2007, pp 271–281.
 https://doi.org/10.5194/nhess-7-271-2007.
 5. Cortès, M.; Llasat, M. C.; Gilabert, J.; Llasat-Botija, M.; Turco, M.; Marcos, R.; Martín Vide, J. P.; Falcón, L.
 Towards a Better Understanding of the Evolution of the Flood Risk in Mediterranean Urban Areas: The Case of
 Barcelona. Nat. Hazards 2018, 93 (1), 39–60. https://doi.org/10.1007/s11069-017-3014-0.
 6. Gascón, E.; Laviola, S.; Merino, A.; Miglietta, M. M. Analysis of a Localized Flash-Flood Event over the Central
 Mediterranean. Atmos. Res. 2016, 182, 256–268. https://doi.org/10.1016/j.atmosres.2016.08.007.
Preprints (www.preprints.org) | NOT PEER-REVIEWED | Posted: 21 May 2021 doi:10.20944/preprints202105.0523.v1

 7. Llasat, M. C.; Marcos, R.; Turco, M.; Gilabert, J.; Llasat-Botija, M. Trends in Flash Flood Events versus Convective
 Precipitation in the Mediterranean Region: The Case of Catalonia. J. Hydrol. 2016, 541, 24–37.
 https://doi.org/10.1016/j.jhydrol.2016.05.040.
 8. Barrera, A.; Llasat, M. C.; Barriendos, M. Estimation of Extreme Flash Flood Evolution in Barcelona County from
 1351 to 2005. Nat. Hazards Earth Syst. Sci. 2006, 6 (4), 505–518. https://doi.org/10.5194/nhess-6-505-2006.
 9. Llasat, M. C.; Marcos, R.; Llasat-Botija, M.; Gilabert, J.; Turco, M.; Quintana-Seguí, P. Flash Flood Evolution in
 North-Western Mediterranean. Atmos. Res. 2014, 149, 230–243. https://doi.org/10.1016/j.atmosres.2014.05.024.
 10. Llasat, M. C.; López, L.; Barnolas, M. Flash-Floods in Catalonia: The Social Perception in a Context of Changing
 Vulnerability. Adv. Geosci. 2008, 17, 63–70. https://doi.org/10.5194/adgeo-17-63-2008.
 11. Blöschl, G.; Viglione, A.; Montanari, A. Emerging Approaches to Hydrological Risk Management in a Changing
 World. Climate Vulnerability: Understanding and Addressing Threats to Essential Resources. Elsevier Inc. 2013, pp 3–
 10. https://doi.org/10.1016/B978-0-12-384703-4.00505-0.
 12. Llasat, M. C.; Llasat-Botija, M.; López, L. A Press Database on Natural Risks and Its Application in the Study of
 Floods in Northeastern Spain. Nat. Hazards Earth Syst. Sci. 2009, 9 (6), 2049–2061. https://doi.org/10.5194/nhess-
 9-2049-2009.
 13. Nakamura, I.; Llasat, M. C. Policy and Systems of Flood Risk Management: A Comparative Study between Japan
 and Spain. Nat. Hazards 2017, 87 (2), 919–943. https://doi.org/10.1007/s11069-017-2802-x.
 14. United Nations for Disaster Risk Reduction. Hazard Definition & Classification Review; 2020.
 15. Pachauri, R. K.; Meyer, L.; Allen, M. R.; Barros, V. R.; Broome, J.; Cramer, W.; Jiang, K.; Jiménez Cisneros México,
 B.; Kattsov, V.; Lee, H.; Minx, J.; Mulugetta, Y.; Brinkman, S.; van Kesteren, L.; Leprince-Ringuet, N.; van
 Boxmeer, F. IPCC, 2014: Climate Change 2014: Impacts, Adaptation, and Vulnerability; 2014.
 16. Drost, R.; Casteel, M.; Libarkin, J.; Thomas, S.; Meister, M. Severe Weather Warning Communication: Factors
 Impacting Audience Attention and Retention of Information during Tornado Warnings. Weather. Clim. Soc. 2016,
 8 (4), 361–372. https://doi.org/10.1175/WCAS-D-15-0035.1.
 17. Cortès, M.; Turco, M.; Llasat-Botija, M.; Llasat, M. C. The Relationship between Precipitation and Insurance Data
 for Floods in a Mediterranean Region (Northeast Spain). Nat. Hazards Earth Syst. Sci. 2018, 18 (3), 857–868.
 https://doi.org/10.5194/nhess-18-857-2018.
 18. Naylor, J.; Sexton, A. The Relationship between Severe Weather Warnings, Storm Reports, and Storm Cell
 Frequency in and around Several Large Metropolitan Areas. Weather Forecast. 2018, 33 (5), 1339–1358.
 https://doi.org/10.1175/waf-d-18-0019.1.
 19. Doswell III, C.; Ramis, C.; Romero, R.; Alonso, S. A Diagnostic Study of Three Heavy Precipitation Episodes in
 the Western Mediterranean Region. Weather Forecast. 1998, 13 (1), 102–124.
 https://doi.org/https://doi.org/10.1175/1520-0434(1998)0132.0.CO;2.
 20. Rigo, T.; Llasat, M. C. A Methodology for the Classification of Convective Structures Using Meteorological Radar:
 Application to Heavy Rainfall Events on the Mediterranean Coast of the Iberian Peninsula. Nat. Hazards Earth
 Syst. Sci. 2004, 4 (1), 59–68. https://doi.org/10.5194/nhess-4-59-2004.
 21. Bech, J.; Vilaclara, E.; Pineda, N.; Rigo, T.; López, J.; O’hora, F.; Lorente, J.; Sempere, D.; Fàbregas, F. X. The
 Weather Radar Network of the Catalan Meteorological Service: Description and Applications. In Proceedings of
 ERAD (2004); 2004; pp 416–420.
 22. Cáceres, R.; Codina, B. Radar Data Assimilation Impact over Nowcasting a Mesoscale Convective System in
You can also read