Test beam studies for passive CMOS strip sensor - CERN Indico
←
→
Page content transcription
If your browser does not render page correctly, please read the page content below
Test beam studies for passive
      CMOS strip sensor
 Marta Baselga, Leena Diehl, Ingrid-Maria Gregor, Tomasz Hemperek, Jan-Cedric Hönig,
Sven Mädgefessel, Ulrich Parzefall, Arturo Rodriguez Rodriguez, Surabhi Sharma, Dennis
                       Sperlich, Tianyang Wang, Liv Wiik-Fuchs

                  9th Beam Telescopes and Test Beam
                         08.02.2021- 10.02.2021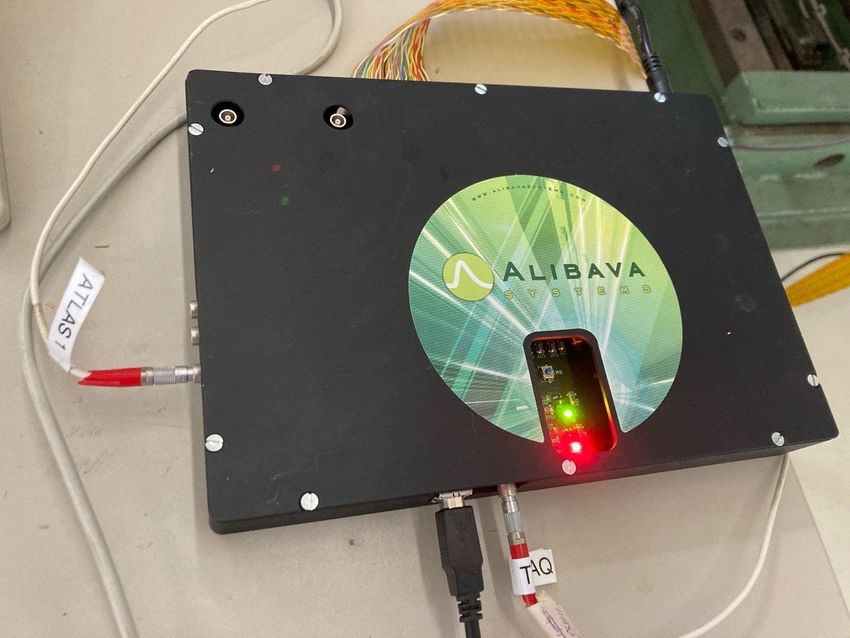
Outline
•   Sensor Details

•   Electrical measurement

•   Goals and Setup for Test beam

•   ALiBaVa setup

•   Analysis Strategy

•   ALiBaVa data reconstruction

•   Telescope data reconstruction
                                    2
Motivation for passive CMOS
•   Requirements for future HEP
    detectors

    •   All silicon-based tracker
    •   Possibly more radiation tolerant
    •   Large surface
    •   Cost effective-> Use of commercial
        CMOS production process

                                                 ATLAS detector in HL-LHC

                                             3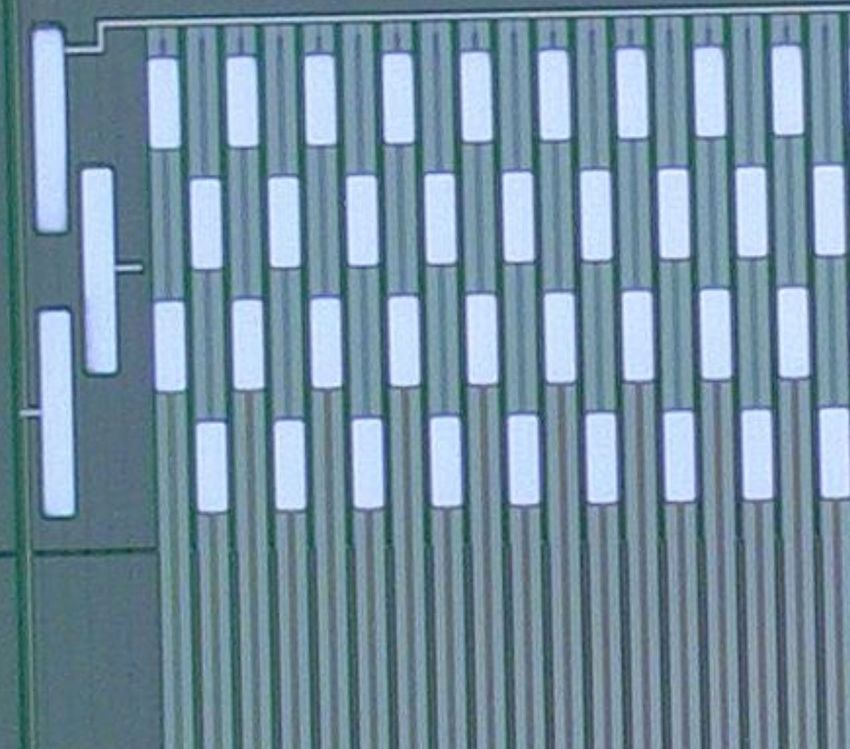
Sensor structure
                                                  •   First stitched strip sensor produced on 8” wafer by
                                                      a commercial foundry

                                                  •   LFA150:
                                                      • L-Foundry 150 nm process (deep N-well/P-well)
                                                      • Up to 7 metal layers
                                                      • Resistivity of wafer: >2000 Ω·cm
                                                      • Float-zone processing

Sensor thickness around 140µm
                                                  •   Frontside process: Reticle stitching for large sensors
Strip pitch=75.5 m
2 sensor types:wide & thin-> each has 40 strips
                                                  •   The strip sensors has 2 different lengths : 2 cm and 4
                                                      cm

                                                       4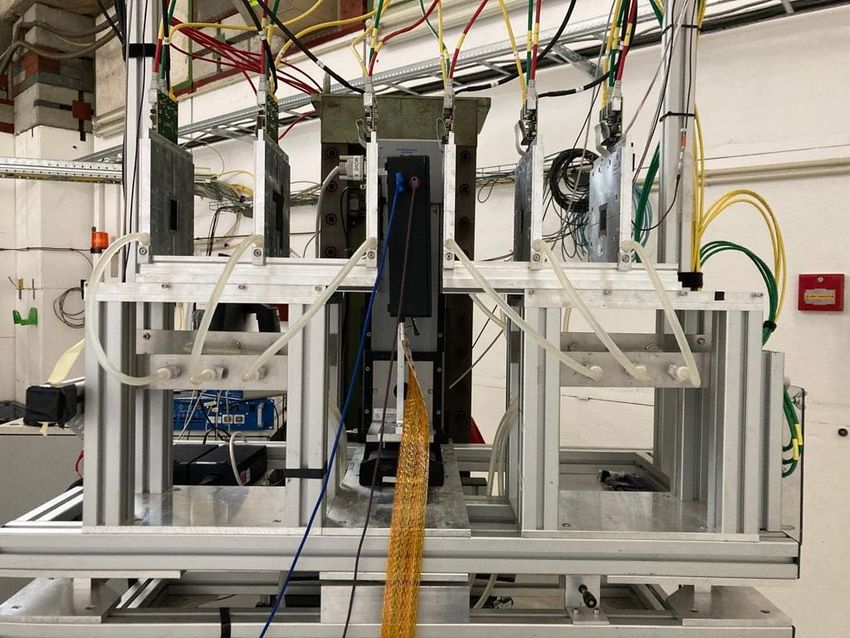
Sensor details
                                          •   Sensor thickness
                                              ~150µm
                                          •   Strip pitch =75.5 µm

                                                                     Thin implant

•   Two different sensor flavours divided in left (wide) and
    right (thin) half of the sensor
•   Each flavour has 40 strips
•   Stitching reticles are ~1cm long
                                                     5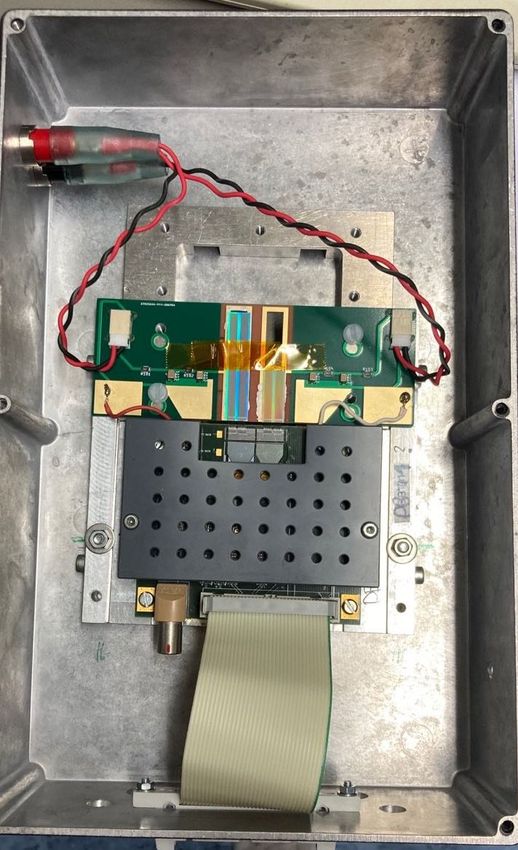
Sensor design
Wide implant                             Thin implant

                Wide implant has
                two different
                width for the low-
                dose N

                                     6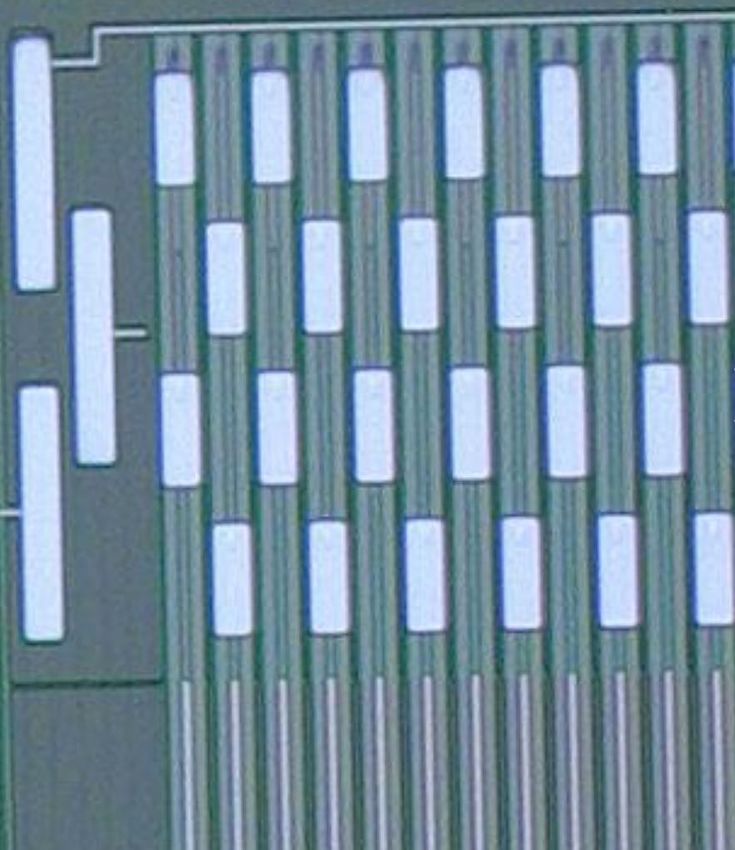
Electrical measurement
                                 All measurements are performed at room temperature
                          IV plot                                                     CV plot

•   For some of the sensor breakdown voltage is around            •   The depletion voltage is in the range of 30-40V
    250V                                                          •   Depletion voltage for wide sensor < Depletion
•   Some sensors show early breakdown -> bad                          voltage for thin sensor
    backside process/implant (improved for next batch)   7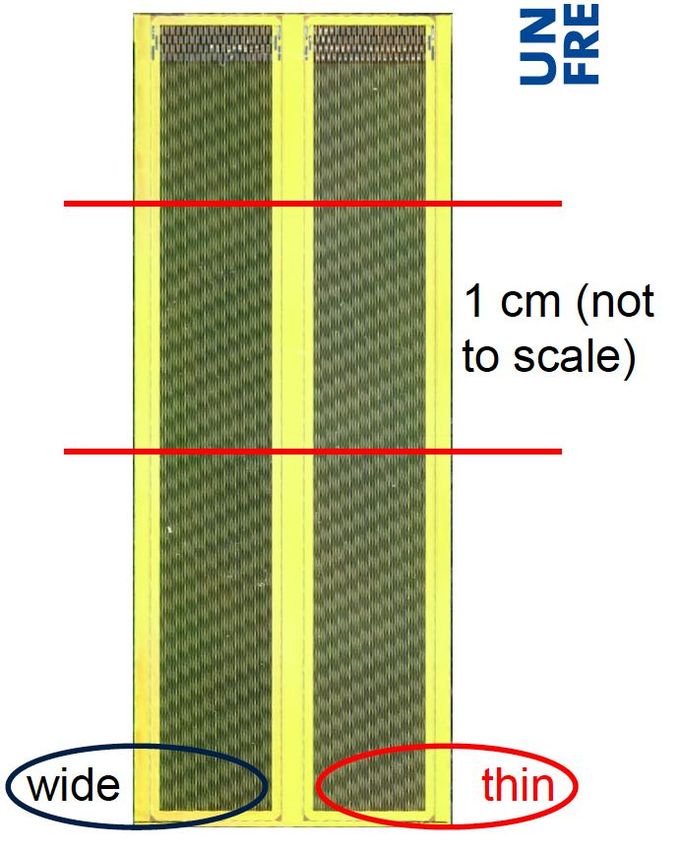
Goals for test beam
• Objectives
   • Sensor behaviour and signal formation
    with electrons
  • Study effects of stitching in the beam
  • Charge collection with different
    voltages

• Data taken at DESY II
   • Electron beam with beam energy 5
    GeV
  • Using beam line 21 (DATURA
    telescope) with ALiBaVa system

                                             8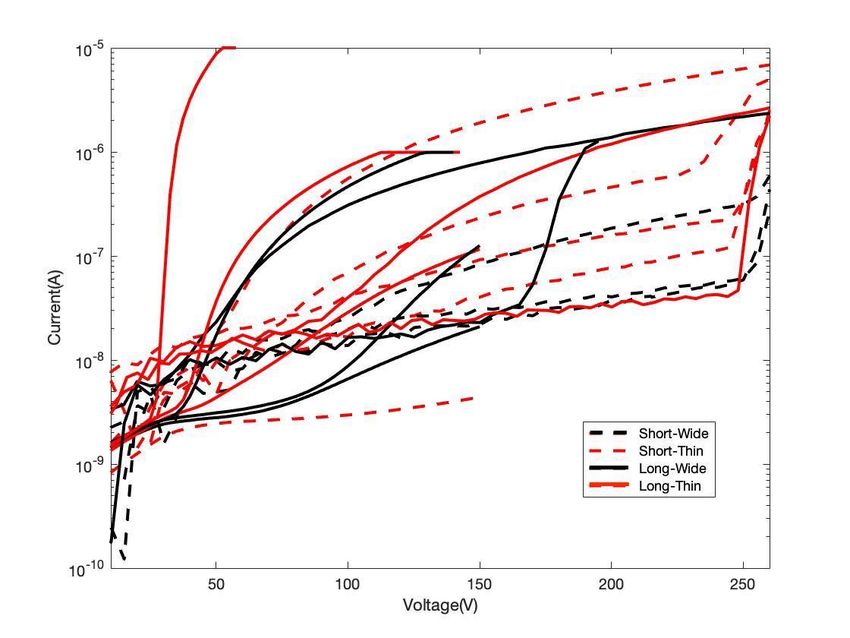
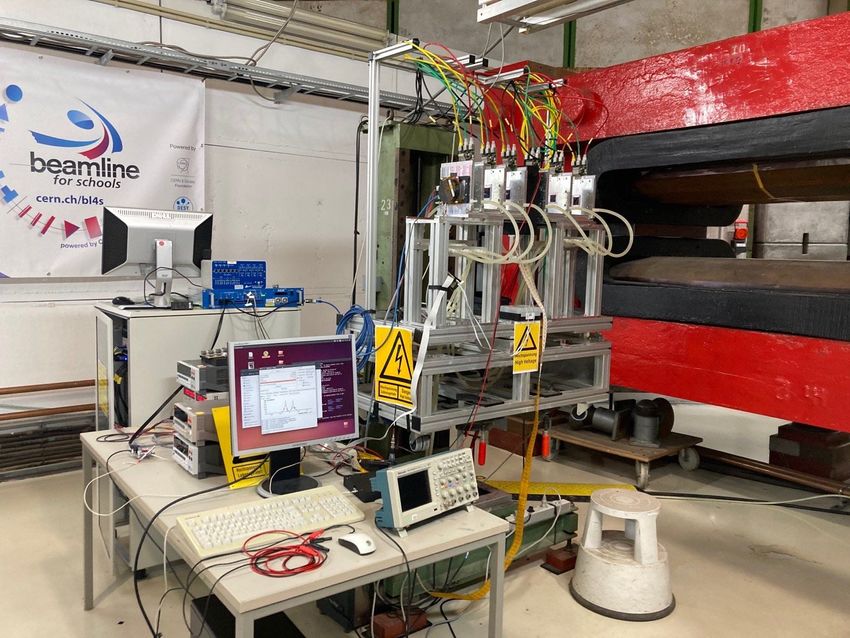
Setup for test beam
                              • Measurement for the long
                               sensor is performed ->
                               connected to the readout
     DUT
                       Beam   • To study the effects of the
                               stitching, sensor is scanned
                               from top to bottom

                              • Temperature is monitored
                               near the sensor

Telescope Planes

                   9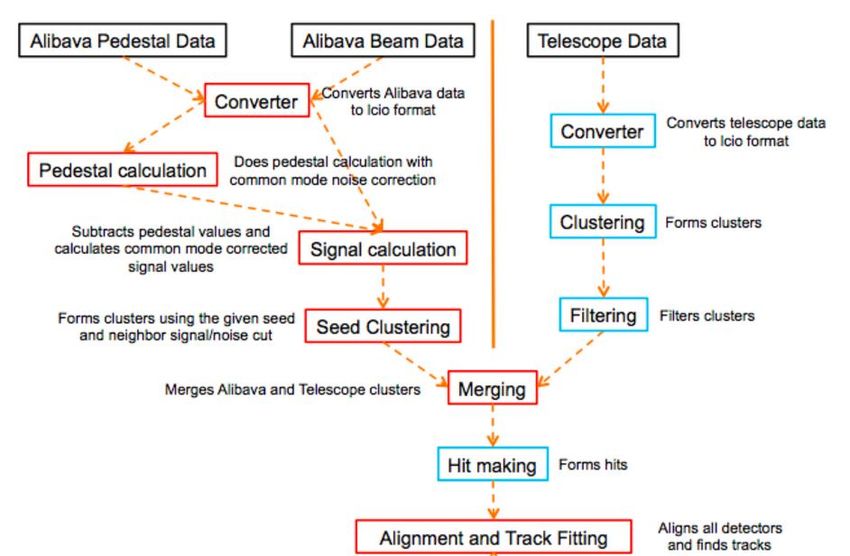
Setup for test beam
                                • Measurement for the long
                                 sensor is performed ->
                                 connected to the readout
     DUT
                        Beam    • To study the affects of the
                                 stitching, sensor is scanned
                                 from top to bottom
                            Y
                                • Temperature is monitored
                                 near the sensor

Telescope Planes

                        X
                   10
ALiBaVa setup
• ALiBaVa is the readout system for silicon
strip sensors particularly to study the
charge collection with source or laser Sensor board with
measurement daughter board setup
• The system uses an analogue readout chip
and has two main components: daughter
board and mother board
• Daughter board contains two beetle
chip(used in LHCb) and is bonded to the
silicon sensors under test
Mother board
• Mother board process the analogue data
that comes from daughter board
11Analysis Strategy
• Using EUTelescope for analysis
Taken from Eda Yildrim thesis
Charge Collection
12ALiBaVa data reconstruction
Pedestal Calculation
Pedestal and Noise Calculation
• Calculate base value and noise for each
channel without any signal
13ALiBaVa data reconstruction
Signal Calculation
Pedestal and Noise Calculation
• Calculate base value and noise for each
channel without any signal
Noise
Common Mode Correction
• Random shifts in voltage -> shifts in the
channel base value
• Extra noise in the readout channel ->
subtracted from the pedestal data
13ALiBaVa data reconstruction
Seed Clustering
Clustering
• Seed : 5 x noise ; Neighbour: 2.5 x noise
• Neighbouring channels clustered with seed
channel -> forms a cluster
• Maximum 5 channels in a cluster
Signal/Noise
5
2.5
A B C
Channels
14ALiBaVa data reconstruction
Seed Clustering
Clustering
• Seed : 5 x noise ; Neighbour: 2.5 x noise
• Neighbouring channels clustered with seed
channel -> forms a cluster
• Maximum 5 channels in a cluster
Asymmetric Eta-Distribution
• Eta distribution shows the measure of
charge division
• Left channel -> increased charge -> cross
talk effect
14ALiBaVa data reconstruction
Seed Clustering
Clustering
• Seed : 5 x noise ; Neighbour: 2.5 x noise
• Neighbouring channels clustered with seed
channel -> forms a cluster
• Maximum 5 channels in a cluster
Asymmetric Eta-Distribution
• Eta distribution shows the measure of
charge division Taken from Thomas
Eichhorn thesis
• Left channel -> increased charge -> cross
talk effect
Plot should be like this -> Charge sharing
can be seen in previous plot around eta =
0.5 14Telescope data reconstruction
Hitmaker Without DUT
Plane 2
Plane 5
Plane 0
Plane 0
Correlation Plot
• Correlation between mimosa plane 1 and plane 3 is better than plane 1 and plane 6
15Telescope data reconstruction
Alignment and Track Fitting Without DUT
Residual Plot
• Residual -> distance between hit and fitted track extrapolation
• First iteration of residual values shows reasonable value
16Summary
• Performed first test beam measurement for passive CMOS strip sensor
• Working on the analysis with EUTelescope
• Initial reconstruction and analysis shows data taken is reasonable
Outlook
• Continuing the analysis further
• New test beam and irradiation studies is also being planned
• New batch of sensor with back-side metallisation that improves the initial electrical
measurement
The measurements leading to these results have been performed at the Test Beam Facility at DESY Hamburg (Germany), a member of
the Helmholtz Association (HGF)
17Thank You for Attention
18Backup 19
ALiBaVa data reconstruction
                                    Seed Clustering

 Finite Impulse Response(FIR) filter
• Calculate the cross talk coefficient for left
  or right channel -> till 2 channels on both
  sides
• Calculate the amount of cross talk signal
• Subtract it from the measured signal

                                                20
You can also read