Thirty years of satellite-derived lava discharge rates at Etna: Implications for steady volumetric output
←
→
Page content transcription
If your browser does not render page correctly, please read the page content below
Thirty years of satellite-derived lava discharge rates at
        Etna: Implications for steady volumetric output
    Andrew J.L. J.L. Harris, Andrea Steffke, Sonia Calvari, Letizia Spampinato

     To cite this version:
    Andrew J.L. J.L. Harris, Andrea Steffke, Sonia Calvari, Letizia Spampinato. Thirty years of satellite-
    derived lava discharge rates at Etna: Implications for steady volumetric output. Journal of Geophysical
    Research : Solid Earth, 2011, 116, pp.B08204. �10.1029/2011JB008237�. �hal-00682568�

                                 HAL Id: hal-00682568
                          https://hal.science/hal-00682568
                                     Submitted on 19 Oct 2021

    HAL is a multi-disciplinary open access            L’archive ouverte pluridisciplinaire HAL, est
archive for the deposit and dissemination of sci- destinée au dépôt et à la diffusion de documents
entific research documents, whether they are pub- scientifiques de niveau recherche, publiés ou non,
lished or not. The documents may come from émanant des établissements d’enseignement et de
teaching and research institutions in France or recherche français ou étrangers, des laboratoires
abroad, or from public or private research centers. publics ou privés.
                                              Copyright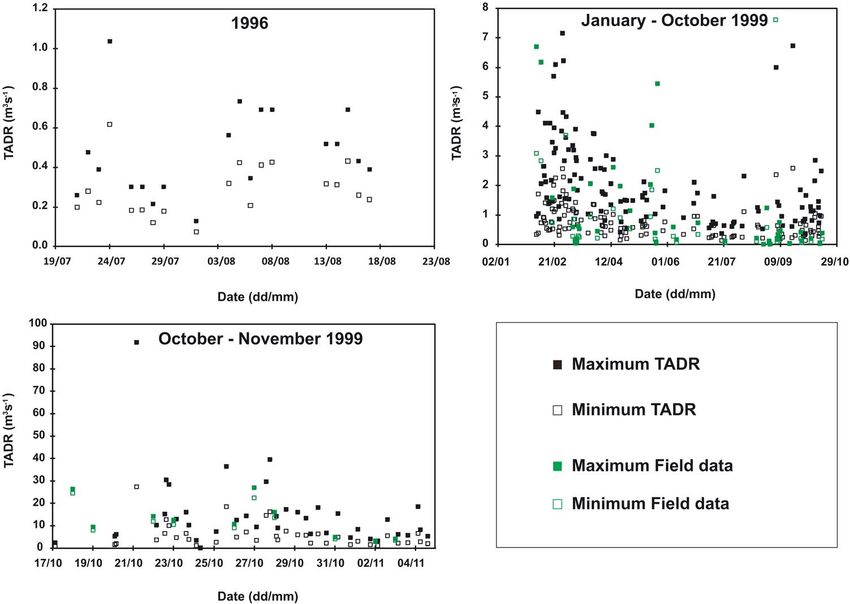
JOURNAL OF GEOPHYSICAL RESEARCH, VOL. 116, B08204, doi:10.1029/2011JB008237, 2011

Thirty years of satellite‐derived lava discharge rates at Etna:
Implications for steady volumetric output
Andrew Harris,1 Andrea Steffke,2 Sonia Calvari,3 and Letizia Spampinato3
Received 18 January 2011; revised 22 April 2011; accepted 10 May 2011; published 9 August 2011.
[1] We present a 30 year long data set of satellite‐derived time‐averaged lava
discharge rates (TADR) for Mount Etna volcano (Sicily, Italy), spanning 1980–2010
and comprising 1792 measurements during 23 eruptions. We use this to classify eruptions
on the basis of magnitude and intensity, as well as the shape of the TADR time series
which characterizes each effusive event. We find that while 1983–1993 was characterized
by less frequent but longer‐duration effusive eruptions at lower TADRs, 2000–2010
was characterized by more frequent eruptions of shorter duration and higher TADRs.
However, roughly the same lava volume was erupted during both of these 11 year long
periods, so that the volumetric output was linear over the entire 30 year period, increasing
at a rate of 0.8 m3 s−1 between 1980 and 2010. The cumulative volume record can be
extended back in time using data available in the literature. This allows us to assess
Etna’s output history over 5 centuries and to place the current trend in historical context.
We find that output has been stable at this rate since 1971. At this time, the output rate
changed from a low discharge rate phase, which had characterized the period 1759 to
1970, to a high discharge rate phase. This new phase had the same output rate as the
high discharge rate phase that characterized the period 1610–1669. The 1610–1669
phase ended with the most voluminous eruption of historic times.
Citation: Harris, A., A. Steffke, S. Calvari, and L. Spampinato (2011), Thirty years of satellite‐derived lava discharge rates at
Etna: Implications for steady volumetric output, J. Geophys. Res., 116, B08204, doi:10.1029/2011JB008237.

1. Introduction                                                           1980s and 1990s, an average output rate of around 1 m3 s−1
                                                                          being apparent in the erupted volume data for 1975–1995
  [2] Many persistently active basaltic volcanoes undergo
                                                                          given by Allard [1997]. However, a change in eruption style
variations in effusive output spanning time scales of days to
                                                                          was witnessed during the flank eruption of July‐August 2001.
months [e.g., Frazzetta and Romano, 1984; Harris et al., 1997;            This event was marked by an anomalous degree of explosivity,
Harris and Neri, 2002; Lautze et al., 2004]. These variations
                                                                          as well as by an eccentric eruption of a fast rising, volatile‐rich
may reflect magma supply conditions, such as the waxing‐
                                                                          batch of amphibole‐bearing magma which contrasted with
and‐waning trend observed when a pressurized volume is
                                                                          activity styles witnessed during the preceding 30 years
tapped [e.g., Wadge, 1981; Harris et al., 2000; Rowland et al.,
                                                                          [Calvari and the Whole Scientific Staff of INGV‐Sezione di
2003], or pulsed supply causing surges in effusion [e.g., Bailey
                                                                          Catania, 2001; Behncke and Neri, 2003a; Corsaro et al.,
et al., 2006; James et al., 2010; Favalli et al., 2010]. However,
                                                                          2007]. This 2001 eruption was followed by a further eccen-
at persistently active systems, such relatively short‐term var-
                                                                          tric eruption in 2002, during which explosivity was again
iations are often lost in longer‐term records that instead show
                                                                          remarkably high [Spampinato et al., 2008]. This has led some
remarkably stable output rates over decadal scales, consistent
                                                                          to suggest that the supply and eruption dynamics at Etna were
with steady state behavior [e.g., Wadge et al., 1975; Allard              changing, with the 2001 event initiating this change [Allard
et al., 1994; Wadge et al., 2010].
                                                                          et al., 2006; Behncke and Neri, 2003a; Clocchiatti et al., 2004].
  [3] For Mt. Etna (Sicily, Italy), Wadge and Guest [1981]
                                                                             [4] Such a hypothesis can be tested using long‐term dis-
showed that, between 1971 and 1981, although being erup-                  charge rate records. For Etna, such a record exists, and is
ted as part of 37 discrete effusive eruptions, output was marked
                                                                          represented by the archive of thermal data available from the
by a linear decadal‐scale trend, with lava being erupted at an
                                                                          satellite‐borne sensor, the Advanced Very High Resolution
average rate of 0.7 m3 s−1. This trend also characterized the
                                                                          Radiometer (AVHRR). This data set now spans 30 years,
                                                                          and dates back to the launch of the first AVHRR sensor on
    1
     Laboratoire Magmas et Volcans, Université Blaise Pascal, Clermont‐   13 October 1978 [Cracknell, 1997]. These data allow extrac-
Ferrand, France.                                                          tion of time‐averaged lava discharge rates following the
    2
      HIGP, SOEST, University of Hawai‘i at Mānoa, Honolulu, Hawaii,
USA.
                                                                          methodology of Harris et al. [1997]. Such measurements
    3
     Istituto Nazionale di Geofisica e Vulcanologia, Catania, Italy.      can be made at a minimum temporal resolution of 12 h, the
                                                                          return period of the NOAA satellites on which AVHRR
Copyright 2011 by the American Geophysical Union.                         is flown. For the period 1980 to 2010, we have identified
0148‐0227/11/2011JB008237

                                                                   B08204                                                            1 of 15
B08204                         HARRIS ET AL.: THIRTY YEARS OF DISCHARGE RATES AT ETNA                                                     B08204

           Table 1. New, Old, and Modified Old Relations Used to Convert Active Lava Area to TADR at Etna Using
           AVHRR and MODIS Dataa
                                                                                                                         Temperature
                                 Relation                                                                               Condition (°C)
           Old
              TADRmin (m3 s−1) = 2.5 × 10⁻⁶ (m s−1) Amax (m2)                                                                100
              TADRmax (m3 s−1) = 43 × 10−6 (m s−1) Amin (m2)                                                                 500
           New
              TADRmin (m3 s−1) = 5.5 × 10⁻⁶ (m s−1) Amax (m2)                                                                100
              TADRmax (m3 s−1) = 150 × 10−6 (m s−1) Amin (m2)                                                                600
           Modified old
              TADRmin (m3 s−1) = 1.7 × 10⁻⁶ (m s−1) Amax (m2)                                                                100
              TADRmax (m3 s−1) = 162 × 10−6 (m s−1) Amin (m2)                                                                1000
             a
              The second column gives the temperature condition used to apply the mixture model of equation (2) and hence to supply the
           required area value for each relation.

1792 cloud‐free images spanning 23 eruptions at Etna,                       [7] Now, the active area can be used to estimate the TADR
yielding a data set capable of testing the hypothesis and                 required to feed flow over the given area (A) using an
detailing any variation in the rate of output over time.                  empirical relation initially proposed by Pieri and Baloga
                                                                          [1986]. The relation reduces to a linear trend whereby
2. Method and Data                                                        [Wright et al., 2001; Harris and Baloga, 2009]:
2.1. Method                                                                                             TADR ¼ xA                            ð3Þ
  [5] Harris et al. [1997] presented a method for obtaining
time‐averaged lava discharge rate (TADR) from satellite                   in which x is the coefficient that defines a positive, linear
thermal infrared data. This was initially tested using AVHRR              relation between TADR and A. Two relations are required,
data collected during Etna’s 1991–1993 eruption. The                      one for the maximum estimated flow area (Amax) and one for
method reduces to the application of an empirical relation that           the minimum estimated flow area (Amin). This yields a range
allows TADR to be obtained from a measure of active lava                  of TADRs, between which the actual value usually lies. The
area [Wright et al., 2001]. The derived discharge rate then               relation is best set through best fitting through calibration
relates to the time‐averaged flux required to spread the lava             using ground‐measured values [Harris et al., 2010]. For
over a given area. The method uses one band of data collected             effusive eruptions at Etna between 1980 and 1999, the rela-
in the thermal infrared, typically between 10 mm and 12 mm,               tion labeled “old” in Table 1 provided good fits with field
and applies a simple mixture model to the pixel‐integrated                measured values when used with Amax obtained assuming a
spectral radiance to extract lava area (RTIR). To do this, the            typical lava surface temperature of 100°C and Amin assuming
pixel is assumed to contain a mixture of lava‐free land and               500°C [Harris et al., 1997, 2000, 2007]. However, best fitting
active lava so that, if the temperatures of the two components            using TADRs derived from LIDAR data collected simulta-
are assumed, the pixel portion occupied by the two compo-                 neously with satellite passes during Etna’s 2006 eruption
nents can be calculated using the pixel‐integrated radiance,              yielded a different best fit relation for this eruption; this
which is written:                                                         relation is labeled “new” in Table 1. For this new case Amax
                                                                          obtained assuming a typical lava surface temperature of
                   RTIR ¼ plava Rlava þ pland Rland                ð1Þ    100°C and Amin assuming 600°C provided the best fit with
                                                                          the LIDAR data [Harris et al., 2010]. For each eruption we
where Rlava and Rland are the spectral radiances for the lava and         thus apply a range of conversion cases, and use the case which
lava‐free land surfaces, and plava and pland are the pixel portions       provides the best fit between satellite‐data‐derived and field‐
occupied by these two components. Note that plava and pland               measured TADR. Based on best fitting using ground‐based
must sum to one, so that pland can also be written 1 – plava. Now,        data acquired during Etna’s 1999 eruptions at the SE Crater
if we can assume values for Rlava and Rland, we can calculate             and Bocca Nuova, we also applied a modified version of the
the pixel portion occupied by active lava from:                           old relation, as given in Table 1. This “modified old” relation
                                                                          uses with Amax obtained assuming a typical lava surface
              plava ¼ ðRTIR  Rland Þ=ðRlava  Rland Þ:            ð2Þ    temperature of 100°C and Amin assuming 1000°C [Harris
                                                                          and Neri, 2002].
  [6] Following Harris et al. [1997], the radiance of the lava‐
                                                                            [8] We apply these conversions to (1) generate TADR
free land can be obtained from surrounding, active lava‐free
                                                                          time series for each eruption for which satellite data are
pixels, and the lava surface radiance can be assumed over a
                                                                          available during the period 1980–2010 and (2) assess,
range of radiances (obtained from the equivalent temperature
                                                                          through comparison with independent field measurements
range). The result yields a range of pixel portions occupied by
                                                                          of TADR, which best fit relation applies to each eruption
the lava, ranging from a maximum value obtained with the
                                                                          (as done in Figures 1–3). We use these data to volumetri-
maximum assumed lava temperature, to a minimum value
                                                                          cally characterize each eruption in terms of the TADR trend,
obtained with the minimum assumed lava temperature.
                                                                          as well as the maximum and mean TADRs that feed each
Multiplying the pixel portions by pixel area, and summing for
                                                                          eruption. By integrating the TADRs for each eruption (using
all hot pixels containing active lava, gives the active lava area.

                                                                    2 of 15
B08204 HARRIS ET AL.: THIRTY YEARS OF DISCHARGE RATES AT ETNA B08204
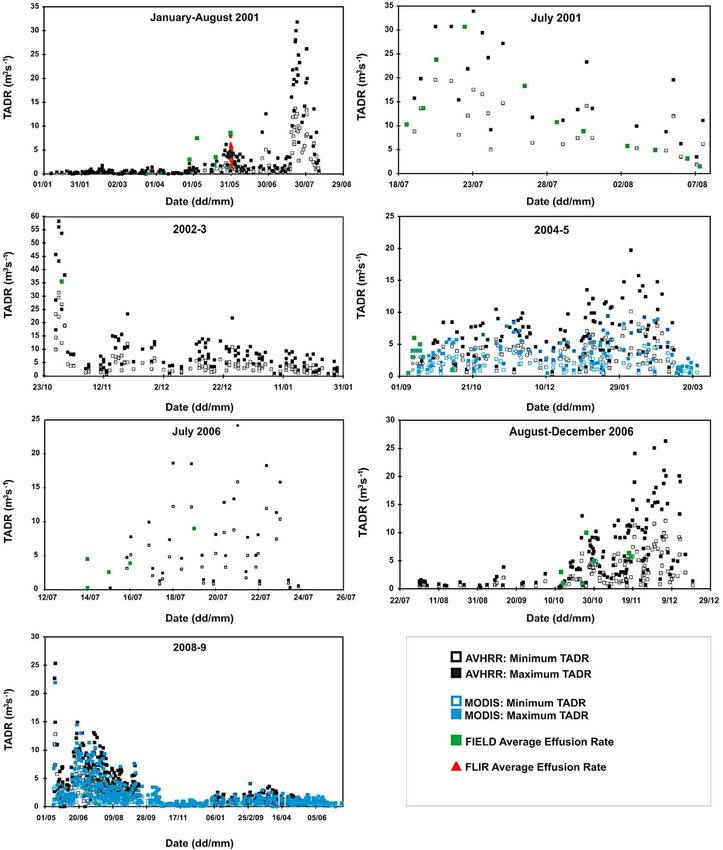
Figure 1. Satellite‐data‐derived TADR time series for each major (>107 m3) effusive eruption at Etna
during the period 1980 to 1993.
trapezium rule) we also provide an estimate for the volume corrected for atmospheric and emissivity effects, and pixel
erupted during each eruption, as well as the mean output rate areas were calculated as a function of the sensor instantaneous
(MOR) for each eruption, this being the total volume erupted field of view and scan angle. Data between 10 and 12 microns
divided by the eruption duration [Harris et al., 2007]. We can need to be corrected for atmospheric upwelling radiance (Rup),
thus use our data set to define each effusive eruption in terms atmospheric transmissivity (t) and surface emissivity follow-
of intensity (maximum TADR) and magnitude (total volume ing ("):
erupted).
RTIR ¼ Rsat Rup =" ð4Þ
2.2. Data
[9] To apply the methodology described above we used all Rsat being the at‐satellite radiance. We estimated Rup and t as a
AVHRR data obtained by the University of Dundee (Dundee, function of scan angle using the MODTRAN atmospheric
Scotland) receiving station between 1980 and 2010. Following code, where typical values for a surface at an altitude of 0 m
Harris et al. [1997], we used the band 4 (10.3–11.3 mm) pixel‐ (at nadir and using a U.S. Standard atmosphere), averaged
integrated temperatures, where all data were calibrated and between 10 and 12 mm, are 1.79 × 10⁻⁵ W cm−2 sr−1 mm−1 and
corrected for nonlinearity effects [e.g., Brown et al., 1993; 0.96, respectively. Emissivity averaged over the same wave
Weinreb et al., 1990; Kidwell, 1995] by the NERC based at the band is also 0.96 (obtained from reflectance spectra for a
Plymouth Marine Laboratory (Plymouth, UK). Data were then sample of Etna ’a’a).
3 of 15B08204 HARRIS ET AL.: THIRTY YEARS OF DISCHARGE RATES AT ETNA B08204
Figure 2. Satellite‐data‐derived TADR time series for each major (>107 m3) effusive eruption at Etna
during the period 1996 to 1999.
[10] For the period 2000–2010, we also used data from data (see Table 2). We also collated all available lava flow
band 31 (10.78–11.28 mm) of the Moderate Resolution volume data for the period 1971–2010, as given in
Imaging Spectroradiometer (MODIS) [Salomonson et al., Appendix A. This allowed us to fill all of the gaps in the
1989; Barnes et al., 1998]. This sensor was first launched satellite‐derived record.
in 1999, and provides data with a similar spatial and tem-
poral resolution to the AVHRR, and at a similar wavelength. 3. Results
These data were processed in the same way. Here, the full
[12] The satellite‐derived TADR time series for each
database is, for the first time, collated in one place (see
effusive eruption are given in Figures 1–3. The full database
auxiliary material).1 While the pre‐1993 portion of this
on which these plots and following treatments are based are
database was processed by Harris [1996], all post‐1999 data
given, for each major effusive eruption listed in Table 3, as
were processed by Hawaii Institute of Geophysics and
data files in the auxiliary material.
Planetology staff during various eruption crises and trans-
mitted to Istituto Nazionale di Geosfisica e Vulcanologia‐ 3.1. Classification of Eruptions on the Basis
Sezione di Catania, as well as Centro Nazionale Terremoti of Satellite‐Derived TADR Trends
(Rome), during those crises [Harris et al., 2007]. All data [13] Using our satellite‐derived TADR time series we
have been reprocessed here to check for correct application define four types of effusive event on the basis of charac-
of TADR conversion coefficients (see auxiliary material). teristic trends in the TADR time evolution during each
[11] The main effusive events that occurred at Etna eruption. Type I and II trends were defined by Harris et al.
between 1980 and 2010 are listed in Table 2, along with [2000] using the 1980–1996 portion of this data set and
their location, duration and number of available AVHRR involve the following trends:
and MODIS images. We see that there were around 36 [14] 1. Type I trends are characterized by a rapid waxing
effusive events, of which 25 lasted more than 1 day. During phase, followed by a longer waning phase, and are consistent
the period, AVHRR and MODIS data were available for with tapping of a pressurized volume [Wadge, 1981]. In
23 events, the remaining events being too short to capture, Type I eruptions ∼50% of the volume is typically erupted
given the 12 h separation of AVHRR and MODIS passes, or in the first ∼25% of the total eruption time. Five eruptions
because of cloud cover. For these 23 events, 1792 images show Type I trends, these being the eruptions of 1983, 1986–
were available of which 509 were from MODIS. We see 1987, 1991–1993, 2002–2003 and 2008–2009 (Figure 4a).
that a total of 16 events comprise data sets of more than [15] 2. Type II trends are characterized by relatively stable
10 images, allowing TADR time series to be generated for and low TADRs that span 0.1 and 5 m3 s−1, with ∼50% of
all of the main effusive events, with the exception of those the volume erupted in ∼50% of the total eruption time.
occurring during 1997–1998, for which we have no satellite Type II trends tend to be associated with summit eruptions.
They are thus consistent with nonpressurized overflow from
1
Auxiliary materials are available at ftp://ftp.agu.org/apend/jb/ the summit craters. Four eruptions show Type II trends,
2011jb008237.
4 of 15B08204 HARRIS ET AL.: THIRTY YEARS OF DISCHARGE RATES AT ETNA B08204
Figure 3. Satellite‐data‐derived TADR time series for each major (>107 m3) effusive eruption at Etna
during the period 2000 to 2010.
these being the eruptions of 1984, 1985, 1996 and 1999’s those of the SE Crater in 2001, plus those of 2004–2005 and
SE Crater eruption (Figure 4b). August‐December 2006 (Figure 4c). This trend likely results
[16] In new data processed for the post‐2000 period we from the ascent of a magma batch which pushes a volume of
find two other trends, Types III and IV. Of these two trend degassed magma ahead of it, and is consistent with an
types, the Type III trend has been described, and explained, imbalance observed between TADRs and SO2 emission rates
by Steffke et al. [2011] through comparison of satellite‐ during the opening phase of the 2004–2005 eruption [Steffke
derived TADRs and ground‐measured SO2 fluxes for the et al., 2011]. Eruption of the degassed volume contributes to
2004–2005 and 2006 eruptions; the Type IV trend has been the opening, low TADR, phase; arrival of the ascending batch
examined by Harris and Neri [2002], whereby: contributes to the high TADR terminating phase.
[17] 3. Type III trends are characterized by TADRs that [18] 4. Type IV trends are extremely pulse‐like. Peaks in
increase with time and are associated with three eruptions, such trends are of high amplitude and attain values of 10s to
5 of 15B08204 HARRIS ET AL.: THIRTY YEARS OF DISCHARGE RATES AT ETNA B08204
Table 2. Main Effusive Eruptions at Etna, 1980–2010a
Ground‐Based
Start Date Stop Date Duration Measurements Number of AVHRR
Eruption Location (dd‐mm‐yy) (dd‐mm‐yy) (days) (Sourceb) and MODIS Images
1980 (1 Sep) NE crater 01‐09‐80 01‐09‐80B08204 HARRIS ET AL.: THIRTY YEARS OF DISCHARGE RATES AT ETNA B08204
Figure 4. Classification of TADR time series given in Figures 1–3 by trend type. TADRs smoothed with
a two‐point running mean calculated for the maximum TADR bound are given so as to highlight the
dominant trend.
100s of meters cubed per second. Such trends likely relate to intense strombolian and lava fountain activity fed vigorous
the rise and eruption of a series of rapidly ascending magma channelized ’a’a lava flows at TADRs of up to 120 m3 s−1
batches. The first eruption of this type was the October‐ [Harris and Neri, 2002]. Two other eruptions show this
November 1999 eruption of the Bocca Nuova. This event Type IV trend, those being the July‐August south flank
was marked by 11 discrete paroxysmal events during which eruption of 2001, plus the July 2006 eruption (Figure 4d).
7 of 15B08204 HARRIS ET AL.: THIRTY YEARS OF DISCHARGE RATES AT ETNA B08204
Table 4. Volumetric Characteristics for the Two Main Periods of Effusive Events Identified Between 1980 and 2010a
Period Eruption Duration (days) Volume (×106 m) Mean Output Rate (m3 s−1)
1 1983 131 103 9.1
1 1984 172 46 3.1
1 1985 (Mar‐Jul) 124 18 1.7
1 1986–1987 120 49 4.7
1 1991–1993 471 183 4.5
Total (number = 5) 1018 399 4.5
Mean 204 80 4.6
3 2001 177 17 1.1
3 2001 23 38 19.2
3 2002–2003 94 50 6.2
3 2004–2005 182 64 4.1
3 2006 (Jul) 10 2 2.0
3 2006 63 37 6.9
3 2008–2009 420 68 1.9
Total (number = 7) 969 276 3.3
Mean 138 39 5.9
3b 2001 23 38 19.2
3b 2002–2003 94 50 6.2
3b 2004–2005 182 64 4.1
3b 2006 (July) 10 2 2.0
3b 2006 63 37 6.9
Total (number = 5) 372 191 5.9
Mean 74 38 7.6
a
Period 3b is the same as period 3 but without the two long‐duration SE Crater eruptions that began and ended the period.
Volumes are obtained from integrating the midpoint TADR value though time. For each period, mean output rate has been
calculated by dividing the total volume emplaced by all eruptions during each period by the total duration of all activity during
the same period. This is given on the “total” line below each period. Also given is the mean MOR for individual eruptions
within each period (given on the “mean” line below each period).
3.2. Time Distribution of Effusive Event Types 2004–2005 and August‐December 2006 show TADRs that
[19] If we examine the distribution of events by Type build toward the end of the eruption, giving them also a
through time we find that all of the large (>107 m3) volume Type III trend. The remaining two eruptions of this period
eruptions prior to 1999 involved eruptions with Type I or II are the 2002–2003 and 2008–2009 eruptions, which both have
trends (Table 3), as already described by Harris et al. Type I trends.
[2000]. Note, though, that we reclassify Etna’s February‐ [21] It is worth stressing that, although Type II and IV
November 1999 eruption. This eruption was originally trends may look similar, the two classes are distinguished by
classified as Type I by Harris et al. [2000]. This assignment the range of variability during pulses that interrupt the
was made on the basis of a limited data set. However, otherwise flat trends. For Type II trends the pulses generally
processing of the full AVHRR data set available for this have ranges of between ∼1 and 7 m3 s−1, whereas pulses in
eruption reveal a Type II, slowly oscillating, trend as also Type IV trends have ranges of up to 100 m3 s−1. As noted
found in the field‐derived TADRs of Calvari et al. [2003]. above, the TADR levels are also quite different between
In contrast, the Bocca Nuova eruption that occurred in the Type II and IV events.
same year, during October and November, had a strongly [22] Finally, we have classified the eruptions based on the
pulsating character, as detailed by Harris and Neri [2002], dominant or primary trend. Several eruptions have second-
meaning that we here classify this eruption as Type IV. We ary trends overprinted on the primary trends. For example,
also note that the opening, high TADR, phase of the 1983 while all Type III trends appear to have Type IV trends
eruption was missing from the AVHRR‐derived data set due overprinted, the Type IV trends of the October‐November
to cloud cover. The opening phase was, however, recorded 1999 and July‐August 2001 eruptions also show a secondary
by Frazzetta and Romano [1984] whose field data clearly declining trend with time, suggestive of a Type I influence.
show this eruption to be of Type I character. Thus, Frazzetta Note too, that the 2002–2003 eruption has been classified as
and Romano’s [1984] field‐derived TADR for this opening Type I. This is mainly due to the contribution of high TADR
phase have been added to the plot in Figure 4 to justify its flows during the opening phase on the northeast flank. Once
classification as Type I. these flows shut down, Type II trends are apparent for the
[20] Type III and IV trends dominate from 1999 onward following south flank emission.
(Table 3). The first event in this series, the January‐July 3.3. Groupings
2001 eruption of the SE Crater, shows a series of oscilla-
tions which, as detailed by Lautze et al. [2004], increase in [23] Calibration factors that need to be used to provide the
amplitude toward the July‐August 2001 flank eruption. best fit to independent ground‐based TADR estimates, as
These oscillations lend a Type III character to the January‐ given in Table 1, produce a grouped data set, with each
July 2001 eruption. Such Type III behavior is then also grouping requiring a different calibration factor to achieve
apparent during the July 2006 eruption of the SE Crater. Of best fit. Each grouping also has distinct and characteristic
the remaining post‐2001 eruptions, both the eruptions of maximum recorded TADR (Table 3), as well as eruption
frequencies, durations, volumes and MORs (Table 4). This
8 of 15B08204 HARRIS ET AL.: THIRTY YEARS OF DISCHARGE RATES AT ETNA B08204
allows us to divide our data into two 11 year long periods on Period 1, being between 20 and 58 m3 s−1, with an average
the basis of the volumetric character of the eruptions of between 3 and 24 m3 s−1 during Period 3, compared with
occurring within each period. These two periods are sepa- a range of 4 and 35 m3 s−1 and averages of between 2 and
rated by a third period of low volumetric output, with the 11.5 m3 s−1 during Period 1 (Table 3).
two high‐volume periods spanning 1983–1993 (Period 1) [28] These differences are accentuated if we remove the
and 2000–2010 (Period 3). two long‐duration SE Crater eruptions that began and ended
3.3.1. Period 1: 1983–1993 the period, as done in Table 4 (Period 2b).
[24] The first period was marked by four eruptions each [29] Best fits with field data, from the sources indicated in
involving the output of 107 m3 of lava or more. Durations Table 2 and given in the auxiliary material, also revealed
ranged between 120 and 471 days (mean = 204 days) to that the “old relation” no longer applied to the second period
emplace lava volumes of between 18 and 183 × 106 m3 eruptions, with the “new relation” instead applying to all
(mean = 80 × 106 m3) at mean output rates of 1.7 to 9.1 m3 eruptions in this series. For example, applying the “old
s−1, with a mean of 4.6 m3 s−1 (Period 1, Table 4). Maxi- relation” to the first three months of the 2004–2005 data set
mum TADRs were between 4 and 35 m3 s−1, with an and integrating the TADRs through time yields an erupted
average of between 2 and 12 m3 s−1 (Table 4). volume of ∼15 × 106 m3, compared with a ground‐measured
[25] Best fits with field data, revealed that the “old rela- volume of between 18.5 and 32 × 106 m3 [Burton et al.,
tion” applied to this series of eruptions, as already detailed 2005]. However, use of the “new relation” yields a value
by Harris et al. [2000]. For example, applying the “old ∼28 × 106 m3, a value more‐or‐less central to the field‐
relation” to the 1991–1993 data set and integrating the measured volume. Likewise, applying the “old relation” to
TADRs through time yields an erupted volume of 183 ± the TADRs for the lava flow field of the Lower Fissure
72 × 106 m3, compared with a volume measured using System at 2100 m a.s.l. (the LFS1 flow field of Coltelli et al.
Electronic Distance Measurement by Stevens et al. [1997] [2007]) active during the 2001 south flank eruption, and
of 185 ± 22 × 106 m3. integrating the TADRs through time, yields an erupted
3.3.2. Period 2: 1994–1999 volume of 13 ± 8 × 10⁶ m3. This is low when compared with
[26] Following the eruption of 1991–1993, the most the volume of 21.4 × 10⁶ m3 acquired from subtraction of
voluminous effusive event of the last 3 centuries [Calvari digital elevation models generated during the eruption by
et al., 1994], there was a three year hiatus in effusive Coltelli et al. [2007]. Instead, use of the “new relation”
activity until 1996 (Appendix A). This period was followed yields a value of 22.2 ± 6.1 × 10⁶ m3, again in excellent
by dominantly intracrater summit activity [Neri et al., 2005; agreement with the target value.
Allard et al., 2006], and then by the two phases of the 1999
eruption (from SE Crater and Bocca Nuova [Calvari et al., 4. Discussion
2003; Harris and Neri, 2002]). This period involved eight
effusive events and was volumetrically transitional between [30] Good fits between ground‐measured volumes and
Periods 1 and 3, with the 1999 SE Crater and Bocca Nuova volumes obtained from integrating up to 656 satellite‐
eruptions requiring application of the “modified old rela- derived TADRs collected over eruptions lasting up to
tion.” The Bocca Nuova eruption also had a particularly 500 days indicate that the satellite‐based conversion is valid
high maximum TADR and was the first non‐Type I or II and can be trusted. In the case of the 2008–2009 eruption,
event of our series (Table 3). During this 6.75 year long for example, any systematic error in our TADRs would
period, 36 × 106 m3 of lava were erupted at a TADR of yield a large error in the final volume estimate obtained from
0.2 m3 s−1. Rothery et al. [2001] showed an increasing integrating 656 TADRs over 420 days. However, the sat-
volcanic radiance trend between 1996 and the end of 1999. ellite‐data‐derived volume of 68 × 106 m3 is identical to the
This would convert to an increasing TADR trend, which ground measured volume, and backs up our good fits
builds to culminate in the high‐intensity events experienced between the ground‐measured and satellite‐TADR‐derived
by the Bocca Nuova in 1999. volumes for the 1991–1993, 2001 and 2002–2005 lava flow
3.3.3. Period 3: 2000–2010 fields. These data have now been collected over 30 years
[27] The third period was marked by seven eruptions and used to track and assess effusion rates during individual
involving the output of 107 m3 of lava or more, with a total eruptions [Harris et al., 1997; Harris and Neri, 2002;
erupted volume similar to that of Period 1. However, Lautze et al., 2004; Harris et al., 2007; Vicari et al., 2009;
although the frequency of eruption was higher in Period 3, Harris et al., 2010]. Here, these data are collated allowing
eruption durations tended to be shorter, with a mean dura- them to be used as a resource to statistically define and track
tion of 138 days, compared with a mean of 204 days for Etna’s longer‐term volumetric output behavior.
Period 1 (Table 4). Volumetrically, the character of the [31] Our analysis of this database shows a change in the
Period 3 eruptions also contrasts with those of Period 1 in eruptive style, defined by volumetric properties, following
that (1) emplaced lava volumes during individual eruptions the 2001 eruption (as seen in Tables 3 and 4). We find that,
were smaller, being between 2 and 68 × 106 m3 (mean = while the period 1983–1993 was characterized by less fre-
39 × 106 m3) during Period 3, compared with a range of 18 quent, but longer‐duration effusive eruptions at lower
to 183 × 106 m3 (mean = 80 × 106 m3) during Period 1 TADRs, 2000–2010 was characterized by more frequent
(Table 4); (2) the shorter durations for Period 3 eruptions effusive eruptions of shorter duration and higher TADRs.
meant that MORs were typically higher than during Period 1 Another important difference is the mean lava volume of
eruptions, Period 3 MORs having a mean of 5.9 m3 s−1 eruptions, the mean volume for eruptions between 1983 and
compared with 4.6 m3 s−1 during Period 1 (Table 4); and 1993 being a factor of two higher than those for eruptions
(3) maximum TADRs were higher in Period 3 than during between 2000 and 2010, being 80 × 106 m3 for the former
9 of 15B08204 HARRIS ET AL.: THIRTY YEARS OF DISCHARGE RATES AT ETNA B08204
that generated the Type I and II trends of the first, 1983–
1993, period. Together, these changes are consistent with
more efficient ascent of batches from depth during 2001–
2010, to erupt lava with a modified rheology and output rate
when compared with the 1983–1993 period. This change
may have been aided by the opening up of surface pathways
for magma ascending from the deep source, to result in
pathways which bypassed the central conduit and generated
eccentric eruptions, as in 2001 and 2002–2003. This has
been argued to be facilitated by processes such as flank slip
[Acocella et al., 2003; Neri et al., 2005; Solaro et al., 2010;
Ruch et al., 2010].
[32] However, in terms of long‐term output nothing
changed over the 1980–2010 period. If we plot the cumulative
lava volumes for the two 11 year long periods spanning 1983–
1993 and 2000–2010 we witness identical slopes (Figure 5a),
meaning that the time‐averaged output over the two periods
was the same. As a result, the effused volume built at a steady,
time‐averaged rate of between 0.7 and 0.9 m3 s−1 which was
stable through 2001. Thus, output remained steady even
through the major change in style and location of surface
emissions that occurred in 2001. Even the movement of
Etna’s eastern flank [Ruch et al., 2010; Solaro et al., 2010],
responsible for the triggering of the 2004–2005 flank eruption
[Burton et al., 2005; Neri and Acocella, 2006], did not pro-
duce any response in the long‐term supply, as plotted in
Figure 5. All that changed was the way in which this volume
was partitioned between, and during, individual effusive
events, as well as the spreading properties of the erupted lava.
Figure 5. (a) Cumulative volume plots for 1983–1993 [33] The steady output rate recorded between 1980 and
(black) and 2000–2010 (gray). Each is plotted as a function 2010 has a time‐averaged average value of 0.8 m3 s−1. This is
of years since the beginning of each 11 year long period. (b) similar to the value of 0.7 m3 s−1 obtained by Wadge and
Cumulative volume plot for the period 1970–2010 gener- Guest [1981] for the period 1973 to 1980. We can thus
ated using the volume data given in Appendix A. For confirm that this trend has remained constant at least since
each plot, the y = m x linear best fit is given, where the m 1971, as is apparent if we plot our data together with that of
value is given in units of cubic meters per year. Wadge and Guest [1981], as done in Figure 5b. Going further
back still, we can use the data of Wadge et al. [1975] to
period and 39 × 106 m3 for the latter (Table 4). This change compare the 1971–2010 trend with those trends in operation
begins with the activity of 2001, suggesting that this year since 1550, as done in Figure 6. The period prior to 1971 has
marked a change in the volumetric style of effusion. This already been examined by Wadge et al. [1975] who pointed to
change in activity style has already been explored in several two main segments in the cumulative volume plot: (1) a
previous studies which point to the increased explosivity segment spanning 1610 to 1669 characterized by a relatively
and different chemistry of the erupted products during 2001 high output rate of 0.8 m3 s−1 and (2) a segment spanning
and 2002–2003 [Behncke and Neri, 2003a; Clocchiatti 1759 to 1959 characterized by lower output rates of 0.2 m3
et al., 2004; Métrich et al., 2004; Corsaro et al., 2007]. s−1. We note that the Wadge et al. [1975] estimates for 1669–
After 2001, a new relation also has to be applied to our 1971 were largely based on flank eruptive volumes. Instead,
satellite data to derive TADRs that fit well with ground‐ post‐1971 volumes are much closer to a complete flank +
based data. This new relation, as well as the old relation, is summit budget. As discussed by Wadge and Guest [1981]
given in Table 1. If we compare the two relations we see the flank‐only rate for 1759–1970 was 0.17 m3 s−1, rising
that, to obtain the same areal coverage as was achieved to 0.39 m3 s−1 if the 1971–1981 flank/summit ratio is used.
using the old relation, a higher TADR is required in the new Given this uncertainty, a better value for the second segment
relation. This suggests a rheological change in the erupted would thus be 0.2 ± 0.1 m3 s−1.
lava, where an increase in viscosity and/or yield strength [34] It is noteworthy that, since 1971, we have returned to
would force a decrease in the area over which a given a trend identical to that witnessed prior to the 1669 eruption.
volume of lava could spread at any given TADR. That all This new trend has now been stable over 40 years. Indeed, if
eruptions from 2001 onward required this new relation we consider the period 1971–2010 we find that 960 ×
indicates that all lavas erupted since 2001 were subject to 106 m3 of lava was erupted onto the flanks of the volcano in
these new conditions. In addition, the time variation in 40 years, with the volume being fairly evenly partitioned
TADR witnessed during each eruption changed from 2001 between these four decades (Table 5) to define a linear trend
onward, with their Type III and IV trends being more in cumulative output, which increases at a time‐averaged
consistent with batch‐like ascent, as opposed to the pres- rate of 0.8 m3 s−1 (Figure 5).
surized or overflow‐fed release of central conduit magma
10 of 15B08204 HARRIS ET AL.: THIRTY YEARS OF DISCHARGE RATES AT ETNA B08204
Figure 6. Cumulative volume plot for 1500–2010, with the main output phases distinguished (high‐out-
put phases are in black, and low‐output phases are in gray). Data for 1610–1970 are from Wadge et al.
[1975], and those for 1970–2010 are from Appendix A. Cumulative volume as a function of years since
the beginning of each phase is given to the left, with the y = m x linear best fit for each phase, m being
given in units of cubic meters per year.
[35] During the high output rate phase of 1610–1669, Guest and Duncan, 1981; Clocchiatti et al., 1988; Hughes
eruptions were dominated by flank events [Wadge et al., et al., 1990; Condomines et al., 1995; Corsaro et al., 1996].
1975]. This phase was terminated by the effusive eruption At the same time, the style of eruptive activity changed, with
of 1669. The 1669 eruption was the largest historical eruption the new period showing an increasing number of summit
recorded at Etna in terms of magnitude and intensity, with eruptions [Wadge et al., 1975], as well as the lower time‐
∼1 km3 of lava being erupted in about four months of eruption averaged output rates apparent in Figure 6.
(MOR ≈ 100 m3 s−1), to build a ∼17.5 km long tube‐fed lava [36] The transition back to a high output rate period was
flow field that reached the sea south of Catania, destroying heralded by the 1971 eruption [Wadge and Guest, 1981],
part of the city [Corsaro et al., 1996; Crisci et al., 2003]. This followed a period of reorganization of the summit area, and
eruption signaled the end of an eruptive cycle that had lasted coincided with the formation of the SE Crater. Guest [1973]
a few centuries and that had erupted plagioclase‐rich lava, maps the development of a fissure that cut the summit with a
resulting from crystallization of a magma stored at shallow NW‐SE trend in 1956. This fissure eventually joined the
levels within the volcanic pile [Guest and Duncan, 1981; Bocca Nuova and SE Craters, with the Bocca Nuova opening
Corsaro et al., 1996]. After the 1669 eruption, emptying of the in 1968 at the NW end of the fissure, and the SE Crater
shallow system resulted in a caldera collapse of the summit forming at the SE end in 1971. The opening of the SE Crater
area [Guest, 1973]. The volcanic activity that followed was coincides with the beginning of the modern, high output rate
significantly different in terms of both composition and period. As noted by Branca and Del Carlo [2004], this period
volumes of lava erupted [Wadge et al., 1975; Tanguy, 1980; was marked by an increase in summit activity, but also by
Table 5. Erupted Lava Volumes and Durations of Effusive Activity at Etna During the Period 1970 to 2010 Broken
Out by Decadea
Number of Frequency Volume MOR Effusion Percent Time
Decade Effusive Eruptions (Eruptions per Year) (×106 m3) (m3 s−1) (days) in Effusion
1970 30 3 182 0.6 1108 30
1980 15 1.5 258 0.8 642 18
1990 10 1 222 0.7 824 23
2000 13 1.3 299 0.9 1133 31
1970–2010 68 1.7 960 0.8 3707 25
a
From data given in Appendix A.
11 of 15B08204 HARRIS ET AL.: THIRTY YEARS OF DISCHARGE RATES AT ETNA B08204
voluminous flank eruptions and a high number of events from then, in the next decade, another 300 × 106 m3 of lava will be
the newly formed SE Crater. Volumetrically, our data show erupted onto Etna’s flanks. Uncertainty arises, however, in
that 542 × 106 m3 of the 779 × 106 m3 of lava erupted between projecting how superficial effects, such as flank spreading, will
1980 and 2010 (or 70% of the total lava erupted) was associ- serve to determine the way in which this volume is distributed
ated with flank activity. It is worth noting that this figure does across the decade. Will it be erupted in a small number of
not change if we take into account also the volumes erupted longer, lower TADR events (as during 1983–1993), or will it
by short‐lived fire fountain events (Appendix B). In addition, be erupted in a larger number of shorter, higher TADR events
21 of the 38 (55%) of the effusive events listed in Table 2 were (as during 2000–2010)? If the output trend of the volcano
focused on the SE Crater, with all nine events since 2003 being remains similar to that observed post‐2001, we can expect
centered on the SE Crater. Behncke and Neri [2003b] also point short‐duration effusive phases with high discharge rates. The
to the incidence of more frequent and more voluminous summit key question is, though, when will this current phase of high
and flank eruptions since 1950, and remark that [Behncke and output end, and how will that end be marked?
Neri, 2003b, p. 475] “if this trend continues, the activity of
Etna might become similar to that of the 17th Century.” We can Appendix A
confirm that this is indeed the case, and the 17th century trend
has now been in place for 40 years. [40] Volumes, durations and mean output rates for effu-
sive activity at Etna during the period 1970–2010 can be
5. Conclusion collated using the published data listed at the end of this
appendix, plus the data generated by us using the satellite
[37] If we consider the period 1971–2010, Etna experi- data. The resulting collation is given in Table A1. The types
enced effusive activity on 3735 days, or 25% of the time of eruptive event included in this collation are discussed in
(Table 5). Through this time there was variation in terms of Appendix B, where we note that volumes erupted during
the frequency and duration of effusive activity, but erupted explosive events are not included. Nor do we include the
volumes on a decadal scale were typically of the order of short‐lived fountaining events that occurred between 1996
300 × 106 m3 to keep the mean output rate between 0.6 and and 2001, although the events grouped within the 1990
0.9 m3 s−1; thereby maintaining a typical rate of 0.8 m3 s−1 eruption tabulated in Table A1 are actually four short foun-
(Table 5). This compares with the rate of 0.7 m3 s−1 taining events (as broken out in Table 2) lasting 0.375 h,
obtained by Wadge and Guest [1981] for the period 1971– 0.46 h, 0.375 h and 0.2 h.
1981, and 0.8 m3 s−1 for the period 1610–1669.
[38] The 30 year long satellite‐derived discharge rate data set Appendix B
allows us to define the decadal volumetric behavior of the
system, as well as to detail the volumetric trends and character [41] Satellite‐derived volumetric data presented in this
of individual eruptions. This shows that, although the decadal‐ paper cover a large proportion of the effusive products
scale output remained stable between 1980 and 2010, the style emplaced by Etna’s eruptions during the past 30 years. These
with which this volume was erupted changed, with the 2001 include almost all voluminous flank and summit effusive
eruption triggering a change in style: in 2001 eruption dura- eruptions lasting more than 6 days. Appendix A lists 20
tions, syneruption volumetric trends, peak discharge rates and effusive events lasting greater than 6 days between 1980 and
mean output rates all changed, as did the relation between 2010, of which we have satellite data for 17. Just three are
discharge rate and flow area. Thus, although trends in long‐ missing due to gaps in the data archive or cloud problems,
term output appear stable and resilient, events such as that of these being the 10 day long eruption of September‐October
2001 can modify the manner in which this persistent flux is 1989 SE crater and E flank eruption, and the January‐June
erupted. This suggests that the output rate is controlled by 2000 eruption. We use volumetric measurements from the
supply from the deep system, and cannot be changed by pro- literature to fill in these missing volumes; we also use liter-
cesses occurring in the shallow system; shallow system pro- ature‐derived volumes to fill in the data for effusive events
cesses just serve to modify the way in which the flux is erupted. lasting less than 6 days (as given in Appendix A).
Thus, to change Etna’s output rate, some profound change [42] We find that the long‐duration (greater than 6 days
must occur in the deep system. Examining the cumulative long) events account for 95 percent of the total volume erupted
output trends for the last 4 centuries show that such changes by effusive events (i.e., 737 × 106 m3 of the 775 × 106 m3 of
occurred in 1669 and 1971. lava erupted). Of this, 86 percent (666.5 × 10⁶ m3) has been
[39] We can conclude that Etna has displayed a remarkably captured by our satellite data sets. Our analysis considers the
steady output rate at least during the last 40 years. Similar volumetric nature of these large volume effusive events.
steady state behavior, consistent with a constant flux of magma [43] Two types of eruptive event are not covered in the
into and out of a crustal reservoir connected to the surface by an Appendix A listing, and thus in our analysis: (1) voluminous
open conduit, has been detected at other volcanoes such as tephra emission over extended periods (as occurred during
Stromboli [Bertagnini et al., 2003; Armienti et al., 2007; the effusive eruptions of 2001 and 2002–2003) and (2) short‐
Calvari et al., 2011] and Montserrat’s Soufriére Hills [Ryan lived episodes of lava fountaining that erupt lava and tephra at
et al., 2010; Wadge et al., 2010], and for shorter periods at high intensity, but over relatively short time periods (typically
Kilauea [Mattox et al., 1993] and Shishaldin [Petersen and just a few hours in duration), as occurred between 1996 and
McNutt, 2007]. This points to the resilience of output at such 2001.
persistently active effusive (and extrusive) systems. Given that [44] While the volume of tephra emitted during each of
Etna is characterized by such steady supply and output rates we these event types cannot be quantified using the methods
can propose that, unless the supply from deep system changes
12 of 15B08204 HARRIS ET AL.: THIRTY YEARS OF DISCHARGE RATES AT ETNA B08204
Table A1. Volumes, Durations, and Mean Output Rates for Effusive Activity at Etna During the Period 1970–2010a
Start Date Stop Date Duration Volume Cumulative
Eruption (dd‐mm‐yy) (dd‐mm‐yy) (days) (×106 m3) (×106 m3) MOR (m3 s−1) Sourceb
1971 05‐04‐71 12‐06‐71 69 50 50 8.4 1
1971 01‐06‐71 01‐09‐71 93 7 57 0.9 1
1973 01‐10‐73 31‐10‐73 31 10 67 3.7 1
1974 31‐01‐74 17‐03‐74 46 6 73 1.5 1
1974 29‐09‐74 24‐02‐75 149 7 80 0.5 1
1975 24‐02‐75 12‐09‐75 201 13 93 0.7 1
1975 12‐09‐75 28‐11‐75 78 5 98 0.7 1
1975 29‐11‐75 17‐06‐76 202 12 110 0.7 1
1976 20‐08‐76 08‐01‐77 142 6 116 0.5 1
1977 16‐07‐77 22‐07‐77 7 1 117 1.7 1
1977 05‐08‐77 06‐08‐77 2 1 118 5.8 1
1977 14‐08‐77 14‐08‐77 1 4 122 46.3 1
1977 24‐08‐77 24‐08‐77 1 0.5 123 5.8 1
1977 02‐ 11‐77 04‐11‐77 3 1 124 3.9 1
1977 07‐11‐77 08‐11‐77 2 1 125 5.8 1
1977 22‐11‐77 22‐11‐77 1 1 126 11.6 1
1977 25‐11‐77 25‐11‐77 1 1 127 11.6 1
1977 06‐12‐77 06‐12‐77 1 2 129 23.1 1
1977 10‐12‐77 13‐12‐77 4 0.5 129 1.4 1
1977 18‐12‐77 18‐12‐77 1 1 130 11.6 1
1977 24‐12‐77 25‐12‐77 2 1 131 5.8 1
1977 29‐12‐77 29‐12‐77 1 1 132 11.6 1
1978 02‐01‐78 04‐01‐78 3 2.5 135 9.6 1
1978 05‐01‐78 05‐01‐78 1 0.5 135 5.8 1
1978 07‐01‐78 07‐01‐78 1 0.5 136 5.8 1
1978 25‐03‐78 28‐03‐78 4 3 139 8.7 1
1978 29‐04‐78 05‐06‐78 38 23 162 7.0 1
1978 23‐08‐78 30‐08‐78 8 3 165 4.3 1
1978 23‐11‐78 30‐11‐78 8 5 170 7.2 1
1979 03‐08‐79 09‐08‐79 7 12 182 19.8 1
1980 01‐09‐80 01‐09‐80 30 4 186 127.3 1
1980 06‐09‐80 06‐09‐80 0.4 4.4 190 90.3 2
1980 26‐09‐80 26‐09‐80 0.5 3.9 194 61.7 2
1980 05‐02‐81 07‐02‐81 0.3 1.6 195 17.4 2
1981 17‐03‐81 23‐03‐81 2 3 198 28.9 2
1981 28‐03‐83 06‐08‐83 4.96 12.4 211 5.5 2
1983 27‐04‐84 16‐10‐84 131 62 273 1.3 2
1984 08‐03‐85 11‐03‐85 172 19 292 4.8 2
1985 12‐03‐85 13‐07‐85 1.2 0.5 292 1.4 2
1985 25‐12‐85 31‐12‐85 124 15 307 2.3 2
1985 14‐09‐86 24‐09‐86 6 1.2 309 0.5 2
1986 30‐10‐86 27‐02‐87 10 0.4 309 7.9 2
1986 11‐09‐89 27‐09‐89 120 82 391 0.5 2
1989 27‐09‐89 09‐10‐89 17 0.8 392 50.5 2
1989 04‐01‐90 02‐02‐90 11 48 440 23.0 2
1990 14‐12‐91 30‐03‐93 1.41 2.8 443 4.5 2
1991 21‐07‐96 19‐08‐96 471 183 626 0.2 3
1996 31‐05‐98 31‐05‐98 29 0.5 626 11.6 4
1998 22‐07‐98 22‐07‐98 1 1 627 34.7 5
1998 29‐12‐98 29‐12‐98 1 3 630 31.3 5
1998 04‐02‐99 24‐08‐99 1 2.7 633 0.7 5
1999 27‐08‐99 17‐09‐99 202 12 645 1.0 6
1999 17‐10‐99 05‐11‐99 22 1.9 647 8.1 6
1999 04‐09‐99 14‐11‐99 20 14 661 0.2 7
1999 26‐01‐00 24‐06‐00 72 1.1 662 1.5 6
2000 21‐01‐01 17‐07‐01 151 20 682 1.1 8
2001 17‐07‐01 09‐08‐01 177 17 699 19.1 9
2001 27‐10‐02 29‐01‐03 23 38 737 6.2 9
2002 07‐09‐04 08‐03‐05 94 50 787 4.1 9
2004 14‐07‐06 24‐07‐06 182 64 851 2.3 9
2006 12‐10‐06 14‐12‐06 10 2 853 6.8 9
2006 29‐03‐07 29‐03‐07 63 37 890 5.8 9
2007 11‐04‐07 11‐04‐07 1 0.5 890 5.8 9
2007 29‐04‐07 29‐04‐07 1 0.5 891 5.8 9
2007 06‐05‐07 6‐05‐07 1 0.5 891 5.8 9
2007 04‐09‐07 05‐09‐07 1 0.5 892 2.9 9
2007 13‐05‐08 07‐07‐09 2 0.5 892 1.9 9
2008 01‐09‐80 01‐09‐80 420 68 960 127.3 9
a
See Appendix B for notes. Note that the events grouped within the 1990 eruption are actually four short events (as broken out in
Table 2) lasting 0.375 h, 0.46 h, 0.375 h, and 0.2 h.
b
Sources are numbered as follows: 1, Wadge and Guest [1981]; 2, unpublished measurements by J. B. Murray given by Harris
et al. [2000]; 3, Stevens et al. [1997]; 4, Andronico and Lodato [2005]; 5, Allard et al. [2006]; 6, Calvari et al. [2003]; 7, Harris and
Neri [2002]; 8, Alparone et al. [2003]; 9, integration of TADR data (this study).
13 of 15B08204 HARRIS ET AL.: THIRTY YEARS OF DISCHARGE RATES AT ETNA B08204
applied here, lava fountaining episodes are too brief to be Andronico, D., and L. Lodato (2005), Effusive activity at Mount Etna vol-
captured by the satellites that this study relies on. cano (Italy) during the 20th century: A contribution to volcanic hazard
assessment, Nat. Hazards, 36, 407–443.
[45] To check the underestimate in total erupted volume Andronico, D., S. Scollo, S. Caruso, and A. Cristaldi (2008a), The 2002–03
from not considering these events, we collated available Etna explosive activity: Tephra dispersal and features of the deposits,
literature data for them. These give the following additional J. Geophys. Res., 113, B04209, doi:10.1029/2007JB005126.
volumes emplaced during tephra emissions and lava foun- Andronico, D., A. Cristaldi, and S. Scollo (2008b), The 4–5 September
2007 lava fountain at South‐East Crater of Mt Etna, Italy, J. Volcanol.
taining between 1996 and 2010: (1) Erupted volume during Geotherm. Res., 173, 325–328, doi:10.1016/j.jvolgeores.2008.02.004.
105 fountain events spanning 1996–2001 was 90 × 106 m3 Armienti, P., L. Francalanci, and P. Landi (2007), Textural effects of steady
(of which 72 × 106 m3 was lava) [Behncke et al., 2006]. state behaviour of the Stromboli feeding system, J. Volcanol. Geotherm.
Res., 160, 86–98, doi:10.1016/j.jvolgeores.2006.05.004.
(2) Erupted volume of pyroclastics during the July‐August Bailey, J. E., A. J. L. Harris, J. Dehn, S. Calvari, and S. K. Rowland (2006),
2001 eruption was 5–10 × 106 m3 [Behncke and Neri, 2003b]. The changing morphology of an open lava channel on Mt. Etna, Bull.
(3) Erupted volume of pyroclastics during 2002–2003 was Volcanol., 68, 497–515, doi:10.1007/s00445-005-0025-6.
Barnes, W. L., T. S. Pagano, and V. V. Salomonson (1998), Prelaunch
4.4 ± 0.6 × 10¹⁰ kg (converts to 16.3 ± 0.2 × 10⁶ m3 dense rock characteristics of the Moderate Resolution Imaging Spectroradiometer
equivalent using a rock density of 2700 kg m−3) [Andronico (MODIS) on EOS‐AM1, IEEE Trans. Geosci. Remote Sens., 36(4),
et al., 2008a]. (4) Erupted volume during the 4–5 September 1088–1100, doi:10.1109/36.700993.
2007 SEC Crater fountain event was 2–4 × 10⁶ m3 (clasto- Behncke, B., and M. Neri (2003a), Cycles and trends in the recent eruptive
behaviour of Mount Etna (Italy), Can. J. Earth Sci., 40, 1405–1411,
genic lava flow) + 3.9–4.9 × 10⁵ m3 = 2.4–4.5 × 10⁶ m3 doi:10.1139/e03-052.
[Andronico et al., 2008b]. Behncke, B., and M. Neri (2003b), The July‐August 2001 eruption of
[46] For the period 1980–2010, inclusion of these volumes Mt. Etna (Sicily), Bull. Volcanol., 65, 461–476, doi:10.1007/s00445-
003-0274-1.
adds 1.17 × 10⁸ m3 to the total of 7.75 × 10⁸ m3, meaning that Behncke, B., M. Neri, E. Pecora, and V. Zanon (2006), The exceptional
the Appendix A collation of volumes associated with the activity and growth of the Southeast Crater, Mount Etna (Italy), between
main effusive events includes around 87 percent of the total 1996 and 2001, Bull. Volcanol., 69, 149–173, doi:10.1007/s00445-006-
0061-x.
erupted volume (8.92 × 10⁸ m3) during the three decades. Bertagnini, A., N. Métrich, P. Landi, and M. Rosi (2003), Stromboli vol-
[47] For the period 2001–2010, inclusion of these volumes cano (Aeolian Archipelago, Italy): An open window on the deep‐feeding
adds 2.73 × 10⁷ m3 to the total of 2.76 × 10⁸ m3 that we system of a steady state basaltic volcano, J. Geophys. Res., 108(B7),
estimate was erupted during major summit and flank effusive 2336, doi:10.1029/2002JB002146.
Branca, S., and P. Del Carlo (2004), Eruptions of Mt. Etna during the past
events during this period (as given in Table 4), for a total 3,200 years: A revised compilation integrating the historical and strati-
erupted volume of 3.03 × 10⁸ m3. Thus, around 90% of the graphic records, in Mt. Etna: Volcano Laboratory, Geophys. Monogr.
total erupted volume over this period was recorded by our Ser., vol. 143, edited by A. Bonaccorso et al., pp. 1–27, AGU, Washington,
D. C.
satellite‐based data and was partitioned into flank or summit Brown, J. W., O. B. Brown, and R. H. Evans (1993), Calibration of
lava flow fields. Addition of these “missing” volumes Advanced Very High Resolution Radiometer infrared channels: A new
increases the time mean output over this 9 year period from approach to nonlinear correction, J. Geophys. Res., 98(C10), 18,257–18,268,
0.97 m3 s−1 to 1.07 m3 s−1, thereby strengthening the trends, doi:10.1029/93JC01638.
Burton, M., et al. (2005), Etna 2004–05: An archetype for geodynamically con-
and conclusions, that we draw from our effused lava volume trolled effusive eruptions, Geophys. Res. Lett., 32, L09303, doi:10.1029/
data set. 2005GL022527.
Calvari, S., and the Whole Scientific Staff of INGV‐Sezione di Catania
(2001), Multidisciplinary approach yields insight into Mt. Etna 2001
[ 48 ] Acknowledgments. We thank the three reviewers for their eruption, Eos Trans. AGU, 82(52), 653–656, doi:10.1029/01EO00376.
encouraging comments and helpful suggestions, as well as all University Calvari, S., M. Coltelli, M. Neri, M. Pompilio, and V. Scribano (1994), The
of Hawaii students who helped with AVHRR data processing, including 1991–93 Etna eruption: Chronology and lava flow field evolution, Acta
John Bailey (1999 and 2001 data), Nicole Lautze (2001 data), and Lucas Vulcanol., 4, 1–14.
Moxey (2002–2003 data). All other data were processed by A.H. (pre‐ Calvari, S., M. Neri, and H. Pinkerton (2003), Effusion rate estimations dur-
2000 data) and A.S. (post‐2003 data). This contribution is in support of ing the 1999 summit eruption on Mt. Etna, and growth of two distinct lava
the LMV‐based (PI: Franck Donnadieu) TerMex‐MYSTRALS project flow fields, J. Volcanol. Geotherm. Res., 119, 107–123, doi:10.1016/
“Contribution à l’évaluation des risques associés aux activités éruptives S0377-0273(02)00308-6.
majeures de l’Etna: approche multidisciplinaire des processus et précur- Calvari, S., L. Spampinato, A. Bonaccorso, C. Oppenheimer, E. Rivalta,
seurs.” The AVHRR data and processing support provided by the and E. Boschi (2011), Lava effusion—A slow fuse for paroxysms at
NERC‐NEODAAS group at the Plymouth Marine Laboratory (Plymouth, Stromboli volcano?, Earth Planet. Sci. Lett., 301, 317–323, doi:10.1016/
UK; http://www.neodaas.ac.uk) made this work possible. Their continued j.epsl.2010.11.015.
work and collaboration are gratefully acknowledged. Clocchiatti, R., J. L. Joron, and M. Treuil (1988), The role of selective
alkali contamination in the evolution of recent historic lavas of Mt. Etna,
J. Volcanol. Geotherm. Res., 34, 241–249, doi:10.1016/0377-0273(88)
References 90036-4.
Clocchiatti, R., M. Condomines, N. Guénot, and J. C. Tanguy (2004),
Acocella, V., B. Behncke, M. Neri, and S. D’Amico (2003), Link between
Magma changes at Mount Etna: The 2001 and 2002–2003 eruptions,
major flank slip and 2002–2003 eruption at Mt. Etna (Italy), Geophys. Earth Planet. Sci. Lett., 226, 397–414, doi:10.1016/j.epsl.2004.07.039.
Res. Lett., 30(24), 2286, doi:10.1029/2003GL018642. Coltelli, M., C. Proietti, S. Branca, M. Marsella, D. Andronico, and L. Lodato
Allard, P. (1997), Endogenous magma degassing and storage at Mount (2007), Analysis of the 2001 lava flow eruption of Mt. Etna from three‐
Etna, Geophys. Res. Lett., 24(17), 2219–2222, doi:10.1029/97GL02101. dimensional mapping, J. Geophys. Res., 112, F02029, doi:10.1029/
Allard, P., J. Carbonnelle, N. Métrich, H. Loyer, and P. Zettwoog (1994),
2006JF000598.
Sulphur output and magma degassing budget of Stromboli volcano, Condomines, M., J. C. Tanguy, and V. Michaud (1995), Magma dynamics
Nature, 368, 326–330, doi:10.1038/368326a0. at Mount Etna: Constraints from U‐Th‐Ra‐Pb radioactive disequilibria
Allard, P., B. Behncke, S. D’Amico, M. Neri, and S. Gambino (2006),
and Sr isotopes in historical lavas, Earth Planet. Sci. Lett., 132, 25–41,
Mount Etna 1993–2005: Anatomy of an evolving eruptive cycle, Earth doi:10.1016/0012-821X(95)00052-E.
Sci. Rev., 78, 85–114, doi:10.1016/j.earscirev.2006.04.002. Corsaro, R. A., R. Cristofolini, and L. Patané (1996), The 1669 eruption at
Alparone, S., D. Andronico, L. Lodato, and T. Sgroi (2003), Relationship Mount Etna: Chronology, petrology and geochemistry, with inferences
between tremor and volcanic activity during the Southeast Crater erup- on the magma sources and ascent mechanisms, Bull. Volcanol., 58,
tion on Mount Etna in early 2000, J. Geophys. Res., 108(B5), 2241, 348–358, doi:10.1007/s004450050144.
doi:10.1029/2002JB001866.
14 of 15You can also read