UAS Chromatograph for Atmospheric Trace Species (UCATS) - a versatile instrument for trace gas measurements on airborne platforms
←
→
Page content transcription
If your browser does not render page correctly, please read the page content below
Atmos. Meas. Tech., 14, 6795–6819, 2021
https://doi.org/10.5194/amt-14-6795-2021
© Author(s) 2021. This work is distributed under
the Creative Commons Attribution 4.0 License.

UAS Chromatograph for Atmospheric Trace Species (UCATS) –
a versatile instrument for trace gas measurements
on airborne platforms
Eric J. Hintsa1,2 , Fred L. Moore1,2 , Dale F. Hurst1,2 , Geoff S. Dutton1,2 , Bradley D. Hall2 , J. David Nance1,2 ,
Ben R. Miller1,2 , Stephen A. Montzka2 , Laura P. Wolton1,2 , Audra McClure-Begley1,2 , James W. Elkins2 ,
Emrys G. Hall1,2 , Allen F. Jordan1,2 , Andrew W. Rollins3 , Troy D. Thornberry1,3 , Laurel A. Watts1,3 ,
Chelsea R. Thompson1,3 , Jeff Peischl1,3 , Ilann Bourgeois1,3 , Thomas B. Ryerson3 , Bruce C. Daube4 ,
Yenny Gonzalez Ramos4,5,6 , Roisin Commane4,7,8 , Gregory W. Santoni4 , Jasna V. Pittman4 , Steven C. Wofsy4 ,
Eric Kort9 , Glenn S. Diskin10 , and T. Paul Bui11
1 Cooperative Institute for Research in Environmental Sciences, University of Colorado Boulder, Boulder, CO 80309, USA
2 Global Monitoring Laboratory, NOAA, Boulder, CO 80305, USA
3 Chemical Sciences Laboratory, NOAA, Boulder, CO 80305, USA
4 John A. Paulson School of Engineering and Applied Sciences, Harvard University, Cambridge, MA 02138, USA
5 CIMEL Electronique, Paris, 75011, France
6 Izaña Atmospheric Research Center, Santa Cruz de Tenerife, 38001, Spain
7 Department of Earth and Environmental Sciences, Columbia University, New York, NY 10027, USA
8 Lamont-Doherty Earth Observatory, Columbia University, Palisades, NY 10964, USA
9 Climate and Space Sciences and Engineering, University of Michigan, Ann Arbor, MI 48109, USA
10 NASA Langley Research Center, Hampton, VA 23681, USA
11 NASA Ames Research Center, Mountain View, CA 94035, USA

Correspondence: Eric J. Hintsa (eric.j.hintsa@noaa.gov)

Received: 16 December 2020 – Discussion started: 25 January 2021
Revised: 29 June 2021 – Accepted: 14 July 2021 – Published: 21 October 2021

Abstract. UCATS (the UAS Chromatograph for Atmo-                 gion and transport of air into the stratosphere; in piloted air-
spheric Trace Species) was designed and built for observa-       craft studies of greenhouse gases, transport, and chemistry
tions of important atmospheric trace gases from unmanned         in the troposphere; and in 2021 is scheduled to return to the
aircraft systems (UAS) in the upper troposphere and lower        study of stratospheric ozone and halogen compounds, one of
stratosphere (UTLS). Initially it measured major chloroflu-      its original goals. Each deployment brought different chal-
orocarbons (CFCs) and the stratospheric transport tracers        lenges, which were largely met or resolved. The design, ca-
nitrous oxide (N2 O) and sulfur hexafluoride (SF6 ), using       pabilities, modifications, and some results from UCATS are
gas chromatography with electron capture detection. Com-         shown and described here, including changes for future mis-
pact commercial absorption spectrometers for ozone (O3 )         sions.
and water vapor (H2 O) were added to enhance its capabil-
ities on platforms with relatively small payloads. UCATS
has since been reconfigured to measure methane (CH4 ), car-
bon monoxide (CO), and molecular hydrogen (H2 ) instead          1   Introduction
of CFCs and has undergone numerous upgrades to its sub-
systems. It has served as part of large payloads on strato-      Accurate and precise measurements of trace gases and other
spheric UAS missions to probe the tropical tropopause re-        atmospheric parameters have resulted in an ever more de-
                                                                 tailed understanding of the chemistry and physics of Earth’s

Published by Copernicus Publications on behalf of the European Geosciences Union.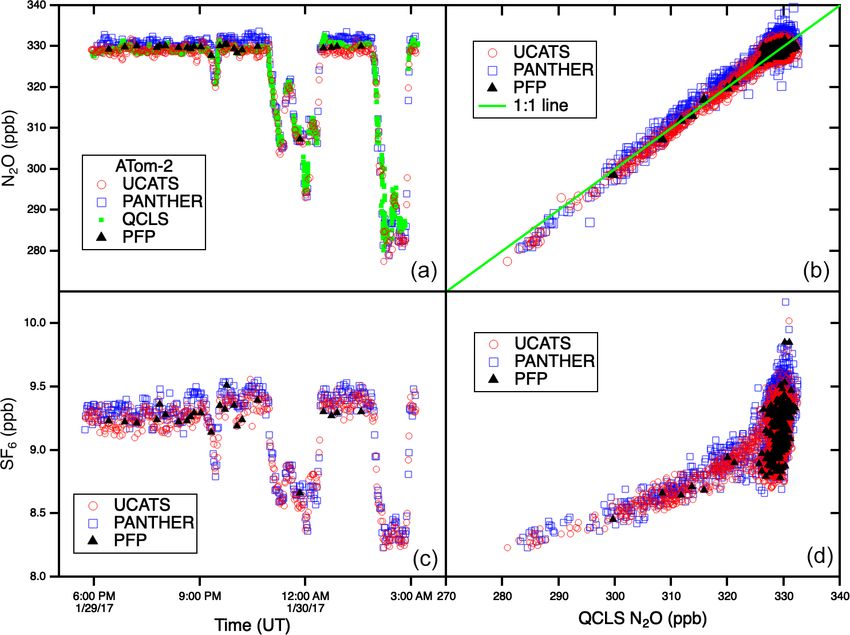
6796                                     E. J. Hintsa et al.: UAS Chromatograph for Atmospheric Trace Species (UCATS)

atmosphere. This has allowed progress on environmental is-        surface to the lower stratosphere. In 2010, UCATS flew on
sues of global concern, including stratospheric ozone deple-      the NASA Global Hawk UAS for the Global Hawk Pacific
tion and air pollution in the lower atmosphere. For example,      (GloPac) demonstration project and participated in the Air-
after the first report of the Antarctic “ozone hole” (Farman      borne Tropical Tropopause Experiment (ATTREX; Jensen et
et al., 1985), a combination of measurements from balloons,       al., 2013) from 2011 to 2014, to study dehydration, transport,
aircraft, and satellites, backed by a wide range of laboratory,   and ozone chemistry in the tropical tropopause layer (TTL).
theoretical, and modeling studies, allowed a sufficient grasp     Most recently, UCATS completed the Atmospheric Tomog-
of the problem to develop an effective international response     raphy Mission (ATom; 2016–2018), for which the NASA
relatively quickly (Douglass et al., 2014). Though ozone loss     DC-8 aircraft sampled the remote atmosphere over the At-
and organic halogen emissions are still ongoing matters of        lantic, Pacific, and Southern oceans and parts of the Arctic
concern, climate change driven by greenhouse gas emissions        and Antarctic from near the surface to above 12 km in dif-
is now the overarching environmental problem today, while         ferent seasons. Many of these missions required changes to
air quality continues to be an important issue as well.           UCATS, and components were also upgraded when possible.
   The Halocarbons and other Atmospheric Trace Species            The end result is a compact instrument for UAS and piloted
(HATS) group in what is now the Global Monitoring Lab-            aircraft, capable of measurements of atmospheric composi-
oratory (GML) at the National Oceanic and Atmospheric             tion, chemistry, and transport in the stratosphere and tropo-
Administration (NOAA) in Boulder, CO, has long been in-           sphere. We describe the design and components of UCATS
volved in measuring N2 O, CFCs, and other trace gases, pri-       in Sect. 2, focusing on ATom, the most recent mission for
marily by using gas chromatography (GC) with electron             UCATS; improvements and modifications over the course of
capture detectors (ECDs). This led to participation in a se-      its missions in Sect. 3; and data and intercomparisons from
ries of airborne missions to study halogen budgets, ozone         some of the field campaigns in Sect. 4, with a short summary
loss, and stratospheric transport, starting on the NASA ER-       including future plans in Sect. 5.
2 aircraft in 1991 (Elkins et al., 1996). GCs are well suited
to measuring multiple trace species in the atmosphere, be-
cause with an appropriate column, several compounds can           2     Instrument design
be separated and detected with the same instrument. ECDs
are extremely sensitive (a few parts per trillion (ppt) or        At its core, UCATS is similar to previous gas chromato-
better) to halogen-containing compounds, including ozone-         graph (GC) instruments designed and built for aircraft and
depleting substances (ODS), and with appropriate modifi-          balloon platforms (Elkins et al., 1996; Romashkin et al.,
cations can be used to detect other molecules as well. A          2001; Moore et al., 2003). It combines a two-channel GC
few other GC instruments have been used for in situ mea-          that is a lighter and much more compact version of the four-
surements of CFCs (Tyson et al., 1978; Kuster et al., 1981;       channel ACATS-IV (Airborne Chromatography for Atmo-
Vedder et al., 1983; Bujok et al., 2001), and they can now        spheric Trace Species IV; Elkins et al., 1996) instrument and
be coupled with mass spectrometric detection (e.g., Apel          incorporates some of the advances in fast chromatography
et al., 2015) as well. With the advent of unmanned air-           from the LACE (Lightweight Airborne Chromatograph Ex-
craft systems (UAS), the potential emerged to extend sci-         periment; Moore et al., 2003) instrument for balloons, along
entific airborne missions to longer durations and other ex-       with small ozone and water vapor sensors. Figure 1 shows a
periments that were not possible with manned aircraft, as         block diagram of UCATS with all the major internal compo-
well as eliminate some of the danger of flying piloted air-       nents; more detailed drawings of the ozone and water instru-
craft in remote regions. Accordingly, the UAS Chromato-           ments are included in the Appendix (Fig. A1a and b). Each
graph for Atmospheric Trace Species (UCATS), a smaller            part of UCATS is described in the following subsections.
and lighter-weight version of previous aircraft instruments,
was designed and built to measure ODS and other trace             2.1    Gas chromatographs
gases on UAS missions. These began in 2005 with the Al-
tair UAS, a high-altitude version of the General Atomics          Both GC channels use Valco 10- and 12-port two-position
Predator B. Given the limited payload capacity of Altair,         valves (VICI, Houston, TX) to control flow switching and
small and lightweight ozone and water vapor sensors were          ECDs (Valco and Shimadzu) to detect specific trace species
installed inside UCATS to generate a more complete data           with high precision, with added dopant gas as needed
set. After two missions on Altair, UCATS joined the pay-          (Phillips et al., 1979; Fehsenfeld et al., 1981). In its original
load of the National Science Foundation/National Center for       configuration, one channel used OV-101 in packed columns
Atmospheric Research (NSF/NCAR) piloted Gulfstream V              to separate and measure CFC-12, halon-1211, and CFC-
(GV) for the START-08 (Stratosphere-Troposphere Analyses          11 every 70 s, similar to the Lightweight Airborne Chro-
of Regional Transport 2008) and HIPPO (HIAPER Pole-to-            matograph Experiment (LACE) (Moore et al., 2003). Af-
Pole Observations; 2009–2011) missions (Pan et al., 2010;         ter the initial Altair flights in 2005, these were replaced
Wofsy, 2011), which included measurements from near the           with Unibeads (pre-column, ∼ 1 m length) and molecular

Atmos. Meas. Tech., 14, 6795–6819, 2021                                            https://doi.org/10.5194/amt-14-6795-2021
E. J. Hintsa et al.: UAS Chromatograph for Atmospheric Trace Species (UCATS)                                                                6797

Figure 1. Schematic of UCATS as flown in ATom showing all major components. Red lines indicate the flow of ambient air through the
instrument, and blue lines indicate ECD dopant flow. All regulators (“Press Reg”) are single stage and kept at a constant external pressure by
a small flow of carrier gas and a Tavco absolute pressure controller (green line, top) to improve stability. Pressure is measured at points in the
system marked “P”, as well as at regulators and controllers. Green “crimped lines” typically provide 5–10 cm3 /min purge flows to keep the
ECDs and TDL cell clean and dry when the instrument is powered off, make-up flows to the ECDs when operating, and flows to pressurize
the regulators. N2 carrier gas (green) is purified through a set of molecular sieve, Hopcalite, and activated charcoal traps, as well as a hot
zirconium getter, labeled as “traps” in the figure, before being sent to the GCs. Bottles for N2 and calibrated air were located externally for
ATom and prior missions; they will be mounted inside the UCATS shell for the DCOTSS mission in 2021. Internal details of the ozone and
water instruments are shown in Fig. A1a and b.

sieve 5A (main column, 0.7 m) to measure molecular hy-                     5A molecular sieve (originally 0.20 m, now 0.25 m) to mea-
drogen (H2 ), methane (CH4 ), and carbon monoxide (CO)                     sure sulfur hexafluoride (SF6 ) and N2 O every 70 s; doping
every 140 s. A tiny flow of nitrous oxide (N2 O) dopant                    the nitrogen carrier gas with CO2 enhances the ECD re-
(∼ 0.003 sccm) added to the ECD is required for adequate                   sponse to N2 O. The pre-columns and main columns were
sensitivity. Flows and column temperatures varied over dif-                maintained at 91 ◦ C and the post-column at ∼ 120 ◦ C (for
ferent missions; in ATom, with the chromatography opti-                    the shorter version) and 190 ◦ C (longer version; changed in
mized for both the troposphere and stratosphere, at a tem-                 2011). Carrier gas flows in ATom were 55 sccm, with the flow
perature of 94 ◦ C the N2 carrier gas flow was 60 sccm, with               in the pre-column reversed after 13–14 s. Since the back-
4 s of pre-emphasis at 100 sccm at the start of the injection, to          flush switches occur early in the cycle, there is sufficient time
rapidly bring the pre-column up to the same pressure as the                for the pre-columns in each channel to be cleaned out, even
main column. The pre-column was back-flushed after 25 s to                 with lower flow rates compared to the main flows. All the
remove any remaining compounds over the remainder of the                   columns used were packed in 3.2 mm o.d. stainless-steel tub-
140 s time window.                                                         ing, wound around a circular mandrel with heater cartridges
   The second channel uses a pre-column (0.6 m) and main                   and a resistance temperature detector (RTD), and packaged
column (1.8 m) of Porapak Q, followed by a post-column of                  in insulated metal cans. The ECDs were packaged in simi-

https://doi.org/10.5194/amt-14-6795-2021                                                       Atmos. Meas. Tech., 14, 6795–6819, 2021
6798                                       E. J. Hintsa et al.: UAS Chromatograph for Atmospheric Trace Species (UCATS)

lar cans but sealed and supplied with a ∼ 5 sccm purge flow          pass “long path” for measurements from the mid-troposphere
to prevent oxidation and maintained at 330 or 350 ◦ C with           into the stratosphere (1000 to < 5 ppm). On the Altair mis-
Omega temperature controllers.                                       sions, with a minimal payload, a small Vaisala probe was
   Chromatograms are similar to those in Moore et al. (2003),        installed on the inlet for measurements of temperature, pres-
Figs. 7c and 9. ECDs provide very high sensitivity but can           sure, and relative humidity. This was not used subsequently,
have non-linearity, particularly for doped channels, where           as the payloads on larger aircraft included dedicated instru-
secondary ion–molecule reactions are used to detect trace            ments for meteorological measurements.
species. UCATS was calibrated on the ground during each                 During ATom, the TDL hygrometer in UCATS was up-
mission, with a set of standards spanning the range of ex-           graded with a new model from Port City Instruments (Reno,
pected atmospheric concentrations (typically 30 %–100 % of           NV), the successor to MayComm. It is similar in concept and
those in background tropospheric air) and occasionally in-           uses a distributed feedback laser (DFB) to scan across two
cluding zero air to check baselines. From these experiments,         closely spaced absorption lines near 2.574 µm. Absorption
calibration curves for each molecule are calculated, includ-         at this wavelength is much stronger than in the original in-
ing an estimate of the error in the calibration. An example          strument, allowing higher sensitivity in the stratosphere. As
of a calibration curve for N2 O is included in the Appendix          before, the laser beam is split into two optical paths, with
(Fig. A2); all other curves were even closer to linear. In flight,   the short path (5.14 cm) for high values of tropospheric wa-
a calibration standard from compressed background tropo-             ter (∼ 2000–40 000 ppm) using direct absorption. The long
spheric air is injected every 6–10 min, and the peak heights         path (280.0 cm) is used with second harmonic detection for
of air samples and standards are analyzed with the calibra-          water vapor from 0–100 ppm, and intermediate values (100–
tion curves to generate a time series of mixing ratios for each      5000 ppm) are measured using the long path with direct ab-
molecule in sampled air.                                             sorption. A second weak absorption line is also analyzed
                                                                     with direct absorption for water vapor mixing ratios above
2.2    Airflows and sampling                                         1000 ppm; this is not being used at present. Both long- and
                                                                     short-path spectra are recorded simultaneously, with each
Ambient air is drawn into UCATS from a side-facing or rear-          scan taking approximately 200 ms. All four measurements
facing inlet extending 25–30 cm from the skin of the aircraft        of water vapor are calculated, and then each one is aver-
(outside the aircraft boundary layer) through stainless-steel        aged together for ∼ 1 Hz output on a serial data line. All
and Synflex tubing; sample flow tubing inside UCATS is               data are recorded by the UCATS computer, and the appro-
stainless steel. Air is pressurized in the GC sample loops by        priate value for display and archiving is chosen based on the
an external two-stage KNF diaphragm pump (model UN726,               range of pressure and water vapor. Both instruments required
with Teflon-coated heads and diaphragms) and maintained              extensive calibration using prepared water vapor standards
at 1225 hPa with an absolute pressure relief valve (Tavco,           and frost point hygrometers for accurate measurements. The
Inc.; Chatsworth, CA); excess air is dumped through the              new instrument allows higher-precision (±0.1 ppm) mea-
Tavco overflow. Air flows at approximately 80 sccm sequen-           surements of water vapor in the stratosphere compared to the
tially through the two sample loops (∼ 0.5 cc volume for             original instrument, which was limited to ±1 ppm.
each channel) and a flow meter and is controlled by solenoid
valves and a pressure regulator set at 1080 hPa on the out-          2.4   Ozone
let. Every 70 or 140 s the contents of the sample loops
are injected by the two-position Valco valves onto the pre-          Ozone was measured by direct absorption (Beer–Lambert
columns, providing a discontinuous ∼ 2 s snapshot measure-           law) UV photometers from 2B Technologies (Boulder, CO),
ment of ambient air.                                                 modified for high-altitude operation and mounted inside the
                                                                     UCATS package. The initial ozone instrument was a 2B
2.3    Water vapor                                                   model 205; modifications included a stronger pump (KNF,
                                                                     model UNMP-830), a small metal cylinder upstream of the
The sample airflow is split just upstream of the GC pump             pump to dampen pressure fluctuations that could degrade the
to feed a tunable diode laser (TDL) hygrometer with its              measurement precision, O3 scrubbers with manganese diox-
own pump (KNF, model NMP850) downstream of the ab-                   ide (MnO2 )-coated screens (Thermo Fisher), and pressure
sorption cell. The original hygrometer, a custom commer-             sensors with a range from 0 to over 1000 hPa (Honeywell
cial sensor from MayComm, Inc., used infrared absorption             ASDX series). Ambient air was brought to the ozone instru-
at 1.37 µm with second harmonic detection to measure wa-             ments from the inlet through a separate Teflon tube (6.35 mm
ter vapor. Since water vapor number densities span 5 orders          o.d.), with the exhaust from the ozone and water instruments
of magnitude from the surface to the stratosphere, the laser         combined inside UCATS and released outside the aircraft.
beam was split into two optical paths, a 13.4 cm “short path”        The model 205 is a dual-beam photometer, with the flow
for measurements from the surface to the mid-troposphere             continuously split between unscrubbed (ambient) air into one
(40 000 to 500 parts per million (ppm)) and a 403 cm multi-          cell and scrubbed (ozone-free) air into the other. Two photo-

Atmos. Meas. Tech., 14, 6795–6819, 2021                                              https://doi.org/10.5194/amt-14-6795-2021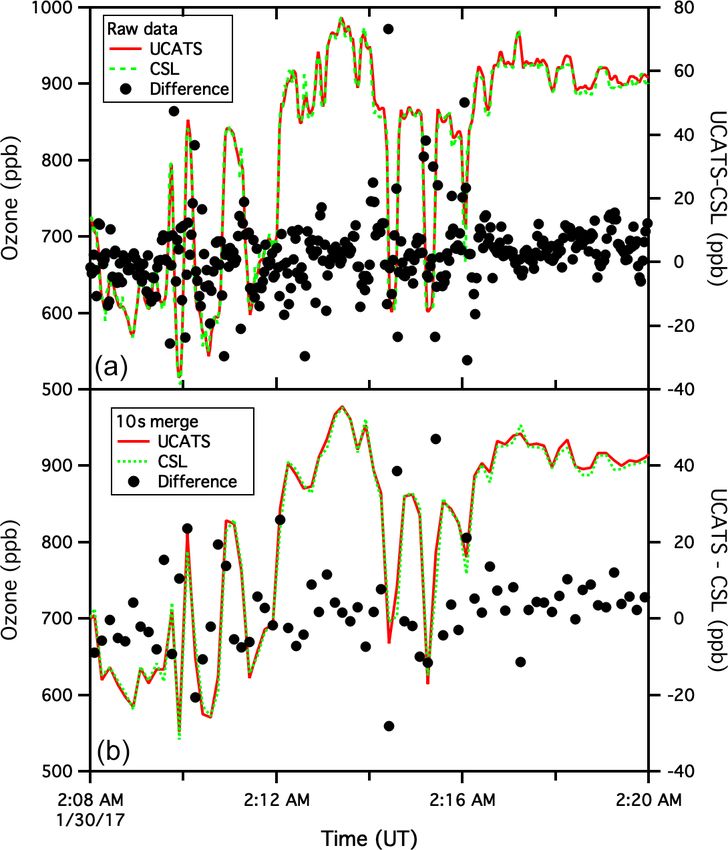
E. J. Hintsa et al.: UAS Chromatograph for Atmospheric Trace Species (UCATS)                                                6799

diodes located at the end of 15 cm long absorption cells mea-      3   Field missions and modifications to UCATS
sure the intensity of 254 nm radiation emitted from a mercury
lamp. Ozone concentrations are calculated from the ratio of        Aircraft missions that included UCATS are summarized in
measured intensities through the cells with scrubbed and un-       Table 1 and described in this section. The first two projects
scrubbed air according to the Beer–Lambert law. The flow           were designed to show that high-quality measurements could
paths are switched by solenoids every 2 s, to allow alternat-      be made on a UAS with autonomous instruments. The
ing measurements of ambient and scrubbed air in each cell,         NOAA/NASA UAS Demonstration Project using General
with data averaged to 10 s on the original model. The instru-      Atomics’ Altair (Predator B-ER) UAS was conducted from
ments are checked against a NIST-traceable calibration sys-        Gray Butte, CA, during April–May and November, 2005.
tem (Thermo Fisher, model 49i) on the ground before and            UCATS measured N2 O, SF6 , CFC-11, CFC-12, halon-1211,
after every mission. For ATom, a new and more sensitive 2B         and ozone. More than 60 h of atmospheric composition data
model 211 ozone photometer was added to UCATS in addi-             was acquired up to altitudes of 13 km, with the mission high-
tion to the original model 205, with similar modifications as      light an 18.4 h flight over the eastern Pacific Ocean, success-
before and additional changes as described in Sect. 3.             fully demonstrating that atmospheric composition and other
                                                                   environmental parameters can be measured with high pre-
2.5   Physical characteristics                                     cision and accuracy from a UAS (Fahey et al., 2006). The
                                                                   NASA/USDA-FS/NOAA Western States Fire Mission was
The overall dimensions of UCATS were initially 41 × 46 ×           conducted in August and October 2006, again using Altair
26 cm, with a weight of 29 kg. To integrate the new water          (Hinkley et al., 2009). The scientific focus was on remote
and ozone instruments for ATom, an additional section was          mapping of wildfires from a UAS, with UCATS on board to
added to the top, increasing the height from 26 to 33 cm and       measure atmospheric trace gases in fire plumes. At this point,
the weight to 33 kg. The external GC pump weighs an addi-          the halocarbon GC channel was reconfigured to measure the
tional 5 kg, and fiber-wrapped aluminum bottles (SCI Com-          combustion products CO and CH4 , along with H2 , and a TDL
posites; now Worthington Industries) for compressed nitro-         water vapor sensor was added to UCATS. Accomplishments
gen (N2 ) carrier gas (model 687) and dry, whole air calibra-      of this project included 21 and 22 h science flights and more
tion gas (model 209) for the GC, both filled to ∼ 13 000 kPa,      than 65 h of UCATS in situ measurements of trace gases and
together weigh approximately 7 kg. The total N2 flow (car-         water vapor.
rier gas, backflush, purge flows) is about 300 sccm. The N2           For START-08 (Pan et al., 2010) and HIPPO (Wofsy,
bottle needed to be filled every one or two flights, the cal-      2011), both UCATS and the PAN and Trace Hydrohalo-
ibration gas was filled once per deployment, and the small         carbon ExpeRiment (PANTHER), a four-channel GC with
dopant bottles could last for over a year without refilling. For   ECD detection and a GC with mass spectrometry detec-
flights on passenger aircraft, such as the DC-8 for ATom, the      tion (GC/MS), were flown on the NSF/NCAR GV aircraft.
N2 and air bottles can be replaced by larger gas cylinders         These were integrated together with a NOAA whole air sam-
as weight and space allow. UCATS is powered by 28 V DC,            pler (WAS) in collaboration with the University of Miami
and the complete package draws 12 A at startup (∼ 350 W),          (Schauffler et al., 1999). The larger GV payload was de-
decreasing to 150 W after the heaters warm up (∼ 30 min).          signed to probe long-lived greenhouse gases and tracers of
The majority of the power is consumed by the column and            atmospheric transport. In HIPPO, the GV flew repeated verti-
ECD heaters; the GC pump and the TDL use about 1 A each,           cal profiles between 150 m above sea level and 14 km, largely
ozone less than 0.5 A, and other electronics about 1–2 A.          over the Pacific Ocean, from northern Alaska and the Arctic
Different voltages (+5, ±12, 15, and 24 V) are supplied by         Ocean to south of New Zealand near Antarctica, with five
Vicor DC–DC converters. The internal wiring in the ECD             deployments from January 2009 to August 2011 covering
cans is carefully adjusted to minimize electrical noise on the     different seasons. The first use of UCATS in the extremely
detector circuits; no other electromagnetic compatibility is-      humid tropics during HIPPO revealed several issues, which
sues were observed. UCATS is controlled by an Ampro com-           were resolved after the first two deployments. Initially, the
puter with the QNX operating system, and data are stored           GC columns adsorbed water, which changed their retention
on flash memory for post-flight processing; quick-look, near-      characteristics. To alleviate this, a Nafion dryer (Perma Pure,
real-time data for ozone, water, N2 O, SF6 , and CH4 are also      MD-050-72S-2) was added to remove most of the mois-
provided by a serial or Ethernet connection to the aircraft, for   ture from the GC airflow prior to the sample loops, with
onboard use and telemetry to the ground. Data are analyzed         the exhaust from the pre-columns used as the dry counter-
post-flight with home-built software, including GC peak in-        flow gas. The Nafion dryer helped considerably, but reten-
tegration and quantitation routines, primarily using Igor soft-    tion times and sensitivity for the N2 O / SF6 channel still
ware, and three separate data files (GC, ozone, and water,         showed changes after passing through very humid air; likely
with different time intervals) are generated for archiving and     the Nafion dryer could not remove all the water vapor. As
dissemination.                                                     described in Moore et al. (2003), we use Porapak Q columns
                                                                   to separate N2 O and SF6 from the large O2 peak. This is fol-

https://doi.org/10.5194/amt-14-6795-2021                                            Atmos. Meas. Tech., 14, 6795–6819, 2021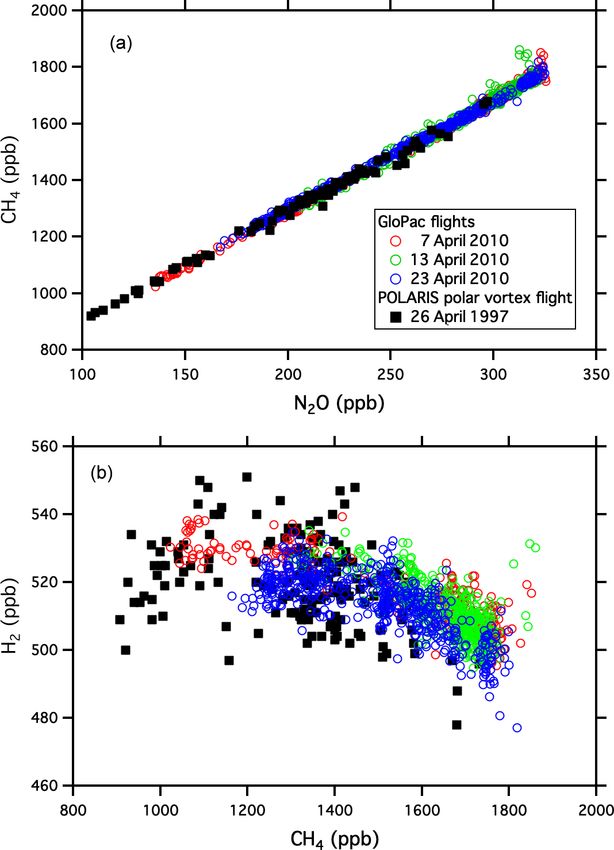
6800 E. J. Hintsa et al.: UAS Chromatograph for Atmospheric Trace Species (UCATS)
Table 1. Missions and configurations of UCATS. A second 2B model 205 ozone instrument was added for ATTREX-2 and 3. The water
vapor instrument was converted to the newer Port City model for ATom-2 and subsequent deployments. For the DCOTSS mission (now
scheduled to start in 2021), UCATS is being repackaged to include three GC channels to measure CFCs (CFC-11, CFC-12, and CFC-113)
and H-1211, shorter-lived chlorine compounds (CHCl3 , CCl4 , and C2 HCl3 ), and N2 O and SF6 .
Mission Year Aircraft GC configuration Ozone Water vapor
UAS Demo. 2005 Altair CFCs; N2 O / SF6 2B 205 None
Western States Fire Mission 2006 Altair CH4 /CO/H2 ; N2 O/SF6 2B 205 MayComm
START-08 2008 GV CH4 /CO/H2 ; N2 O/SF6 2B 205 MayComm
HIPPO 2009–2011 GV CH4 /CO/H2 ; N2 O/SF6 2B 205 MayComm
GloPac 2010 Global Hawk CH4 /CO/H2 ; N2 O/SF6 2B 205 MayComm
ATTREX 2011–2015 Global Hawk CH4 /CO/H2 ; N2 O/SF6 2B 205 (2) MayComm
ATom 2016–2018 DC-8 CH4 /CO/H2 ; N2 O/SF6 2B 211, 205 Port City
DCOTSS 2021–2022 ER-2 3 channels, see caption 2B 211 Port City
lowed by a short post-column of 5A molecular sieve, which corresponds to a precision of 10 ppb at 100 hPa, a typical
partially retains the N2 O but not SF6 , allowing the two peaks pressure in the upper troposphere and lower stratosphere,
to be separated. The molecular sieves have a very high affin- UTLS). This is more than adequate for midlatitude and polar
ity to water vapor, and absorbed water changes the retention stratospheric missions such as GloPac, where ozone varies
characteristics and peak height for N2 O. This problem was from a few hundred to a few thousand parts per billion. But
finally resolved by lengthening the 5A molecular sieve post- for ATTREX, where the focus was the tropical tropopause
column from ∼ 20 to 25 cm. This allowed the post-column to layer (TTL; Fueglistaler et al., 2009), ozone was typically
be operated at 190 ◦ C instead of 115–120 ◦ C, with N2 O still less than 100 ppb at pressures of 150–70 hPa. To partially
completely eluting within 70 s after sample injection. Water address this issue in ATTREX-2 and 3 (2013–2014), a sec-
does not accumulate in the post-column at the higher tem- ond model 205 sensor was added to UCATS. The original
peratures, and retention times and other aspects of the chro- model 205 remained completely enclosed, and the new one
matography remained constant. The N2 O peak also became was added to the front panel, with part of the instrument in-
much sharper and higher, improving the resolution of SF6 side the sheet metal UCATS enclosure and the cell, lamp,
and N2 O. This required changes to the electrometer circuit and detectors on the surface, with a small insulated cover and
that processes the ECD signal, in order to achieve a faster re- warm airflow from UCATS passing through it. In general, the
sponse time and avoid saturation of the signal. These were older 2B had better stability over a flight, possibly because of
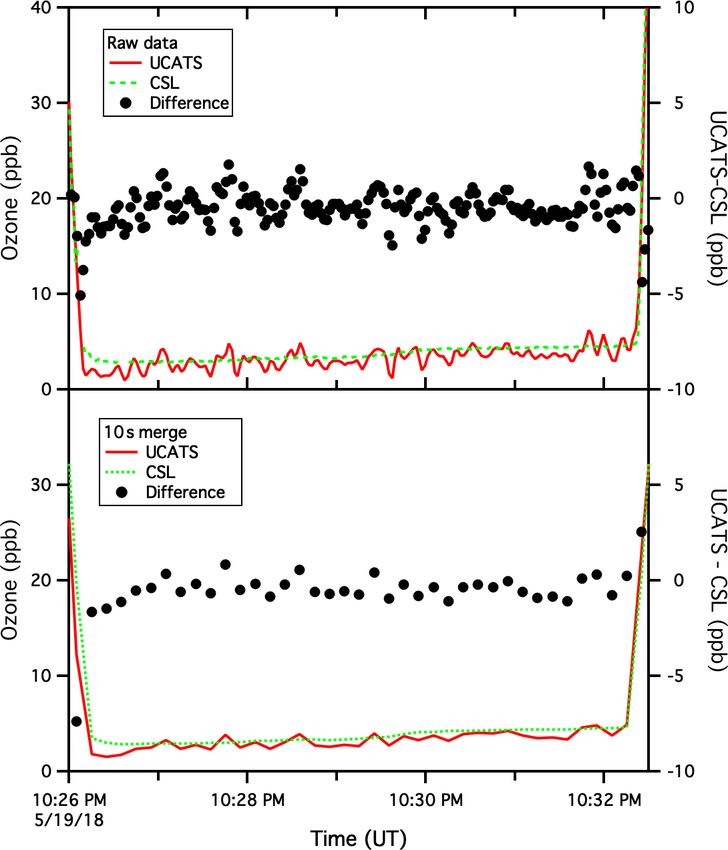
completed in 2015, prior to ATom. Plots illustrating data the more constant temperature environment inside UCATS.
quality and intercomparisons are shown in Sect. 4. However, after a few hours of operation (always the case
Problems were also identified with the 2B ozone instru- with Global Hawk flights, which could last for ∼ 24 h with
ment during the START-08 and HIPPO missions related to the ATTREX payload), both instruments converged to stable
changing humidity. UV ozone photometers are known to suf- and consistent readings. When both instruments were oper-
fer from offsets when transitioning between wet and dry con- ating normally, data from the two instruments were merged
ditions (Wilson and Birks, 2006), because of water being re- and averaged to create a combined data set with a value re-
tained in the scrubber and slowly released, differentially af- ported every 5 s. By averaging the data to longer times (typ-
fecting reflectance from the walls of the cell with scrubbed ically 10 s), the precision of the measurements could be im-
air compared to the cell with ambient air. This was resolved proved. UCATS served as the primary ozone instrument dur-
for ATom, as described later in this section. ing ATTREX-3, where weight and balance issues with the
From 2010 to 2014, UCATS was integrated into a com- payload prevented the NOAA CSL instrument from being
partment in the fuselage of the Global Hawk UAS for the flown on the Global Hawk.
GloPac and ATTREX missions (Jensen et al., 2013). The ATom was similar to HIPPO, but with a much larger pay-
Global Hawk generally operates in the stratosphere and up- load to map out and study atmospheric chemistry as well as
per troposphere (12–20 km), where air is very dry. How- long-lived gases over remote regions. For ATom, a new 2B
ever, these missions led to other changes in order to im- model 211 ozone photometer was added to UCATS and the
prove the data quality for ozone. The original 2B model 205 partially external model 205 removed. The model 211 is sim-
could achieve a precision of ±2 % + 1 part per billion (ppb) ilar in principle but has a longer cell and path length (30 cm
with 10 s averaging at atmospheric pressure. Because Beer– compared to 15 cm for the model 205), improved electronics,
Lambert absorption is really a measurement of number den- and built-in flow meters to assure equal flows through each
sity (concentration) of the absorbing molecule, the precision cell, with a stated precision that is the sum of 1 % + 0.5 ppb
varies inversely with pressure (1 ppb precision at 1000 hPa over a 10 s average at 1000 hPa. As purchased, it used pho-
Atmos. Meas. Tech., 14, 6795–6819, 2021 https://doi.org/10.5194/amt-14-6795-2021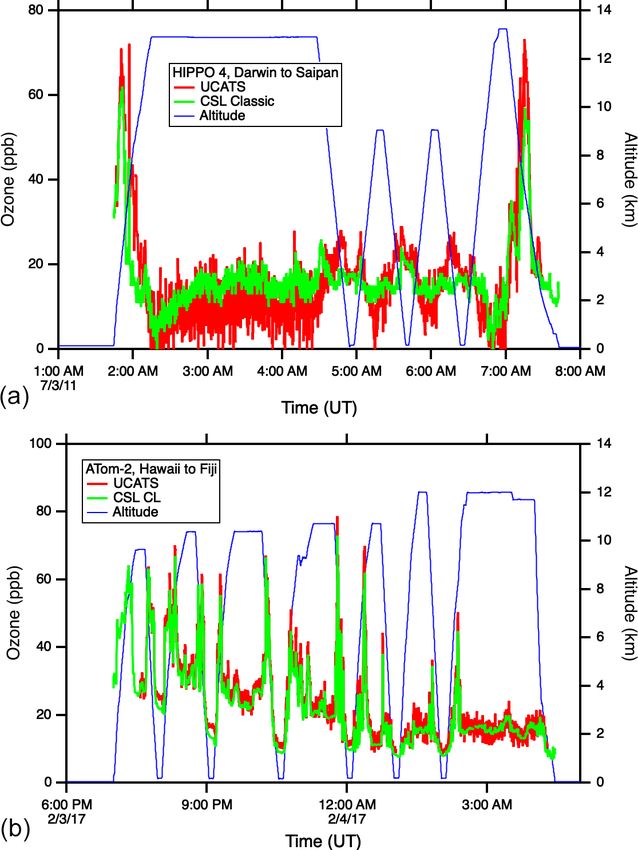
E. J. Hintsa et al.: UAS Chromatograph for Atmospheric Trace Species (UCATS)                                               6801

tolysis of N2 O to produce NO as the ozone scrubber; this           tum cascade laser spectrometer (QCLS; Santoni et al., 2014)
method is not affected by changes in humidity of the sampled        measured long-lived trace gases, including N2 O and CH4 ,
air. However, at high altitudes, with fixed addition of N2 O (or    with high precision and 1 s time resolution, ideal for com-
NO), the rate of the chemical reaction (NO + O3 → NO2 +             paring time series and tracer–tracer correlation plots. The
O2 ) that removes ozone decreases with decreasing pressure.         PANTHER instrument (a four-channel GC, with a separate
Rather than trying to add more NO to compensate (carrying           GC/mass spectrometer) also measured the same molecules
toxic gases like NO on an aircraft is problematic; even large       by GC as UCATS, using similar techniques. Whole air
amounts of an oxidizer such as N2 O add to the complexity of        samples were collected in glass flasks using programmable
getting a payload certified), we used MnO2 -coated screens as       flask package units (PFPs), which could be filled on de-
the scrubber and passed both the scrubbed and ambient air-          mand or in a preset sequence, with 24 samples typically col-
flows through Nafion moisture exchangers provided with the          lected per flight. Samples were later analyzed at the NOAA
instrument. Moisture exchangers have been shown to elimi-           Global Monitoring Laboratory for a large set of trace gases
nate the artifacts associated with rapid changes in water va-       (Sweeney et al., 2015). All these instruments were also on
por by keeping both cells at a constant humidity (Wilson and        the DC-8 aircraft for ATom. Data from the Airborne Chro-
Birks, 2006). They were not used for HIPPO and START-08,            matograph for Atmospheric Trace Species (ACATS; Elkins
because the pressure of the gas flow being analyzed varied          et al., 1996), a predecessor of both PANTHER and UCATS,
from ∼ 100 to 1000 hPa while the cabin pressure is main-            are also used from the 1997 Photochemistry of Ozone Loss
tained near 900 hPa at high altitudes. With a pressure dif-         in the Arctic Region in Summer (POLARIS) mission for ref-
ferential of over 700 hPa, the soft Nafion tubes could leak or      erence.
collapse and block the flow. We solved this potential problem          The NOAA Chemical Sciences Laboratory (CSL) classic
in ATom by placing the Nafion tubes in a small aluminum             ozone instrument (Proffitt and McLaughlin, 1983) has a long
box (McMaster-Carr, 75895K series), sealed to the outside           history of measurements on high-altitude aircraft and flew on
except for a small flow (50–200 sccm) of moist air (cabin air       the GV during HIPPO. This was replaced with a new lighter
passed through a short piece of 12.7 mm o.d. tube containing        version, NOAA-2 (Gao et al., 2012), for Global Hawk mis-
wet cotton) through the box and into the exhaust line from          sions. A different group from NOAA CSL flew a chemilu-
the ozone instrument. Thus, the pressure inside and outside         minescence (CL) instrument on the DC-8 in ATom for mea-
the Nafion tubes stayed approximately equal. This setup adds        surements of ozone (Bourgeois et al., 2020), NO, NO2 , and
moisture to dry air samples, and may actually remove some           total reactive nitrogen (NOy ). Ozone data from concurrent
water from the very wettest samples (such as the tropical           GML sonde launches (Komhyr et al., 1995) and the NCAR
marine boundary layer, where the water content can exceed           chemiluminescence instrument (Ridley et al., 1992), on the
3 %), and generally keeps the humidity in the ozone instru-         GV during the Convective Transport of Active Species in the
ment constant or at least the same in both the scrubbed and         Tropics (CONTRAST) mission, were also used for ATTREX
unscrubbed flows. This simple solution eliminated the effects       data comparisons and analysis.
of rapid changes in humidity, as demonstrated by compar-               The diode laser hygrometer (DLH; Diskin et al., 2002;
isons with another ozone instrument (see Figs. 9 and 10 be-         Podolske et al., 2003), an open-path near-infrared absorption
low).                                                               instrument, whose optical path is defined by a transceiver in
   The new ozone and water instruments were larger than the         the fuselage and a retroreflector mounted below one of the
original models and could not fit into the existing UCATS           wings, was used to measure water vapor on the Global Hawk
shell. A 7.5 cm extension was added to the top of UCATS,            and DC-8. During ATTREX, the NOAA CSL TDL hygrom-
with the new water and ozone instruments and main cool-             eter (also from Port City Instruments) measured water vapor
ing fans secured to the top plate. The original 2B model 205        as well. The Meteorological Measurement System (MMS;
ozone instrument was left on the side to enable a compari-          Scott et al., 1990) was used on the Global Hawk and DC-8
son of results and to provide a known and reproducible pres-        missions for position and meteorological variables.
sure measurement when needed. The total weight increase
was about 5 kg, but this is negligible on an aircraft with the      4.1   Gas chromatographs
size and capacity of the DC-8. Starting in 2019, an additional
repackaging and upgrade of UCATS has been carried out for           Global Hawk flights during the GloPac mission covered a
flights on the ER-2 aircraft; this is described in Sect. 5.         wide range of air masses in the stratosphere and provided
                                                                    an opportunity to demonstrate the capabilities of UCATS
                                                                    in the environment for which it was designed. Figure 2
4   Data intercomparisons and discussion                            shows a scatter plot of SF6 vs. N2 O mole fractions for the
                                                                    flight of 23 April 2010 from Edwards Air Force Base, CA,
In this section, we present results in the stratosphere first and   to the western Arctic Ocean and back (∼ 35–85◦ N, 120–
then in the troposphere. To compare with UCATS, we used             165◦ W) at altitudes from 16 to 20 km, with two profiles
data from several other instruments. On the GV, the quan-           down to 13 km and back. N2 O and SF6 are long-lived green-

https://doi.org/10.5194/amt-14-6795-2021                                             Atmos. Meas. Tech., 14, 6795–6819, 2021
6802                                      E. J. Hintsa et al.: UAS Chromatograph for Atmospheric Trace Species (UCATS)

house gases emitted at Earth’s surface and generally decline
with altitude in the stratosphere (e.g., Plumb and Ko, 1992).
For N2 O this is primarily due to photochemical loss in the
stratosphere, and for SF6 it is because older air entered the
stratosphere at earlier times, when tropospheric SF6 mix-
ing ratios were lower (Hall et al., 2011). As a result, N2 O
and SF6 are correlated in the stratosphere, with older air
and air from higher altitudes having the lowest mixing ra-
tios for both gases. This correlation can be seen in Fig. 2,
where N2 O declines strongly from its tropospheric value
(∼ 320 ppb in 2010) as SF6 (tropospheric value ∼ 7 ppt in
2010) approaches 5.5 ppt. Data from ACATS-IV taken on the
ER-2 aircraft almost 13 years earlier in the Arctic during the      Figure 2. UCATS SF6 plotted vs. N2 O from the GloPac mission
1997 POLARIS mission are shown with the GloPac data for             (red circles), with similar data from ACATS (black squares) during
reference. POLARIS N2 O and SF6 mixing ratios were ad-              the POLARIS mission 13 years earlier. The POLARIS data have
justed upward for the tropospheric growth over the 13 years         been adjusted for the tropospheric increases in both gases between
between missions (N2 O increased from 312.5 to 322.9 ppb            1997 and 2010 (see text).
and SF6 from 3.9 to 7.0 ppt) by adding the difference in SF6
tropospheric values to the POLARIS data and multiplying
the ratio of tropospheric values to the POLARIS data for            resolution QCLS data (Fig. 4b). Each UCATS GC measure-
N2 O and other tracers that are photochemically destroyed in        ment is a roughly 2 s average of the atmospheric composi-
the stratosphere. This is mainly to bring the two data sets         tion along the flight path a few seconds before the air sam-
onto the same scale for easy visualization, though the simi-        ple is injected and is plotted here against the corresponding
larity does reflect the relatively stable nature of stratospheric   10 s average of QCLS data. Each PFP flask takes between
circulation and photochemistry. Average tropospheric values         30 s and a few minutes to fill, depending on altitude, and
of these long-lived greenhouse gases were taken from the            a comparison with QCLS data is enabled by averaging the
NOAA GML network (http://www.esrl.noaa.gov/gmd/ccgg/                QCLS data over the sampling interval associated with each
trends/global.html, last access: 29 September 2021). The            flask sample. QCLS data have been corrected here for the
measurement precision for UCATS is about ±0.05 ppt SF6              approximately 1 ppb offset with respect to the PFPs reported
(1σ ) and ±1.5 ppb N2 O, similar to ACATS but with a data           by Santoni et al. (2014) during HIPPO in 2009–2011. The
rate of every 70 s instead of 360 s. The slightly more grad-        UCATS vs. QCLS correlation allows an upper limit estimate
ual slope for POLARIS data is due to the fact that SF6 was          of UCATS precision, assuming all the error is associated with
increasing more slowly in the 1990s than in the years just be-      the UCATS measurements, none from QCLS, and that ef-
fore GloPac (Hall et al., 2011) and perhaps other more subtle       fects related to atmospheric variability arising from timing
differences in the trends. Similar plots of GloPac and (ad-         mismatches are negligible. The resulting standard deviation
justed) POLARIS CH4 vs. N2 O and H2 vs. CH4 data from               (1σ precision) is ±1–2 ppb over the entire month of HIPPO
the same flights (Fig. 3) show close correspondence between         flights, from the high Arctic through the tropics to the South-
the two campaigns and tight, nearly linear correlations, as ex-     ern Ocean and back. The slope of the fit is 0.91 ± 0.004; this
pected from the fact that these are all long-lived gases in the     difference has not been resolved. We note that the slope for
stratosphere. Overall, UCATS precision for CH4 and H2 was           the PFP data is 0.93 ± 0.02, though this is partially driven by
±7–8 ppb (0.5 %) and ±5 ppb (1 %) respectively, equal to            the smaller slope for tropospheric (high N2 O) data, as op-
or slightly better than that of ACATS-IV and with a slightly        posed to for UCATS, where the slope is also smaller in the
faster data rate.                                                   troposphere but clearly reflects differences in the stratosphere
   The START-08 and HIPPO missions were the first tropo-            (low N2 O), where the dynamic range of N2 O is large. The
spheric campaigns for UCATS. On 12 January 2009, during             UCATS and PFP results agree closely over the more limited
the first HIPPO deployment, the GV sampled air in both the          range of PFP N2 O data, but because the measurements were
troposphere and stratosphere as it traveled from Anchorage,         not simultaneous, a quantitative comparison is not possible.
AK, north to near 80◦ N over the Arctic Ocean and back.                In ATom, with the GC system optimized for all condi-
The precision for UCATS N2 O during most of the flight was          tions, UCATS produced precise and accurate data in the
near ±1 ppb in both the troposphere and stratosphere, cal-          troposphere with both short- and long-term stability and
culated from flight segments with near-constant N2 O near           without degradation in the humid tropics. This is demon-
the start of the flight and comparisons with QCLS and PFP           strated by N2 O and SF6 time series for the DC-8 flight of
samples throughout the flight (Fig. 4a). A more quantitative        29 January 2017, from Palmdale, CA, to northern Alaska and
comparison can be made by plotting UCATS and PFP data               back to Anchorage (∼ 35–70◦ N, 120–155◦ W), and scatter
for the entire HIPPO 1 deployment against the higher-time-          plots for the entire ATom-2 deployment (Fig. 5). Data from

Atmos. Meas. Tech., 14, 6795–6819, 2021                                               https://doi.org/10.5194/amt-14-6795-2021
E. J. Hintsa et al.: UAS Chromatograph for Atmospheric Trace Species (UCATS) 6803
Figure 4. N2 O data from the HIPPO mission on the GV aircraft.
Figure 3. Similar correlation plots to Fig. 2, showing CH4 vs. Panel (a) shows the time series from a flight north from Anchor-
N2 O (a) and H2 vs. CH4 (b). Molecular hydrogen increases slightly age, AK, over the Arctic Ocean and back. The aircraft flew several
in the stratosphere from CH4 photooxidation, leading to their anti- profiles from 14 km to near the surface during the flight. Panel (b)
correlation. shows UCATS and PFP data plotted against QCLS data over the
entire deployment.
UCATS, PANTHER, QCLS (N2 O only), and PFPs show ex- is at low values, where PANTHER and UCATS both measure
cellent agreement for the time series (mean differences typi- about 3 ppb lower than the QCLS instrument, a deviation
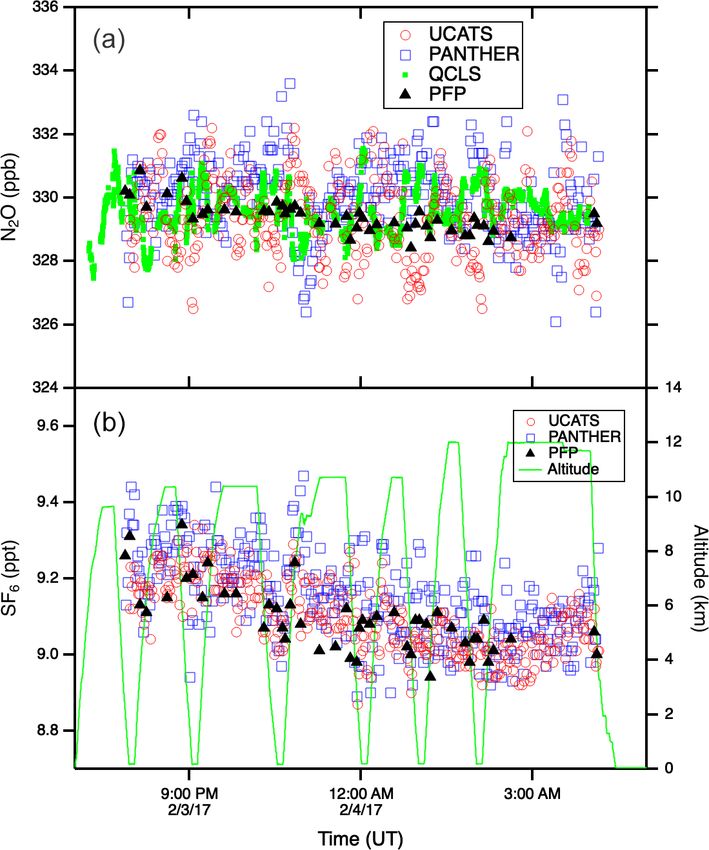
cally ±1–2 ppb N2 O and ±0.05 ppt SF6 ). ATom QCLS N2 O in the opposite direction compared to HIPPO. The tropical
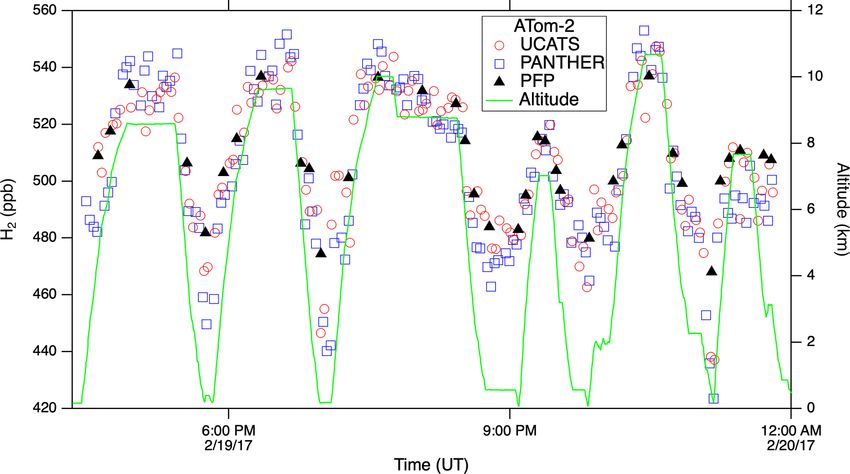
data show a similar offset relative to PFPs (taken as the ref- flight of 3 February 2017 (Fig. A3) illustrates the precision of
erence instrument on board) as observed during HIPPO, at- N2 O and SF6 where air masses sampled along the flight track
tributed to the QCLS calibration procedure. As in Gonza- varied slowly (because of its altitude range, the DC-8 is al-
lez et al. (2021), QCLS N2 O data are corrected by subtract- ways in the troposphere at these latitudes). H2 measurements
ing the offset with respect to the PFP data (∼ 1.2 ppb). The also showed good agreement between UCATS, PANTHER,
1σ precision of UCATS and PANTHER was ∼ ±1 ppb N2 O and PFPs (Fig. 6), with nearby data points from the different
and ±0.05 ppt SF6 from both the time series and the scatter instruments typically differing by about ±5 ppb (1 %) over
plots (again assuming all the variability in the comparison the entire range of observed values. Values for precision and
with QCLS is associated with the GC data). As described agreement of measurements from ATom and other missions
above, SF6 and N2 O are well correlated in the stratosphere, are summarized in Table 2.
and the precision of SF6 from the lower right panel can be
estimated for stratospheric data (lower values of both gases). 4.2 Ozone – stratosphere
In the troposphere, the plot reflects the strong latitudinal gra-
dient in SF6 , with lower SF6 in the Southern Hemisphere This section is primarily focused on the ATTREX mission,
and higher SF6 in the Northern Hemisphere. This leads to which was designed to probe the chemical composition of
a much steeper apparent slope, since N2 O also has a latitudi- air over the tropical Pacific and transport into the strato-
nal gradient, but weaker, also with lower values in the South- sphere but applies to all UCATS stratospheric data. Because
ern Hemisphere. Transitions between the troposphere and the ozone mixing ratios peak in the stratosphere, the main re-
stratosphere lead to mixing lines between the two branches quirements for a stratospheric ozone measurement are ac-
(from ∼ 310–330 ppb N2 O). The only disagreement for N2 O curacy and stability, with sensitivity to low values usually
https://doi.org/10.5194/amt-14-6795-2021 Atmos. Meas. Tech., 14, 6795–6819, 2021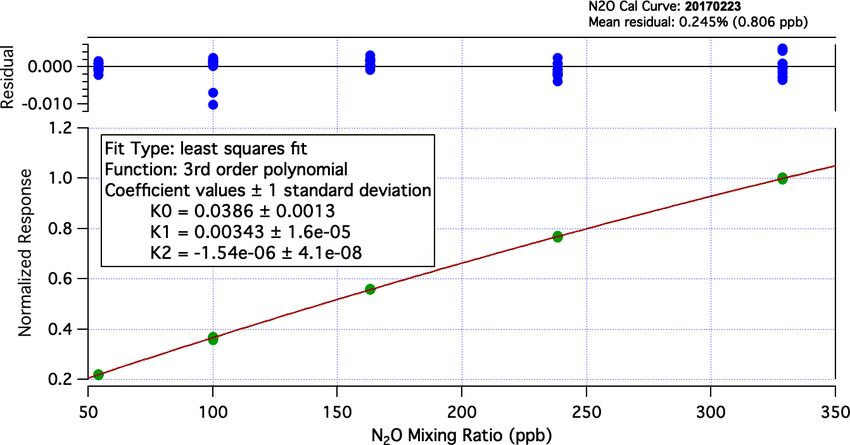
6804                                       E. J. Hintsa et al.: UAS Chromatograph for Atmospheric Trace Species (UCATS)

Figure 5. N2 O and SF6 time series for one flight (a, c) and scatter plots for all the NOAA instruments against QCLS N2 O data from the
entire ATom-2 deployment. The flights, from 26 January to 21 February 2017, spanned the Pacific, Atlantic, and Southern oceans and the
Arctic. With improvements to the N2 O/SF6 channel, UCATS was able to achieve similar precision to the HIPPO-1 data shown in Fig. 4 but
without the instability driven by accumulated water in the GC columns. N2 O and SF6 do not have a simple relationship in the troposphere,
so the panel on the lower right does not yield a single curve as in Fig. 2.

less critical. In GloPac, the 2B model 205 in UCATS agreed
within 1 % with the NOAA classic ozone instrument over the
large observed range of ozone mixing ratios (Fig. A4). How-
ever, as discussed in Sect. 3, requirements are different in the
TTL, where ozone mixing ratios are very low, often less than
30 ppb. Both measurement accuracy and precision are essen-
tial at these low values, and even errors of a few parts per
billion in ozone (or small measurement biases in water vapor
and other trace gases) can lead to different interpretations of
the underlying atmospheric processes. The accuracy of the
model 205 ozone instrument can be calculated similarly to
Proffitt and McLaughlin (1983), where the most important
uncertainties are the absorption cross section of ozone, the           Figure 6. H2 from UCATS, PANTHER, and PFPs showed close
accuracy of cell temperature and pressure measurements, the            agreement in the troposphere and lower stratosphere during ATom.
absorption path length, and any nonlinearities in detector re-         Because of the dominant soil sink for H2 , mixing ratios are lower
sponse. These add up to a few percent, but the initial calibra-        near the surface, as seen on this flight from Thule, Greenland, to
tion of the 2B instruments against a reference standard (by            Anchorage, AK, over the Canadian Arctic, the Arctic Ocean, and
2B) should correct for any slight inaccuracies. In all our cal-        Alaska.
ibration checks, the slope was within 1 % of unity and the
offset less than 2 ppb (usually < 1 ppb) at ambient pressure
(∼ 840 mbar in Boulder, CO, and 920 mbar in California) and            UCATS and NOAA-2 ozone data from ATTREX-2 (Fig. 7)
room temperature.                                                      shows that the slope is close to unity with a crossover point
   As described in Sect. 3, two model 205 sensors were flown           near 500 ppb. At low ozone (20–30 ppb), the UCATS data
in UCATS during ATTREX-2 and 3, with data from the                     are on average lower by 3–4 ppb. Since the absorption cross
two instruments merged into a single data set with faster              sections are the same for both instruments and cell length is
time resolution than the original instrument. A comparison of          fixed (and measured to better than 1 % accuracy), the princi-

Atmos. Meas. Tech., 14, 6795–6819, 2021                                                  https://doi.org/10.5194/amt-14-6795-2021
E. J. Hintsa et al.: UAS Chromatograph for Atmospheric Trace Species (UCATS)                                                                         6805

Table 2. Precision of UCATS measurements for selected missions, level of agreement with other instruments on the same platform, and
comparison of lower tropospheric values of long-lived gases with the NOAA surface network. The NOAA surface network of flask collection
sites allows the airborne measurements to be tied to a global system with calibration scales for all the gases measured by GC. The NOAA
airborne instruments use standards from the same laboratory as the surface network, as well as the same scales. CO is not included because
it was usually measured by other instruments and has an artifact in the stratosphere at high ozone levels. In the troposphere the precision
for CO was typically 5–10 ppb. The main sink of H2 is at the surface and it has the most variability there, so we do not compare it with the
surface network. Not all deployments and measurements achieved the same level of precision as shown here. This table applies to HIPPO 1
for long-lived gases; GloPac and ATTREX-2 and 3 for N2 O and SF6 ; and ATom-2, 3, and 4 for all species measured by UCATS.

                      Mission            Year              Molecule        Precision         Agreement with                Agreement with
                                                                                             onboard instruments           surface network
                      HIPPO              2009–2011         N2 O            1.5 ppb           2 ppba                        1 ppb
                                                           SF6             0.05 ppt          0.05 ppt                      0.03 ppt
                                                           CH4             15 ppb            10 ppb                        15 ppb
                                                           H2              5 ppb             5 ppb                         –
                                                           O3              9 ppb             3 ppb                         –
                                                           H2 O            1 ppmb            5%                            –
                      GloPac and         2010              N2 O            1 ppb             –                             –
                      ATTREX             2011–2015         SF6             0.04 ppt          –                             –
                                                           CH4             7.5 ppb           5 ppb                         –
                                                           H2              5 ppb             –                             –
                                                           O3              5–10 ppbc         1 % or 2 ppbc                 –
                                                           H2 O            1 ppm             5%                            –
                      ATom               2016–2018         N2O             1 ppb             1.5 ppb                       0.8 ppb
                                                           SF6             0.05 ppt          0.05 ppt                      0.04 ppt
                                                           CH4             15 ppb            5 ppb                         10 ppb
                                                           H2              5 ppb             5 ppb                         –
                                                           O3              2–3 ppb           < 1 ppb                       –
                                                           H2 O            0.1 ppm           in process                    –
                    a For these measurements, UCATS agreed to 1–2 ppb with PFP whole air samples; we consider these to be the most precise and
                    accurate measurements of N2 O. Agreement with QCLS in the troposphere was also 1–2 ppb but diverged for N2 O < 300 ppb,
                    with differences up to 4 ppb. The goal of HIPPO was to quantify long-lived tracers and other greenhouse gases in the
                    troposphere, with less emphasis on the stratosphere. Because UCATS is calibrated with a range of standards from 160–322 ppb
                    in HIPPO, we are confident in our measurements throughout the stratosphere, though these calibrations are performed on the
                    ground and only one standard (with mixing ratios close to the background troposphere) is used in flight. b Precision for water
                    vapor is best expressed as a percentage in the troposphere (high water vapor) and an absolute number in the stratosphere (low
                    water). The precision here is given for the lowest water vapor values in the stratosphere, 1 ppm for the original MayComm
                    instrument and 0.1 ppm for the newer Port City instrument. The precision in the troposphere was always 5 % or better.
                    Calibration and comparison of the Port City instrument are still ongoing. c The precision and agreement for ozone are best
                    expressed in parts per billion at low mixing ratios and as a percentage at high mixing ratios. For example, in ATTREX and
                    GloPac, where ozone ranged from less than 20 to over 2000 ppb, the average agreement with the CSL instrument was better
                    than 1 ppb for ozone < 200 ppb, with a precision better than 10 ppb, and for ozone > 500 ppb, the average agreement was better
                    than 1 %, with a precision of 2 %–3 %. Values for ATom are for tropospheric data (O3 < 100 ppb), since the focus of ATom was
                    on tropospheric chemistry.

pal known sources of error are inaccuracies in measured cell                          ing ambient air as it flows to the cell (Gao et al., 2012).)
temperature and pressure. The pressure sensor in the older                            The offset between NOAA-2 and 2B data bears further ex-
2B instrument was carefully calibrated over a range of pres-                          amination. UV ozone photometers have been shown to pro-
sures for many years (2010–2016) and was stable through-                              duce offsets when transitioning from wet to dry conditions
out that time. A small correction was made to account for                             (Wilson and Birks, 2006), and that is certainly the case for
the pressure drop from the cell to its outlet (where pres-                            the model 205, as discussed in the following section. How-
sure is measured). This introduced about a 1 % increase in                            ever, except on initial ascent, air sampled in ATTREX was
ozone at the highest altitudes but was negligible at lower al-                        always extremely dry, and any artifact should become neg-
titudes. Temperature is measured on the cell body rather than                         ligible within 1 h. Similar agreement between NOAA-2 and
in the airflow, but air temperature should have time to equili-                       the original 2B instrument was obtained on ATTREX-1 and
brate inside UCATS before reaching the ozone instruments.                             GloPac. Laboratory tests for measurement artifacts of the 2B
(Flow to each 2B is ∼ 10 % of that for NOAA-2, which has                              under various conditions produced mostly negligible offsets
been shown to measure temperature accurately after warm-                              and always less than 5 ppb.

https://doi.org/10.5194/amt-14-6795-2021                                                                      Atmos. Meas. Tech., 14, 6795–6819, 2021
6806 E. J. Hintsa et al.: UAS Chromatograph for Atmospheric Trace Species (UCATS)
Figure 7. Merged UCATS ozone data from the two 2B model 205
instruments plotted against coincident data from the NOAA Chem-
ical Sciences Laboratory NOAA-2 ozone instrument for all six re-
search flights during ATTREX-2 in 2013. The green line is the least
squares fit to the data (parameters shown in the legend), and the 1 : 1
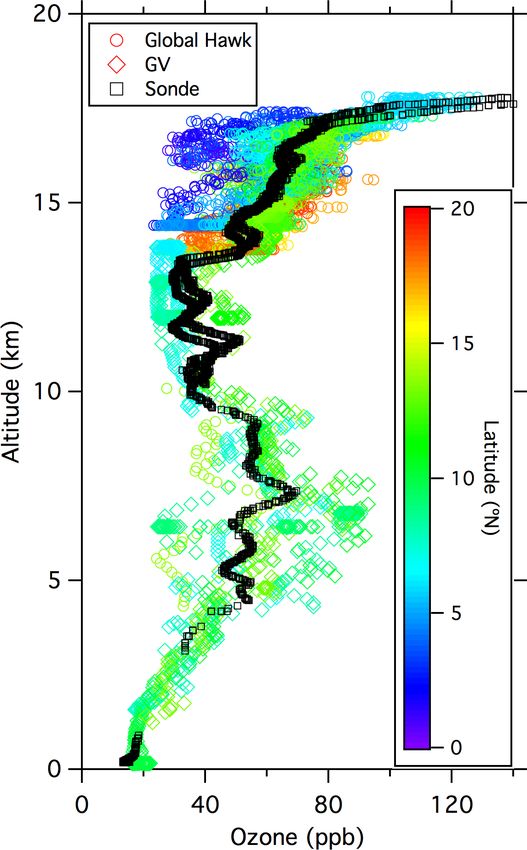
line is shown in black. The inset shows ozone values < 100 ppb. Figure 8. UCATS and ozonesonde data from 17 February 2014 near
Andersen Air Force Base, Guam. UCATS data (solid green squares)
from the last part of the flight are binned and averaged by altitude;
During ATTREX-3, payload weight and balance issues the solid black circles are the binned and averaged sonde descent
prevented the NOAA-2 instrument from being flown on data from near when the Global Hawk landed. The inset shows a
the Global Hawk. Coincident balloon-borne electrochemical scatter plot of binned UCATS and sonde data at coincident altitudes;
concentration cell (ECC) ozonesonde launches from Guam the 1 : 1 line is shown in black.
provide a comparison for these flights. Data from the last 2 h
of the 16–17 February 2014 Global Hawk flight (Fig. 8) most the tropics, with an example shown in Fig. 9 (top). At low
closely overlapped one of the balloon profiles in space and altitudes there was generally good agreement (mean differ-
time (within 100 km and 1–2 h). The agreement between the ence is 0.4 ppb, standard deviation is ±4.2 ppb for HIPPO
ECC and the 2B instruments in the troposphere (< 16 km, 4), but as the GV aircraft climbed out of the very wet lower
where the balloon and aircraft were in closest proximity) troposphere to higher altitudes, or descended back into the
is quite good and shows no significant bias in the UCATS lower troposphere, changes in water retained in the scrubber
data. A further check on UCATS ozone data is shown in likely affected the reflected light along the sides of the cell,
Fig. A5 with ozone data from the GV aircraft (operating dur- causing anomalous ozone readings. Even though flows were
ing the concurrent CONTRAST mission; Pan et al., 2017), greater than 1 L/min, the instrument took 15 min or more to
the Global Hawk, and the Guam ozonesonde launch, which recover. In ATom, with the newer model 211 instrument and
was timed to overlap with the return of the Global Hawk on moisture exchangers for both scrubbed and unscrubbed air,
13 February. In summary, based on laboratory calibrations, the agreement was much closer over a similar flight track,
tests, and in-flight comparisons, we assign a systematic un- and there were no anomalous data segments as the DC-8
certainty of less than 5 ppb to our model 205 ozone data in ascended and descended (Fig. 9, bottom). The one discrep-
the TTL and lower stratosphere. The precision in the TTL ancy is in the tropical marine boundary layer (MBL), where
ranged from ±5 to 10 ppb but can be improved by temporal UCATS was typically a few parts per billion higher than the
averaging. The low values of ozone in the TTL demonstrate chemiluminescence instrument. This disagreement is outside
the importance of precise and sensitive ozone measurements the combined uncertainties of the two instruments and is not
in this region and the need to minimize or eliminate any sys- currently understood; UCATS showed no differences when
tematic errors. calibrated with wet or dry air in the laboratory, and the effect
of water vapor on the chemiluminescence instrument has re-
4.3 Ozone – troposphere cently been re-checked. There were no offsets in the high-
latitude MBL (agreement within 1 ppb; see Fig. A7), so it is
As described above, the model 205 in UCATS disagreed with
presumably related to the high humidity or something else
the NOAA classic ozone instrument during HIPPO follow-
present in the tropical MBL.
ing transitions between wet and dry air. Most flights had
only minor artifacts, but the issue was most pronounced in
Atmos. Meas. Tech., 14, 6795–6819, 2021 https://doi.org/10.5194/amt-14-6795-2021E. J. Hintsa et al.: UAS Chromatograph for Atmospheric Trace Species (UCATS) 6807
Figure 9. Ozone time series from HIPPO (a) and ATom (b). The
upper plot shows an example of the discrepancies between the 2B Figure 10. Scatter plots of UCATS ozone (2B model 205) vs.
model 205 and NOAA classic ozone instruments observed in the CSL classic ozone (a) and UCATS ozone (2B model 211) vs. CSL
tropics during HIPPO; extratropical flights were in closer agree- chemiluminescence ozone (b) from tropospheric observations.
ment. The lower plot shows ATom data (over a similar range of
latitudes) from the NOAA chemiluminescence instrument and the
UCATS model 211 ozone instrument, modified with moisture ex- ments have a precision in the troposphere of about ±0.5 ppb.
changers to ensure that air to both cells remained at reasonably high The larger deviations occasionally observed in the ATom data
humidity. are mostly due to timing mismatches during flight segments
with sharp gradients in ozone, along with occasional outliers
from all instruments (see Fig. A6). The older model 205 was
Scatter plots of UCATS ozone data against the correspond-
also flown during ATom as a backup and for comparison with
ing instrument from NOAA CSL (Fig. 10) showed reason-
the model 211; the model 205 showed some of the same devi-
able overall agreement in HIPPO, with the slope within 1 %
ations between wet and dry air as in HIPPO, while the model
of unity. But in HIPPO, there are many UCATS data points
211 with Nafion moisture exchangers tracked the CSL in-
in the troposphere with significantly higher ozone than mea-
strument closely. For many applications, such as climatolo-
sured by the NOAA classic ozone instrument (e.g., near
gies, chemical modeling, and transport studies in the tropo-
50 ppb). The improvement between HIPPO (top) and ATom
sphere, the precision of the model 211 (±0.5 ppb at sea level)
(bottom) is dramatic. This is partly due to the longer optical
as flown during ATom is more than adequate, given the good
path length in the model 211, as well as other instrumental
overall agreement with the chemiluminescence instrument.
improvements, but the addition of the Nafion moisture ex-
In the stratospheric parts of the ATom flights, the model
changers makes a substantial difference as the aircraft transi-
211 instrument had precision of about ±1 % and agreement
tions between wet and dry air masses. It should be noted that
within 2 % (not shown).
the NOAA CSL instruments being compared to here have
completely different designs – the classic ozone instrument is
a UV photometer like the 2B, while in ATom, ozone was de-
tected by chemiluminescence, though it is fundamentally cal-
ibrated using an optical measurement. Both of these instru-
https://doi.org/10.5194/amt-14-6795-2021 Atmos. Meas. Tech., 14, 6795–6819, 2021You can also read