Vermont Greenhouse Gas Emissions Inventory and Forecast: 1990 2017 - Prepared by the Air Quality and Climate Division in accordance with 10 ...
←
→
Page content transcription
If your browser does not render page correctly, please read the page content below
DEPARTMENT OF ENVIRONMENTAL CONSERVATION                                           Agency of Natural Resources

                          Vermont Greenhouse Gas Emissions Inventory and Forecast:
                                                     1990 – 2017

                                Prepared by the Air Quality and Climate Division
                                           in accordance with 10 V.S.A. § 582
                                                      May 2021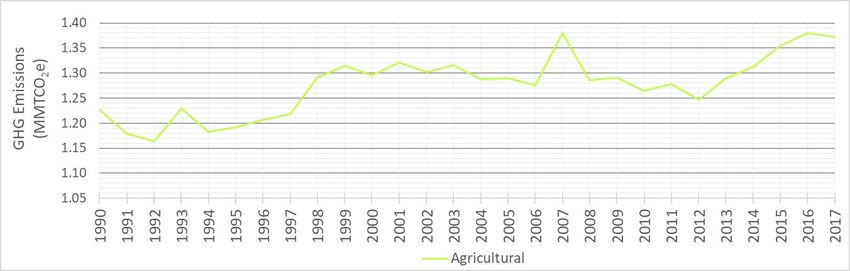
Vermont Greenhouse Gas Emissions Inventory and Forecast: 1990 - 2017

~ This page intentionally left blank ~

                   1
Vermont Greenhouse Gas Emissions Inventory and Forecast: 1990 - 2017

Table of Contents
Note to Readers ............................................................................................................................... 4
Acronyms & Abbreviations ............................................................................................................ 5
Executive Summary ........................................................................................................................ 7
1.    Introduction ............................................................................................................................. 9
1.1       Background Information ...................................................................................................... 9
1.2       Inventory Development and Methodologies ...................................................................... 10
2.    Vermont Greenhouse Gas Emissions Overview ................................................................... 12
2.1       Vermont GHG Comparisons.............................................................................................. 12
2.2       Vermont GHG Emissions by Sector .................................................................................. 13
2.2.1 Overview .............................................................................................................................. 13
2.2.2        Transportation/Mobile Sources ...................................................................................... 14
2.2.3        Residential/Commercial/Industrial (RCI) Fuel Use ....................................................... 19
2.2.4        Agriculture ..................................................................................................................... 20
2.2.5        Industrial Processes ........................................................................................................ 22
2.2.6        Electricity Consumption................................................................................................. 25
2.2.7        Waste .............................................................................................................................. 27
2.2.8        Fossil Fuel Industry ........................................................................................................ 28
3.    Additional Emissions Inventory Considerations ................................................................... 29
3.1       Land Use, Land-Use Change, and Forestry ....................................................................... 29
3.2       Biogenic CO2 ..................................................................................................................... 31
3.3       Lifecycle Assessments and Consumption Based Inventories ............................................ 33
3.4       Black carbon ...................................................................................................................... 34
4.    Emissions Forecasts ............................................................................................................... 35
4.1       Preliminary Greenhouse Gas Emissions Estimates for 2018 and 2019 ............................. 35
4.2       Five- and Ten-Year Projections ......................................................................................... 37
5.    Conclusion ............................................................................................................................. 38
Appendix A – Vermont Historic Greenhouse Gas Emissions by Sector , .................................... 40

List of Tables
Table 1: Global warming potential values. ................................................................................... 10
Table 2: GHG Emissions for 2017 and Sector Contributions....................................................... 11
Table 3: Mobile source contributions by fuel type. ...................................................................... 17

                                                                        2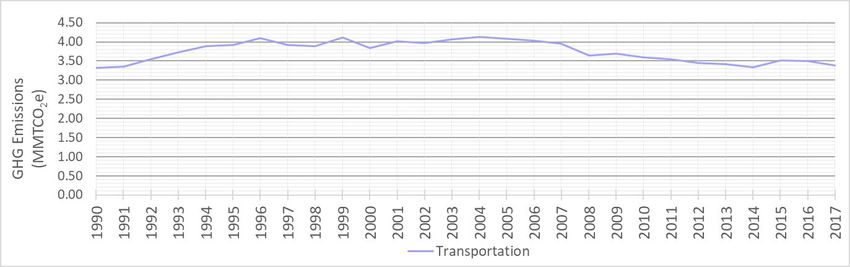
Vermont Greenhouse Gas Emissions Inventory and Forecast: 1990 - 2017

Table 4: Percent contribution to transportation emissions from onroad and nonroad sources (2017
NEI)............................................................................................................................................... 17
Table 5: Percent contribution to transportation emissions by vehicle type (2017 NEI). .............. 18
Table 6: GHG emissions contribution of residential, commercial, and industrial subsectors. ..... 20
Table 7: GHG emissions contributions by fuel type within the RCI sector. ................................ 20
Table 8: GHG emissions contributions of subsectors within the agriculture sector. .................... 21
Table 9: GHG emissions contributions of subsectors with the industrial process sector. ............ 23
Table 10: Preliminary GHG emissions estimates for 2018 and 2019. .......................................... 36
Table 11: Five- and Ten-Year GHG emissions projections.......................................................... 38

List of Figures
Figure 1: Vermont statewide greenhouse gas emissions levels and mandated reduction targets as
defined in 10 V.S.A. § 578. ............................................................................................................ 8
Figure 2: U.S. and Vermont gross GHG emissions in billion MTCO2e (note that the Vermont
series appears adjacent to the horizontal axis). ............................................................................. 12
Figure 3: Vermont gross GHG emissions in million MTCO2e. ................................................... 12
Figure 4: Vermont GHG percent contributions by sector. ............................................................ 13
Figure 5: U.S. GHG percent contributions by sector. ................................................................... 13
Figure 6: Total and sector-specific GHG emissions in Vermont, 1990-2017. ............................. 14
Figure 7: Vermont GHG emissions from transportation/mobile sources sector........................... 14
Figure 8: Comparison of GHG emissions based on NEI methodology to the updated fuel
combustion methodology. ............................................................................................................. 18
Figure 9: Vehicle miles traveled in Vermont by year (Source: VTrans). ..................................... 18
Figure 10: Gallons of gasoline and diesel sold in Vermont by year (Source: Joint Fiscal Office).
....................................................................................................................................................... 19
Figure 11: Vermont GHG emissions from the RCI sector, 1990-2017. ....................................... 19
Figure 12: Vermont GHG emissions from the agriculture sector, 1990-2017. ............................ 21
Figure 13: Vermont GHG emissions from the industrial processes sector, 1990-2017. .............. 23
Figure 14: Vermont GHG emissions from the electricity sector, 1990-2017. .............................. 25
Figure 15: Vermont GHG emissions from the waste sector, 1990-2017. ..................................... 27
Figure 16: Vermont GHG emissions from the fossil fuel industry sector, 1990-2017. ................ 29
Figure 17: Sequestration of CO2 by forested areas and urban trees in Vermont, 1990-2017. ...... 31
Figure 18: Forested land area in Vermont, 1990-2017. ................................................................ 31
Figure 19: Vermont biogenic CO2 emissions and sequestration scenarios, 1990-2017. .............. 32
Figure 20: Black carbon emissions contributions in Vermont...................................................... 35

                                                                            3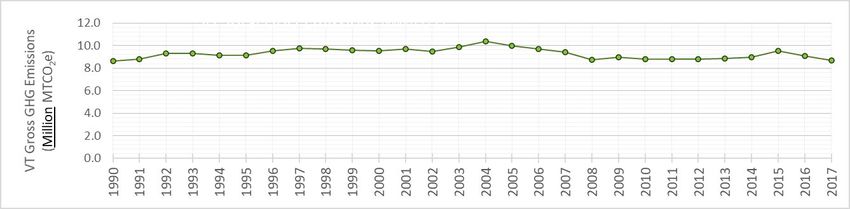
Vermont Greenhouse Gas Emissions Inventory and Forecast: 1990 - 2017

Note to Readers
Vermont Greenhouse Gas Emissions Inventory and Forecast reports are designated as either
“Comprehensive” or as “Brief.” Comprehensive reports will coincide with the calendar year
releases of the triennial National Emissions Inventory (NEI) produced by the U.S. Environmental
Protection Agency (EPA) and will provide a greater level of detail on sectors and graphics than
the reports designated as “Brief.” This is due mainly to the fact that the NEI helps to inform
details and more granular information for several sectors.

The following report for the 1990 – 2017 inventory and forecast is designated as Comprehensive.

This and previous reports may be found at the following link:
https://dec.vermont.gov/air-quality/climate-change

List of Previous Reports:
   -   Greenhouse Gas Emissions Inventory Update and Forecast: Brief (1990 – 2016)
   -   Greenhouse Gas Emissions Inventory Update: Brief (1990 – 2015)
   -   Greenhouse Gas Emissions Inventory Update: Comprehensive (1990 – 2014)
   -   Greenhouse Gas Emissions Inventory Update (1990 – 2013)
   -   Greenhouse Gas Emissions Inventory Update (1990 – 2012)
   -   Greenhouse Gas Emissions Inventory Update (1990 – 2011)
   -   Greenhouse Gas Emissions Inventory Update (1990 – 2009)
   -   Greenhouse Gas Emissions Inventory Update (1990 – 2008)
   -   Greenhouse Gas Inventory and Reference Case Projections - Governor's Commission on
       Climate Change (1990 - 2030)

                                                4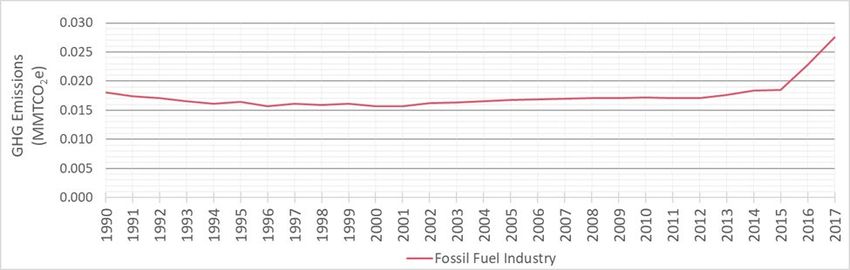
Vermont Greenhouse Gas Emissions Inventory and Forecast: 1990 - 2017

Acronyms & Abbreviations
AADT: annual average daily traffic
AAFM: Agency of Agriculture, Food and Markets
AR4: Intergovernmental Panel on Climate Change Fourth Assessment Report
ANR: Agency of Natural Resources
BAU: business-as-usual
Btu: British thermal unit
CCS: Center for Climate Strategies
CEP: Comprehensive Energy Plan
CFCs: chlorofluorocarbons
CH4: methane
CO2: carbon dioxide
DMV: Department of Motor Vehicles
e-CFR: Electronic Code of Federal Regulations
EC: elemental carbon
EIA: Energy Information Administration
EPA: Environmental Protection Agency
FLIGHT: Facility Level Information on GreenHouse gases Tool
MMTCO2e: million metric tons carbon dioxide equivalent
GHG: greenhouse gas
GHGRP: GreenHouse Gas Reporting Program
GWP: global warming potential
HFC: hydrofluorocarbon
HCFCs: hydrochlorofluorocarbons
HPMS: Highway Performance Monitoring System
HQ: Hydro-Québec
IP: industrial processes
IPCC: Intergovernmental Panel on Climate Change
ISO-NE: independent systems operator – New England
JFO: Joint Fiscal Office
LCA: life cycle assessment
LEAP: Low Emissions Analysis Platform model

                                                  5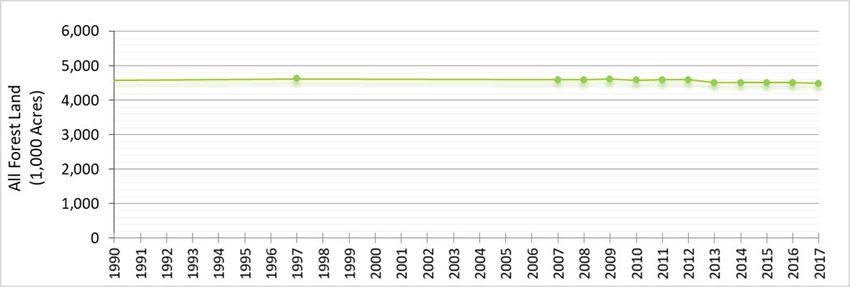
Vermont Greenhouse Gas Emissions Inventory and Forecast: 1990 - 2017

LFG: landfill gas
LFGTE: landfill gas-to-energy
LULUCF: land-use, land use change, and forestry
MOVES: MOtor Vehicle Emissions Simulator model
N2O: nitrous oxide
NEI: National Emissions Inventory
NEPOOL-GIS: New England Power Pool - Generation Information System
NF3: nitrogen trifluoride
NG: natural gas
ODS: ozone depleting substances
PHMSA: Pipeline and Hazardous Materials Safety Administration
PFC: perfluorocarbon
PSD: Public Service Department
RCI: residential/commercial/industrial
REC: renewable energy certificate
RES: Renewable Energy Standard
SEDS: State Energy Data System
SF6: sulfur hexafluoride
SIT: State Inventory Tool
SNAP: Significant New Alternatives Program
UNFCCC: United Nations Framework Convention on Climate Change
USDA: United States Department of Agriculture
VMT: vehicle miles traveled
VTrans: Vermont Agency of Transportation

                                                 6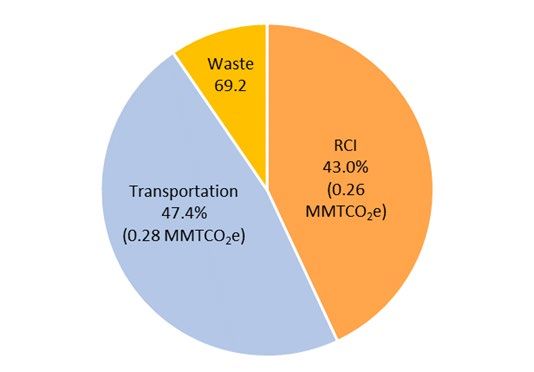
Vermont Greenhouse Gas Emissions Inventory and Forecast: 1990 - 2017

        Executive Summary
        The concentration of greenhouse gases (GHG) in the earth’s atmosphere are increasing due to
        human caused emissions. Greenhouse gases absorb solar radiation and trap heat energy in the
        atmosphere, which warms the planet and is already having impacts here in the Northeastern U.S.
        and around the globe. 1 Understanding Vermont’s contribution to this global problem and the
        sources and sectors which are responsible for these emissions is a critical first step in mitigating
        climate change. The goal of this inventory is to provide that understanding of emissions for
        Vermont in a way that is consistent with other jurisdictions to enable the tracking of emissions
        levels through time and to help inform decisions on future mitigation pathways.

        The Vermont Greenhouse Gas Emissions Inventory and Forecast reports are required in Vermont
        statute 10 V.S.A. § 582 in order to establish historic 1990 and 2005 baseline GHG levels and to
        track changes in emissions through time to determine progress toward the state’s GHG reduction
        targets as established in 10 V.S.A. § 578. 2 Greenhouse gas reduction targets previously listed in
        10 V.S.A. § 578 have been modified by the passage of the Global Warming Solutions Act (Act
        153) in 2020. 3 The updated targets are now mandatory reductions of 26% below 2005 levels by
        2025, 40% below 1990 levels by 2030, and 80% below 1990 levels by 2050.

        Calculation methodologies used in this report are primarily based on EPA State Inventory Tool
        (SIT) methodologies, which the EPA creates for state use to assist states with comprehensive and
        often complex estimation methods, as well as to help maintain consistency in inventory reporting
        across jurisdictions. The methods used in this inventory are generally informed by the Final
        Vermont Greenhouse Gas Inventory and Reference Case Projections, 1990-2030 report and are
        consistent with Intergovernmental Panel on Climate Change (IPCC) guidelines. Many of the
        calculations in this inventory rely on large federal datasets, especially the Energy Information
        Administration (EIA) State Energy Data System (SEDS) dataset, which contributes to the lag
        time between the inventory year and the year of release that averages roughly three years.

        Most of the methodologies in this inventory were the same as those used in the previous
        inventory with one notable exception. A change was made to the transportation sector
        calculation methodology transitioning away from the triennial National Emissions Inventory
        (NEI) vehicle miles traveled (VMT) based values to a method based on fuel sales data, which is
        the method suggested by the IPCC. This change was made in large part because of unresolvable
        issues with the 2017 NEI values and because accurately projecting data for years between NEI
        values is problematic. The change in methodology for the transportation sector does have
        significant impacts on overall emissions levels, lowering levels in the 2005 baseline year by 0.4
        MMTCO2e and causing even greater decreases in the more recent years as compared to what was
        presented in the previous inventory report.

1
  U.S. Global Change Research Program – Fourth National Climate Assessment: Chapter 18: Northeast
https://nca2018.globalchange.gov/downloads/NCA4_2018_FullReport.pdf
2
  Vermont Statute 10 V.S.A. § 582: https://legislature.vermont.gov/statutes/section/10/023/00582
  Vermont Statute 10 V.S.A. § 578: https://legislature.vermont.gov/statutes/section/10/023/00578
3
  Vermont Legislature - Global Warming Solutions Act (Act 153):
https://legislature.vermont.gov/Documents/2020/Docs/ACTS/ACT153/ACT153%20As%20Enacted.pdf
                                                              7
Vermont Greenhouse Gas Emissions Inventory and Forecast: 1990 - 2017
In this inventory report GHG emissions totals in Vermont are 8.66 MMTCO2e, 0.3% above the
1990 baseline levels in 2017 and 13.1% below 2005 levels. Emissions declined 0.44 MMTCO2e
from 2016 to 2017 with the majority of that decrease (0.32 MMTCO2e) coming from the
electricity sector and 0.1 MMTCO2e coming from the transportation sector. The remainder of
sectors in the inventory remained relatively flat.
The official emissions totals in this inventory report are gross annual emissions totals; however,
it is also important to acknowledge the sequestration part of the picture and to have an
understanding of net GHG emissions for the state. Similar to the previous inventory report,
sequestration totals related to forest land have been included for informational purposes and to
help account for emissions of biogenic CO2, which are not included in the gross inventory totals.
This report provides both short term (2018 and 2019) and slightly longer term (5 and 10 year)
emissions projections. Short term projections are based on the standard inventory methodologies
wherever possible and other values are carried forward from previous years where necessary.
Emissions totals in 2018 and 2019 are projected to decline by 0.03 and 0.05 MMTCO2e
respectively. Longer term emissions forecasts are incredibly difficult to predict accurately. This
has been made even more difficult with the impact on emissions from the COVID pandemic.
Modeled emissions trajectories by sector have been taken from more robust projections
completed by the Rhodium Group for their ClimateDeck and Taking Stock report to at least
provide directionality of the emissions trajectories by sector. 4 Emissions projections for 2022
and 2027 are fraught with uncertainties, such as policies stemming from the implementation of
the Global Warming Solutions Act, federal actions, and changes in VMT, but are roughly
projected to be 8.02 and 8.04 MMTCO2e respectively.
Figure 1: Vermont statewide greenhouse gas emissions levels and mandated reduction targets as defined
in 10 V.S.A. § 578.
4
Rhodium Group – Climate Deck information: https://rhg.com/data_story/climate-deck/
Rhodium Group – Taking Stock report: https://rhg.com/wp-content/uploads/2020/07/Taking-Stock-2020-The-
COVID-19-Edition.pdf
8Vermont Greenhouse Gas Emissions Inventory and Forecast: 1990 - 2017
1. Introduction
Vermont Greenhouse Gas Emissions Inventory and Forecast reports are prepared annually in
accordance with 10 V.S.A. § 582. This report provides estimates of anthropogenic greenhouse
gas emissions for the state of Vermont for the years 1990 – 2017, with additional preliminary
estimates for 2018 and 2019. Emissions in the report are estimated by sector and include the
same greenhouse gases as the U.S. Greenhouse Gas Emissions and Sinks reports, with totals
shown in million metric tons of CO2 equivalent (MMTCO2e).
The annual inventory reports quantify and track greenhouse gas emissions for the state of
Vermont as accurately and consistently as possible over time and establish the 1990 and 2005
baseline levels as codified in 10 V.S.A. § 578. In 2020, 10 V.S.A. § 578 was amended by the
Global Warming Solutions Act (Act 153) which changed the GHG emissions reduction targets to
requirements. These new mandated levels are 26% below 2005 levels by 2025, 40% below 1990
levels by 2030, and 80% below 1990 levels by 2050.
This emissions inventory report quantifies emissions estimates by sector to be able to identify
relative contributions from different sources. The sectors in this report are defined based on the
sectors in the Greenhouse Gas Inventory and Reference Case Projections, 1990-2030 report. It
is also important, to the extent possible, to maintain consistency and comparability with
greenhouse gas inventories of other states in the region, with the National Emissions Inventory,
and with past emissions methodologies. Consistency in methods among states helps to minimize
the risk of emissions being unaccounted for, or double counted, and achieves a more accurate
representation of regional emissions.
1.1 Background Information
Greenhouse gases (GHGs) are gases that warm the planet by trapping heat in the atmosphere.
These gases allow shortwave solar radiation to reach the earth’s surface but absorb the longer
wave radiation that is reradiated from the surface and keep that heat energy trapped within the
atmosphere rather than allowing it to escape back into space. The higher the concentrations of
greenhouse gases in the atmosphere, the more heat energy is trapped and the warmer the planet
becomes.
There are many gases that trap heat in the atmosphere. The most significant of these gases, and
the ones included in the National Inventory Report, are carbon dioxide (CO2), methane (CH4),
nitrous oxide (N2O), hydrofluorocarbons (HFCs), perfluorocarbons (PFCs), sulfur hexafluoride
(SF6), and nitrogen trifluoride (NF3). Some of these greenhouse gases do occur naturally in the
atmosphere, such as CO2, CH4, and N2O, but since the industrial revolution human activities
have rapidly increased their concentrations leading to warming of the planet. 5
5
IPCC 2013: IPCC (2013) Climate Change 2013: The Physical Science Basis. Contribution of Working Group I to
the Fifth 1 Assessment Report of the Intergovernmental Panel on Climate Change. [Stocker, T.F., D. Qin, G.-K.,
Plattner, M. 2 Tignor, S.K. Allen, J. Boschung, A. Nauels, Y. Xia, V. Bex and P.M. Midgley (eds.)]. Cambridge
University Press, 3 Cambridge, United Kingdom and New York, NY, USA, 1535 pp.
9Vermont Greenhouse Gas Emissions Inventory and Forecast: 1990 - 2017
Some greenhouse gases are more effective at trapping heat in the atmosphere than others and
remain in the atmosphere for different amounts of time. In order to make the gases comparable
the Intergovernmental Panel on Climate Change (IPCC) developed a method using global
warming potentials (GWPs), which account for the heat trapping potency and the atmospheric
lifetime of the gas and set them relative to CO2 on a per unit of mass basis. Emissions totals in
this report incorporate those GWP adjustments and are reported in million metric tons of CO2
equivalent (MMTCO2e). The GWP values used in this report are listed in Table 1 and are those
specified by the United Nations Framework Convention on Climate Change (UNFCCC) in the
IPCC guidelines for use in national inventories and are the 100-year weighted GWP values from
the IPCC Fourth Assessment Report (AR4). 6
Table 1: Global warming potential values. 7
1.2 Inventory Development and Methodologies
Estimates of greenhouse gas emissions in this report have been calculated using methodologies
largely based on methods used in, or developed for, the Greenhouse Gas Inventory and
Reference Case Projections, 1990-2030 report and are compatible with IPCC GHG inventory
guidelines. 8 Data availability is a key factor influencing methodology decisions with the
intention of providing the most accurate emissions estimates possible while maintaining
comparability to historical data estimates to allow for the tracking of emissions levels over time.
Because of the lack of Vermont specific datasets that both encompass the entire state as well as
extend back far enough in time to inform the 1990 baseline year, a number of default federal
datasets are used to inform the emissions calculations. Where more detailed Vermont specific
data exists, the potential additional accuracy of the dataset is balanced with the need to keep the
methodologies consistent through time, with the goal of producing the most accurate and
historically comparable inventory possible.
Different sectors in the inventory employ a number of methodologies using different Vermont
specific datasets to estimate the associated GHG emissions. These sources include, but are not
limited to, data submitted to the Agency of Natural Resources (ANR) Air Contaminant
Registration Program, data provided by the Vermont Public Service Department (PSD), data
6
IPCC 2007: http://unfccc.int/resource/docs/2013/cop19/eng/10a03.pdf
7
Source: EPA Overview of Greenhouse Gases: https://www3.epa.gov/climatechange/ghgemissions/gases/n2o.html
8
IPCC (2006) 2006 IPCC Guidelines for National Greenhouse Gas Inventories. The National Greenhouse Gas 9
Inventories Programme, The Intergovernmental Panel on Climate Change
10Vermont Greenhouse Gas Emissions Inventory and Forecast: 1990 - 2017
from the Vermont Agency of Transportation (VTrans), and data submitted to EPA through the
Greenhouse Gas Reporting Program (GHGRP). For many sectors, state inventory tool (SIT)
modules are used that have been developed by EPA to assist states with GHG emissions
estimates and to help maintain consistency in methodologies across states. These SIT
methodologies generally incorporate larger federal datasets, including data from the US
Department of Agriculture (USDA), Energy Information Administration (EIA), and others,
which can be updated if more accurate local data are available.
One change in methodology in this inventory as compared to the 1990 – 2016 Greenhouse Gas
Emissions Inventory Update and Forecast is in the transportation sector and is related to a switch
from a VMT based emissions estimation methodology to a fuel consumption-based approach. In
addition, there were updates to several of the EPA SIT modules which led to differences between
the two inventories. Due to continual updates to the EPA tools, as well as updates to the
incorporated historical federal dataset values, emission factors, and methodologies, historical
emissions estimates in this report may be different from those in previous reports. Values in this
inventory supersede all values in previous reports.
The largest source sectors of GHG emissions in Vermont in 2017 were the transportation,
residential commercial and industrial (RCI) fuel use, agriculture, and industrial processes sectors.
Overall percent contributions by sector have changed somewhat compared to the previous
inventory because of the methodology update in the transportation sector, but transportation
remains the largest contributor as seen in Table 2.
Table 2: GHG Emissions for 2017 and Sector Contributions.
MMTCO2e Percent of
Inventory Sector
(2017) Total
Transportation/ Mobile Combustion 3.39 39.1%
Res/Com Fuel Use 2.69 31.0%
Agriculture 1.37 15.8%
Industrial Processes 0.57 6.5%
Electric Generation 0.49 5.7%
Waste 0.13 1.5%
Fossil Fuel Industry 0.03 0.3%
TOTAL 8.67 100%
11Vermont Greenhouse Gas Emissions Inventory and Forecast: 1990 - 2017
2. Vermont Greenhouse Gas Emissions Overview
2.1 Vermont GHG Comparisons
Total greenhouse gas emissions from the state of Vermont are a small fraction of the U.S. as a
whole (Figure 2 and Figure 3) and are small even when compared to other states. 9 However,
based on data from 2016 Vermont had the highest per capita greenhouse gas emissions in New
England, although still below the national average. 10 The small population of Vermont drives
the low overall greenhouse gas emission contribution from the state, but the relatively high per
capita value illustrates that there is progress to be made in terms of emissions reductions. 11
Figure 2: U.S. and Vermont gross GHG emissions in billion MTCO2e (note that the Vermont series
appears adjacent to the horizontal axis).
Figure 3: Vermont gross GHG emissions in million MTCO2e.
When comparing U.S. greenhouse gas emissions to Vermont by sector there are several major
differences to note. One major difference is that emissions from the transportation sector
contribute a larger percentage in Vermont than for the U.S. as a whole, as illustrated in Figure 4
and Figure 5. The high per capita vehicle miles traveled in Vermont, influenced by the rural
9
EIA – Energy-Related CO2 Emission Data Tables: https://www.eia.gov/environment/emissions/state/
10
EAN 2019 Annual Progress Report: https://www.eanvt.org/wp-content/uploads/2020/03/EAN-report-2020-
final.pdf
11
U.S. Census Bureau: Annual Estimates of the Resident Population for the United States, Regions, States, and
Puerto Rico: April 1, 2010 to July 1, 2019 (NST-EST2019-01) : https://www.census.gov/data/tables/time-
series/demo/popest/2010s-state-total.html
12Vermont Greenhouse Gas Emissions Inventory and Forecast: 1990 - 2017
nature of the state, is one reason for this discrepancy. 12 The residential/commercial/industrial
(RCI) fuel use and agriculture sectors also have greater percent shares in Vermont than the
national average due to the climate of Vermont and the economic focus on agriculture in the
state.
2017 (VT) Transportation/ Mobile
Combustion
39%
Fossil Fuel
RCI Fuel Use Industry
31%Vermont Greenhouse Gas Emissions Inventory and Forecast: 1990 - 2017
Those sectors include transportation/mobile sources, residential/commercial/industrial fuel use,
agriculture, industrial processes, electricity consumption, waste, and the fossil fuel industry.
Figure 6 below shows an illustration of the historical percent contributions by sector back to the
1990 baseline. Greenhouse gas emissions by sector with descriptions of basic methodologies are
provided in more detail in the following subsections.
Figure 6: Total and sector-specific GHG emissions in Vermont, 1990-2017.
2.2.2 Transportation/Mobile Sources
The transportation and mobile sources sector remains the largest contributor to greenhouse gas
emissions in Vermont and was responsible for 3.39 MMTCO2e, or 39.1 percent of the total
emissions for the state in 2017 (Figure 7). Emissions from onroad gasoline and diesel vehicles,
aviation gasoline and jet fuel, and other non-road sources are the main contributors to emissions
in this sector. The emissions totals shown in this inventory are lower than those shown in the
previous inventory report due to an update in the calculation methodology, which is described in
detail below.
Figure 7: Vermont GHG emissions from transportation/mobile sources sector.
14Vermont Greenhouse Gas Emissions Inventory and Forecast: 1990 - 2017
Greenhouse gas emissions for the onroad portion of the transportation sector were previously
taken directly from the National Emissions Inventory (NEI) for years when they were available
(2011, 2014, 2017). 14 The NEI is a multi-pollutant emissions inventory developed by the U.S.
EPA on a triennial basis and the onroad portions rely on emissions estimates generated using the
MOtor Vehicle Emission Simulator (MOVES) model. 15 The Agency of Natural Resources
(ANR) compiles inputs for the onroad sector for each NEI by county which EPA supplements
and uses to estimate the emissions of many different pollutants. The inputs are generated using
detailed vehicle fleet data from the Department of Motor Vehicles (DMV) registration database
and vehicle miles travelled (VMT) data from the Vermont Agency of Transportation (VTrans).
The MOVES model is a complex model that contains detailed and very granular emissions rates
and applies them to corresponding VMT to calculate emissions. MOVES incorporates and
accounts for factors like temperature profiles, speed profiles, fuel formulations, etc., which effect
emissions totals, and so produces an estimate that incorporates a lot of detail from the vehicle
fleet and driving patterns. For years after 2011 not coinciding with NEI inventory reports,
transportation sector emissions were interpolated or extrapolated by adjusting the most recent
NEI values by the percent change in in-state fuel sales and annual VMT.
In reviewing the 2017 NEI GHG emissions values for gasoline and diesel from onroad
transportation in preparation for this inventory, the values were considerably lower than what
had been projected in the 1990 – 2016 Vermont GHG inventory report for that year based on
adjusting the 2014 NEI values using percent changes in VMT and fuel sales. In spite of an
approximate 5% (365 million mile) increase in VMT between 2014 and 2017, the NEI estimated
GHG emissions decreased by roughly 7% as shown in Figure 8 below. Although a decrease in
GHG emissions is possible with an increase in VMT due to improving vehicle fuel economies
and changing fleet characteristics due to fleet turnover, a reduction of this magnitude in a three-
year time period with a corresponding VMT increase on this scale seems unlikely. Efforts to
determine the reasons for this unexpected result, including discussions with EPA staff
responsible for the NEI and multiple additional in-house MOVES runs, were ultimately
inconclusive. Given the inability to determine the cause of, or to rationalize, this discrepancy,
the decision was made to adopt an emissions calculation methodology based on fuel
consumption data rather than the VMT based MOVES estimates going forward, which is less
detailed but more consistent with the historical emissions estimation methodology for years
before 2011. Because the historical data in the report had been taken from the Final Vermont
Greenhouse Gas Inventory and Reference Case Projections, 1990-2030 report, which utilized an
older version of the EPA SIT module, this methodology update is only strictly applicable to
years 2011 through 2016, although updates to the SIT module have led to some additional
differences between the previous historical values and those calculated in this report.
In contemplating different methodological approaches to calculating GHG emissions from the
transportation sector several factors were considered. The previously used EPA MOVES
estimates for Vermont from 2011 through 2016 contain a significant amount of detail on
14
EPA National Emissions Inventory: https://www.epa.gov/air-emissions-inventories/2017-national-emissions-
inventory-nei-data
15
EPA MOVES model: https://www.epa.gov/moves
15Vermont Greenhouse Gas Emissions Inventory and Forecast: 1990 - 2017
Vermont’s vehicle fleet and emissions rates from an extremely large amount of vehicle, road
type, and speed combinations, but rely heavily on estimated vehicle miles traveled in the state.
Estimates of VMT are an important indicator of vehicle use and associated emissions in the state
and are designed to capture all of the vehicle miles being traveled on Vermont roads, but are
based on separate calculations involving road segment lengths and annual average daily traffic
(AADT) values which are informed by highway performance monitoring system (HPMS) data,
or other statistical methodologies. Incorporating these additional datasets into GHG emissions
estimates adds a level of complexity and increases the uncertainty of this method. An alternative
method for the transportation/mobile sources sector is to use estimates of fuel consumption. To
calculate emissions of many different pollutants detail on vehicle type, engine controls, and age
are critical for generating accurate emissions estimates, including CH4 and N2O as described
below. For CO2, however, an accurate emissions estimate can be calculated based almost
entirely on the gallons of the various fuels combusted coupled with their corresponding fuel
specific emission factors. Fuel sales data provides less granularity in terms of where and how
the GHG emissions are occurring, and would not account for emissions from vehicles that enter
and then leave Vermont without refueling, or border leakage, but the fuel totals themselves at
least do not rely on additional modeling to inform them.
Using fuel combustion totals, with fuel sales as a proxy, is the method recommended by the
IPCC when appropriate and reliable data is available. As mentioned previously, this method for
estimating emissions from the transportation sector is less granular and so does not provide detail
to separate onroad emissions from nonroad emissions of CO2 from the sector, which is one of the
reasons the NEI values had been used previously. The fuel-based method does have the
advantage of relying on data and methodology that is straightforward and that can be calculated
annually without the need for interpolation or extrapolation of totals based on indicators. Using
the fuel-based method sacrifices detail in source contributions, but better aligns with IPCC
guidelines as well as the historical estimates completed for the Final Vermont Greenhouse Gas
Inventory and Reference Case Projections, 1990 – 2030 report.
The updated methodology used for calculating CO2 emissions based on fuel combustion totals
for onroad and nonroad transportation and mobile sources relies on the EPA CO2 from Fossil
Fuel Combustion (CO2FFC) SIT module, which is also used for estimating emissions in the
residential/commercial/industrial (RCI) fuel use sector. This tool uses estimates of energy
consumption in the transportation/mobile sector by fuel and multiplies them by the carbon
content for each fuel. The main fuels which contribute to the emission totals include motor
gasoline, distillate fuel (diesel), and aviation gasoline and jet fuel. The default data in the tool is
from the EIA SEDS 2018 dataset and contains estimated energy consumption by fuel type in
billions of Btu from 1990 through 2018. The amount of gasoline and onroad (non-dyed) diesel
fuel sold in Vermont is available and reported through the Joint Fiscal Office (JFO). 16 Gasoline
fuel sales data from JFO has been incorporated into the SIT module in place of the default SEDS
data, after first adjusting the values to remove the approximate contribution from aviation
gasoline and ethanol. Diesel sales data has not been incorporated into this inventory because it is
unclear if the nonroad end uses covered by the JFO data would match those covered in the SEDS
16
Vermont Joint Fiscal Office – Gasoline and Diesel Gallons Sold:
https://ljfo.vermont.gov/search/filter/keywords/gas/author/neil-schickner/subject/transportation
16Vermont Greenhouse Gas Emissions Inventory and Forecast: 1990 - 2017
dataset, which could lead to under or over counting of emissions. Default SEDS data has been
used for this portion of the calculation after first removing the biodiesel component.
Emissions of CH4 and N2O from the onroad and nonroad sector are calculated differently from
the CO2 component. As mentioned previously, pollutants such as CH4 and N2O are technology
dependent and so have differing emissions factors depending on the type and age of the vehicle
producing them. Estimates of these GHGs were calculated using the EPA SIT CH4 and N2O
Emissions from Mobile Combustion module, which estimates emissions in a similar way but is
much less sophisticated than the MOVES model. This module calculates emissions from onroad
transportation using VMT by vehicle type and applying emission factors to those VMT values
after they are further separated and refined by vehicle age class and applicable emissions control
systems. Default data is used for the vehicle age distributions and engine emissions control
technologies but the default VMT data is adjusted using vehicle class percent compositions from
FHWA and applying them to Vermont specific VMT data from VTrans back to 1990. An
updated version of the mobile combustion SIT module does allow for the estimation of CO2
using this VMT based methodology, however, the guidance document for the tool states that it is
not as accurate as the estimates from the fuel based CO2FFC module. 17
Motor gasoline (including onroad and nonroad use of gasoline) accounts for approximately 75%
of CO2 emissions from the sector and distillate fuel (diesel) accounts for just over 21% as shown
in Table 3. It is not possible to break out the onroad versus nonroad emissions totals in the EPA
SIT CO2FFC module, however, a general breakdown of contributions has been provided for
informational purposes in Table 4 and Table 5 to illustrate the approximate percent contributions
based on values taken from the 2017 NEI and the previous nonroad methodology.
Table 3: Mobile source contributions by fuel type.
Table 4: Percent contribution to transportation emissions from onroad and nonroad sources (2017 NEI).
Transportation Subsector (NEI and Previous Nonroad Percent Contribution
methodology) (2017)
Onroad Gasoline and Diesel 85%
Farm/Rail/Boats/Other Diesel and Gas (nonroad) 15%
17
EPA SIT Mobile Combustion User’s Guide: https://www.epa.gov/sites/production/files/2020-
10/documents/mobile_combustion_users_guide.pdf
17Vermont Greenhouse Gas Emissions Inventory and Forecast: 1990 - 2017
Table 5: Percent contribution to transportation emissions by vehicle type (2017 NEI).
As noted above the change in methodology from a VMT based estimate to a fuel consumption-
based estimate has significant implications for emissions from the sector, and for the state as a
whole (Figure 8). Rationale for the methodology change has been provided above, however, it is
important to understand that both of these estimation methods are valid and the reason the
estimates produced by the two differing methodologies don’t correlate well is not completely
understood. Trends in VMT (Figure 9) and fuel sales (Figure 10) also do not track particularly
well with each other for reasons including the differences and uncertainties incorporated into the
estimates, as well as fleet turnover and fuel economy improvements.
Figure 8: Comparison of GHG emissions based on NEI methodology to the updated fuel combustion
methodology.
Figure 9: Vehicle miles traveled in Vermont by year (Source: VTrans).
18Vermont Greenhouse Gas Emissions Inventory and Forecast: 1990 - 2017
Figure 10: Gallons of gasoline and diesel sold in Vermont by year (Source: Joint Fiscal Office).
2.2.3 Residential/Commercial/Industrial (RCI) Fuel Use
The Residential/Commercial and Industrial Fuel Use sector includes greenhouse gas emissions
mainly from building energy use. Emissions in this sector are mostly from fuel oil, propane, and
natural gas used for heating buildings, heating water, and cooking. The RCI sector contributed
2.69 MMTCO2e in 2017, which was unchanged from the previous year (Figure 11), and which
made up 31% of total statewide GHG emissions. Greenhouse gases accounted for in this sector
include CO2, CH4, and N2O. Carbon dioxide from wood combustion is considered to be of
biogenic origin and is not included in the totals shown in this sector.
Figure 11: Vermont GHG emissions from the RCI sector, 1990-2017.
The residential piece of the RCI sector is the largest contributor at roughly 55% of the sector
total (Table 6). Distillate fuel oil and propane use in the residential sector account for
approximately 44% of GHG emissions from the entire RCI sector (Table 7), and about 80% of
the residential total. Methane and nitrous oxide from wood combustion are included in the totals
19Vermont Greenhouse Gas Emissions Inventory and Forecast: 1990 - 2017
for each subsector and emissions estimates are informed by data from Vermont Residential Fuel
Assessment reports and by point source registration data submitted annually to the ANR Air
Quality and Climate Division. 18
Table 6: GHG emissions contribution of residential, commercial, and industrial subsectors.
RCI Sector (2017) MMTCO2e % of Total
Residential 1.47 54.8%
Commercial 0.77 28.7%
Industrial 0.44 16.5%
Total 2.69 100.0%
Table 7: GHG emissions contributions by fuel type within the RCI sector.
RCI Residential Sector (2017) MMTCO2e % of Total
Fuel Oil 0.76 51.8%
Propane 0.40 27.1%
Natural Gas 0.19 13.1%
Kerosene 0.03 1.7%
Wood (CH4 and N2O only) 0.09 6.3%
Total 1.47 100.0%
Emissions estimates in the RCI sector are calculated using two EPA SIT modules. The first is the
CO2 from Fossil Fuel Combustion tool (CO2FFC) and the second is the Methane and Nitrous
Oxide Emissions from Stationary Combustion tool. All of the fossil fuel values used in these
tools are default values from the EIA SEDS dataset. The general methodology for the
calculations in this sector, completed using the EPA SIT modules listed above, multiplies the
total energy consumption in billion British Thermal Units (Btu) for each applicable subsector
from the SEDS dataset by a fuel specific emission factor and then by a fuel specific combustion
efficiency value. Datasets used to inform the fuel and Btu consumption estimates in the SEDS
dataset related to this sector differ by fuel and by year but are generally based on national level
reporting of sales data by state. 19
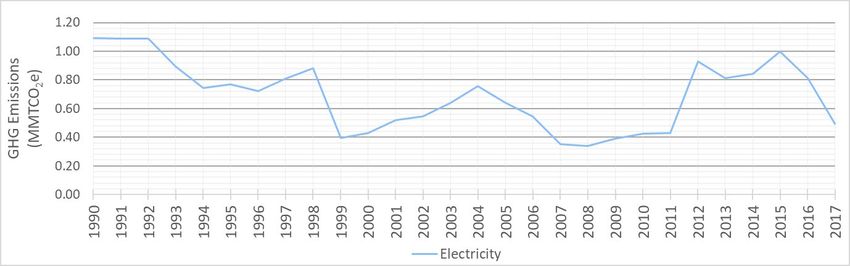
2.2.4 Agriculture
The agriculture sector accounts for emissions of CH4 and N2O from agricultural practices in the
state, including animals and crop production. Carbon dioxide in this sector is almost exclusively
biogenic, and so not included in the sector totals, with the exception of CO2 associated with
liming and urea fertilization. Greenhouse gas emissions for the sector were 1.37 MMTCO2e in
2017, which was down from 2016 (Figure 12) and was 15.8% of the total statewide emissions.
18
Vermont Forest Parks and Recreation – Residential Fuel Assessment for the 2018 – 2019 Heating Season:
https://fpr.vermont.gov/sites/fpr/files/Forest_and_Forestry/Wood_Biomass_Energy/Library/2019%20VT%20Reside
ntial%20Fuel%20Assessment%20Report%20FINAL.pdf
19
EIA SEDS – “Technical notes & documentation - complete 2018” – Section 4: Petroleum:
https://www.eia.gov/state/seds/sep_use/notes/use_petrol.pdf
20Vermont Greenhouse Gas Emissions Inventory and Forecast: 1990 - 2017
The subsectors of the agriculture sector include enteric fermentation, manure management,
agricultural soils, rice cultivation, liming of soils, urea fertilization, and agricultural residue
burning, although not all have associated values or emissions within Vermont.
Agriculture
15.8%
Figure 12: Vermont GHG emissions from the agriculture sector, 1990-2017.
The majority of the greenhouse gas emissions from the agriculture sector are from three of the
subsectors listed above, with enteric fermentation (CH4 produced as a part of the digestive
process of ruminant animals) making up the largest portion at 0.64 MMTCO2e, or 47% of the
sector total (Table 8). Manure Management and Agricultural Soils make up the majority of the
remainder at 0.35 and 0.33 MMTCO2e, respectively. Greenhouse gas emissions estimates from
manure management consist of both CH4 and N2O from the storage of animal waste in different
management systems. Emissions of N2O from agricultural soils occur naturally, but several
agricultural activities increase the amount of available nitrogen in the soils leading to increases in
emissions of N2O. These activities include the application of fertilizers, animal production, the
incorporation of crop residues, and the cultivation of nitrogen-fixing crops and highly organic
soils (histosols). 20
Table 8: GHG emissions contributions of subsectors within the agriculture sector.
MMTCO2e Percent
Agriculture Sector Breakdown (2017)
(2017) Contribution
Enteric Fermentation 0.64 47%
Manure Management 0.35 25%
Agricultural Soils 0.33 24%
Liming and Urea Fertilization 0.05 3%
Total 1.37 100%
20
EPA State Inventory Tool: User’s Guide for Estimating carbon dioxide, methane, and nitrous oxide emissions
from agriculture using the state inventory tool: https://www.epa.gov/sites/production/files/2020-
10/documents/ag_module_users_guide.pdf
21Vermont Greenhouse Gas Emissions Inventory and Forecast: 1990 - 2017
Greenhouse gas emissions estimates in the agriculture sector are calculated using an EPA SIT
module (Carbon Dioxide, Methane, and Nitrous Oxide from Agriculture module). Most of the
emissions are associated with animal populations. Emissions from enteric fermentation are
calculated using the total animal populations by animal type multiplied by region-specific
emission factors. Methane and nitrous oxide emissions related to manure management involve
estimating the waste produced for the animal populations and multiplying by emission factors
which are adjusted with a conversion factor, depending on the applied manure management
system. The majority of GHG emissions associated with agricultural soils are based on the
residues or cultivation of certain crop types or soil types and various emission factors, or on the
use of fertilizers with applied emission and conversion factors. Data used in the tool are almost
exclusively default data which are taken from various US Department of Agriculture (USDA)
datasets. One adjustment made is to modify the population of dairy cows in the manure
management portion of the tool as a method to remove the waste that is estimated to enter
anaerobic digester facilities as informed by ANR point source registration data and the EPA
AgSTAR database. 21
The agriculture sector datasets and methodologies are currently being reviewed by the Vermont
Agency of Agriculture, Food & Markets (AAFM) to determine if there are areas where
improvements can be made. Methods for estimating sequestration in the agriculture sector and
the impact of agricultural practices that help to reduce GHG emissions are also being actively
investigated as part of the ongoing work related to the Global Warming Solutions Act and the
Vermont Climate Council.
2.2.5 Industrial Processes
The Industrial Processes (IP) sector for the Vermont inventory includes GHG emissions from
ozone depleting substances (ODS) substitutes, semiconductor manufacturing, limestone and
dolomite use, electric power transmission and distribution systems, soda ash, and urea
consumption. There are additional processes generally covered by this sector, but they are not
currently occurring in Vermont. Greenhouse gases emitted by the processes in this sector
include CO2, HFCs, PFCs, NF3, and SF6 with nearly 95% of all the GHG emissions in the sector
being anthropogenic fluorinated gases (F-gas). Total GHG emissions from the sector were 0.57
MMTCO2e in 2017, which is similar to the 2016 totals (Figure 13) and was 6.5% of total
statewide emissions for 2017.
21
EPA AgSTAR – Livestock Anaerobic Digester Database: https://www.epa.gov/agstar/livestock-anaerobic-
digester-database
22Vermont Greenhouse Gas Emissions Inventory and Forecast: 1990 - 2017
Industrial Processes
6.5%
Figure 13: Vermont GHG emissions from the industrial processes sector, 1990-2017.
ODS substitutes and semiconductor manufacturing combined make up nearly 94% of the total
GHG emissions from the sector (Table 9), with limestone and dolomite use contributing an
additional 4.2% and SF6 from electric utilities, soda ash use, and urea consumption making up
the remaining 2.2%.
Table 9: GHG emissions contributions of subsectors with the industrial process sector.
Ozone depleting substances substitutes contribute over half of the GHG emissions in the IP
sector. These emissions are associated with hydrofluorocarbons (HFCs) present in end uses like
refrigeration equipment, air conditioning equipment, aerosol propellants, and foams. High GWP
hydrofluorocarbons were being incorporated into these end uses and products to phase out the
use of ozone depleting substances (CFCs and HCFCs) following ratification of the Montreal
Protocol. This initiative was successful in reducing emissions that deplete the stratospheric
ozone layer, but the replacement HFCs are often very high GWP alternatives, many of them
thousands of times more potent than CO2 in their ability to warm the planet. Global emissions of
HFCs from these end uses are growing rapidly and are expected to increase by roughly twenty
23Vermont Greenhouse Gas Emissions Inventory and Forecast: 1990 - 2017
times in the next several decades, driven by increases in demand for refrigeration and air
conditioning, especially in developing countries. 22
In collaboration and coordination with other U.S. Climate Alliance states, with leadership from
California, the Vermont legislature passed Act 65 (2019) which requires, with subsequent
rulemaking, the phase down of high GWP HFCs that had been previously required under the
partially vacated EPA Significant New Alternatives Program (SNAP) rules. 23 Act 65 phases out
the use of high GWP HFCs in certain end uses by certain dates based on evaluations and
determinations of available substitutes completed through the SNAP program based on the
impacts to human health and the environment.
Estimates of GHG emissions from the ODS Substitutes sector are derived from a tool developed
by California for use by U.S. Climate Alliance states. The tool is based on an F-gas model
which estimates annual HFC emissions from equipment by production year and includes leakage
rates from charging new and used equipment, leakage rates from existing equipment, and end of
life equipment loses. These HFC emissions estimates for California are then apportioned to a per
capita value (or per vehicle) and adjusted based on state-specific factors such as the percentage
of households with AC units or using heat pumps. Per capita values were then applied to the
population of Vermont to produce an estimated business as usual baseline value. The tool also
contains adjusted estimates based on emissions reductions associated with various HFC
mitigation strategies, including adopting the EPA SNAP prohibitions. Following adoption of
Act 65 in Vermont values incorporating the SNAP reductions will be used, however, the earliest
prohibition dates pursuant to Act 65 did not come into effect until January 1, 2021 and so the
associated reductions are not reflected in the data prior to that date, including the values
presented in this inventory.
Greenhouse gas emissions related to semiconductor manufacturing include HFCs, PFCs, SF6,
and NF3 and account for roughly 34% of the total for the sector. Emissions of the F-gases in
semiconductor manufacturing occur in the plasma etching and chemical vapor deposition
processes. 24 Greenhouse gas emissions data for the semiconductor manufacturing sector is
pulled directly from the EPA Facility Level Information on GreenHouse gases Tool (FLIGHT)
for all available years (2011 through 2019). 25 Data in the FLIGHT tool is reported directly by
facilities through the EPA Greenhouse Gas Reporting Program (GHGRP) which requires annual
reporting of GHG emissions by applicable sources and facilities. 26 Currently historical
22
EPA: Ozone Layer Protection: https://www.epa.gov/ozone-layer-protection/recent-international-developments-
under-montreal-protocol
23
EPA Significant New Alternatives (SNAP) program: https://www.epa.gov/snap/overview-snap
10 V.S.A. § 586:
https://legislature.vermont.gov/Documents/2020/Docs/ACTS/ACT065/ACT065%20As%20Enacted.pdf
Vermont HFC Rulemaking – Chapter 38: Rules regarding the phase-down of the use of Hydrofluorocarbons:
https://dec.vermont.gov/sites/dec/files/aqc/laws-regs/documents/Vermont_HFC_Rule_Adopted_CLEAN.pdf
24
EPA State Inventory Tools – User’s Guide for Estimating carbon dioxide, nitrous oxide, HFC, PFC, NF3, and SF6
emissions from Industrial Processes using the State Inventory Tool: https://www.epa.gov/statelocalenergy/state-
inventory-and-projection-tool
25
EPA FLIGHT Tool: https://ghgdata.epa.gov/ghgp/main.do?site_preference=normal
26
EPA – Greenhouse Gas Reporting Program (GHGRP): https://www.epa.gov/ghgreporting
24Vermont Greenhouse Gas Emissions Inventory and Forecast: 1990 - 2017
emissions estimates in this sector are based on projecting reported 2011 emissions totals
backwards through time to 1990 based on historical national trends in the sector; however, work
is ongoing to obtain more specific and accurate data for this sector.
The remaining 6% of emissions from the sector are from limestone and dolomite use, soda ash,
urea consumption, and electric power transmission and distribution systems. Emissions from
these subsectors are based on default values in the EPA Industrial Processes SIT module.
Limestone and dolomite use, soda ash, and urea consumption emissions are all based on
production or consumption data multiplied by applicable emissions factors. Emissions of SF6
from electric power transmission and distribution are based on an estimate of the quantity of SF6
consumed annually multiplied by an emission factor. SF6 is often used as an insulator in
electrical transmission and distribution equipment.
2.2.6 Electricity Consumption
Greenhouse gas emissions associated with the electricity sector made up 5.7% of emissions for
the state in 2017, with emissions of 0.49 MMTCO2e. Emissions from the sector declined 0.32
MMTCO2e between 2016 and 2017 as shown in Figure 14. Estimates of emissions from
electricity are based on electricity consumption rather than exclusively on in-state generation.
This consumption-based approach was chosen because it is consistent with the majority of states
in the region and accounts for emissions associated with all of the electricity used by Vermonters
rather than only for what is generated within the boundaries of the state. This is especially
relevant in Vermont, because Vermont consumes more than 3 times as much energy as it
generates. 27
Figure 14: Vermont GHG emissions from the electricity sector, 1990-2017.
Calculations of the GHG emissions from the electricity sector are performed using a
methodology previously developed in collaboration with the Vermont Public Service Department
(PSD). Emissions are estimated by using generation specific emission factors from the New
England Independent Systems Operator - New England (ISO-NE) Power Pool Generation
27
EIA – State Profile and Energy Estimates: https://www.eia.gov/state/?sid=VT
25You can also read