Whole-genome association analyses of sleep-disordered breathing phenotypes in the NHLBI TOPMed program
←
→
Page content transcription
If your browser does not render page correctly, please read the page content below
Cade et al. Genome Medicine      (2021) 13:136
https://doi.org/10.1186/s13073-021-00917-8

 RESEARCH                                                                                                                                          Open Access

Whole-genome association analyses of
sleep-disordered breathing phenotypes in
the NHLBI TOPMed program
Brian E. Cade1,2,3* , Jiwon Lee1, Tamar Sofer1,2, Heming Wang1,2,3, Man Zhang4, Han Chen5,6, Sina A. Gharib7,
Daniel J. Gottlieb1,2,8, Xiuqing Guo9, Jacqueline M. Lane1,2,3,10, Jingjing Liang11, Xihong Lin12, Hao Mei13,
Sanjay R. Patel14, Shaun M. Purcell1,2,3, Richa Saxena1,2,3,10, Neomi A. Shah15, Daniel S. Evans16, Craig L. Hanis5,
David R. Hillman17, Sutapa Mukherjee18,19, Lyle J. Palmer20, Katie L. Stone16, Gregory J. Tranah16, NHLBI Trans-Omics
for Precision Medicine (TOPMed) Consortium, Gonçalo R. Abecasis21, Eric A. Boerwinkle5,22, Adolfo Correa23,24,
L. Adrienne Cupples25,26, Robert C. Kaplan27, Deborah A. Nickerson28,29, Kari E. North30, Bruce M. Psaty31,32,
Jerome I. Rotter9, Stephen S. Rich33, Russell P. Tracy34, Ramachandran S. Vasan26,35,36, James G. Wilson37, Xiaofeng Zhu11,
Susan Redline1,2,38 and TOPMed Sleep Working Group

  Abstract
  Background: Sleep-disordered breathing is a common disorder associated with significant morbidity. The genetic
  architecture of sleep-disordered breathing remains poorly understood. Through the NHLBI Trans-Omics for Precision
  Medicine (TOPMed) program, we performed the first whole-genome sequence analysis of sleep-disordered
  breathing.
  Methods: The study sample was comprised of 7988 individuals of diverse ancestry. Common-variant and pathway
  analyses included an additional 13,257 individuals. We examined five complementary traits describing different
  aspects of sleep-disordered breathing: the apnea-hypopnea index, average oxyhemoglobin desaturation per event,
  average and minimum oxyhemoglobin saturation across the sleep episode, and the percentage of sleep with
  oxyhemoglobin saturation < 90%. We adjusted for age, sex, BMI, study, and family structure using MMSKAT and
  EMMAX mixed linear model approaches. Additional bioinformatics analyses were performed with MetaXcan,
  GIGSEA, and ReMap.

* Correspondence: bcade@bwh.harvard.edu
Full lists of consortium and working group authors are provided in
Additional file 1: Tables S1 and S2.
1
 Division of Sleep and Circadian Disorders, Brigham and Women’s Hospital,
Harvard Medical School, 221 Longwood Avenue, Boston, MA 02115, USA
2
 Division of Sleep Medicine, Harvard Medical School, Boston, MA 02115, USA
Full list of author information is available at the end of the article

                                       © The Author(s). 2021 Open Access This article is licensed under a Creative Commons Attribution 4.0 International License,
                                       which permits use, sharing, adaptation, distribution and reproduction in any medium or format, as long as you give
                                       appropriate credit to the original author(s) and the source, provide a link to the Creative Commons licence, and indicate if
                                       changes were made. The images or other third party material in this article are included in the article's Creative Commons
                                       licence, unless indicated otherwise in a credit line to the material. If material is not included in the article's Creative Commons
                                       licence and your intended use is not permitted by statutory regulation or exceeds the permitted use, you will need to obtain
                                       permission directly from the copyright holder. To view a copy of this licence, visit http://creativecommons.org/licenses/by/4.0/.
                                       The Creative Commons Public Domain Dedication waiver (http://creativecommons.org/publicdomain/zero/1.0/) applies to the
                                       data made available in this article, unless otherwise stated in a credit line to the data.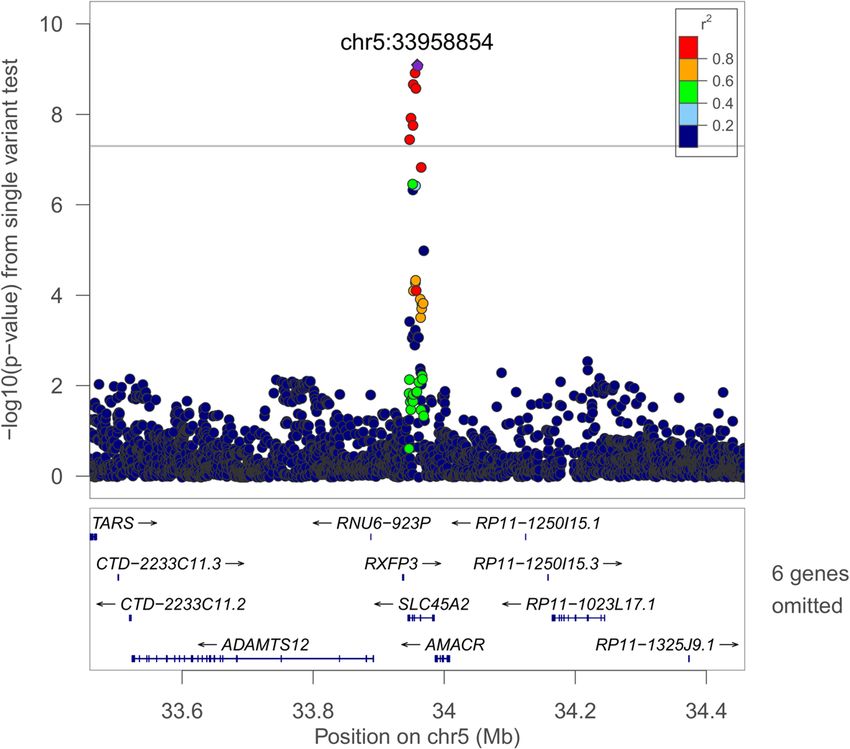
Cade et al. Genome Medicine   (2021) 13:136                                                                  Page 2 of 17

 Results: We identified a multi-ethnic set-based rare-variant association (p = 3.48 × 10⁻⁸) on chromosome X with
 ARMCX3. Additional rare-variant associations include ARMCX3-AS1, MRPS33, and C16orf90. Novel common-variant loci
 were identified in the NRG1 and SLC45A2 regions, and previously associated loci in the IL18RAP and ATP2B4 regions
 were associated with novel phenotypes. Transcription factor binding site enrichment identified associations with
 genes implicated with respiratory and craniofacial traits. Additional analyses identified significantly associated
 pathways.
 Conclusions: We have identified the first gene-based rare-variant associations with objectively measured sleep-
 disordered breathing traits. Our results increase the understanding of the genetic architecture of sleep-disordered
 breathing and highlight associations in genes that modulate lung development, inflammation, respiratory
 rhythmogenesis, and HIF1A-mediated hypoxic response.
 Keywords: Sleep-disordered breathing, Sleep apnea, Whole-genome sequencing, WGS, Genome-wide association
 study, GWAS

Background                                                   Institute program designed to improve the understand-
Sleep-disordered breathing (SDB) is a prevalent disorder     ing of the biological processes that contribute to heart,
associated with increased sleepiness, mortality, and mor-    lung, blood, and sleep disorders [12]. TOPMed has gen-
bidity from a wide range of cardiometabolic and other        erated whole-genome sequencing (WGS) data on over
diseases [1, 2]. The most common type of SDB is ob-          100,000 individuals from multiple cohorts at > 30×
structive sleep apnea (OSA), characterized by repeated       depth, including seven studies with objective assessment
airway collapse leading to intermittent hypoxemia and        of SDB. A variant imputation server using TOPMed data
sleep disruption, that is increased in prevalence with       also allows for high-quality imputation of non-
older age and male sex [2]. An estimated 936 million         sequenced genotype chip data [13]. A complementary
adults aged 30–69 have mild to severe OSA worldwide          initiative sponsored by the Centers for Common Disease
[3]. The disease is heritable and appears to be multifac-    Genomics (CCDG) of the NIH National Human Gen-
torial, reflecting variable contributions of abnormalities   ome Research Institute has generated sequencing data
in ventilatory control, craniofacial anatomy, and adipos-    from additional individuals in two TOPMed cohorts.
ity [2, 4–7]. Sleep-related hypoxemia can also be due to     These initiatives provide the ability to examine the genet-
central sleep apnea, a less common disorder, due to a        ics of SDB at unprecedented detail in African-Americans
lack of respiratory drive [8]. OSA is typically measured     (AA), Asian-Americans (AsA), European-Americans/Aus-
clinically using the apnea-hypopnea index, which counts      tralians (EA), and Hispanic/Latino-Americans (HA).
the number of total (apnea) and partial (hypopnea)             In this first genome-wide sequencing analysis of SDB,
breathing cessations per hour of sleep. Due to an incom-     we examine the apnea-hypopnea index (AHI), the stand-
plete understanding of its molecular basis, the standard     ard clinic metric of SDB, and four complementary
OSA treatment of continuous positive airway pressure         measurements of overnight hypoxemia: average and
(CPAP) only addresses the downstream manifestations          minimum oxyhemoglobin saturation (SpO2) during sleep
of airway collapse through nightly use of pressurized air    and the percent of the sleep recording with SpO2 < 90%
to the nasopharynx, a therapy that often is poorly toler-    (Per90), and the average desaturation per hypopnea
ated. Therefore, there is a critical need to identify mo-    event. These indices were chosen because of clinical
lecular pathways that could provide specific therapeutic     relevance, high heritability, or prior significant GWAS
targets. The need for overnight studies to phenotype         findings [9, 11, 14]. We examined 7988 individuals with
SDB traits has limited the available sample size for gen-    objectively measured SDB and WGS data in conjunction
etic analyses, and only several common-frequency             with data from 13,257 individuals with imputed geno-
genome-wide analysis studies have been reported [9–          type data.
11]. Increased statistical power may increase the genetic
resolution of regions that may not be adequately tagged      Methods
by current genotyping arrays due to population differ-       Each study had a protocol approved by its respective
ences and/or reduced linkage disequilibrium with bio-        Institutional Review Board and participants provided in-
logically relevant regions.                                  formed consent. A study overview is provided in Add-
   The Trans-Omics for Precision Medicine (TOPMed)           itional file 2: Figure S1. There were two classes of data:
program is an NIH National Heart, Lung, and Blood            “WGS studies” had WGS performed by the TOPMed
Cade et al. Genome Medicine          (2021) 13:136                                                                                                            Page 3 of 17

program and, in some cases, in additional participants                                   The Hispanic Community Health Study/Study of Lati-
by the CCDG program (referred to as “WGS” studies);                                    nos (HCHS/SOL) is studying multiple health conditions
“Imputed studies” had array-based genotyping later im-                                 in HAs [22, 23]. Home sleep apnea testing was per-
puted using the TOPMed imputation server (as de-                                       formed during the baseline examination (2008–2011)
scribed below). Some studies with WGS contributed                                      using the ARES Unicorder 5.2, a validated device includ-
imputed study data from additional array-based geno-                                   ing a forehead-based reflectance oximeter, a nasal pres-
typed individuals. Ten studies were analyzed (Tables 1                                 sure cannula and pressure transducer, an accelerometer,
and 2).                                                                                and a microphone [24]. Two thousand three hundred
                                                                                       thirty-nine individuals provided data.
WGS studies                                                                              The Jackson Heart Study (JHS) is investigating cardio-
The Atherosclerosis Risk in Communities Study (ARIC),                                  vascular disease in AAs [25]. An in-home sleep study
the Cardiovascular Health Study (CHS), and the Fra-                                    was performed from 2012 to 2016 using a validated type
mingham Heart Study Offspring Cohort (FHS) included                                    3 sleep apnea testing device (Embla Embletta Gold) [26,
individuals who participated in the Sleep Heart Health                                 27]. Five hundred seventy-five individuals contributed
Study (SHHS), who underwent polysomnography (PSG)                                      data.
between 1995 and 1998 using the Compumedics PS-2
system [15–18]. These samples included 1028 EAs from                                   Imputed genotype studies
ARIC, 151 AAs and 557 EAs from CHS, and 478 EAs                                        The Osteoporotic Fractures in Men Study (MrOS) is a
from FHS.                                                                              multi-center cohort study initially designed to examine
  The Multi-Ethnic Study of Atherosclerosis (MESA) is                                  the risk factors for osteoporosis, fractures, and prostate
investigating the risk factors for clinical cardiovascular                             cancer in older males [28, 29]. An ancillary study (MrOS
disease [19]. PSG was obtained between 2010 and 2013                                   Sleep; 2003–2005) focused on outcomes of sleep distur-
using the Compumedics Somte system [20]. This ana-                                     bances used PSG and nearly identical procedures as in
lysis includes data from 698 EAs, 486 AAs, 456 HAs,                                    MESA (Compumedics Safiro system) [30]. Two thou-
and 229 AsAs.                                                                          sand one hundred eighty-one EA individuals were in-
  The Cleveland Family Study (CFS) was designed to in-                                 cluded, with genotyping performed using the Illumina
vestigate the familial basis of SDB, with four visits occur-                           Human Omni 1 Quad v1-0 H array.
ring from 1990 to 2006 [21]. Sleep was assessed either in                                The Starr County Health Studies (Starr) investigates
a clinical research center using full PSG (Compumedics                                 the risk factors for diabetes in Mexican-Americans [31,
E series) (visit 4) or in the latest available prior examin-                           32]. An in-home sleep apnea study occurred between
ation using an in-home sleep apnea testing device (Eden-                               2010 and 2014 using a validated instrument that records
trace). Data were analyzed from 505 AAs and 485 EAs                                    finger pulse oximetry, actigraphy, body position, and
(339 AAs and 234 EAs with full PSG data).                                              peripheral     arterial    tonometry      (Itamar-Medical

Table 1 Sample description for WGS cohorts
Population         Cohort     N      Age             Percent   BMI            Apnea-          AHI (percent       Average        Average        Minimum         Percent
                                                     female                   hypopnea        < 5, 5–15, ≥ 15)   desaturation   SpO2           SpO2            sleep under
                                                                              index 3%                                                                         90% SpO2
African-           CFS*       505    38.65 (18.96)   56.4      32.44 (9.48)   6.85 (22.48)    43.4, 20.6, 36.0   3.62 (1.99)    94.49 (3.91)   84.76 (9.83)    4.79 (13.15)
American
                   CHS        151    75.39 (4.35)    60.3      29.02 (5.08)   9.60 (16.96)    28.5, 36.4, 35.1   2.70 (1.74)    94.82 (2.19)   85.74 (5.35)    3.39 (9.63)
                   JHS        575    63.47 (10.94)   64.9      31.8 (6.88)    10.69 (14.42)   24.7, 39.5, 35.8   3.54 (1.72)    94.77 (2.02)   84.30 (6.57)    2.97 (8.91)
                   MESA       486    68.81 (9.07)    53.7      30.23 (5.68)   12.67 (20.56)   22.4, 32.9, 44.7   3.42 (2.10)    94.46 (1.99)   83.32 (7.98)    3.89 (9.49)
East Asian-        MESA       229    67.89 (9.11)    49.8      24.28 (3.30)   14.96 (24.28)   21.8, 28.4, 49.8   3.72 (1.79)    94.92 (1.22)   83.23 (7.58)    2.25 (4.46)
American
European-          ARIC       1028   62.28 (5.67)    53.1      28.72 (5.06)   8.64 (15.62)    34.6, 32.4, 33.0   2.35 (1.29)    94.57 (1.84)   85.95 (5.93)    2.92 (9.24)
American
                   CFS*       485    43.23 (19.49)   50.5      30.81 (8.83)   7.09 (21.90)    44.7, 19.4, 35.9   3.29 (1.86)    93.67 (3.59)   85.55 (9.33)    4.66 (11.87)
                   CHS        557    77.90 (4.34)    54.2      27.25 (4.44)   11.42 (15.54)   23.2, 38.1, 38.8   2.58 (1.34)    94.00 (2.00)   84.99 (5.67)    4.77 (12.28)
                   FHS*       478    60.09 (8.54)    49.8      28.40 (5.06)   8.10 (14.28)    35.1, 35.1, 29.7   2.35 (1.27)    94.68 (2.04)   85.78 (6.25)    2.96 (9.18)
                   MESA       698    68.53 (9.06)    53.2      27.91 (5.10)   12.18 (20.45)   21.6, 35.0, 43.4   3.11 (1.44)    93.96 (1.75)   83.49 (7.50)    4.27 (10.82)
Hispanic/Latino-   HCHS/SOL   2339   46.27 (13.86)   60.5      30.23 (6.44)   2.03 (6.30)     68.9, 19.5, 11.6   N/A            96.42 (0.99)   87.04 (5.92)    0.88 (3.63)
American
                   MESA       456    68.49 (9.27)    53.3      30.08 (5.46)   16.31 (22.53)   17.1, 28.3, 54.6   3.62 (2.12)    94.33 (1.60)   81.59 (9.32)    3.80 (7.64)
Seven studies contributed 7988 individuals with WGS in TOPMed Freeze 6a and objectively measured phenotypes (1717 African-Americans, 229 Asian-Americans,
3246 European-Americans, 2796 Hispanic/Latino-Americans). The overall sample had a mean age of 57.7 and was 56.1% female. Values are displayed as mean
(SD), except for the skewed apnea-hypopnea index, which is displayed as median (IQR). Sample size N reflects individuals with non-missing AHI and covariate
values. *Family cohort
Cade et al. Genome Medicine (2021) 13:136 Page 4 of 17
Table 2 Sample description for imputed genotype chip cohorts
Population Cohort N Age Percent BMI Apnea- AHI (percent Average Average Minimum Percent sleep
female hypopnea < 5, 5–15, ≥ 15) desaturation SpO2 SpO2 under 90%
index 3% SpO2
African-American CFS* 225 35.46 (20.32) 56.4 29.97 (10.09) 3.99 (10.55) 55.1, 23.1, 21.8 2.90 (1.09) 94.65 (4.01) 88.17 (9.60) 5.20 (16.01)
European- ARIC 631 62.74 (5.72) 49.4 29.15 (5.23) 9.15 (15.02) 29.3, 37.9, 32.8 2.50 (1.73) 94.32 (2.15) 85.17 (6.17) 4.12 (11.76)
American,
Australian CFS* 218 37.57 (18.66) 56.9 28.76 (8.11) 3.4 (10.59) 57.8, 22.5, 19.7 2.30 (1.11) 94.09 (3.35) 88.81 (7.80) 3.26 (12.79)
CHS 365 77.44 (4.65) 64.9 27.10 (4.41) 10.50 (15.14) 25.8, 39.2, 35.1 2.63 (1.57) 94.41 (1.91) 84.87 (5.96) 3.93 (11.89)
FHS* 192 57.45 (9.68) 51.0 28.87 (5.16) 7.30 (14.38) 38.0, 31.8, 30.2 2.42 (1.51) 94.73 (1.80) 85.76 (5.46) 2.82 (8.38)
MrOS 2181 76.65 (5.60) 0.0 27.21 (3.75) 13.00 (18.00) 18.9, 36.1, 45.0 3.54 (1.48) 93.85 (1.73) 84.39 (5.88) 4.40 (9.95)
WASHS 1508 52.29 (13.71) 40.9 31.84 (7.93) 7.24 (15.37) 40.1, 31.1, 28.8 3.56 (2.00) 94.56 (2.38) 84.61 (7.86) 5.44 (13.82)
Hispanic, Latino- HCHS, SOL 7155 46.10 (13.81) 57.8 29.68 (5.86) 2.00 (6.15) 69.1, 19.3, 11.6 N, A 96.46 (0.95) 87.06 (6.11) 0.83 (2.99)
American
Starr 782 52.34 (11.29) 71.9 32.15 (6.78) 10.35 (17.18) 31.5, 31.5, 37.1 N, A 94.65 (2.09) 85.78 (7.50) 2.83 (8.79)
Eight studies contributed 13,257 individuals with genomic data imputed with a TOPMed Freeze 5b reference panel and objectively measured phenotypes (225
African-Americans, 5095 European-Americans, 7937 Hispanic/Latino-Americans). ARIC, CFS, CHS, FHS, and HCHS/SOL imputed genomic data reflect individuals
without available sequencing in TOPMed Freeze 6. The overall sample had a mean age of 53.7 and was 46.9% female. Values are displayed as mean (SD), except
for the skewed apnea-hypopnea Index, which is displayed as median (IQR). Sample size N reflects individuals with non-missing AHI and covariate values.
*Family cohort
WatchPAT-200) [33]. Seven hundred eighty-two HA apnea events, due to the relatively low prevalence of cen-
individuals were studied, using Affymetrix 6.0 geno- tral sleep apnea (< 2%) in these largely community-based
typing data. studies [36, 37] (some of which are enriched with
The Western Australian Sleep Health Study (WASH snorers) and the complexities of classifying mixed
S) is a clinic-based study focused on the epidemiology events. We adjusted for age, age2, sex, age × sex, body
and genetics of SDB [34]. PSG was obtained from mass index (BMI), and BMI2 due to known age and sex
1508 European-ancestry patients (91% referred for effects, some of which are non-linearly associated with
SDB evaluation) from 2006 to 2010 (Compumedics outcomes, and our goal of identifying obesity-
Series E). Genotyping was performed using the Illu- independent loci. Age and BMI were obtained at the
mina Omni 2.5 array. time of the sleep recording. We adjusted for BMI as over
Imputed genotype data were available for additional half of the AHI trait heritability is attributable to factors
members of the TOPMed cohorts described above. Study/ other than obesity as measured by the BMI and our goal
population combinations with fewer than 100 individuals was to identify associations with other mechanistic path-
were excluded. ARIC contributed an additional 631 EA in- ways (e.g., ventilatory control) that could indicate novel
dividuals (Affymetrix 6.0; dbGaP phg000035.v1.p1). CFS future targets. Phenotype analyses were pooled within
contributed 225 AA and 218 EA individuals (Affymetrix populations to aggregate very rare variants for testing
6.0; Illumina OmniExpress+Exome, Exome, and IBC). and therefore further adjusted for study. Population as-
CHS contributed 365 individuals (Illumina CNV370 and signments were based on self-report, in accordance with
IBC; phg000135.v1.p1 and phg000077.v1.p1). FHS con- other research from TOPMed and other consortia. AsA
tributed 192 EA individuals (Affymetrix 500 k; and EA-identifying individuals with population principal
phg000006.v7). HCHS/SOL contributed 7155 HA individ- components > 5 standard deviations [38] from applicable
uals (Illumina Omni 2.5; phg000663.v1). 1000 Genomes and Human Genome Diversity Project
super-populations were excluded. We used a two-stage
Phenotype and covariate definitions procedure to rank-normalize the phenotypes adjusted
We examined several SDB measures, including specific for covariates [39]. Cryptic relatedness and population
measures of OSA: AHI (number of apneas plus hypop- substructure were controlled for using linear mixed
neas per hour of sleep, with a minimum 3% desaturation models. Genomic control was applied to population-
per event) and average oxyhemoglobin desaturation per specific results (or cohort-specific imputed genotype
apnea or hypopnea, and measures of SDB severity [14]: results).
average and minimum SpO2 and the percentage of the
night with SpO2 < 90% (Per90). Apart from WASHS, all WGS and genotyping
sleep data were scored by blinded scorers at one central Sequence data were derived from the TOPMed Freeze
Sleep Reading Center with high levels of scorer reliability 6a release, jointly called by the TOPMed Informatics Re-
using well-defined procedures [35]. The AHI reflected search Center at the University of Michigan (http://
all events. We did not attempt to disentangle the apnea- github.com/statgen/topmed_variant_calling). The meth-
hypopnea index from central versus obstructive sleep odology was described elsewhere [12]. In brief, WGSCade et al. Genome Medicine (2021) 13:136 Page 5 of 17
was performed at the Broad Institute (ARIC, FHS, order to test a gene using its most biologically plausible
MESA), Baylor College of Medicine (ARIC, CHS, variants. Variants could have a maximum minor allele
HCHS/SOL), and the University of Washington (CFS, frequency of 5%. Regions were largely exon-based. We
JHS). Additional ARIC and HCHS/SOL WGS funded by also included variants located within experimentally de-
CCDG (https://www.genome.gov/27563570) and per- rived promoter regions and Ensembl-derived Tarbase
formed at Baylor College of Medicine were included in miRNA binding sites; and regulatory variants located
the jointly called data. TOPMed and CCDG calling pipe- within 1000 bases of a particular gene, including ChIP-
lines have functionally equivalent outcomes despite data seq determined transcription factor binding sites (TFBS),
processing differences (as detailed in [40]). WGS data and Ensembl-derived CTCF, TFBS, and promoter sites
were merged and normalized; inferred sequence contam- [43–45]. Variants from a subset of 19 snpEff gene-based
ination was identified; and SNPs and small indels were annotation functional classes (e.g., missense or nonsense,
detected (structural variants are not currently available). but not synonymous mutations) were considered. Fi-
Lower quality variants were excluded using Mendelian nally, group set variants passing these prior filters were
consistency checks. Variants were aligned to Build 38 additionally filtered for the plausibility of biological
and annotated using snpEff 4.3 t [41]. We excluded vari- function by requiring either a FATHMM-XF score > 0.5
ants with < 10× depth or > 5% missingness, leaving or a CDTS < 1% constrained region score [46, 47]. Ex-
152.7 million polymorphic variants in 7988 individuals onic variants could alternatively have a PrimateAI score
with SDB phenotypes. Up to 22,030,888 variants from > 0.803 or a Havrilla et al. < 1% constrained coding re-
individuals with sequencing were tested in the GWAS gion score [48, 49].
analyses, following filtering for quality control and minor Gene-based tests considered variants in WGS-only
allele frequencies. data. Pooled (across cohort) analyses were performed
Genotype data were imputed using the TOPMed Im- within each population in order to aggregate information
putation Server [13] using a Freeze 5b (Build 38) tem- on very rare variants across studies. Combined
plate. Forward strand checks were performed using the population results were obtained through meta-analysis
Strand database and the Haplotype Reference Consor- of p-values weighted by sample size (due to potentially
tium imputation preparation script (https://www.well.ox. different MAF spectra driven by population demog-
ac.uk/~wrayner/tools/) and confirmed using Ensembl raphy). A significance level of p < 4.51 × 10⁻⁸ was used,
variant allele checks and internal QC performed on the reflecting a Bonferroni adjustment for all genes tested
server. Study-level data were imputed separately. Ana- across all phenotype and population configurations.
lyses on variants with r2 score > 0.5 were therefore A second set-based analysis was designed to query for
performed separately for each study. Up to 22,105,437 TFBS annotation enrichment [50]. We performed 250-
variants from individuals with imputed data were tested base pair sliding window analyses (to improve power by
in the GWAS analyses, following filtering for quality aggregating additional variants beyond an approximate
control, imputation r2, and minor allele frequencies. ChIP-seq peak width of 100 base pairs). We filtered for
variants with either a FATHMM-XF score > 0.5 or a
Statistical analyses CDTS 1% score with no MAF cut-offs and meta-
Single and grouped variant analyses were performed analyzed MMSKAT results across the 4 populations,
using EMMAX and MMSKAT, both within the EPAC noting windows with p-values < 0.01. These intervals
TS suite (v3.3) [42]. WGS genetic relatedness matrices were tested for enrichment of ChIP-seq coordinates with
(GRM) were constructed using autosomal variants (MAF at least 50% physical overlap for up to 437 transcription
> 0.1%) following a comparison of EPACTS point-wise factors using ReMap 2018 v1.2 [51].
heritability estimates of the AHI using different minimal Single-variant EMMAX tests examined common vari-
MAFs. A grid search identified optimal GRM parameters ants (MAF > 0.5%). Meta-analysis across populations
with imputed data (MAF > 0.5%, r2 > 0.90) using 929 (and imputed genotype studies) used METAL with gen-
ARIC individuals with imputation and WGS data. Log10 omic control [52]. We performed bidirectional discovery
P-values using identical association test parameters had and replication using the WGS and imputed samples
a Spearman’s ρ correlation of 0.951 between WGS and (noting the high genomic resolution in the WGS sam-
imputed data. Matrices were constructed separately for ples and the higher sample size in the imputed data).
each study + population combination (due to potentially We report results including at least 1000 individuals in
differential imputation coverage). discovery analyses, discovery association p-values < 1 ×
Gene-based group sets considered Ensembl-defined 10−5 and replication association p-values < 0.05.
non-pseudogenes expressed in any GTEx v7 tissue. Vari- Therefore, no population-specific discovery analyses of
ants needed to clear a series of frequency, regional, func- Asian-Americans were performed. Multi-ethnic analyses
tional class, and presumed functionality score filters in included a minimum of two populations where a variantCade et al. Genome Medicine (2021) 13:136 Page 6 of 17
cleared minimum MAF and imputation quality (for event desaturation in a multiple-population analysis
chip-based results) criteria. Significance was defined as p (combined p = 1.57 × 10⁻⁹) and minimum SpO2 (con-
< 1 × 10⁻⁸ in joint analyses, reflecting adjustment for five sistent with a previous report [10]). Two novel
correlated phenotypes (Additional file 1: Table S3). We population-specific loci were identified. The 8p12 locus
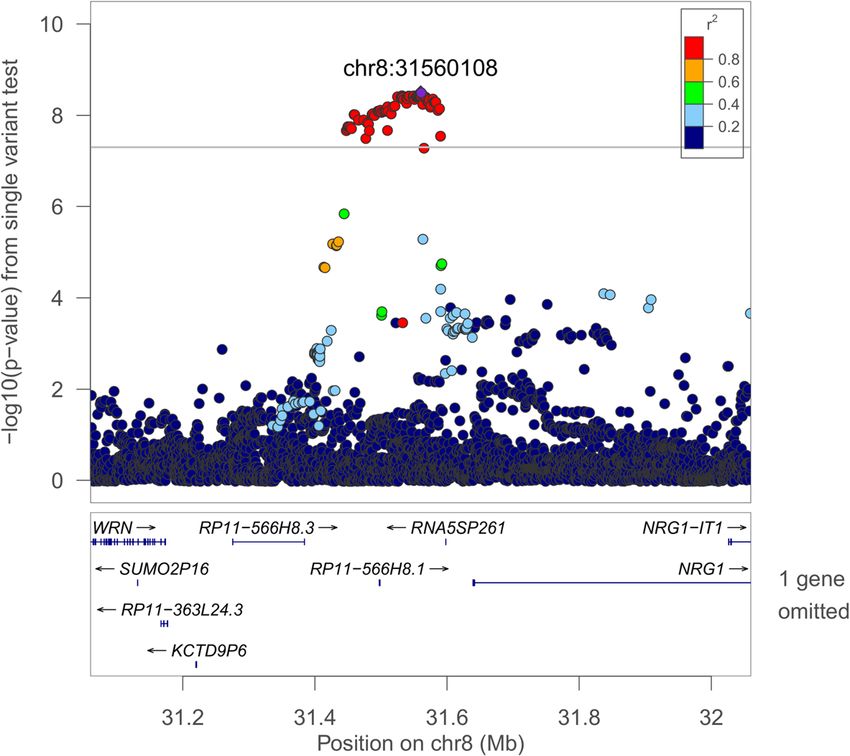
performed MetaXcan imputed GTEx gene expression (rs35447033, NRG1) was associated with AHI in EAs
analyses using joint EA results in selected tissues rele- (combined p = 3.02 × 10⁻⁹, Fig. 1). The 5p13 locus
vant to SDB and GIGSEA pathway analyses of MetaXcan (rs28777; SLC45A2) was associated with average SpO2 in
output in whole blood (to maximize power), with empir- EAs (combined p = 8.08 × 10⁻¹⁰, Fig. 2). In HAs, the
ical p-values incorporating 10,000 permutations [53, 54]. 1q32 locus (rs116133558; ATP2B4) was associated with
Bioinformatics annotations of single-variant results (Add- Per90 (combined p = 3.51 × 10⁻¹⁰) and with average
itional file 1: Table S7) include significant eQTL associa- SpO2 (as previously identified [9]). Twelve additional re-
tions from GTEx v7, and overlapping promoter and gions were suggestively associated (p < 1.0 × 10⁻⁷). Add-
enhancer coordinates derived from Roadmap Epige- itional file 1: Table S7 provides additional context for all
nomics, BLUEPRINT, and Vermunt et al. brain tissues variants in these loci (p < 1.0 × 10⁻⁷), including imput-
(enhancers only) [55–58]. Lookups of potentially drug- ation quality, significant eQTLs, and overlap with epi-
gable genes as defined within DGIdb, a database of 56,000 genetic regions. Lookups of loci that we have identified
drug-gene interactions from over 30 literature sources, in prior publications [9–11] are provided in Additional
were performed using the GeneCards suite [59, 60]. file 1: Table S8. Manhattan and QQ plots corresponding
to the significant associations are provided in Additional
Results file 2: Figures S2–S5. GWAS summary statistics have
Study sample been posted to the Broad Institute Sleep Disorders Re-
A study overview is provided in Additional file 2: Figure search Portal (https://sleep.hugeamp.org/).
S1. Tables 1 and 2 provide a summary of the study sam-
ples and SDB traits analyzed using WGS and imputed ge- MetaXcan imputed gene expression and GIGSEA pathway
notypes, respectively. In total, there were 21,244 analyses
individuals (1942 AAs, 229 AsAs, 8341 EAs, and 10732 We used joint WGS and imputed EA results to impute
HAs). Median AHI levels ranged from mildly to moder- associations with gene expression levels using a MetaX-
ately elevated, reflecting the age range and sex distribution can framework for six tissues (subcutaneous and visceral
of each cohort. Pairwise correlations of phenotypes and omentum adipose, lung, monocytes, skeletal muscle, and
covariates are provided in Additional file 1: Table S3. whole blood). No individual tests reached Bonferroni
significance (p < 2.60 × 10⁻⁷; Additional file 1: Table S9).
Gene-based results Genes that were observed in the top 10 results across
Gene-based rare-variant results are presented in Table 3 the varied analyses (Additional file 1: Table S10) in-
(for meta-analyzed results across multiple populations) cluded ZNF83 (15 instances) and CHRNE (13 instances).
and in Table 4 (for secondary population-specific re- Whole blood MetaXcan results (with the largest sample
sults). Collectively, we identified four significantly associ- size) were further evaluated in GIGSEA-based pathway
ated genes (Bonferroni p < 4.51 × 10⁻⁸). ARMCX3, analyses. KEGG pathway results are shown in Additional
identified in the multiple-population analysis, is an X- file 1: Table S11. The most significantly associated path-
linked protein-coding that was associated with average way was KEGG_STEROID_HORMONE_BIOSYNTHESIS
desaturation (p = 5.29 × 10⁻⁸). Two protein-coding (average SpO2 empirical p-value = 7.00 × 10⁻⁴). KEGG_
genes were identified in population-specific analyses of RIG_I_LIKE_RECEPTOR_SIGNALING_PATHWAY was
Per90: MRPS33 (p = 1.22 × 10⁻⁹) and C16orf90 (p = 1.36 observed in the top 10 results for four of the five pheno-
× 10−8). We identified 12 suggestively associated genes types. Gene-centric transcription factor binding site
(p ≤ 4.22 × 10⁻⁷). Three genes are druggable [59, 60]. (TFBS) enrichment analysis results are presented in Add-
Nominally significant results (p < 0.01) and additional itional file 1: Table S12. V$PEA3_Q6 (ETV4) was the most
details are presented in Additional file 1: Tables S4 and significantly associated TFBS (average desaturation empir-
S5. A list of individual variants comprising each gene is ical p-value = 3.00 × 10⁻⁴) and was the strongest associ-
provided in Additional file 1: Table S6. ation for AHI and minimum SpO2 (empirical p-values
0.002 and 0.001, respectively). The most significant
Single-variant results miRNA binding site enrichment analysis association was
We identified four genome-level significant loci in GCATTTG,MIR-105 (average SpO2 p = 0.002; Additional
single-variant analyses (MAF > 0.5%; p < 1.0 × 10⁻⁸; file 1: Table S13). AGGCACT,MIR-515-3P (the strongest
Table 5). In multiple-population analyses, the 2q12 locus AHI association, p = 0.009) was observed in the top ten
(rs77375846; IL18RAP) was associated with average results for four phenotypes.Cade et al. Genome Medicine (2021) 13:136 Page 7 of 17
Table 3 Lead gene-based multiple-population results
Phenotype Sex Gene B38 positions P N Variants Population P Population N Population
variants
Avg All ARMCX3 X:101,623,082– 3.48 × 10⁻⁸ 5222 41 0.220, 0.179, 2.17 × 10⁻⁶, 8.93 × 10⁻⁴ 1545; 227; 2994; 456 8, 5, 24, 9
desaturation 101,625,765
All ARMCX3-AS1 X:101,623,082– 3.49 × 10⁻⁸ 5222 38 0.225, 0.179, 2.19 × 10⁻⁶, 8.20 × 10⁻⁴ 1545; 227; 2994; 456 7, 5, 23, 8
101,625,153
Per90 All OR5K2 3:98,497,633– 2.55 × 10⁻⁷ 7986 7 0.143, 0.440, 4.14 × 10⁻², 2.74 × 10⁻⁷ 1712; 229; 3,242; 2803 4, 2, 1, 1
98,498,634
Per90 Females ZZEF1 17:4,004,409– 4.22 × 10⁻⁷ 4485 236 0.634, 0.337, 5.03 × 10⁻⁴, 3.05 × 10⁻⁵ 1009; 114; 1702; 1660 85, 16, 87, 131
4,144,018
Lead MMSKAT gene-based results meta-analyzed across populations within one order of magnitude of significance (p < 4.51 × 10⁻⁸) are shown. Population-
specific information for each gene is displayed in the latter columns for AA, AsA, EA, and HA, respectively. Individual populations varied in the number of
polymorphic variants available for testing (e.g., due to singletons or excessively common variants). ARMCX3-AS1 is a RNA gene that is anti-sense to the protein-
coding ARMCX3 gene. Full results for genes with p < 0.01, including Ensembl-derived gene biotypes and descriptions, are provided in Additional file 1: Table S4. A
list of individual variants comprising each gene is provided in Additional file 1: Table S6
ChIP-seq transcription factor binding site interval molecular pathways, including those that may be “drug-
enrichment gable.” Recent analyses of SDB traits have focused on com-
We performed a sliding window analysis to examine mon variants and identified several preliminary genome-
enriched intervals containing ChIP-seq derived coordi- level significant associations [9–11], but did not address
nates for up to 437 transcription factors (Table 6, Add- gene-based or rare-variant effects. Ten studies and over 21,
itional file 1: Table S14). FOXP2 TFBS were consistently 000 individuals of multiple ancestries with WGS data at un-
the most enriched for all phenotypes. Other notable precedented resolution from the NHLBI TOPMed program
transcription factors in the top 5 included EGR1, combined with densely imputed data from other sources
KDM4B, KDM6B, and TP63. KDM4B and KDM6B are contributed to these results. We identified several variant,
druggable [59, 60]. Leading sliding window results are gene-based, and pathway-level associations. Analyses ad-
provided in Additional file 1: Table S15. justed for obesity, a major SDB risk factor, identified loci
and genes implicated in pulmonary, inflammatory, and cra-
Discussion niofacial pathways. Some associations were population-
Sleep-disordered breathing is associated with increased risk specific, while others were sex-specific, consistent with
of a wide range of disorders, including cardiometabolic dis- population differences and strong sex differences for SDB
ease, cancer, cognitive impairment, and interstitial lung dis- [20, 62]. Notably, across multiple ancestral groups, we
eases, as well as premature mortality [2, 61]. Treatment identified a set-based rare-variant association (p = 3.48 ×
options, however, are limited by a lack of knowledge of 10−8) on chromosome X with ARMCX3.
Table 4 Lead gene-based population-specific results
Phenotype Model Gene B38 positions N Variants Singletons P
Per90 HA LINC01277 6:142,985,371–143,010,415 2803 2 0 5.02 × 10⁻⁸
OR5K2 3:98,497,633–98,498,634 2803 1 0 2.74 × 10⁻⁷
AA females S100A16* 1:153,607,528–153,616,353 1009 1 1 2.07 × 10⁻⁷
CSMD2-AS1 1:33,867,977–33,885,456 1009 1 1 2.07 × 10⁻⁷
EA females MRPS33 7:141,006,422–141,014,911 1702 9 8 1.22 × 10⁻⁹
LINC01811 3:34,170,921–34,558,474 1702 6 5 9.71 × 10⁻⁸
NELFCD* 20:58,980,722–58,995,761 1702 12 10 3.32 × 10⁻⁷
SLC22A8* 11:62,988,399–63,015,986 1702 3 3 3.58 × 10⁻⁷
HA females AL132709.1 14:101,077,452–101,077,578 1660 2 0 1.41 × 10−7
EPHX4 1:92,029,443–92,063,474 1660 12 10 3.48 × 10⁻⁷
HA males C16orf90 16:3,493,483–3,496,479 1143 6 3 1.36 × 10⁻⁸
TVP23B 17:18,781,270–18,806,714 1143 4 4 2.53 × 10⁻⁷
IPCEF1 6:154,154,536–154,356,890 1143 10 8 4.07 × 10⁻⁷
−8
Lead MMSKAT gene-based population-specific associations within one order of magnitude of significance (p < 4.51 × 10 ) are shown. The Variants column
indicates the number of filtered polymorphic variants with minor allele frequency < 5% available for testing, a portion of which were singletons. *Druggable gene
[59, 60]. Full results for genes with p < 0.01, including descriptions, are provided in Additional file 1: Table S5. A list of individual variants comprising each gene is
provided in Additional file 1: Table S6Cade et al. Genome Medicine
Table 5 Lead single-variant analysis results
Region Phenotype Model SNP WGS/Chip N CAF WGS beta (SE) WGS P Chip beta (SE) Chip P Combined beta (SE) Combined P
2q12.1: IL18RAP Avg desaturation All rs77375846 C 4995, 4838 0.028–0.129 −0.152 (0.049) 1.87 × 10⁻³ −0.264 (0.049) 5.97 × 10⁻⁸ −0.208 (0.035) 1.57 × 10⁻⁹
2q33.3: PPIAP68 Avg desaturation All rs60132122 T 5222, 4838 0.308–0.637 0.062 (0.031) 0.043 0.195 (0.034) 6.26 × 10⁻⁹ 0.122 (0.023) 6.49 × 10⁻⁸
11q12.2: MS4A15 Avg SpO2 All rs4939452 C 7929, 13197 0.347–0.524 0.066 (0.023) 4.34 × 10⁻³ 0.063 (0.014) 3.29 × 10⁻⁶ 0.064 (0.012) 4.87 × 10⁻⁸
(2021) 13:136
−3 −6
18q12.3: LINC00907 Avg SpO2 All rs187860354 G 4500, 7391 0.006–0.022 0.442 (0.146) 2.36 × 10 0.432 (0.097) 8.53 × 10 0.436 (0.081) 7.04 × 10⁻⁸
−3 −7
2q12.1: IL18RAP Min SpO2 All rs138895820 G 7705, 13194 0.025–0.131 0.510 (0.184) 5.58 × 10 0.654 (0.128) 3.36 × 10 0.607 (0.105) 7.93 × 10⁻⁹
−6 −4
10p12.31: NEBL Min SpO2 Females rs11453507 CA 4450, 6202 0.138–0.514 0.651 (0.140) 3.34 × 10 0.338 (0.102) 8.63 × 10 0.446 (0.082) 5.73 × 10⁻⁸
12q21.2: LINC024064 Min SpO2 Females rs2176909 T 4450, 6202 0.724–0.930 0.828 (0.157) 1.38 × 10⁻⁷ 0.319 (0.116) 5.77 × 10⁻³ 0.498 (0.093) 9.06 × 10⁻⁸
−2 −7
5p13.3: C5orf22 AHI Males rs10940956 A 3502, 7043 0.470–0.759 0.930 (0.422) 2.74 × 10 1.430 (0.269) 1.09 × 10 1.285 (0.227) 1.48 × 10⁻⁸
−7 −3
9p22.1: DENND4C AHI AA rs111654000 A 1717, 225 0.016–0.018 −11.240 (2.268) 7.18 × 10 −18.110 (6.724) 7.07 × 10 −11.942 (2.149) 2.74 × 10⁻⁸
−6 −3
1q31.2: AL954650.1 AHI AA chr1:191965014_G/A A 1717, 225 0.286–0.301 3.078 (0.641) 1.56 × 10 5.080 (1.759) 3.88 × 10 3.313 (0.602) 3.75 × 10⁻⁸
8p12: AC068672.1, NRG1 AHI EA rs35447033 T 3246, 5095 0.060–0.094 2.247 (0.621) 2.95 × 10⁻⁴ 2.453 (0.521) 2.54 × 10⁻⁶ 2.368 (0.399) 3.02 × 10⁻⁹
−5 −6
5p13.2: SLC45A2 Avg SpO2 EA rs28777 A 3201, 5024 0.885–0.969 −0.526 (0.133) 8.00 × 10 −0.454 (0.096) 2.23 × 10 −0.478 (0.078) 8.08 × 10⁻¹⁰
−3 −6
1q32.1: ATP2B4 Avg SpO2 HA rs116133558 T 2803, 7956 0.006–0.014 0.371 (0.120) 2.08 × 10 0.294 (0.062) 2.15 × 10 0.310 (0.055) 1.88 × 10⁻⁸
−2 −6
1q23.3: intergenic (RNU6-755P) Min SpO2 HA rs140743827 A 2803, 7174 0.017–0.020 −1.502 (0.593) 1.13 × 10 −1.770 (0.367) 1.42 × 10 −1.696 (0.312) 5.51 × 10⁻⁸
1q32.1: ATP2B4 Per90 HA rs116133558 T 2803, 7956 0.006–0.014 −1.005 (0.450) 2.54 × 10⁻² −1.218 (0.207) 4.15 × 10⁻⁹ −1.181 (0.188) 3.51 × 10⁻¹⁰
−3 −6
11p11.2: intergenic (AC104010.1) Avg SpO2 HA males chr11:44652095_TC/T T 1143, 3024 0.007–0.008 0.686 (0.248) 5.65 × 10 0.710 (0.154) 3.83 × 10 0.703 (0.131) 7.25 × 10⁻⁸
−3 −6
10q22.1:HK1 Min SpO2 EA males rs17476364 C 1523, 3650 0.072–0.115 1.215 (0.392) 1.94 × 10 1.099 (0.235) 2.81 × 10 1.129 (0.201) 2.01 × 10⁻⁸
−4 −6
8q23.2: KCNV1 Min SpO2 EA males rs58365105 A 1523, 3650 0.007–0.026 −2.878 (0.864) 8.65 × 10 −2.406 (0.540) 8.36 × 10 −2.539 (0.458) 2.96 × 10⁻⁸
2q35: AC019211.1 Per90 EA males chr2:220369683_G/A A 1540, 187 0.005–0.006 12.280 (2.431) 4.38 × 10⁻⁷ 17.505 (7.989) 2.85 × 10⁻² 12.723 (2.326) 4.48 × 10⁻⁸
−8
Lead EMMAX single-variant associations within one order of magnitude of significance (combined p < 1.00 × 10 ) and with replication evidence (p < 0.05) are shown. Full results for all variants in each locus with p <
1.00 × 10⁻⁷, including additional associations with secondary models, and metadata and annotations, are provided in Additional file 1: Table S7
Page 8 of 17Cade et al. Genome Medicine (2021) 13:136 Page 9 of 17 Fig. 1 Regional plot of the rs35447033 association with AHI in European-ancestry individuals. Joint WGS and imputed results are shown, using Build 38 coordinates on the X-axis. Log-transformed p-values are shown on the Y-axis. Variant colors indicate the degree of linkage disequilibrium with the lead variant rs35447033 Fig. 2 Regional plot of the rs28777 association with average SpO2 in European-ancestry individuals. Joint WGS and imputed results are shown, using Build 38 coordinates on the X-axis. Log-transformed p-values are shown on the Y-axis. Variant colors indicate the degree of linkage disequilibrium with the lead variant rs28777
Cade et al. Genome Medicine           (2021) 13:136                                                                                               Page 10 of 17

Table 6 Transcription factor binding site interval enrichment results
Phenotype                          Transcription factor                # Observed overlap                  # Expected overlap                  −log10 (E-value)
AHI                                FOXP2                               588                                 36.20                               473.99
                                   KDM6B                               630                                 51.58                               435.29
                                   THAP1                               505                                 31.89                               402.07
                                   KLF9                                745                                 91.81                               395.52
                                   TP63                                997                                 182.22                              383.85
Average desaturation               FOXP2                               493                                 22.32                               460.00
                                   THAP1                               439                                 19.55                               412.76
                                   UBTF                                489                                 28.20                               407.50
                                   TP63                                788                                 109.36                              382.89
                                   KDM6B                               482                                 30.98                               380.39
Average SpO2                       FOXP2                               582                                 35.87                               468.89
                                   KDM6B                               613                                 51.21                               418.65
                                   EGR1                                664                                 66.76                               404.83
                                   UBTF                                574                                 46.35                               399.91
                                   KDM4B                               489                                 29.56                               398.10
Min SpO2                           FOXP2                               561                                 35.57                               445.57
                                   THAP1                               515                                 31.32                               417.89
                                   KDM6B                               569                                 50.87                               373.41
                                   UBTF                                536                                 45.99                               360.56
                                   EGR1                                602                                 66.25                               346.03
Per90                              FOXP2                               689                                 39.05                               578.42
                                   KDM6B                               739                                 54.79                               539.69
                                   TP63                                1199                                193.28                              515.44
                                   THAP1                               607                                 34.47                               509.33
                                   EGR1                                786                                 72.09                               507.27
Two-hundred-fifty-base pair sliding window coordinates with association p < 0.01 were queried for interval enrichment of ChIP-seq-derived transcription factor
binding sites using the ReMap annotation tool. ChIP-seq coordinates were required to have >50% overlap with a sliding window interval. ReMap-derived
expected overlaps are obtained from the equivalent number of similarly sized random regions. E-value indicates the expected value, with a higher log-
transformed value indicating greater enrichment. Full results are provided in Additional file 1: Table S14

Gene-based results                                                                 ROS are required for intermittent hypoxia-induced re-
Across multiple populations, ARMCX3 (ALEX3) and the                                spiratory long-term facilitation [70]. These effects may
RNA anti-sense gene ARMCX3-AS1 were associated                                     mitigate the level of hypoxia resulting from recurrent ap-
with apnea-hypopnea triggered intermittent hypoxia.                                neas, or conversely, lead to ventilatory instability, pro-
ARMCX3 regulates mitochondrial aggregation and traf-                               moting apnea occurrence. Mitochondrial ROS also
ficking in multiple tissues and facilitates neuronal sur-                          activate the NLRP3 inflammasome in multiple pulmon-
vival and axon regeneration [63–65]. Wnt signaling                                 ary diseases, consistent with an inflammation model that
regulates reactive oxygen species (ROS) generation and                             includes our IL18-pathway and HK1 results, ROS-
ARMCX3-associated mitochondrial aggregation [64, 66].                              related proinflammatory responses to lung capillary
Potential mechanisms for further study include sensi-                              pressure, and evidence of alveolar epithelial injury/SDB
tized carotid body chemoreflexes, interaction with in-                             interactions [10, 69, 71–73]. Our findings suggest value
flammatory mechanisms, and neuronal dysfunction                                    in investigating the mechanisms by which ARMCX3 pre-
within respiratory centers. Sleep apnea and reduced ven-                           disposes to SDB, and whether these associations are me-
tilatory drive are enriched in individuals with a primary                          diated by neuronal dysfunction and/or ROS and carotid
mitochondrial disorder [67]. Mitochondria are an im-                               body sensitization, and interact with the inflammasome.
portant source of ROS, which modulate the acute hyp-                                 Additional genes were significantly associated in
oxic ventilatory response. Mitochondria impact HIF1A                               population-specific analyses, including the mitochondrial
signaling and may contribute to oxygen sensing [68, 69].                           ribosomal gene MRPS33. Mitoribosomes are responsible
Cade et al. Genome Medicine (2021) 13:136 Page 11 of 17
for the expression of the 13 essential components of the the importance of biological pathways modulating energy
oxidative phosphorylation system, and a majority of the homeostasis and balance and metabolic function [87]. In
small subunit proteins have been implicated in disease [74]. the gene-centric GIGSEA TFBS analysis, V$PEA3_Q6
The expression of several small and large subunit proteins (ETV4) was the lead association for three phenotypes.
are altered in a hypoxic environment [75]. MRPS33 expres- ETV4 influences branching in the developing lung and
sion varies with oxygen treatment in COPD [76]. regulates hypoxia-inducible factor signaling [88, 89], a
major mechanism influencing ventilatory control.
Single-variant results
We identified four common frequency associated loci, Transcription factor binding site enrichment
including multiple-population associations with the Several transcription factors were identified through inter-
IL18RAP region. The IL18RAP region has been associ- val enrichment of observed TFBS across the genome (Table
ated with minimum SpO2 [10], and here we further 6). FOXP2 was consistently the most enriched transcription
identify an association with average event desaturation, factor and is known to regulate gene expression in epithelial
highlighting a role in an OSA-specific trait. Multiple var- lung tissue and response to lung injury through an inflam-
iants in this region are also GTEx eQTL variants for matory mechanism [90, 91]. FOXP2 is also expressed in
both interleukin-18 receptor subunits IL18RAP and brainstem respiratory areas including the pre-Bötzinger
IL18R1 (Additional file 1: Table S7) and experimental complex (which is essential for respiratory rhythmogenesis)
studies support a role for IL18 signaling in mediating and impacts airway morphology [92, 93]. Two lysine
this association, possibly through effects of pulmonary demethylases (KDM4B and KDM6B) were also identified.
inflammation on gas exchange (reviewed in [10]). KDM6B (JMJD3) is required for a functional pre-Bötzinger
We identified three population-specific loci, including complex [94, 95] and reduced KDM6B protein expression
two novel associations in individuals of European ancestry was reported in hypoxic OSA patients [96]. Kdm6b also
(Figs. 1 and 2). Sixty-five variants in the NRG1 region were plays roles in immune function and lung development [97–
associated with the AHI (p < 1.0 × 10⁻⁸, Additional file 1: 99]. Drosophila Kdm4b knock-outs have increased sleep
Table S7). This region was suggestively associated with [100]. KDM4B (JMJD2B) and KDM6B are both members
sleep apnea in a Korean population [77]; however, the lead of the JmjC protein domain family and are regulated by
signals appear to be independent (rs10097555 Korean p = HIF1A, require oxygen as a cofactor, and act as oxygen sen-
2.6 × 10⁻⁶, EA p = 0.91). NRG1 is associated with lung sors for chromatin in hypoxia [101, 102]. EGR1 mediates
development and acute lung injury and mediates hypoxia-induced pulmonary fibrosis [103]. TP63 is associ-
inflammasome-induced alveolar cell permeability [78–80]. ated with cleft palate in Tp63 deficient mice, which is asso-
NRG1 promotes accumulation of HIF1A and has increased ciated with an increased prevalence of OSA [104, 105],
expression in vascular smooth muscle cells following expos- suggesting that its relationship to OSA may be through
ure to intermittent hypoxia [81, 82]. The lead SLC45A2 re- pathways influencing craniofacial development. Among the
gion variant rs28777 (average SpO2 p = 8.08 × 10⁻¹⁰) has leading 250-base pair sliding window results (Additional file
been associated with multiple traits and is in a splicing 1: Table S15), 4:105708751-105709001 (Per90 HA p = 2.72
regulatory element with extreme population differentiation × 10−9) is of note due to regional associations with lung
[83]. An association in the ATP2B4 region with average function and expression in the human lung [106].
SpO2 in HAs [9] has been extended to a second hypoxemia
trait at the same variant (Per90 p = 3.31 × 10⁻¹⁰). This gene Strengths and weaknesses
is the main cellular membrane calcium pump in erythro- This study is the first genome-wide analysis of objectively
cytes and also regulates vascular tone [84, 85]. measured SDB traits using deep sequencing. Together
with improved imputation quality, the TOPMed resource
Pathway analyses has enabled unprecedented genetic resolution. We exam-
Several gene pathways were identified in EA individuals ined clinically relevant phenotypes measured using rigor-
using imputed gene expression in whole blood (Additional ous methodology [2, 14]. We analyzed data from 10
file 1: Table S11). KEGG_RIG_I_LIKE_RECEPTOR_SIG- studies of individuals from four population groups that
NALING_PATHWAY (retinoic acid-inducible gene I- used different ascertainment strategies, which may poten-
like) was the most commonly observed, occurring in the tially improve the generalization of our results. While this
top 10 results for 4 of the 5 phenotypes. This pathway ini- analysis is among the largest performed for SDB traits to
tiates the immune response to RNA virus infection [86], date, our moderate sample size has lower power to detect
consistent with a role for inflammation at the NRG1 and weaker associations, and data were not available to repli-
IL18RAP loci. Steroid hormone biosynthesis (the most sig- cate these first rare-variant associations. We did not spe-
nificantly associated pathway), PPAR signaling, and me- cifically study the central apnea-hypopnea index due to
tabolism (via “starch and sucrose metabolism”) suggest the relatively low prevalence of central sleep apnea (< 2%)Cade et al. Genome Medicine (2021) 13:136 Page 12 of 17
in these largely community-based studies [36, 37]. While 70-year history continue to contribute so much to further our knowledge of
there are multiple lines of evidence in the literature to heart, lung, blood, and sleep disorders and associated traits. The authors
thank the staff and participants of HCHS/SOL for their important contribu-
support our findings, additional experimental follow-up tions. The views expressed in this manuscript are those of the authors and
analyses are required. do not necessarily represent the views of the National Heart, Lung, and
Blood Institute; the National Institutes of Health; or the US Department of
Health and Human Services. This manuscript was not approved by the
Conclusions HCHS/SOL publications committee. Investigator’s website—http://www.cscc.
We have identified the first rare-variant and additional unc.edu/hchs/. The authors also wish to thank the staff and participants of
the JHS. We thank the field staff in Starr County for their careful collection of
common-variant associations at genome-level signifi- these data and are especially grateful to the participants who so graciously
cance with objectively measured SDB traits in humans. cooperated and gave of their time.
The results point to biologically relevant pathways for
further study, including a novel X-linked association Authors’ contributions
Conception and design: B.E.C., E.A.B., A.C., L.A.C., R.C.K., K.E.N., B.M.P., J.I.R.,
(ARMCX3), and a number of associations in genes that S.S.R., R.P.T., R.S.V., J.G.W., and S.R. Data acquisition: B.E.C., J.L., T.S., M.Z., H.C.,
modulate lung development, inflammation, respiratory S.A.G., D.J.G., J.M.L., J.L., X.L., H.M., S.R.P., S.M.P., R.S., N.A.S., H.W., X.Z., D.S.E.,
rhythmogenesis, and HIF1A-mediated hypoxic-response C.L.H., D.R.H., S.M., L.J.P., K.L.S., G.J.T., and S.R. Analysis: all authors.
Interpretation, draft and review, and final approval: all authors. B.E.C. and S.R.
pathways. These associations will motivate future sample had full access to the study data and take responsibility for the integrity of
collection and follow-up in cell-line and animal valid- the data and accuracy of analyses.
ation studies, with potential therapeutic benefit for
sleep-disordered breathing and related comorbidities. Funding
Whole-genome sequencing (WGS) for the Trans-Omics in Precision Medicine
(TOPMed) program was supported by the National Heart, Lung, and Blood
Abbreviations
Institute (NHLBI). WGS for “NHLBI TOPMed: Trans-Omics for Precision Medi-
AA: African-American; AsA: Asian-American; BMI: Body mass index;
cine Whole Genome Sequencing Project: ARIC” (phs001211.v1.p1) was per-
CCDG: Centers for Common Disease Genomics; EA: European-American/
formed at Baylor College of Medicine Human Genome Sequencing Center
Australian; GWAS: Genome-wide association study; HA: Hispanic/Latino-
(HHSN268201500015C and 3U54HG003273-12S2) and the Broad Institute of
American; MAF: Minor allele frequency; OSA: Obstructive sleep apnea;
MIT and Harvard (3R01HL092577-06S1). WGS for “NHLBI TOPMed: The Cleve-
Per90: Percent of the sleep recording with oxyhemoglobin saturation < 90%;
land Family Study (WGS)” (phs000954.v2.p1) was performed at the University
ROS: Reactive oxygen species; SDB: Sleep-disordered breathing;
of Washington Northwest Genomics Center (3R01HL098433-05S1). WGS for
SpO2: Oxyhemoglobin saturation; TFBS: Transcription factor binding site;
“NHLBI TOPMed: Cardiovascular Health Study” (phs001368.v1.p1) was per-
TOPMed: Trans-Omics for Precision Medicine; WGS: Whole-genome
formed at Baylor College of Medicine Human Genome Sequencing Center
sequencing
(HHSN268201500015C). WGS for “NHLBI TOPMed: Whole Genome Sequen-
cing and Related Phenotypes in the Framingham Heart Study”
Supplementary Information (phs000974.v3.p2) was performed at the Broad Institute of MIT and Harvard
The online version contains supplementary material available at https://doi. (3R01HL092577-06S1). WGS for “NHLBI TOPMed: Hispanic Community Health
org/10.1186/s13073-021-00917-8. Study/Study of Latinos (HCHS/SOL)” (phs001395) was performed at the Bay-
lor College of Medicine Human Genome Sequencing Center
(HHSN268201500015C and 3U54HG003273-12S2). WGS for “NHLBI TOPMed:
Additional file 1: Table S1. NHLBI TOPMed Consortium. Table S2. The Jackson Heart Study” (phs000964.v3.p1) was performed at the University
NHLBI TOPMed Consortium Sleep Working Group. Table S3. Pairwise of Washington Northwest Genomics Center (HHSN268201100037C). WGS for
Phenotype and Covariate Correlations. Table S4. MMSKAT gene-based “NHLBI TOPMed: NHLBI TOPMed: MESA” (phs001416.v1.p1) was performed at
multiple-population results (p < 0.01). Table S5. MMSKAT gene-based the Broad Institute of MIT and Harvard (3U54HG003067-13S1). Centralized
population-specific results (p < 0.01). Table S6. Lead MMSKAT result vari- read mapping and genotype calling, along with variant quality metrics and
ants. Table S7. Single-variant analysis results for lead loci. Table S8. filtering were provided by the TOPMed Informatics Research Center (3R01HL-
Lookups of previously reported GWAS results. Table S9. MetaXcan im- 117626-02S1). Phenotype harmonization, data management, sample-identity
puted gene expression results. Table S10. Lead genes in multiple MetaX- QC, and general study coordination were provided by the TOPMed Data Co-
can results. Table S11. GIGSEA KEGG pathway results. Table S12. ordinating Center (3R01HL-120393-02S1).
GIGSEA MsigDB transcription factor binding site enrichment results. The Genome Sequencing Program (GSP) was funded by the National Human
Table S13. GIGSEA MsigDB miRNA binding site enrichment results. Genome Research Institute (NHGRI); the National Heart, Lung, and Blood
Table S14. Sliding window analysis transcription factor binding analysis Institute (NHLBI); and the National Eye Institute (NEI). The GSP Coordinating
enrichment. Table S15. Lead sliding window analysis results. Center (U24 HG008956) contributed to cross-program scientific initiatives
Additional file 2: Figure S1. Study Overview. Figure S2. NRG1 Locus and provided logistical and general study coordination. The Centers for Com-
Models Manhattan and QQ Plots. Figure S3. SLC45A2 Locus Models mon Disease Genomics (CCDG) program was supported by NHGRI and
Manhattan and QQ Plots. Figure S4. IL18RAP Locus Models Manhattan NHLBI, and CCDG-funded whole-genome sequencing of the ARIC and
and QQ Plots. Figure S5. ATP2B4 Locus Models Manhattan and QQ HCHS/SOL studies was performed at the Baylor College of Medicine Human
Plots. Genome Sequencing Center (UM1 HG008898 and R01HL059367).
Brian Cade is supported by grants from the National Institutes of Health
[K01-HL135405-01, R01-HL113338-04, R35-HL135818-01] and the American
Acknowledgements Thoracic Society Foundation (http://foundation.thoracic.org). Susan Redline is
We acknowledge our TOPMed Consortium and TOPMed Sleep Traits partially supported by grants from the National Institutes of Health [R35-
Working Group collaborators, who are listed in Additional file 1: Tables S1 HL135818-01, R01-HL113338-04]. Sanjay Patel has had grant support through
and S2. The authors wish to thank the participants and study staff of all of his institution from the ResMed Foundation, the American Sleep Medicine
our cohorts for their important contributions. We gratefully acknowledge the Foundation, Bayer Pharmaceuticals, and Philips Respironics. James Wilson is
studies and participants who provided biological samples and data for supported by U54GM115428 from the National Institute of General Medical
TOPMed. The authors thank the staff and participants of the ARIC study for Sciences.
their important contributions. A full list of principal CHS investigators and The Atherosclerosis Risk in Communities (ARIC) study has been funded in
institutions can be found at CHS-NHLBI.org. The Framingham Heart Study whole or in part with Federal funds from the National Heart, Lung, and
thanks the study participants and the multitude of investigators who over its Blood Institute, National Institutes of Health, Department of Health andYou can also read


